Global fluid fits to identified particle transverse momentum spectra from heavy-ion collisions at the Large Hadron Collider
Abstract
Transverse momentum spectra of identified particles produced in heavy-ion collisions at the Large Hadron Collider are described with relativistic fluid dynamics. We perform a systematic comparison of experimental data for pions, kaons and protons up to a transverse momentum of 3 GeV with calculations using the FluiduM code package to solve the evolution equations of fluid dynamics, the TrENTo model to describe the initial state and the FastReso code to take resonance decays into account. Using data in five centrality classes at the center-of-mass collision energy per nucleon pair , we determine systematically the most likely parameters of our theoretical model including the shear and bulk viscosity to entropy ratios, the initialization time, initial density and freeze-out temperature through a global search and quantify their posterior probability. This is facilitated by the very efficient numerical implementation of FluiduM and FastReso. Based on the most likely model parameters we present predictions for the transverse momentum spectra of multi-strange hadrons as well as identified particle spectra from Pb–Pb collisions at .
1 Introduction
High-energy heavy-ion collisions at the Relativistic Heavy Ion Collider (RHIC) and the Large Hadron Collider (LHC) produce a fluid consisting of quarks and gluons, the fundamental constituents of Quantum Chromodynamics (QCD) Busza:2018rrf ; Aamodt:2010pa ; ADAMS2005102 ; ADCOX2005184 . The produced fluid is particularly interesting because it is described on microscopic level by a renormalizable and fundamental quantum field theory. While first principle calculations of the macroscopic fluid properties are challenging, phenomenological and theoretical studies are motivated by an increasing amount of experimental results. Remarkably, data and models suggest that a fluid dynamic expansion might be behind some of the recent results of collective behaviour in yet smaller proton-nucleus and proton-proton systems Nagle:2018nvi ; PHENIX:2018lia ; Acharya:2019vdf . Alternative descriptions in terms of initial-state physics and medium-less hadron production are also being developed Nagle:2018nvi ; Mace:2018vwq ; Bierlich:2018xfw ; Greif:2017bnr ; Lin:2004en ; Zhou:2015iba , all of which questions the uniqueness of a fluid-like response of the quark-gluon plasma (QGP). Therefore the resolution to the origins of collective behaviour will likely rely on quantitative rather than just qualitative agreement between data and model. To this end, we present a new framework for systematic studies of soft hadronic observables based on up-to-date and efficient modelling of heavy-ion collisions.
We combine the successful initial condition model TrENTo Moreland:2014oya , with the recent viscous relativistic fluid dynamics implementation FluiduM Floerchinger:2018pje and the novel resonance decay procedure FastReso Mazeliauskas:2018irt . The mode splitting implemented in FluiduM allows for a very fast evolution with a single event taking mere seconds to compute. In our work we use an equation of state based on recent Lattice-QCD calculations Borsanyi:2016ksw ; Bazavov:2014pvz , see Floerchinger:2018pje , and include both shear and bulk viscous corrections in the evolution and particle freeze-out. In addition we use an enlarged set of resonance decays Alba:2017mqu ; Alba:2017hhe ; parotto_private based on the 2016 edition of the Particle Data Group book Patrignani:2016xqp .
In the absence of precise first principle calculations, the phenomenological description of heavy-ion collisions has a number of open parameters at different stages of the evolution. They can be estimated indirectly from the comparison of simulations to experimental results. Obviously, a too large number of such parameters can limit the precision of this estimate. Moreover, covering a multi-dimensional parameter space is computationally expensive and requires efficient implementation of the model. In the present work, we determine the specific shear and bulk viscosities of the QGP, as well as the freeze-out temperature , the starting time of a fluid description and the initial entropy profile normalization.
Previous multi-observable model-to-data fits focused on the centrality dependence of momentum integrated quantities, like particle multiplicity, mean transverse momentum or flow harmonics Bernhard:2016tnd . In this work we perform a systematic study of more differential data, namely, transverse momentum spectra with 3 GeV/ of , , and in five centrality classes of Pb–Pb collisions at the center-of-mass energy per nucleon pair at the LHC, and compare them with fluid dynamic simulations.
Let us mention here already that we are able to put interesting and non-trivial constraints on transport properties, specifically shear and bulk viscosity, from the analysis of transverse momentum spectra for identified particles alone. This might come as a surprise to some readers because it was believed so far that significant constraints on transport properties need an analysis of anisotropic flow. While flow coefficients are indeed expected to contain even more detailed information, we want to emphasize that experimental data on transverse momentum spectra are by now of a rather high quality. We can exploit this here and perform a detailed statistical analysis including fits with systematic minimization. We find that rises rather quickly away from the global minimum which leads to surprisingly tight constraints on the QCD fluid properties.
We summarize the details of initial condition, evolution and hadronization procedures in Sec. 2. We discuss the fit procedure and determination of its uncertainties in Sec. 3. We then provide the best fit results and predictions for additional observables in Sec. 4.1 and Sec. 4.2. Finally, we discuss the analysis and future directions in Sec. 5.
2 Setup
In this section we briefly describe the different components of our theoretical model. We start with the time evolution as implemented in FluiduM Floerchinger:2018pje solving the equations of relativistic fluid dynamics with shear and bulk viscosity and corresponding relaxation times. Subsequently we turn to the initial conditions, specifically the shape of the energy density in the transverse plane for which we use the TrENTo model Moreland:2014oya . Finally, kinetic freeze-out and the implementation of strong resonance decays is done using FastReso FastReso .
2.1 Hydrodynamic evolution: FluiduM
To solve the relativistic fluid equations of motion, we use the code package FluiduM Floerchinger:2018pje . It is based on the theoretical framework of relativistic fluid dynamics with mode expansion Floerchinger:2013rya ; Floerchinger:2013hza ; Floerchinger:2014fta , where the fluid dynamic fields are decomposed in terms of a background-fluctuation splitting, similar to what is done for example in cosmology. Schematically, we write the fluid fields . The non-linear evolution equations for an azimuthally and Bjorken boost symmetric background are solved first, while azimuthally and rapidity dependent perturbations around this are then studied separately. The evolution equations for both the background and the perturbations around them can be implemented with very accurate and highly efficient numerical algorithms Floerchinger:2018pje .
For the present paper we are interested in azimuthally averaged transverse momentum spectra of identified particles in the mid-rapidity region and do not consider azimuthally and rapidity-dependent perturbations. Neglecting terms that are of quadratic or higher order in perturbation amplitudes, we need only the background solution to the fluid evolution equations as calculated from FluiduM. The corresponding equations of motion have been analyzed from a mathematical perspective, and with an emphasis on their causality structure in ref. Floerchinger:2017cii .
We note here that the current implementation of FluiduM features a flow at vanishing net baryon number chemical potential, based on a state-of-the-art thermodynamic equation of state Borsanyi:2016ksw ; Bazavov:2014pvz , as well as shear and bulk viscous dissipation. For the present paper we assume the shear viscosity to entropy ratio to be independent of temperature. The bulk viscosity to entropy ratio is taken to be temperature dependent, however. Specifically, we assume it to be of the Lorentzian form
| (1) |
with the peak temperature MeV and MeV Moreland:2018gsh . The maximum value is taken as a fit parameter.
Shear and bulk relaxation times are assumed to be determined by the relations Denicol:2014vaa
| (2) |
where is the energy density, is the pressure, is the (temperature dependent) velocity of sound, and is a small offset such that a causal evolution of the radial expansion is indeed ensured Floerchinger:2017cii . For more details on the implementation we refer to Floerchinger:2018pje .
2.2 Initial conditions: TrENTo
In general terms, a characterization of the initial conditions for Israel-Stewart type fluid dynamics with azimuthal rotation and longitudinal boost symmetry as used for the background in FluiduM consists of the temperature , radial fluid velocity , two independent components of shear stress and as well as bulk viscous pressure on some initial Cauchy surface, such as . In the present work we neglect initial radial flow and assume initially . This choice is respecting relativistic causality Floerchinger:2017cii .
The shape of the initial entropy density distribution in the transverse plane (which determines the temperature through the thermodynamic equation of state) is taken from the initial state model TrENTo Moreland:2014oya , with an overall normalization factor that we take as a fit parameter. The parameters of TrENTo have been taken as in ref. Moreland:2014oya , in particular we selected the reduced thickness parameter , the fluctuation parameter , the nucleon width and the inelastic nucleon-nucleon cross section . Using this set of parameters we have generated the transverse density for events with impact parameter sampled from the range and randomized event plane angle. As usual, the distribution of impact parameters is governed by the random distribution of nuclei in the transverse plane and the probability for them to scatter in the TrENTo model. It is convenient to shift the events in the transverse plane such that .
The integrated transverse density is expected to be monotonously related to the total final charged particle multiplicity, therefore we used this quantity to divide the generated events into narrow multiplicity classes of one percent. Each of these centrality classes can be seen as an ensemble of events with random orientation in the transverse plane.
For each centrality class we calculate the averaged or expected entropy density profile as
| (3) |
(Note that for ensembles with random orientation in the transverse plane the right hand side is independent of .) We introduce here a normalization constant for each centrality class . Ideally, the initial state model should take care of centrality dependence and all centrality classes would have one identical normalization. While the parameter choice in TrENTo comes close to this, we observe some residual tension with the data which we lift by allowing the normalization to be centrality class dependent. We have taken out the initialization time to already take into account the main effect of the longitudinal expansion (Bjorken flow) at early times. The initial temperature as a function of radius is then obtained using the equation of state.
While it is convenient for the theoretical description to work with rather narrow centrality classes, they are typically somewhat larger in the experimental results. There are now two possible strategies to deal with this. The first would be to calculate particle spectra for each of the narrow classes and to combine (average) them in a convenient way afterwards. The second strategy is to produce averaged entropy densities for the larger centrality classes by averaging the corresponding distributions from the more narrow classes and to propagate those. The difference in experimental observables between both procedures can be taken as an estimate for the importance of fluctuations. We have compared both strategies and found the difference for transverse momentum spectra to be rather small, of the order of for central collisions. Because of the advantage with respect to computational costs, we follow therefore the second strategy.
2.3 Freeze-out and resonance decays: FastReso
As the system cools down and dilutes, it crosses from a quark-gluon plasma to a fluid dominated by hadronic degrees of freedom. The fluid dynamic description of the latter breaks down eventually, because particle scatterings are no longer efficient in maintaining (first chemical and then kinetic) equilibrium. This necessitates the conversion of fluid fields, such as temperature and flow velocity, to the distribution of hadronic degrees of freedom.
The dynamics of hadronization is not completely understood, but lattice QCD calculations show that below the QCD pseudo-critical temperature Bazavov:2018mes ; Steinbrecher:2018phh , color neutral hadrons become the dominant degrees of freedom of the plasma. In particular the equation of state approaches that of a hadron resonance gas (HRG) Alba:2017hhe .
Around or somewhat below in temperature, fluid fields are customary converted to particle distributions using Cooper-Frye procedure Cooper:1974mv . The spectrum of hadron species on the freeze-out hypersurface is given by the following integral
| (4) |
where is the degeneracy factor of spin/polarization states and is a particle distribution function, which, in addition to the particle energy in fluid rest-frame , may also depend on the local temperature , fluid velocity , chemical potential , viscous shear-stress and bulk viscous pressure .
Chemical freeze-out takes place when particle species changing interactions are no longer able to keep up with the expansion rate. However, in practice, a simpler criterion based solely on the freeze-out temperature is used and the freeze-out surface is assumed to be a surface of constant temperature. One sometimes includes after chemical freeze-out and before kinetic freeze-out a phase described by fluid dynamics but for a fluid in partial chemical equilibrium (see Bebie:1991ij for pioneering work in this regard). Such a fluid is governed by a number of conservation laws in addition to the ones for energy and momentum. We have implemented this in our theoretical model but found eventually that the improvement of transverse momentum spectra of the studied particles species is not significant. For this reason we use in the present work a simpler prescription with only a single, chemical and kinetic freeze-out.
On the freeze-out surface we take the particle distribution function to be given by the equilibrium Bose-Einstein or Fermi-Dirac distribution (depending on the species), modified by additional corrections due to bulk and shear viscous dissipation,
| (5) |
For the viscous corrections we use the commonly employed parametrizations Teaney:2003kp ; Paquet:2015lta
| (6) | |||
| (7) |
Here is the mass of the primary resonance.
After freeze-out the populations of unstable resonances decrease as a consequence of their decays and feed the spectra of long lived particles. This large modification of the pion, kaon and proton spectra can be calculated by decaying all (sufficiently unstable) resonances. An efficient procedure to calculate these direct decays was recently introduced by some of us in ref. Mazeliauskas:2018irt . The main idea is to apply the decay maps to the primary distributions in Eq. (4) before doing the surface integral. The resulting distribution function of decay products can be decomposed into irreducible components (with respect to rotations in the fluid rest frame) that are pre-computed and stored FastReso . Furthermore, for the case of azimuthally symmetric and boost-invariant surface, the freeze-out integrals over space-time rapidity and azimuthal angle can also be pre-computed. Parametrizing the remaining 1+1 dimensional freeze-out surface in radial coordinates by where is some parameter, the Cooper-Frye freeze-out integral simplifies to one-dimensional integral over ,
| (8) |
Here and are rapidity and azimuthal angle integrated decay kernels Mazeliauskas:2018irt . The kernels have implicit dependence on scalars like freeze-out temperature or decay constants which do not vary on the freeze-out surface. The spectra of pions, kaons and protons as calculated with Eq. (8) can then be compared to the experimentally measured differential spectra of identified hadrons.
For the calculation of freeze-out kernels in Eq. (8), we use the publicly available code FastReso to perform strong and electromagnetic decays of unstable hadrons111The feed-down from weak decays of , and is not included in accordance with experimental procedure. We neglect resonance spectral widths and perform only the allowed 2-body and 3-body decays. up to mass . We use the list of resonances from refs. Alba:2017mqu ; Alba:2017hhe ; parotto_private , which is based on all listed states (also less well established states) in the Particle Data Group 2016 publication Patrignani:2016xqp . This is approximately twice the number of resonances used previously Mazeliauskas:2018irt . To perform a scan in freeze-out temperature, we varied it in the range with increments and zero baryon chemical potential. The transverse momentum (in GeV) and the radial fluid velocity have been discretized each on a 81 point non-linear grid in the range of .
3 Data analysis
3.1 Global fit procedure
To summarize, our theoretical description has currently the free parameters , , the initialization time , the freeze-out temperature and they are assumed to be independent of the centrality class. In addition, we have the normalization constants for the initial entropy profile which depend on the centrality classes. In order to find the most likely model parameters, in this work we aim at fitting the -differential spectra of pions, kaons, and protons in five centrality intervals: 0–5%, 5–10%, 10–20%, 20–30% and 30–40% for Pb–Pb collisions at = 2.76 TeV measured by the ALICE Collaboration Abelev:2013vea . We choose to restrict to the soft particle momentum range , a region which is believed to be described by a fluid dynamic approximation to QCD dynamics. It is sensitive to radial flow, the viscous transport coefficients and the initial conditions of the plasma Gale:2013da ; Bernhard:2016tnd ; Teaney:2009qa ; Dubla:2018czx .
Nine model parameters are left free to vary simultaneously in specific intervals (see Table 1), in which the physical values are expected to be located based on physical considerations and previous work Moreland:2014oya ; Dubla:2018czx ; Ryu:2017qzn . Of course it is important to check a posteriori that the best fit values are indeed inside these intervals and not on its boundary (in the latter case one needs to allow for larger intervals).
| (fm/) | (MeV) | |||
|---|---|---|---|---|
| 50-67 | 0.1-0.6 | 0.08-0.25 | 0.005-0.1 | 130-150 |
In order to determine which combination of the parameters provides the best description of the experimental data we search for the global minimum of
| (9) |
where is the experimental value of the transverse momentum spectrum at some interval for a particular hadron species and centrality class, is the corresponding model prediction (for a given set of model parameters) and is the sum (in quadrature) of the systematic and statistical uncertainties of the corresponding experimental data point. Let us remark here that we do not introduce a global theoretical uncertainty to all data points, as it was done in some previous studies Bernhard:2016tnd ; Bernhard2019 .
The sum in (9) goes over the five centrality classes (0–5%, 5–10%, 10–20%, 20–30% and 30–40%), three particle species () and the number of intervals in the fit range up to 3 GeV/ (, and ). The total number of degrees of freedom is accordingly .
Note that the degree of correlation in the systematic uncertainties as a function of in the experimental measurements is not reported and we do not consider such correlations in the fit.
Furthermore, the simulations themselves might have considerable systematic uncertainties. For example, our model assumes a rather simple freeze-out picture without a detailed modeling of hadronic scatterings and the dissipative corrections to the single-particle distribution functions on the freeze-out surface are arguably somewhat uncertain. Also, our model neglects currently a possible temperature dependence of the shear viscosity to entropy ratio. Independently from this, also completely new physics might affect the experimental data in the low transverse momentum regime, for example pion condensation, see Begun:2015ifa ; Begun:2016cva and references therein. It is hard to predict a priori the change to model results due to such effects but for the interpretation of results it is important to keep in mind that theoretical uncertainties exist.
It remains to find the values of the model parameters which correspond to the fit of the experimental measurements with minimum . We have explored here different strategies. What works best eventually is to discretize the model parameters on a hypercubic lattice and to use numerical interpolation between the lattice points. This allows to determine the landscape systematically and with the necessary precision.
We discretized the parameter ranges by 10 equidistant values for each parameter, which correspond to different model calculations for each centrality class. Let us note here that, thanks to streamlined fluid dynamic evolution and resonance decay procedures in our framework, one model simulation for a particular set of parameters takes only a few tens of seconds per centrality on a single core and even in the exhaustive search with simulations, the entire fit can be performed with a rate of 1 day/centrality class using a 100 core machine.
Once all simulations have been computed we use an order-7 spline interpolation222In languages like Mathematica or Scientific Python such multi-dimensional, higher order B-spline interpolation schemes are readily implemented. between them and apply a numerical minimization technique to find the lowest value of and its position. For this minimization we used a Minuit algorithm James:1994vla to find the global minimum. The best fit found gives a . As a check of the numerical interpolation, we have also calculated directly for this specific configuration and obtained a compatible result.
The best fit parameters obtained in this way are reported in Table 3. With the choice of the TrENTo parameter = 0 we observe that the values of depend only mildly on centrality (as observed previously Bernhard:2016tnd ).
3.2 Uncertainties and correlations of model parameters
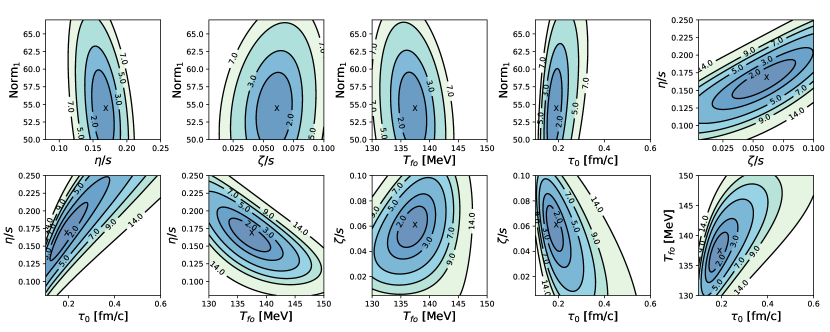
In order to study correlations between pairs of model parameters according to their posterior probability distribution we use two methods. Firstly, two-dimensional slices of the nine dimensional landscape are computed with the remaining parameters kept at their global best fit (minimum ) value. The results are shown in Fig. 1.
The first four panels on the top show the correlations of the initial entropy profile normalization with respect to the other four parameters. As an example we report the normalization for the centrality interval 0–5%, . Thanks to the factored out scaling with initialization time in Eq. (3), the different are observed to be almost independent from the other parameters. Only a rather weak correlation is observed between the initial normalization and /s as well as . This could be due to the combined effects of viscous entropy production at early times and the delayed generation of radial flow for larger values. In the other six panels of Fig. 1 the correlations of the remaining parameter pairs are shown. We see positive correlation between and , between and as well as between and . On the other hand, negative correlations are instead observed between and as well as between and . Finally no strong and clear correlation is observed between and .
In order to quantify and supplement the information that is visually available in Fig. 1, we also determine numerically the form of as a function of the nine model parameters in the vicinity of the minimum. In terms of deviations from the best fit value = (, , , , ) we find
| (10) |
This information is interesting in particular because the probability for the correct fit parameters, given the experimental data we have analysed, is proportional to . The quadratic approximation to in eq. (10) corresponds then to a Gaussian form of this so-called posterior probability. The diagonal values of the inverse matrix can then formally be understood as variances of the fit parameters in this approximation to the posterior probability,
| (11) |
Moreover, the matrix
| (12) |
quantifies correlations between the fitted parameters, again in a Gaussian approximation to the posterior distribution. Note that this information goes beyond what is visually available in Fig. 1. The latter shows two-dimensional sections through the landscape with the other parameters kept fixed. An expansion around the minimum gives the entries of the matrix . However, for the correlations as quantified in eq. (12) one needs actually the entries of the inverse matrix .
Note that these considerations assume that the uncertainties that enter Eq. (9) are independent and normally distributed.
| 1 | 0.89 | 0.89 | 0.89 | 0.89 | -0.72 | -0.78 | 0.67 | 0.49 |
| 0.89 | 1 | 0.89 | 0.89 | 0.89 | -0.72 | -0.77 | 0.66 | 0.49 |
| 0.89 | 0.89 | 1 | 0.89 | 0.89 | -0.72 | -0.77 | 0.65 | 0.5 |
| 0.89 | 0.89 | 0.89 | 1 | 0.89 | -0.71 | -0.76 | 0.64 | 0.5 |
| 0.89 | 0.89 | 0.89 | 0.89 | 1 | -0.71 | -0.76 | 0.63 | 0.49 |
| -0.72 | -0.72 | -0.72 | -0.71 | -0.71 | 1 | 0.97 | -0.88 | 0.13 |
| -0.78 | -0.77 | -0.77 | -0.76 | -0.76 | 0.97 | 1 | -0.85 | -0.01 |
| 0.67 | 0.66 | 0.65 | 0.64 | 0.63 | -0.88 | -0.85 | 1 | 0.01 |
| 0.49 | 0.49 | 0.5 | 0.5 | 0.49 | 0.13 | -0.01 | 0.01 | 1 |
We show the resulting matrix in Table 2. The uncertainties on the model parameters according to eq. (11) are shown in Table 3 as uncertainties from the landscape. One remarks here that the latter are actually rather small. On the one side, this illustrates nicely that the experimental data are of high quality and have a high power to constrain theoretical models. On the other side, some remarks of caution about a too straight-forward interpretation are in order.
It is known that estimating model parameters including their uncertainty is difficult for situations with large and when the minimum deviates substantially from its statistical expectation value (for a complete theoretical model) . This problem arises indeed for us when we attempt a global fit for the full range of transverse momenta and all five centrality classes with a single set of parameters. As a characteristic one may calculate the “goodness of fit” where gives the cumulative distribution function with degrees of freedom. For the full global fit we find , which is indeed very small. This can be understood as the probability for the observed minimal given the data are correctly described by the model and all deviations from it arise indeed due to independent Gaussian fluctuations of the experimental data points. In other words, it is rather unlikely that the minimum we find (and in particular the deviation from the expectation value ) arises due to statistical fluctuations only.
The fact that the goodness of fit is so small means that the theoretical model as it is currently implemented is in fact incomplete. As we will see in the next section, the situation is not as bad, and our fluid model is certainly competitive with other attempts for theoretical descriptions, at least by visual inspection. Certain physics features might be missing, specifically in the low transverse momentum region for pions. Nevertheless, we should take the experimental data and the goodness of fit seriously. This leaves us with the problem to estimate the uncertainty of model parameters.
3.3 Estimation of systematic uncertainties
In order to quantify how well the model parameters of the fluid description can actually be constrained from transverse momentum spectra, we cannot rely purely on the fit uncertainties, which are unrealistically small. As discussed above, the underlying reason is that the theoretical model is not complete. This can be seen directly from the goodness of fit estimate, but also indirectly from the fact that the outcome for the most likely model parameters depends on how the fits are being done in detail. In this subsection we will discuss this latter point, and estimate systematic uncertainties of the model parameters through variations of the fitting scheme.
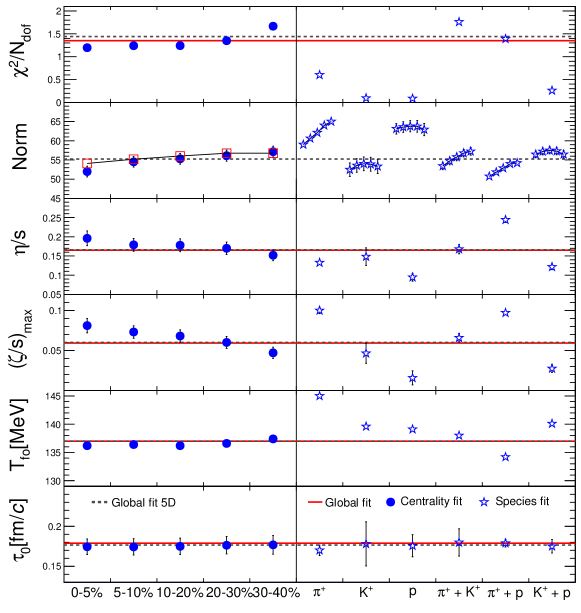
The first check consists in fitting the five centrality classes separately and estimating the model parameters as a function of centrality. In addition to quantifying uncertainties, this test might also reflect possible temperature dependence of transport coefficients (specifically ). On the left hand side of Fig. 2 we show the result for the most likely model parameters when they are determined separately for the different centrality classes (full circles). The error bars illustrate the corresponding uncertainties according to eq. (11), determined from the landscape. One finds that the variation arising from the centrality dependence is somewhat larger than the calculated fit uncertainties.
In a similar way, we also perform the fit separately restricted to single particle species, as well as restricted to two out of three particle species. This is done globally with respect to centrality. The results for the most likely model parameters obtained in this way are shown on the right hand side of Fig. 2 (open stars). One observes that the variations of fit parameters are here substantially larger than the statistical uncertainties estimated from the variation. On the other side, for the separate (single particle) fits of pions, kaons or protons we see that drops below unity, which indicates the possibility of over-fitting.
Since the does not show a significant centrality dependence, we have also tried to perform a global fit with 5 parameters, where only one common normalization for all centrality intervals is used. The results from this test is reported in with the black dashed line in Fig. 2 and as expected no significant variations are observed with respect to the default fit, however with a larger = 1.47.
In Fig. 2 the red lines represent the values obtained from the global fit reported in Table 3. From the variations shown in Fig. 2 we determine systematic uncertainties of the fitted model parameters and report them in Table 3 in the right-most column. Specifically, we take this uncertainty to be the maximal deviation seen in Fig. 2 from the best fit parameter.
| Model | Best fit | Uncertainty | Uncertainty |
|---|---|---|---|
| parameter | value | from | from fit |
| landscape | variations | ||
| 54.2 | 0.6 | -3.3, +9.0 | |
| 55.3 | 0.6 | -3.3, +8.4 | |
| 56.1 | 0.6 | -2.9, +7.7 | |
| 56.9 | 0.7 | -2.9, +7.2 | |
| 56.9 | 0.7 | -3.4, +6.2 | |
| [fm/c] | 0.179 | 0.005 | -0.009, +0.001 |
| 0.164 | 0.007 | -0.07, +0.079 | |
| 0.059 | 0.003 | -0.043, 0.040 | |
| [MeV] | 137.1 | 0.3 | -2.8, +8.0 |
4 Results and discussion
The final step in the modeling workflow is to compute observables with best fit parameters, Table 3, and to make predictions for observables not used in the fit. In this work, the simulations are performed for Pb–Pb collisions at = 2.76 TeV for the centrality intervals 0–5%, 5–10%, 10–20%, 20–30% and 30–40%. First, we compare the fitted -differential spectra of identified hadrons to experimental measurements. Then we study the derived quantities, like the total multiplicities and mean- for different hadron species. Finally, we make model calculations for observables not used in the fit. Namely, we compute the spectra for strange and multi-strange baryons at the same collision energy and centrality classes at = 2.76 TeV and we make predictions for the pion, kaons, and protons spectra in Pb–Pb collisions at = 5.02 TeV.
4.1 Fitted particle spectra of , ,
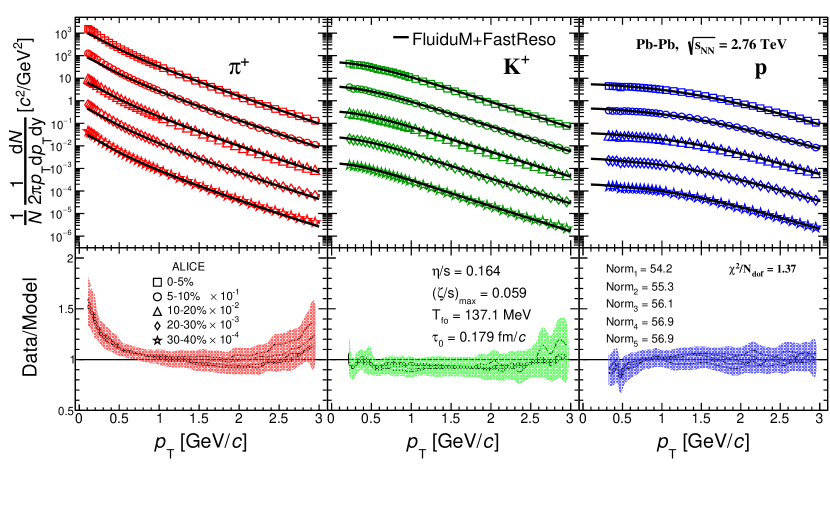
In Fig. 3 (top panels) we show the transverse momentum differential spectra of identified light hadrons , and using our best fit parameters () listed in Table 3 (lines) and we compare our results with the ALICE measurement (symbols). The bottom panels show the data to model ratio with shaded areas representing the combined experimental uncertainties.
Simulations are in overall good quantitative agreement with the experimental measurements. Kaon and proton spectra are reproduced within 10%-20% accuracy and within of experimental errors from the data or the entire momentum range in all the centrality classes. The pion spectra is reproduced well in a narrower momentum range, while low- pions are systematically underpredicted and make major contributions to the relatively large in the fit. We checked that excluding soft pions from the fit results in a significantly smaller and the minimum moves out from the parameter ranges given in Table 1. Such discrepancies in the pion spectra are well known and have been observed both in hydrodynamic simulations Song:2013qma ; Alqahtani:2017tnq ; Ryu:2017qzn ; Dubla:2018czx and blast-wave fits with resonance decays Mazeliauskas:2019ifr ; Melo:2019mpn .
The enhancement of low- pion spectra is typically attributed to the feed-down of resonance decays Schnedermann:1993ws . However, even after we included a considerably larger set of primary resonances Alba:2017mqu ; Alba:2017hhe ; parotto_private , the agreement of soft pion spectra improved only marginally. Additional physics effects like finite widths of resonance decays Huovinen:2016xxq , the presence of pion condensation in heavy-ion collisions Begun:2015ifa ; Begun:2016cva or going beyond linearised viscous corrections to the freeze-out spectra Alqahtani:2017tnq are being studied.
We would like to note here that our simulations show flat data to model ratio for protons within the uncertainties for the considered momentum range and in all centrality classes. However, a slight tendency towards over-predicting the low protons is also observed. In this context it is interesting to note that in studies simulating a hadronic phase after chemical freeze-out Ryu:2017qzn ; Dubla:2018czx , protons have been observed to receive an additional boost, resulting in a harder spectrum.
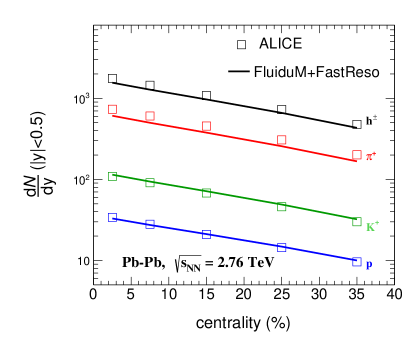
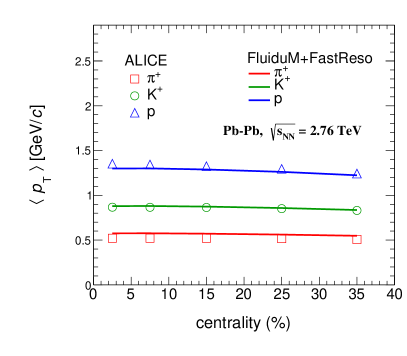
In addition to the data to model comparison of partice spectra, we can compute other derived observables: particle multiplicity and mean . In the top panel of Fig. 4 we compare our results of total charged and identified particle multiplicities at mid-rapidity as a function of collision centrality for pions, kaons, and protons with the ALICE measurements Abelev:2013vea . Our simulations give a reasonably good description of the centrality dependence of the charged hadron multiplicity. However, also in this case we see a tension with the pion and total charged hadron yields, especially in most central collisions, which is a clear reflection of the underestimation of the low pion spectra observed in Fig. 3. In the bottom panel of Fig. 4 we compare the mean transverse momentum , for pions, kaons, and protons as a function of centrality between our simulations and the experiment Abelev:2013vea . While of kaons agrees very well with the experimental measurements, the of pions and protons show some residual deviations. For the pions this is a reflection of the deviation between model and data in the transverse momentum spectrum below = 0.5 GeV/, which results in a slightly larger for pions in our model. As for the protons, the slight discrepancy could be due to the absence of an hadronic phase between chemical and kinetic freeze-out in our model. We note that similar discrepancies are observed in other hydrodynamic simulations Ryu:2017qzn ; Alqahtani:2017tnq and none appears able to reproduce data within the very small experimental uncertainties.
To our best knowledge no recent heavy-ion simulations (including our own presented here) are able to produce a uniformly good description of identified particle spectra from central to mid-central nucleus-nucleus collisions if experimental uncertainties are taken seriously. The pioneering studies of Bozek:2009dw showed excellent agreement of identified particle spectra measured at RHIC with ideal hydrodynamic simulations, but the agreement worsened when effects of viscosity were included. In the EKRT model Niemi:2015qia , pion spectra are described well at the expense of over-predicted kaon and proton yields, which is in line with our finding when we attempt to fit only the pion spectra. In Ref. Ryu:2017qzn where the effect of both bulk viscosity and hadronic rescattering were studied, the data to model agreement is arguably on the same level as in our work, although we employ a single freeze-out approximation. We note here that the extensive Bayesian analyses of refs. Bernhard:2016tnd ; Bernhard2019 have concentrated on momentum integrated observables. In summary, the excellent quality of experimental data of identified particle spectra indicates the need of including additional physics in hydrodynamic simulations of heavy-ion collisions.
4.2 Strange, multi-strange and energy dependence of particle spectra
Having found the optimal parameters of our model, many other observables, not used in the fit, can be directly predicted. This is an important step in validating the physics picture behind the model. Therefore we use the fluid dynamic evolution with the best fit parameters to compute the spectra of strange and multi-strange hadrons (, , ) and compare the results with the ALICE measurements Abelev:2013xaa ; ABELEV:2013zaa .
The comparison is shown in Fig. 5 for the 10–20% (left panel) and 20–40% (right panel) centrality intervals.
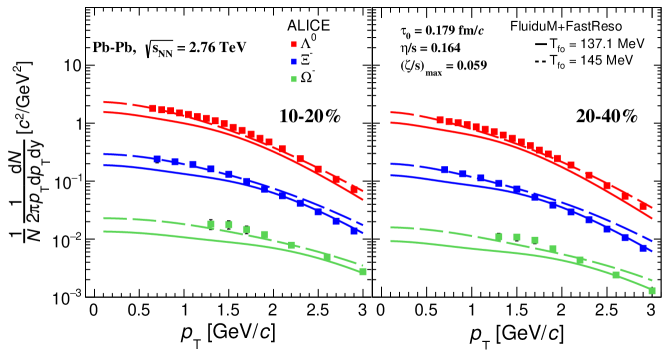
From the comparison one can see that if the value of is kept the same as obtained from the best fit (solid lines), the experimental -differential spectra of strange and multi-strange baryons are underestimated by the simulation. This effect is more pronounced for the baryons, which shows a discrepancy, while for the and the simulation and data tend to agree for 2 GeV/. In previous work Ryu:2017qzn it was observed that strange and multi-strange baryons are more sensitive to a change in the switching temperature from a fluid evolution to URQMD dynamics than pions, kaons and protons. In our case, if we increase the value of to 145 MeV, while keeping all other parameters fixed, the simulation shows better agreement with data at low momentum, see in Fig. 5 (dashed lines), but is then over-predicted for .
The tendency of strange and multi-strange hadrons preferring higher freeze-out temperatures Bellwied:2018tkc ; Bluhm:2018aei , is sometimes used as an evidence for the scenario of sequential hadronization where the switching from quark to hadron degrees of freedom occurs at different temperatures for different particle flavours Bellwied:2013cta ; Adamczyk:2017iwn ; Alba:2020jir . However, one should not discount the possibility that additional resonance feed-down might improve the agreement with data. Indeed, by approximately doubling the list of primary hadrons Alba:2017mqu ; Alba:2017hhe ; parotto_private , we observed a nearly 20% increase in the feed-down for baryons compared to previous calculations Mazeliauskas:2018irt . Further extensions of decay channels and global fits including the strange particles would certainly reduce the apparent discrepancy.
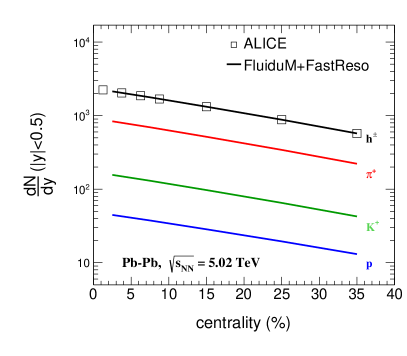
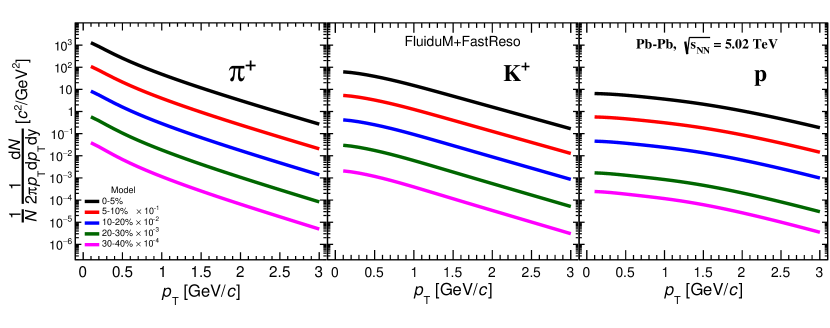
Finally, we can use our model to make predictions for the -differential spectra of pions, kaons and protons in Pb–Pb collisions at = 5.02 TeV. At higher collision energies, nuclei have more energy to deposit in the collision area, which ultimately results in an increased final particle multiplicity and higher initial QGP energy density. However as the increase of multiplicity is fractional, the fundamental properties of the QGP are not expected to change substantially and we can use the same best fit model parameters to predict particle spectra at higher energies. The only change made is the overall normalization of the initial entropy density profile. The normalization at = 5.02 TeV Pb–Pb collisions is fixed by doing a fit to the published unidentified charged hadron multiplicity as a function of the collision centrality Adam:2015ptt 333We performed the fit in the same centrality classes as used for = 2.76 TeV Pb–Pb by combining the ALICE measurement at = 5.02 TeV energy into larger centrality bins. The new normalization factors are correspondingly .. We report the result in Fig. 6, together with the model calculations for integrated yields of pions, kaons and protons as a function of centrality. The corresponding plots for the -differential spectra of pions, kaons and protons in Pb–Pb collisions at = 5.02 TeV are reported in Fig. 7 for the centrality intervals 0–5%, 5–10%, 10–20%, 20–30% and 30–40%. The -spectra at = 5.02 TeV are higher and flatter than the ones at = 2.76 TeV, which illustrates that stronger radial flow has been developed in the systems with larger final multiplicities at the higher collision energy.
5 Summary and conclusion
In summary, we have performed a global fit of transverse momentum particle spectra for identified pions, kaons and protons in five centrality classes based on a relativistic fluid approximation to QCD dynamics including a realistic thermodynamic equation of state as well as shear and bulk viscous dissipation, see ref. Floerchinger:2018pje for further details. We have taken experimental data points measured at TeV by the ALICE collaboration in the transverse momentum range GeV/ as well as their experimental uncertainty into account, and searched for the most likely value of open parameters of the theoretical model on this basis.
One immediate result is the outcome for the most likely model parameters. They are summarized in Table 3. In particular, the initialization time of the fluid description comes out relatively low, fm/c. For the shear viscosity to entropy ratio we find , and for the peak value of the bulk viscosity to entropy ratio . The combined chemical and kinetic freeze-out temperature is determined to be MeV.
Our best fit value for the shear viscosity to entropy density ratio is rather close to the findings of ref. Niemi:2015qia but deviates somewhat from the result of ref. Bernhard2019 which reports a minimum value at MeV and a positive slope towards larger temperatures. Ref. Dubla:2018czx also pointed towards such a small minimal value . On the other side, the analysis of ref. Kurkela:2019kip pointed towards values in the range of our finding, specifically .
Our best fit value for the freeze-out temperature is lower than found in other studies. In particular, the statistical hadronization model fits to integrated light and multi-strange hadrons find in 0-10% centrality bin Andronic:2017pug . However, excluding the multi-strange particles from the fit, as also done in our work, lowers the statistical hadronisation model fit down to (see the recent publication Alba:2020jir ). In addition, we note that the inclusion of (admittedly poorly understood) viscous corrections to the freeze-out distribution affects the best fit value of the freeze-out temperature. We checked that without these corrections, the best fit value indeed increases to . Finally, the number of included resonances also impact the optimal freeze-out temperature. Therefore such systematic differences in the modelling of hadronic freeze-out must be kept in mind when comparing different studies.
Moreover, from a quadratic expansion of , corresponding to a Gaussian approximation to the posterior probability of the model parameters, we determine also their uncertainties as well as their correlation matrix, see Tables 2 and 3. Note that in contrast to the Bayesian approach followed in refs. Bernhard:2016tnd ; Bernhard2019 , our method to characterize the likelihood of the model parameters is independent of the parameter windows chosen as a prior. It is a local characterization using only the shape of the landscape in the vicinity of the minimum itself. Let us also emphasize that we take the entire form of the transverse momentum dependent particle spectra – as well as the reported experimental uncertainties – into account and not only integrated quantities such as total multiplicities or mean transverse momentum.
From table 3 it becomes apparent that these uncertainties extracted from the landscape are rather small. This underlines the quality of the experimental data and their high power to constrain theoretical models. However, one must also say that the best fitting model parameters lead to with . The deviation from the expectation value is actually relatively large, which strictly speaking, implies that it is very unlikely that the current theoretical model correctly describes all of the observed physics. In other words, the residual deviations in Fig. 3 are statistically significant. The tension concerns in particular pions in the region of low transverse momenta. We may speculate which physics effect our model is missing.
One possibility that comes to mind is that contributions from the feed down of decaying resonances have for some reason been underestimated. We have checked this possibility by doing our calculation with two different sets of hadronic resonances. While the current implementation uses the rather large set of resonances of ref. pdg , we have also tried a smaller set based on an earlier listing Mazeliauskas:2018irt and found the difference for the low- pions to be rather small. Of course, it cannot be fully excluded that an even larger set, or a more detailed description of the decay process Lo:2017sux ; Huovinen:2016xxq , could remedy the problem.
Another interesting possibility is a non-thermal production mechanism for low-momentum pions such as from evolving coherent fields or condensates. An idea how this can happen in an out-of-equilibrium scenario is the one of a disoriented chiral condensate, see Mohanty:2005mv for a review. Further work is needed to see whether such contributions from coherent fields and fluid dynamics can be reconciled.
Given that the current theoretical model is incomplete, it is rather difficult to determine its model parameters and the corresponding uncertainty. In particular, although straight-forward to calculate, the uncertainty from the landscape as quoted in Table 3 can not be taken as a complete estimate of uncertainty in a situation where the theoretical description is itself not yet complete. For this reason we have also studied how our best fit parameters change when the procedure for their determination is varied. Specifically, in Fig. 2 we show how the best fit parameters change if the fit is not done globally, i.e. for all centrality classes and all three particle species, but rather separately for individual centrality classes (and all three species), separately for pions, kaons and protons or for case in which only two species at a time are considered (but including all centrality intervals). One observes that this leads indeed to a sizeable variation of the model parameters and we estimate on this basis the uncertainties from fit variations in Table 3.
While in the present work we have focused on identified particle transverse momentum spectra, additional very interesting information is carried by harmonic flow coefficients and -particle correlation functions. While they are sensitive to more detailed information from the initial state, their evolution is also highly sensitive to thermodynamic and transport properties Bernhard:2016tnd ; Floerchinger:2013rya ; Teaney:2003kp ; Gale:2013da ; Dubla:2018czx ; Ryu:2017qzn ; Song:2013qma ; Niemi:2015qia ; Bernhard2019 . Our theoretical framework Floerchinger:2018pje ; Mazeliauskas:2018irt has been developed also to describe those, and we plan to extend our theory-experiment comparison in this direction.
In conclusion we find that a fluid dynamic description of transverse momentum spectra for identified pions, kaons and protons works reasonably but with statistically significant residuals. The experimental data are now of a rather high quality and we expect that they will indeed allow to find a more complete theoretical description in the future.
Acknowledgement
The authors thank Paolo Parotto for sharing his PDG2016 resonance and decay lists. This work is part of and supported by the DFG Collaborative Research Centre ”SFB 1225 (ISOQUANT)”. A.D. is partially supported by the Netherlands Organisation for Scientific Research (NWO) under the grant 19DRDN011, VI.Veni.192.039. Computational resources have been provided by the GSI Helmholtzzentrum für Schwerionenforschung.
References
- (1) W. Busza, K. Rajagopal and W. van der Schee, Heavy Ion Collisions: The Big Picture, and the Big Questions, Ann. Rev. Nucl. Part. Sci. 68 (2018) 339 [1802.04801].
- (2) ALICE collaboration, Elliptic flow of charged particles in Pb-Pb collisions at 2.76 TeV, Phys. Rev. Lett. 105 (2010) 252302 [1011.3914].
- (3) STAR collaboration, Experimental and theoretical challenges in the search for the quark gluon plasma: The STAR Collaboration’s critical assessment of the evidence from RHIC collisions, Nucl. Phys. A757 (2005) 102 [nucl-ex/0501009].
- (4) PHENIX collaboration, Formation of dense partonic matter in relativistic nucleus-nucleus collisions at RHIC: Experimental evaluation by the PHENIX collaboration, Nucl. Phys. A757 (2005) 184 [nucl-ex/0410003].
- (5) J. L. Nagle and W. A. Zajc, Small System Collectivity in Relativistic Hadronic and Nuclear Collisions, Ann. Rev. Nucl. Part. Sci. 68 (2018) 211 [1801.03477].
- (6) PHENIX collaboration, Creation of quark–gluon plasma droplets with three distinct geometries, Nature Phys. 15 (2019) 214 [1805.02973].
- (7) ALICE collaboration, Investigations of anisotropic flow using multi-particle azimuthal correlations in pp, p-Pb, Xe-Xe, and Pb-Pb collisions at the LHC, 1903.01790.
- (8) M. Mace, V. V. Skokov, P. Tribedy and R. Venugopalan, Hierarchy of Azimuthal Anisotropy Harmonics in Collisions of Small Systems from the Color Glass Condensate, Phys. Rev. Lett. 121 (2018) 052301 [1805.09342].
- (9) C. Bierlich, G. Gustafson, L. Lönnblad and H. Shah, The Angantyr model for Heavy-Ion Collisions in PYTHIA8, JHEP 10 (2018) 134 [1806.10820].
- (10) M. Greif, C. Greiner, B. Schenke, S. Schlichting and Z. Xu, Importance of initial and final state effects for azimuthal correlations in p+Pb collisions, Phys. Rev. D96 (2017) 091504 [1708.02076].
- (11) Z.-W. Lin, C. M. Ko, B.-A. Li, B. Zhang and S. Pal, A Multi-phase transport model for relativistic heavy ion collisions, Phys. Rev. C72 (2005) 064901 [nucl-th/0411110].
- (12) Y. Zhou, X. Zhu, P. Li and H. Song, Investigation of possible hadronic flow in TeV collisions, Phys. Rev. C91 (2015) 064908 [1503.06986].
- (13) J. S. Moreland, J. E. Bernhard and S. A. Bass, Alternative ansatz to wounded nucleon and binary collision scaling in high-energy nuclear collisions, Phys. Rev. C92 (2015) 011901 [1412.4708].
- (14) S. Floerchinger, E. Grossi and J. Lion, Fluid dynamics of heavy ion collisions with mode expansion, Phys. Rev. C 100 (2019) 014905.
- (15) A. Mazeliauskas, S. Floerchinger, E. Grossi and D. Teaney, Fast resonance decays in nuclear collisions, Eur. Phys. J. C79 (2019) 284 [1809.11049].
- (16) S. Borsanyi et al., Calculation of the axion mass based on high-temperature lattice quantum chromodynamics, Nature 539 (2016) 69 [1606.07494].
- (17) HotQCD collaboration, Equation of state in ( 2+1 )-flavor QCD, Phys. Rev. D90 (2014) 094503 [1407.6387].
- (18) P. Alba et al., Constraining the hadronic spectrum through QCD thermodynamics on the lattice, Phys. Rev. D96 (2017) 034517 [1702.01113].
- (19) P. Alba, V. Mantovani Sarti, J. Noronha, J. Noronha-Hostler, P. Parotto, I. Portillo Vazquez et al., Effect of the QCD equation of state and strange hadronic resonances on multiparticle correlations in heavy ion collisions, Phys. Rev. C98 (2018) 034909 [1711.05207].
- (20) P. Parotto. private communication, 2019.
- (21) Particle Data Group collaboration, Review of Particle Physics, Chin. Phys. C40 (2016) 100001.
- (22) J. E. Bernhard, J. S. Moreland, S. A. Bass, J. Liu and U. Heinz, Applying Bayesian parameter estimation to relativistic heavy-ion collisions: simultaneous characterization of the initial state and quark-gluon plasma medium, Phys. Rev. C94 (2016) 024907 [1605.03954].
- (23) A. Mazeliauskas, S. Floerchinger, E. Grossi and D. Teaney, “FastReso – program for computing irreducible components of the particle distribution from direct resonance decays.” https://github.com/amazeliauskas/FastReso, 2018.
- (24) S. Floerchinger and U. A. Wiedemann, Mode-by-mode fluid dynamics for relativistic heavy ion collisions, Phys. Lett. B728 (2014) 407 [1307.3453].
- (25) S. Floerchinger and U. A. Wiedemann, Kinetic freeze-out, particle spectra and harmonic flow coefficients from mode-by-mode hydrodynamics, Phys. Rev. C89 (2014) 034914 [1311.7613].
- (26) S. Floerchinger and U. A. Wiedemann, Statistics of initial density perturbations in heavy ion collisions and their fluid dynamic response, JHEP 08 (2014) 005 [1405.4393].
- (27) S. Floerchinger and E. Grossi, Causality of fluid dynamics for high-energy nuclear collisions, JHEP 08 (2018) 186 [1711.06687].
- (28) J. S. Moreland, J. E. Bernhard and S. A. Bass, Estimating initial state and quark-gluon plasma medium properties using a hybrid model with nucleon substructure calibrated to -Pb and Pb-Pb collisions at TeV, 1808.02106.
- (29) G. S. Denicol, S. Jeon and C. Gale, Transport Coefficients of Bulk Viscous Pressure in the 14-moment approximation, Phys. Rev. C90 (2014) 024912 [1403.0962].
- (30) HotQCD collaboration, Chiral crossover in QCD at zero and non-zero chemical potentials, Phys. Lett. B795 (2019) 15 [1812.08235].
- (31) HotQCD collaboration, The QCD crossover at zero and non-zero baryon densities from Lattice QCD, Nucl. Phys. A982 (2019) 847 [1807.05607].
- (32) F. Cooper and G. Frye, Comment on the Single Particle Distribution in the Hydrodynamic and Statistical Thermodynamic Models of Multiparticle Production, Phys. Rev. D10 (1974) 186.
- (33) H. Bebie, P. Gerber, J. L. Goity and H. Leutwyler, The Role of the entropy in an expanding hadronic gas, Nucl. Phys. B378 (1992) 95.
- (34) D. Teaney, The Effects of viscosity on spectra, elliptic flow, and HBT radii, Phys. Rev. C68 (2003) 034913 [nucl-th/0301099].
- (35) J.-F. Paquet, C. Shen, G. S. Denicol, M. Luzum, B. Schenke, S. Jeon et al., Production of photons in relativistic heavy-ion collisions, Phys. Rev. C93 (2016) 044906 [1509.06738].
- (36) ALICE collaboration, Centrality dependence of , K, p production in Pb-Pb collisions at = 2.76 TeV, Phys. Rev. C88 (2013) 044910 [1303.0737].
- (37) C. Gale, S. Jeon and B. Schenke, Hydrodynamic Modeling of Heavy-Ion Collisions, Int. J. Mod. Phys. A28 (2013) 1340011 [1301.5893].
- (38) D. A. Teaney, Viscous Hydrodynamics and the Quark Gluon Plasma, in Quark-gluon plasma 4, R. C. Hwa and X.-N. Wang, eds., pp. 207–266, (2010), 0905.2433, DOI.
- (39) A. Dubla, S. Masciocchi, J. M. Pawlowski, B. Schenke, C. Shen and J. Stachel, Towards QCD-assisted hydrodynamics for heavy-ion collision phenomenology, Nucl. Phys. A979 (2018) 251 [1805.02985].
- (40) S. Ryu, J.-F. Paquet, C. Shen, G. Denicol, B. Schenke, S. Jeon et al., Effects of bulk viscosity and hadronic rescattering in heavy ion collisions at energies available at the BNL Relativistic Heavy Ion Collider and at the CERN Large Hadron Collider, Phys. Rev. C97 (2018) 034910 [1704.04216].
- (41) J. E. Bernhard, J. S. Moreland and S. A. Bass, Bayesian estimation of the specific shear and bulk viscosity of quark-gluon plasma, Nature Physics (2019) .
- (42) V. Begun and W. Florkowski, Bose-Einstein condensation of pions in heavy-ion collisions at the CERN Large Hadron Collider (LHC) energies, Phys. Rev. C91 (2015) 054909 [1503.04040].
- (43) V. Begun, Fluctuations as a test of chemical non-equilibrium at the LHC, Phys. Rev. C94 (2016) 054904 [1603.02254].
- (44) F. James, MINUIT Function Minimization and Error Analysis: Reference Manual Version 94.1, .
- (45) H. Song, S. Bass and U. W. Heinz, Spectra and elliptic flow for identified hadrons in 2.76A TeV Pb + Pb collisions, Phys. Rev. C89 (2014) 034919 [1311.0157].
- (46) M. Alqahtani, M. Nopoush, R. Ryblewski and M. Strickland, Anisotropic hydrodynamic modeling of 2.76 TeV Pb-Pb collisions, Phys. Rev. C96 (2017) 044910 [1705.10191].
- (47) A. Mazeliauskas and V. Vislavicius, Temperature and fluid velocity on the freeze-out surface from , , spectra in pp, p-Pb and Pb-Pb collisions, Phys. Rev. C101 (2020) 014910 [1907.11059].
- (48) I. Melo and B. Tomášik, Kinetic freeze-out in central heavy-ion collisions between 7.7 and 2760 GeV per nucleon pair, 1908.03023.
- (49) E. Schnedermann, J. Sollfrank and U. W. Heinz, Thermal phenomenology of hadrons from 200-A/GeV S+S collisions, Phys. Rev. C48 (1993) 2462 [nucl-th/9307020].
- (50) P. Huovinen, P. M. Lo, M. Marczenko, K. Morita, K. Redlich and C. Sasaki, Effects of -meson width on pion distributions in heavy-ion collisions, Phys. Lett. B769 (2017) 509 [1608.06817].
- (51) ALICE Collaboration collaboration, Centrality dependence of the charged-particle multiplicity density at midrapidity in pb-pb collisions at = 2.76 tev, Phys. Rev. Lett. 106 (2011) 032301.
- (52) P. Bozek, Bulk and shear viscosities of matter created in relativistic heavy-ion collisions, Phys. Rev. C81 (2010) 034909 [0911.2397].
- (53) H. Niemi, K. J. Eskola and R. Paatelainen, Event-by-event fluctuations in a perturbative QCD + saturation + hydrodynamics model: Determining QCD matter shear viscosity in ultrarelativistic heavy-ion collisions, Phys. Rev. C93 (2016) 024907 [1505.02677].
- (54) ALICE collaboration, and production in Pb-Pb collisions at = 2.76 TeV, Phys. Rev. Lett. 111 (2013) 222301 [1307.5530].
- (55) ALICE collaboration, Multi-strange baryon production at mid-rapidity in Pb-Pb collisions at = 2.76 TeV, Phys. Lett. B728 (2014) 216 [1307.5543].
- (56) R. Bellwied, J. Noronha-Hostler, P. Parotto, I. Portillo Vazquez, C. Ratti and J. M. Stafford, Freeze-out temperature from net-kaon fluctuations at energies available at the BNL Relativistic Heavy Ion Collider, Phys. Rev. C99 (2019) 034912 [1805.00088].
- (57) M. Bluhm and M. Nahrgang, Freeze-out conditions from strangeness observables at RHIC, Eur. Phys. J. C79 (2019) 155 [1806.04499].
- (58) R. Bellwied, S. Borsanyi, Z. Fodor, S. D. Katz and C. Ratti, Is there a flavor hierarchy in the deconfinement transition of QCD?, Phys. Rev. Lett. 111 (2013) 202302 [1305.6297].
- (59) STAR collaboration, Bulk Properties of the Medium Produced in Relativistic Heavy-Ion Collisions from the Beam Energy Scan Program, Phys. Rev. C96 (2017) 044904 [1701.07065].
- (60) P. Alba, V. M. Sarti, J. Noronha-Hostler, P. Parotto, I. Portillo-Vazquez, C. Ratti et al., Influence of hadronic resonances on the chemical freeze-out in heavy-ion collisions, 2002.12395.
- (61) ALICE collaboration, Centrality dependence of the charged-particle multiplicity density at midrapidity in Pb-Pb collisions at = 5.02 TeV, Phys. Rev. Lett. 116 (2016) 222302 [1512.06104].
- (62) A. Kurkela, U. A. Wiedemann and B. Wu, Flow in AA and pA as an interplay of fluid-like and non-fluid like excitations, 1905.05139.
- (63) A. Andronic, P. Braun-Munzinger, K. Redlich and J. Stachel, Decoding the phase structure of QCD via particle production at high energy, Nature 561 (2018) 321 [1710.09425].
- (64) K. Nakamura (Particle Data Group)J. Phys. G 37 (2010) 075021.
- (65) P. M. Lo, Resonance decay dynamics and their effects on -spectra of pions in heavy-ion collisions, Phys. Rev. C97 (2018) 035210 [1705.01514].
- (66) B. Mohanty and J. Serreau, Disoriented chiral condensate: theory and experiment, Phys. Rept. 414 (2005) 263 [hep-ph/0504154].