Clocking the formation of today’s largest galaxies: Wide field integral spectroscopy of Brightest Cluster Galaxies and their surroundings
Abstract
The formation and evolution of local brightest cluster galaxies (BCGs) is investigated by determining the stellar populations and dynamics from the galaxy core, though the outskirts and into the intracluster light (ICL). Integral spectroscopy of 23 BCGs observed out to is collected and high signal-to-noise regions are identified. Stellar population synthesis codes are used to determine the age, metallicity, velocity, and velocity dispersion of stars within each region. The intracluster light (ICL) spectra are best modeled with populations that are younger and less metal-rich than those of the BCG cores. The average BCG core age of the sample is and the average metallicity is , whereas for the ICL the average age is and the average metallicity is . The velocity dispersion profile is seen to be rising or flat in most of the sample (17/23), and those with rising values reach the value of the host cluster’s velocity dispersion in several cases. The most extended BCGs are closest to the peak of the cluster’s X-ray luminosity. The results are consistent with the idea that the BCG cores and inner regions formed quickly and long ago, with the outer regions and ICL forming more recently, and continuing to assemble through minor merging. Any recent star formation in the BCGs is a minor component, and is associated with the cluster cool core status.
keywords:
galaxies: clusters: general; galaxies: elliptical and lenticular, cD; galaxies: evolution; galaxies: interactions; galaxies: stellar content.1 Introduction
The deep gravitational potential wells at the centre of rich galaxy clusters are home to a dynamic environment, with components unobserved elsewhere in the universe. The brightest, largest, and most massive galaxy in the cluster (the BCG) is usually found at the cluster core. An extended component of intracluster light (ICL) is also found at the bottom of the gravitational potential of the cluster, often coincident with the BCG. Many other massive red galaxies are found within the virial radius of the cluster, in addition to some dwarf and spiral galaxies. These galaxies interact with each other and with the hot intracluster medium.
BCGs form a distinct class of galaxies (Hausman & Ostriker, 1978; Postman & Lauer, 1995). They are red and have smooth brightness distributions, however, both observations (von der Linden et al., 2006; Edwards et al., 2009; Oliva-Altamirano et al., 2015; Barbosa et al., 2016) and models (Murante et al., 2007; Tonini et al., 2012; Contini et al., 2014) show that BCGs have complex formation histories best described with a variety of stellar populations, which include components from major mergers, in situ star formation, and contributions from low-mass and L∗ galaxies. Very old stellar populations, high metallicities and -enhancements are observed in longslit studies of BCGs (Brough et al., 2007; Loubser et al., 2008; Loubser & Sánchez-Blázquez, 2012) which reach out to the effective radius of the galaxy. Less is known about the stellar populations and dynamics of the outer parts of the BCG, and whether there is a smooth transition between the BCG outskirts and the intracluster light (ICL).
The ICL is very faint, so it is difficult to get accurate surface brightness profiles and herculean efforts are required to obtain a spectrum. It is only recently that Kluge et al. (2019) has a presented a large photometric study of 170 BCG+ICL systems observed in g’. Tests for separating the BCG from the ICL have been performed, and indeed breaks in the luminosity profile from the BCG core have been seen (Krick, Bernstein & Pimbblet, 2006; Krick & Bernstein, 2007). Recent observations of 10 clusters observed with the Hubble Space Telescope as part of CLASH (Postman et al., 2012) and Frontier Fields (Lotz et al., 2017) programs have provided exquisite photometric measurements of negative colour and metallicity gradients of the ICL (Montes & Trujillo, 2014; De Maio et al., 2015; Montes & Trujillo, 2018). The ICL metallicities found in the Frontier Fields clusters echo those of Milky-Way mass outskirts, and younger ages imply accretion within . The negative metallicity gradients support an origin from dwarf or galaxies as predicted in models of Hirschmann et al. (2015) and are consistent with the colours measured by De Maio et al. (2015), but is difficult to explain if the source is the BCG. None the less, this analysis has only been performed using photometric measurements, and a true test would be to compare the ages and metallicities of the BCG and nearby galaxies with the ICL derived from spectroscopic observations.
Currently, only a few spectra of the ICL exist. Melnick et al. (2012) study a cluster, finding stellar populations to be old and metal-rich, very similar to the nearby BCG. Observations of the BCGs in Coma by Coccato et al. (2010) and Coccato, Gerhard & Arnaboldi (2010) paint a different picture, of old stars with metal-poor or solar metallicities beyond one effective radius (). For the cD galaxy in Hydra I, negative age gradients are observed beyond , suggesting a component from dwarf galaxies (Barbosa et al., 2016).
The formation of BCGs and the origin of the ICL has been studied numerically using various techniques, including gravity-only simulations and gas dynamical simulations, often combined with semi-analytical models (SAMs) for the evolution of galaxies (De Lucia, Kauffmann & White, 2004; Willman et al., 2004; Sommer-Larsen, Romeo & Portinari, 2005; Croton et al., 2006; Rudick, Mihos & McBride, 2006; Tutukov, Dryomov & Dryomova, 2007; Puchwein et al., 2010; Dolag, Murante & Borgani, 2010; Rudick, Mihos & McBride, 2011; Hirschmann, De Lucia & Fontanot, 2016; Tang et al., 2018; Ragone-Figueroa et al., 2018). Most of the work on BCGs focuses on reconstructing their merger and star formation histories. By combining a SAM with merger trees extracted from cosmological simulations, De Lucia & Blaizot (2007) studied the hierarchical growth of BCGs in a CDM universe. They found that most stars in BCGs formed early inside progenitors, that later merge together to form the BCGs. In these simulations, 80% of the stars destined to end up in BCGs were already formed at redshifts , but at , only half the mass of the final BCGs had been assembled. However, these results depend on the assumptions behind the SAM, and other studies have found that BCGs assemble their mass at earlier redshifts (e.g. Tonini et al. 2012). Ragone-Figueroa et al. (2018) found that at , most stars that are destined to end up in the BCGs form in progenitors that have not merged yet, while at lower redshifts most stars form inside the BCGs themselves. More recently, Contini, Yi & Kang (2018) estimated that low-mass BCGs build-up 35% of their present-day stellar mass by mergers, while the fraction reaches 70% for massive BCGs. The cosmological hydrodynamical simulations of Cui et al. (2014) find that a double Maxwellian distribution fits the stellar distributions in the core of the clusters, and identify the ICL with the high velocity dispersion component, and the BCG with the low velocity dispersion component. The resulting ICL is found to be composed of a slightly younger and less metal-rich stellar population than the BCG.
As for the origin of the ICL, several scenarios ranging from in situ star formation to cluster evaporation and 3-body ejection are currently debated (see Tutukov & Fedorova 2011 for a review). While all these scenarios might contribute to the ICL to some extent, there is a general consensus that the bulk of the ICL originates from dynamical processes, either stellar mass loss during mergers or tidal disruption during close encounters. The simulations of Murante et al. (2004) show the presence of a diffuse stellar component around the BCG that can account for the ICL, and that probably originates from tidal interactions. With their later simulations (Murante et al., 2007), they reached the different conclusion that the ICL forms in parallel with the BCG and other massive galaxies, and that the bulk of the ICL is formed during mergers, with a small contribution from tidal disruption. Other studies (Barai, Brito & Martel, 2009; Rudick et al., 2009; Martel, Barai & Brito, 2012; Contini, Yi & Kang, 2018) found that tidal disruption can account for 40% to 100% of the observed ICL in some clusters, depending on the assumptions of the model. Most of the ICL produced by this process comes from intermediate-mass galaxies, since lower-mass galaxies, even though much more numerous, tend to be resistant to tidal disruption because of their compactness (Purcell, Bullock & Zentner, 2007; Martel, Barai & Brito, 2012; Contini et al., 2014; Contini, Yi & Kang, 2018).
Putting together ideas from both theory and observations, one interesting paradigm for the formation of today’s most massive galaxies is the following: a high phase where gas accretion is high, a moderate phase where star formation peaks, and a low phase where buildup is mostly via mergers and accretion (van de Voort, 2016; Cooke et al., 2019). Very early starbursts associated with dusty star forming galaxies at (Toft et al., 2014) which would already have become compact quiescent galaxies by have been observed (Krick, Bernstein & Pimbblet, 2006; van Dokkum et al., 2008). Further time allows these dense red nuggets to merge together with smaller (Bezanson et al., 2009) and newly quenched galaxies (Krogager et al., 2014), building the larger and less dense systems observed today. Vulcani et al. (2014) have compared central galaxies in massive haloes at with those at , finding that the central parts of the galaxy form first and quickly, but that the central velocity dispersion evolves quite slowly, consistent with these findings. Negative metallicity gradients have been measured in several massive galaxies (La Barbera et al., 2012; Greene et al., 2015), with a flattening beyond (Oyarzún et al., 2019), which further corroborates this picture if the outskirts form in shallower potentials (Tremonti et al., 2004). It is possible that local BCGs as a group will show negative metallicity gradients in their outskirts as well, as massive BCGs are expected to have undergone more mergers (Edwards & Patton, 2012; Jimmy et al., 2013) than large ellipticals, and Loubser & Sánchez-Blázquez (2012) find negative metallicity gradients in local BCGs within .
Thus, mapping the stellar populations and kinematics of BCGs from the core to beyond one effective radius () has great potential to constrain the history of mass assembly. Stellar population synthesis is still hampered by issues such as the age-metallicity degeneracy, and assumptions of dust morphologies and a universal initial mass function (IMF); however, uniformly analysed samples can still provide useful overall trends of stellar populations in galaxies. Previous spectroimaging studies of BCGs include those of Hydra I by Barbosa et al. (2016), 9 BCGs by Oliva-Altamirano et al. (2015), 9 BCGs by Edwards et al. (2009) and 6 by Hatch (2007). All authors find a mix of old and intermediate stellar populations in the core, no significant age gradient, and a mix of metallicity gradients (shallow to flat) out to . The BCG core populations are beginning to be well understood, but the connection between the BCG and ICL has not yet been resolved, which motivates observations over a larger area, into the galaxy outskirts and ICL.
Broadening our perspective and including an analysis of the BCG’s environment may provide important insights. Assuming the galaxy is in equilibrium and symmetric, the Jeans equation with an NFW (Navarro, Frenk & White, 1996) density profile for the dark matter gives velocity dispersion gradients that are falling. This might explain why dwarf galaxies, the Milky-Way and many isolated ellipticals show decreasing velocity dispersion gradients. The velocity dispersion profile of galaxies is usually interpreted as a signature of the underlying mass profile (of the stars and dark matter of the galaxy itself, and of the cluster mass in the case of centrally located BCGs). The work of Bender et al. (2015) on the cD of Abell 2199, and Richtler et al. (2011) on the Hydra I cD find that the velocity dispersion rises to match that of the cluster - a kinematic signature of a different component at a distance of from the BCG core. While rising velocity dispersions in BCGs are often found (Dressler, 1979; Brough et al., 2007; Newman et al., 2013; Barbosa et al., 2016; Loubser et al., 2018; Hilker et al., 2018), this is not always the case (Fisher, Illingworth & Franx, 1995; Brough et al., 2007; Loubser et al., 2008; Veale et al., 2018). Velocity dispersion can also be influenced by dynamical activity, such as recent cluster-scale or galaxy-galaxy mergers and Hilker et al. (2018) find substructure in a 2D map of the velocity dispersion in the halo of the Hydra I cD galaxy, NGC 3311.
Furthermore, in a relaxed cluster in equilibrium, the most massive galaxy should be at rest in the centre of the cluster. This is indeed the case for most observed BCGs, and this constitutes the basis for the “central galaxy paradigm,” upon which most semi-analytical galaxy evolution models rely. However, several cases of BCGs located off-centre, or at the centre of clusters but with a large velocity, have been reported (Coziol et al., 2009; Skibba et al., 2011). These clusters are probably remnants of major mergers between clusters of comparable masses, which have not yet relaxed to equilibrium (Martel, Robichaud & Barai, 2014). The effect of such mergers on the BCG outskirts and ICL is unknown at present.
| Cluster | Dates | RA | Dec | Int Time | Rot. | E(BV) | FOV | |
|---|---|---|---|---|---|---|---|---|
| (dd/mm/yr) | (h:m:s) | (h:m:s) | (s/pos) | (deg) | () | |||
| A75 | 14/10/14 | 00:39:42.35 | +21:14:06.68 | 2700 | 0 | 0.0626 | 0.031 | 83.482.5 |
| A85 | 25/11/13 | 00:41:50.54 | 09:18:13.07 | 3600 | 15 | 0.0551 | 0.034 | 73.973.2 |
| A160A | 04/12/16 | 01:12:59.56 | +15:29:28.64 | 3600 | 0 | 0.0447 | 0.076 | 61.661.0 |
| A193 | 28/11/13 | 01:25:07.22 | +08:41:57.80 | 3600 | 75 | 0.0486 | 0.043 | 66.665.9 |
| A376 | 27/11/13 | 02:46:03.59 | +36:54:12.06 | 3600 | 150 | 0.0484 | 0.063 | 65.364.7 |
| A407 | 25+28/11/13 | 03:01:52.10 | +35:50:22.96 | 7200 | 90 | 0.0462 | 0.172 | 63.962.2 |
| A602 | 04/12/16 | 07:53:26.59 | +29:21:33.59 | 3600 | 0 | 0.0619 | 0.050 | 82.281.4 |
| A671 | 04/12/16 | 08:28:31.84 | +30:25:48.61 | 3600 | 0 | 0.0502 | 0.042 | 67.867.1 |
| A757 | 05/12/16 | 09:13:07.74 | +47:42:30.32 | 3600 | 0 | 0.0517 | 0.015 | 70.269.6 |
| A1668 | 21+22/05/14 | 13:03:46.56 | +19:16:16.75 | 2524 | 0 | 0.0634 | 0.081 | 83.482.5 |
| A1795 | 01+02/05/13 | 13:48:52.45 | +26:35:34.71 | 3600 | 107.6 | 0.0625 | 0.012 | 82.281.4 |
| A2199 | 21/05/14 | 16:28:38.40 | +39:33:03.97 | 2700 | 0 | 0.0301 | 0.003 | 42.341.9 |
| A2457 | 13/10/14 | 22:35:40.74 | +01:29:05.76 | 3600 | 0 | 0.0594 | 0.074 | 78.777.9 |
| A2589 | 05/12/16 | 23:23:57.43 | +16:46:29.24 | 3600 | 0 | 0.0414 | 0.026 | 56.656.0 |
| A2622 | 16/10/14 | 23:35:01.71 | +27:22:15.58 | 3600 | 55 | 0.0620 | 0.050 | 82.281.4 |
| A2626 | 13/10/14 | 23:36:30.45 | +21:08:46.97 | 2700 | 0 | 0.0553 | 0.057 | 73.973.2 |
| A2634 | 06/12/16 | 23:38:29.23 | +27:01:50.15 | 3600 | 0 | 0.0314 | 0.062 | 43.643.2 |
| A2665 | 16/10/14 | 23:50:50.79 | +06:09:03.35 | 2700 | 75 | 0.0556 | 0.071 | 75.174.3 |
| IIZw108 | 27/11/13+15/10/14 | 21:13:54.99 | +02:33:54.79 | 5400 | 103 | 0.0494 | 0.063 | 66.665.9 |
| MKW3 | 21+22/05/14 | 15:21:51.53 | +07:42:34.78 | 3600 | 0 | 0.0450 | 0.072 | 60.359.8 |
| UGC03957 | 05/12/16 | 07:40:58.37 | +55:25:38.27 | 3600 | 0 | 0.0341 | 0.043 | 47.547.1 |
| Z2844 | 02/05/13 | 10:02:36.51 | +32:42:24.82 | 1800 | 65.6 | 0.0500 | 0.013 | 67.867.1 |
| Z8338 | 22/05/14 | 18:11:05.20 | +49:54:33.55 | 4100 | 0 | 0.0470 | 0.192 | 64.163.5 |
This paper presents a sample of local BCGs in X-ray bright clusters observed using integral field spectroscopy. The observations span a kpc field around each source, so that nearby neighbours and the BCG outskirts are captured in addition to the radius out to where the ICL is expected to become dominant. These results constitute the largest sample of spectroscopically observed ICL currently available. The analysis of the first three clusters is published in Edwards et al. (2016, hereafter Paper I). Section 2 describes the dataset, observations, data reduction, use of population synthesis models, and a discussion of errors and uncertainties. Section 3 presents the age and metallicity profiles of the BCGs, which generally fall from the core to the outskirts. The average velocity dispersion profiles are generally rising, but negative velocity gradients are seen in smaller, luminous BCGs hosted by clusters with low X-ray luminosity (). Most of the BCGs are found close to the X-ray peak: cool cores (CCs) and the presence of optical emission lines are observed in this dataset for 11 of the 23 systems (as listed in Table LABEL:tab:ObjectData). The few BCGs with large separations from the X-ray luminosity peak have the same average central velocity dispersion as the sample at large, but a smaller average effective radius. Section 4 uses the key results to argue for a two-phase formation model for the BCG and its outskirts and ICL where the core forms first and the outskirts assemble later. Stellar population and kinematic arguments are presented for the ICL as a distinct component. Section 5 provides our conclusions. Values of km/s/Mpc, are used throughout.
2 Observations and Data Reduction
The uniqueness of this dataset lies in its large field of view (FOV), which reaches the galaxy outskirts, far enough that ICL begins to dominate the light. Furthermore, it extends to kpc beyond the BCG core, the region occupied by bound companions that are likely to merge within Gyr (Edwards & Patton, 2012). Integral-field observations of twenty three BCGs are performed using the SparsePak instrument on the m WIYN telescope. The reduced spectra are matched to synthetic spectra in order to deduce stellar populations and galaxy kinematics. This section discusses the sample selection, data reduction, population synthesis modeling, and known errors and uncertainties within the data and analysis techniques.
2.1 Sample Selection
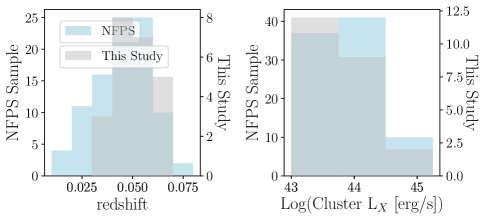
The sample is selected from the NOAO Fundamental Plane (NFP) survey (Smith et al., 2004), which itself is based on ROSAT X-ray bright cluster catalogues (Ebeling et al., 1996, 1998). Figure 1 shows the similarity in distributions of redshift and X-ray luminosity in the parent NOAO sample, with the subset of clusters observed in this program. No bias is assumed from looking only at the 61 northern targets. Twenty-five clusters have a redshift in the range and were considered for observation. This cut in redshift assures some level of uniformity across the sample. The ICL of clusters at is likely more contaminated by the BCG outskirts than those at 0.06, but is within a factor of 2 to the physical size being compared. Similarly, the linear size difference covered in a single fibre between and is comparable. The redshift limit also assures the observations extend to nearby neighbours and the ICL. This allows for a statistical comment on local X-ray bright BCGs with a quoted 95% confidence level and a 10% margin of error for the main derived parameters. BCG mass is known to correlate well with cluster mass (Edge, 1991; Hudson & Ebeling, 1997; Brough et al., 2005; Lauer et al., 2014) so starting with X-ray bright clusters of the NFP survey ensures a fairly uniform population of BCGs.
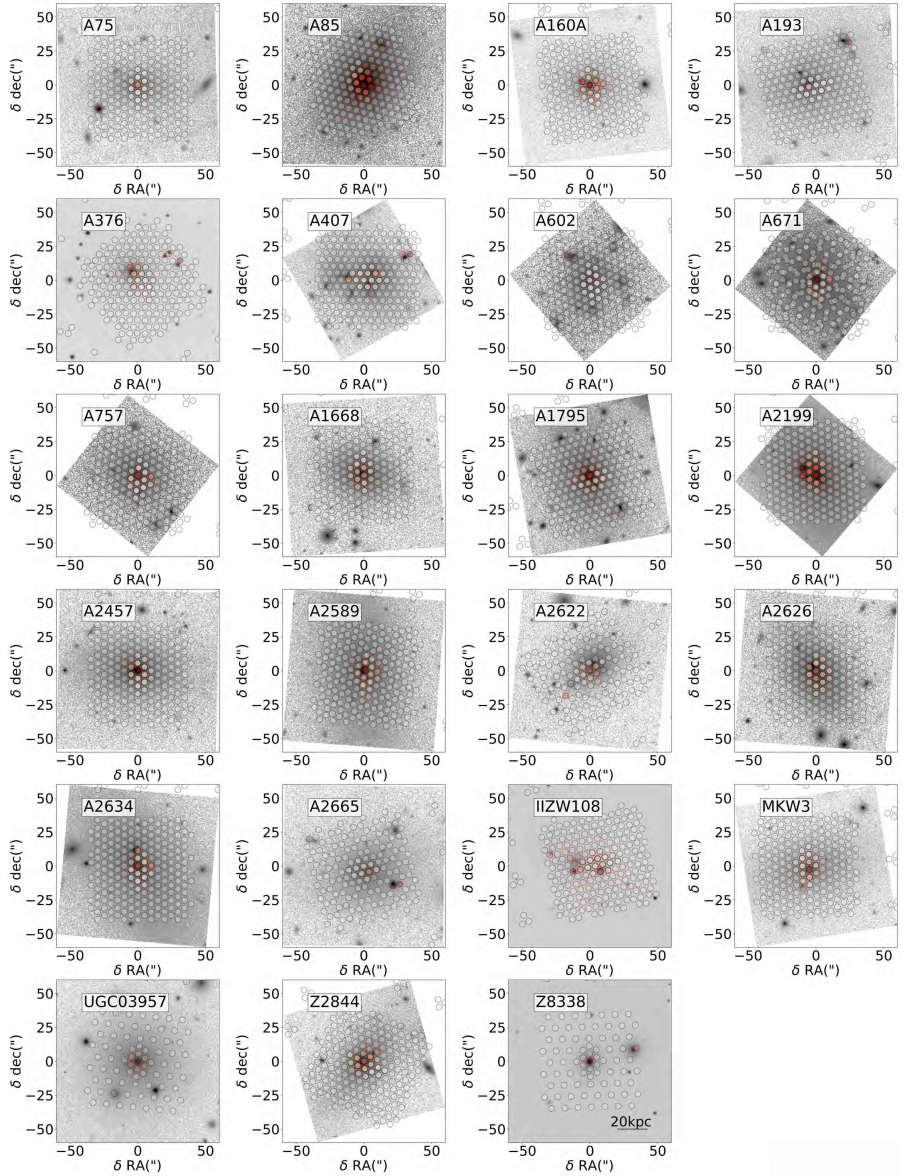
Twenty three clusters were ultimately observed, randomly chosen from the 25 possible, given limits of RA and airmass. These are shown in Figure 2, which presents an image for each target in the sample, overlaid with the position of the SparsePak optical fibres. The data capture several resolution elements across the BCG, and often include several high S/N projected companions.
Table LABEL:tab:obdat lists the 23 clusters that were observed with columns that list the cluster name, dates of observation, position and integration time of the central position, the rotator offset angle, the cluster redshift and extinction, as well as the dimensions of the observed area. The redshift and extinction values are taken from NED111https://ned.ipac.caltech.edu.
| Name | r200 | CC | MK | n | Lines | X-ray Sep | 1 ′′ | ||||
|---|---|---|---|---|---|---|---|---|---|---|---|
| () | (km/s) | (Mpc) | (′′) | (′′) | (kpc) | ||||||
| A75 | 0.42 | … | … | … | … | 8.08 | 21.86 | 4.74 | ✓ | 118.6 | 1.158 |
| A85 | 4.92 | 736 | 1.274 | 2.0 | 26.0 | 15.21 | 21.43 | 0.86 | ✓ | 3.0 | 1.026 |
| A160A | 0.18 | 560 | 0.970 | 0.0 | 25.0 | 11.82 | 20.38 | 1.04 | 23.7 | 0.865 | |
| A193 | 0.74 | 820 | … | 1.0 | … | 8.79 | 18.6 | 4.13 | 1.5 | 0.925 | |
| A376 | 0.68 | 975 | 1.689 | 0.0 | 24.4 | 14.13 | 25.76 | 8.00 | 2.3 | 0.907 | |
| A407 | 0.21 | 670 | 1.161 | 2.0 | 25.9 | 17.73 | N/A | N/A | 4.8 | 0.873 | |
| A602 | 0.53 | 675 | 1.169 | … | 24.2 | 7.92 | 21.18 | 3.30 | 110.8 | 1.141 | |
| A671 | 0.44 | … | … | 0.0 | … | 14.77 | 20.14 | 2.21 | ✓ | 77.6 | 0.942 |
| A757 | 0.46 | 381 | 0.660 | … | 24.5 | 5.60 | 20.80 | 2.17 | 216.0 | 0.976 | |
| A1668 | 0.88 | 476 | 0.824 | 0.0 | 25.2 | 9.51 | N/A | N/A | ✓ | 3.1 | 1.158 |
| A1795 | 6.33 | 725 | 1.256 | 2.0 | 25.7 | 16.90 | 20.94 | 1.88 | ✓ | 4.9 | 1.141 |
| A2199 | 1.90 | 647 | 1.120 | 2.0 | 25.7 | 18.13 | 21.18 | 1.40 | ✓ | 3.9 | 0.587 |
| A2457 | 0.45 | … | 1.400 | 1.0 | … | 10.95 | 21.10 | 2.60 | 3.0 | 1.092 | |
| A2589 | 0.89 | 583 | 1.010 | 1.0 | 25.4 | 15.65 | 28.54 | 9.52 | 1.0 | 0.786 | |
| A2622 | 0.51 | 942 | … | … | … | 9.90 | 24.53 | 6.13 | 2.6 | 1.141 | |
| A2626 | 0.97 | 681 | … | 1.0 | … | 16.98 | 24.10 | 37.52 | ✓ | 2.2 | 1.026 |
| A2634 | 0.48 | 692 | 1.199 | 1.0 | 25.5 | 14.70 | 20.33 | 3.16 | ✓ | 1.5 | 0.606 |
| A2665 | 0.93 | … | 1.500 | 0.0 | … | 13.57 | 23.94 | 4.15 | ✓ | 2.6 | 1.043 |
| IIZW108 | 1.09 | 399 | 0.692 | 0.0 | 25.6 | 29.54 | N/A | N/A | 2.3 | 0.925 | |
| MKW3 | 1.39 | 533 | 0.924 | 2.0 | 24.8 | 9.39 | N/A | N/A | ✓ | 9.0 | 0.838 |
| UGC03957 | 0.48 | 511 | 0.885 | 1.0 | 25.3 | 10.55 | N/A | N/A | 3.1 | 0.660 | |
| Z2844 | 0.30 | 462 | 0.800 | … | 25.4 | 9.69 | N/A | N/A | 2.1 | 0.942 | |
| Z8338 | 0.45 | 533 | 0.922 | … | 25.7 | 11.86 | N/A | N/A | ✓ | 1.0 | 0.890 |
Key physical properties of the BCG and its host cluster are listed in Table LABEL:tab:ObjectData. Columns 1-4 list the cluster’s name, X-ray luminosity, velocity dispersion, and . Column 5 lists is the cool core status, as defined in Hudson et al. (2010) and calculated using the data from the ACCEPT (Cavagnolo et al., 2009) database. The status for those clusters not in the database is taken from the existence of a central entropy dip, from a short cooling time, or a high mass deposition rate and referenced as follows: A1668 (Salomé & Combes, 2003); A160, A407, A671 and A2626 (White, Jones & Forman, 1997); A193, A376, A2457, A2665 (Lakhchaura & Singh, 2014); A2589, A2634, IIZW108, UGC03957 (Chen et al., 2007). The BCG K-band magnitude and effective radius, taken from 2MASS222https://irsa.ipac.caltech.edu/Missions/2mass.html, are then listed along with central surface brightness and Sersic index measured by Donzelli, Muriel & Madrid (2011). Whether emission lines are observed in the BCG is shown in column 10, and the separation between the BCG core and X-ray peak luminosity is given in column 11. The last column shows the arcseconds to kpc conversion.
2.2 Observations
The BCGs and associated standard stars were observed over the course of five observing runs from April 2013 – December 2016. SparsePak is a sparsely packed quasi-integral field unit with 82 fibres of which 75 are arranged in a grid of dimensions with a tightly-packed centre, and 7 are sky fibres located on the outside of two of the sides of the grid (Bershady et al., 2004). As such, each source has an FOV between kpc and kpc. The data is thus expected to reach the ICL, as Presotto et al. (2014) have found the ICL begins to dominate the light at kpc from the BCG core. This is further discussed in Paper I. In general, galaxies were observed in blocks of s exposures three times at each position (Table LABEL:tab:obdat) to help remove cosmic rays. Each target was observed with three pointings so as to fully integrate the field, cover all close companions, and oversample the BCG. The total integration times are typically of order one hour such that the wide-field IFU observations allow for high spectra within the inner 15′′ of the BCG. Stars and galaxies with fluxes 30 times fainter than the core can be distinguished and removed when necessary. The Å (km/s) spectral resolution is well-matched to the Å (km/s) resolution of the template spectra that will be used to find the best-fit model of the stellar populations and kinematics.
The nights varied in their cloud cover and the seeing ranged from about to . Cloudy conditions during the third night and part of the second night of the November 2013 observing run, resulted in some unusable data due to poor sky subtraction. During the October 2014 run many of these same objects were re-observed, but with an incomplete set of offset positions. Thus for clusters Abell 2665 and Abell 2622 data are presented for only two and one positions, respectively. For the present study, this has the effect of reducing the throughout the regions analysed. For Abell 376, the data were taken with two different rotator position offset angles, which results in a greater than average for this system. For Abell 1795, the position offsets did not completely line up, thus only one of the offset positions in the maps for this cluster is used. This incompleteness is not expected to impact the main results of this paper which rely on stacked region spectra (discussed in Section 2.4).
Abell 407 was observed on different nights during the same run. From comparing the sky-subtracted and flux calibrated spectra using standard stars, the stability of the flux calibration is estimated to be 4%. IIZw108 was observed over different runs with slightly different positional and rotational offsets. In this worst-case scenario, the flux calibration is stable to 7%.
2.3 Data Reduction
The data reduction is detailed in Paper I. Briefly, the images are bias, dark, and flat field corrected and sky subtracted. Cosmic rays and sky lines are removed and the spectra are flux-calibrated using the SDSS when available, and with standard stars taken during the run when no SDSS spectra exist as is the case for Abell 376. The spectra are all shifted to the rest frame wavelength.
2.4 Identifying region spectra
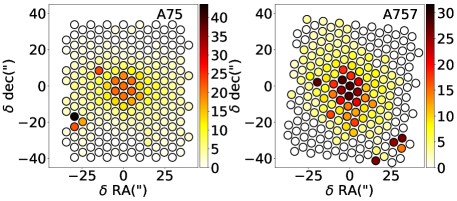
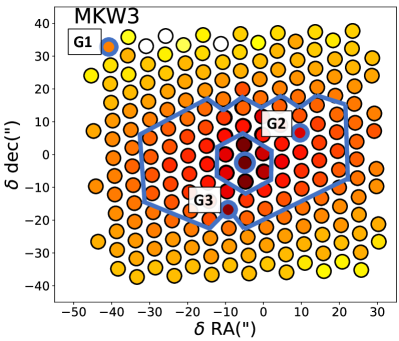
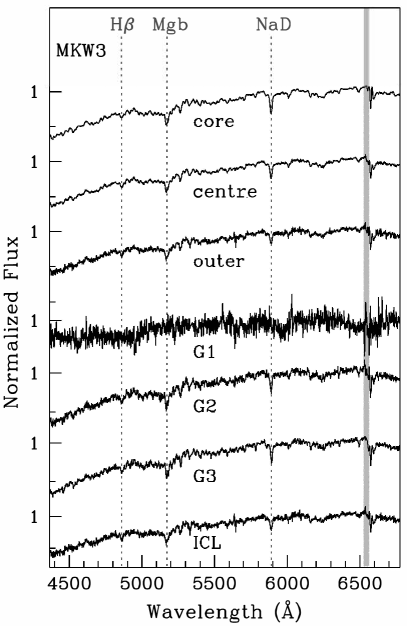
Figure 3 shows the per angstrom of the individual fibres for representative clusters Abell 75 and Abell 757. A value of is measured at a 5′′ spatial resolution for the inner 15′′ of the BCG. But, the drops down to at the outskirts of the field. The data are therefore binned to produce high regions for the population synthesis analysis. Figure 4 illustrates the regions in the case of MKW3: The BCG core (central ), the centre of the BCG (an annulus of the surrounding 5′′), the outer region (where the galaxy intensity is still high), and the ICL region, which includes the remaining fibres (beyond from the core). Stars and interloping galaxies are removed from the BCG and ICL regions.
The spectra of these various regions are shown in Figure 5. The highest region of the combined BCG core and bright companions includes only the aperture size of one fibre, but as there are 3 pointings required to fully integrate the field, the BCG core generally rises to . The ICL is binned using only fibres with . Each cluster contains between 70-100 fibres within the ICL region, such that the of the combined ICL spectrum is , as shown in Figure 5. It is certainly true that the majority of the ICL is beyond our FOV, however, the average stacked ICL spectrum that is constructed here matches well with the photometrically determined limit of kpc, where the light begins to be dominated by the ICL (Presotto et al., 2014).
2.5 Population Synthesis
The STARLIGHT (Cid Fernandes et al., 2007) code, which employs a full-spectrum fitting algorithm, is used to find the best-fitting model spectra. Several methods for obtaining stellar populations and kinematics from the reduced region spectra are explored as various model input spectra are used, including those of Bruzual & Charlot (2003), as well as models which include -enhancement from Walcher et al. (2009) and Vazdekis et al. (2015).
2.5.1 Full Spectrum Fitting

Paper I discusses the details of determining the best fit populations and kinematics using the full spectrum fitting code, STARLIGHT (Cid Fernandes et al., 2007) to determine the stellar populations by comparing to model spectra. There, a limited set of 54 models from Walcher et al. (2009) were used to determine the stellar populations. These models include -enhancement based on synthetic spectra from Coelho et al. (2007). The models are based on a Chabrier IMF (Chabrier, 2003), include ages from Gyr, metallicities in the range , and -enhancements of , and are run with the Calzetti et al. (2000) dust model. The stacked region spectra are run though STARLIGHT to find the best combination of single stellar populations that results in the lowest spectrum fit to the data.
In this paper, the same base set is explored, in addition to including the full set of age (MyrGyr) and metallicity () spectra and limiting to only an -enhancement of 0.4 as well as the same full set of -enhanced models from the newer Vazdekis et al. (2015) models taken from the MILES database 333http://www.iac.es/proyecto/miles/. Figure 6 illustrates how the results are sensitive to the number and variety of base spectra to which the observed spectra are matched. As expected, when exploring the results from different sets of base spectra, the individual values of age (and metallicity, not shown) can vary quite a bit. However, in the Limited Walcher, Full Walcher, Limited Vazdekis, and Full Vazdekis runs, core BCG ages of 10 Gyr or more dominate the sample, and younger outskirt ages are common among all runs. High core metallicites and low outskirt metallicities (not shown) are also common throughout the sample in all test runs.
2.5.2 Errors and Uncertainties in the Modelling
Results of population synthesis codes are subject to several well-known limitations such as the treatment of AGB stars (Maraston, 2011) and the age-metallicity degeneracy (Worthey, 1994). The results are also highly sensitive to the choice of input parameters such as the initial mass function (Conroy & van Dokkum, 2012) as well as choice of base spectra as discussed above and in Coelho, Mendes de Oliveira & Cid Fernandes (2009). Thus, any comparison to other samples should take into consideration these important limits and caveats. On the other hand, comparing the qualitative difference in the spectra of the different regions in each target within this sample should be straightforward.
To estimate the errors in age, and metallicity from STARLIGHT that are caused by the data quality, the following procedure is used, as discussed in Paper I: The program is run with the same initial conditions 5 times for each region, for each cluster. Each time, of the fibres are randomly removed from the median average stack. This results in errors of less than 10% in age and 15% in metallicity. The error on the velocity is 10 km/s and on the velocity dispersion is 20 km/s. In Cid Fernandes et al. (2005), the impact of of the observed spectrum on the STARLIGHT results were explored. They are able to recover mean stellar age and mean stellar metallicity to 0.1 dex, when the input spectrum’s . This serves as another motivation for using the higher stacked region spectra.
The results below are based on STARLIGHT runs using the full set of -enhanced models (Vazdekis et al., 2015). The average light-weighted age and metallicity for each region are reported in the figures of Section 3. The metallicities shown throughout represent for solar values which corresponds to metal content by mass for the Sun.
3 Results
An important step toward identifying and discerning the origin of the BCG and ICL is to compare the stellar populations and kinematics of both, using a large dataset. A smooth transition of properties would be expected if the two components share an origin, whereas dramatic breaks in the stellar populations and kinematics in the galaxy outskirts would be expected if the two are unrelated. In the analysis, single power-law fits are used as a way to distinguish whether or not the properties of the inner and outer regions differ. The calculated slopes and errors for the age, metallicity and velocity dispersion profiles are listed in Table LABEL:tab:FitData). This is chosen over a more complex fitting function so as to avoid over-fitting a few points with a more complex function. Also, the single power-law fits rely less on the exact definition of ’inner’ and ’outer’ as compared to simply calculating the difference of the properties of the inner and outer regions.
| Cluster | # | ||||
|---|---|---|---|---|---|
| A1668 | 0.44 0.11 | 0.04 0.05 | 0.12 0.11 | 4 | 28 |
| A1795 | 0.04 0.02 | 0.08 0.05 | 0.24 0.02 | 3 | 14 |
| A193 | 0.08 0.02 | 0.14 0.04 | 0.10 0.02 | 4 | 29 |
| A2199 | 0.08 0.08 | 0.26 0.11 | 0.17 0.08 | 4 | 36 |
| A2457 | 0.04 0.03 | 0.44 0.16 | 0.27 0.03 | 4 | 26 |
| A2622 | 0.01 0.00 | 0.13 0.01 | 0.15 0.00 | 3 | 17 |
| A2626 | 0.40 0.25 | 0.03 0.08 | 0.29 0.24 | 4 | 28 |
| A2665 | 0.00 0.01 | 0.08 0.05 | 0.30 0.01 | 3 | 13 |
| A376 | 0.00 0.01 | 0.02 0.01 | 0.10 0.01 | 3 | 18 |
| A407 | 0.07 0.07 | 0.21 0.13 | 0.03 0.07 | 4 | 19 |
| A75 | 0.00 0.00 | 0.09 0.03 | 0.09 0.00 | 3 | 13 |
| A85 | 0.14 0.06 | 0.15 0.09 | 0.02 0.06 | 4 | 28 |
| IIZW108 | 0.10 0.06 | 0.19 0.09 | 0.05 0.06 | 4 | 33 |
| MKW3 | 0.09 0.03 | 0.28 0.13 | 0.07 0.03 | 4 | 29 |
| Z2844 | 0.32 0.02 | 0.08 0.02 | 0.19 0.02 | 3 | 16 |
| Z8338 | 0.17 0.17 | 0.32 0.14 | 0.06 0.17 | 3 | 13 |
| A160 | 0.14 0.13 | 0.10 0.07 | 0.21 0.13 | 4 | 18 |
| A2589 | 0.18 0.08 | 0.21 0.03 | 0.19 0.08 | 5 | 33 |
| A2634 | 0.71 N/A | 0.07 N/A | 0.54 N/A | 2 | 33 |
| A602 | 0.21 0.06 | 0.18 0.11 | 0.16 0.06 | 4 | 18 |
| A671 | 0.24 0.12 | 0.01 0.00 | 0.09 0.12 | 5 | 33 |
| A757 | 0.57 0.08 | 0.5 0.06 | 0.10 0.08 | 4 | 18 |
| UGC03957 | 0.13 0.10 | 0.33 0.06 | 0.23 0.10 | 5 | 33 |
The stellar populations of regions within the BCG and ICL are explored, as are the dynamics of the BCG, ICL and host cluster. Unless in actively star-forming cool core clusters, all BCGs adjacent to their host cluster’s X-ray peak have cores dominated by very old high-metallicity stars, and have negative radial gradients of average age and metallicity. The average gradient of velocity dispersion () profile is positive, with the value of climbing toward the value of in many systems.
3.1 Stellar Populations: Age and Metallicity Gradients
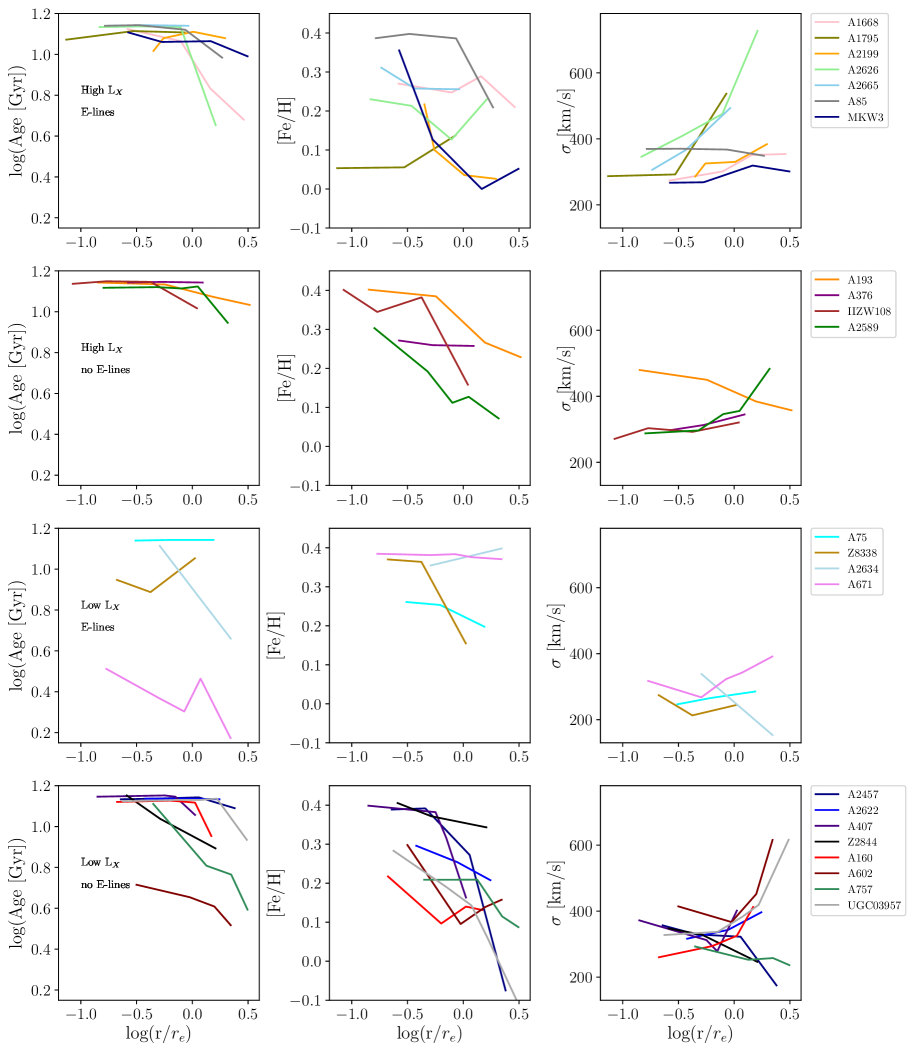
Figure 7 shows the best-fitting luminosity-weighted age, metallicity ([Fe/H]) and from stellar population synthesis for all regions with a , in each galaxy, as a function of distance from the BCG core. To better view the details for each cluster, the sample is separated by X-ray luminosity of the parent cluster with high values of on the top two rows, and low- on the bottom two rows. Negative age and metallicity gradients are common within the sample.
3.1.1 Negative age gradients
The left panels of Figure 7 reveal that the majority of BCG cores are composed of a very old stellar population resulting in an average BCG core age of Gyr. All of the BCGs with core ages Gyr are in low- clusters (0.610erg/s), however, there are only a small number of these younger BCGs, such that the average value of core age for the low- and high- samples are consistent within errors ( compared to ).
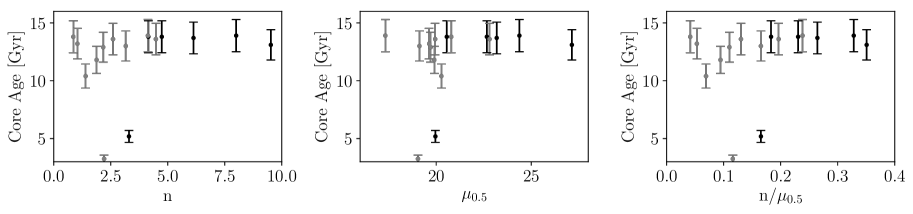
Figure 8 shows the core age of the BCG as a function of the inner Sersic profile and central surface brightness for 17 BCGs in our sample that were studied in Donzelli, Muriel & Madrid (2011). They calculate best-fitting values using photometric data in the R-band with the KPNO and CTIO telescopes. There is no evidence in this sample that the two BCGs with particularly young core ages (Abell 671 and Abell 602) exhibit extremes in their luminosity profiles. Rather, for the majority of this dataset, all core ages are old, regardless of central surface brightness or Sersic index.
The generally high values of core age are further illustrated in the histogram of the first panel of Figure 9. Separating the galaxies in cool core from those in non-cool core systems has an insignificant effect on core age (, respectively), and separating on presence of emission lines results in consistently old average core ages, to within errors (, respectively).
For 20/23 galaxies, the luminosity-weighted age remains above within one effective radius, with 2/3 of the young cores existing in low- clusters and 2/3 having emission lines.
Overall, the ages continue to decrease to the outskirts and ICL (Figure 7, left panels). This decrease is parameterized with a linear fit to the logarithmic data at each region, for each galaxy. The majority of the gradients are negative, with an average slope of ( and , for the high and low- samples, respectively). Figure 9, top-left panel shows that most systems have very old core populations. The slopes in age for these systems are either flat or decreasing. The four galaxies with increasing slopes all show emission lines (Figure 9, top-middle panel), and none are in known non-cool core clusters (Figure 9, top-left panel).
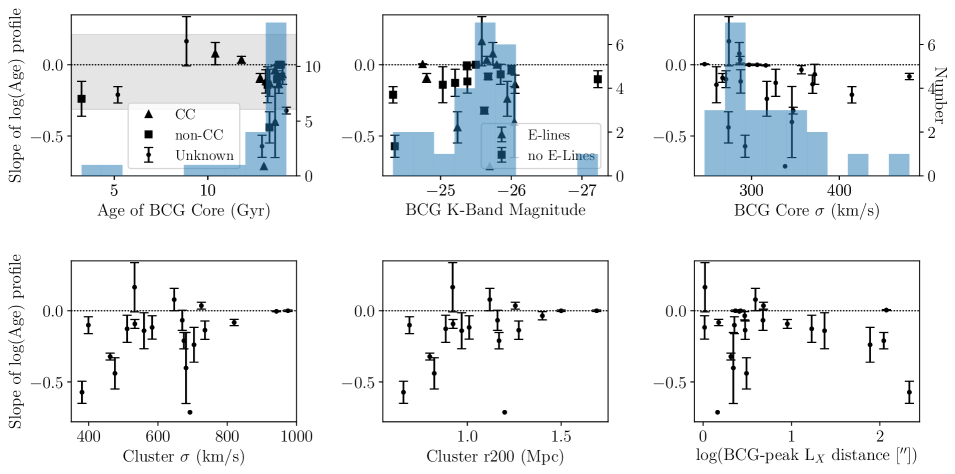
The gradient in age is plotted with several other properties of the BCG and cluster (Figure 9). This exercise finds that those BCGs with the steepest negative age gradients (slope) are found in small (Mpc) clusters (bottom-middle panel) with low km/s (bottom-left panel). The physical FOV of SparsePak covers kpc, so the physical coverage of these small systems is well beyond the galaxy . The steep negative slopes can then be explained if a larger portion of the galaxy outskirts (and presumably more ICL) is observed.
On the other hand, Figure 9 shows that there are six systems that do not have negative gradients. These are mostly line-emitting galaxies co-spatial with the X-ray emission peak (bottom-right panel), in large, massive clusters with Mpc and km/s. The galaxies themselves have low core (5/6 have km/s) but large K-band magnitudes (4/6 have ; top-middle panel). Abell 1795 and A2199 are in cool core clusters and show strong H and H line emission. Abell 2665 is likewise in a high- cluster and has emission lines, though it is not in a cool core cluster. A75 has emission lines. A1795 and A2199 have the highest positive age gradients, also have youngest average core ages, given they are in high mass clusters. Optical emission lines and new central star formation are often (Crawford et al., 1999; Edge et al., 2002; Cavagnolo et al., 2008; Tremblay et al., 2015), but not always (Edwards et al., 2009) associated with a cooling core cluster. If this activity provides a small amount of bright stars, it could make an otherwise negative gradient age gradient flat or positive. Circumnuclear discs (Tremblay et al., 2015) and dust lanes of order 1 kpc (Laine et al., 2003) have been seen in BCGs. The SparsePak core fibre covers between 2-6 kpc for these BCGs. Bright circumnuclear emission from a star forming ring may regulate the velocities and decrease the core velocity dispersion. In this scenario, one would expect that for systems with positive age gradients, their low core would introduce a positive gradient. Indeed, 4/6 of BCGs with positive or flat age gradients also have positive gradients. Within the sample as a whole, there are 3 other BCGs in CC clusters that have emission lines - but those systems have negative age gradients. For each of these, the max FOV is over kpc, so any starburst populations within the core are more polluted by quiescent regions, and perhaps a younger ICL component has evened things out, consistent with the large step observed in the ICL regions of MKW3 and A85. The FOV covered by the most extreme positive age gradient BCG is only kpc, the smallest of the sample. This reaches out to for the galaxies, but is likely too small to include a significant ICL component (Figure 10). A2622 has insufficient information to be compared to the other BCGs as it has unknown cool core status.

The cluster redshift and galaxy core metallicity were also explored, but show little correlation with age gradient.
3.1.2 Negative metallicity gradients
The core values of metallicity are strongly supersolar () for all BCGs except A1795 (Figure 7, middle panels). A1795 is a well-studied CC cluster with known star formation and complex morphological and spectral properties. In particular, the X-ray emission extends in a southern tail (Fabian et al., 2001; Crawford, Sanders & Fabian, 2005) and a long H emitting tail of gas also extends South from the core (Cowie et al., 1983; McDonald & Veilleux, 2009). SparsePak can image this H emitting tail, and in this analysis, the fibres that overlap with the central and outer regions which include the H emitting tail have been removed. The core fibre shows strong H emission. The low metallicity of the core may indicate a population of stars made from more pristine gas may have been added recently. This is consistent with a CC origin, or the merging of a smaller galaxy, but not with early star formation in high-density peaks associated with most of the core stellar population.
There is an overall trend for the metallicities of the galaxies to decrease from the supersolar values found in the core, to solar toward the ICL (Figure 7, middle panels). However, in contrast with the decease in ages, a negative gradient tends to start before . There are only two BCGs (A1795, A2634) with strong positive metallicity gradients, and they are again in CC systems (Figure 11, top-left panel) and line emitting galaxies (Figure 11, top-middle panel). A1795 has a particularly low value of central metallicity, where the new star formation could be coming from a reservoir of relatively pristine gas. All other systems have flat or falling metallicity slopes.
The steepest negative metallicity gradients are in clusters with low- and km/s (Figure 11, bottom-left panel).There is little displacement of the BCG inside the cluster (bottom-right panel). The galaxies themselves are massive (Figure 11, top-middle panel) with small . These are dense galaxies in low- clusters, where new star formation does not occur, but a lot of time has passed for the metals to fall toward the gravitational potential and where no recent large-scale cluster mergers have upset the metallicity gradient.
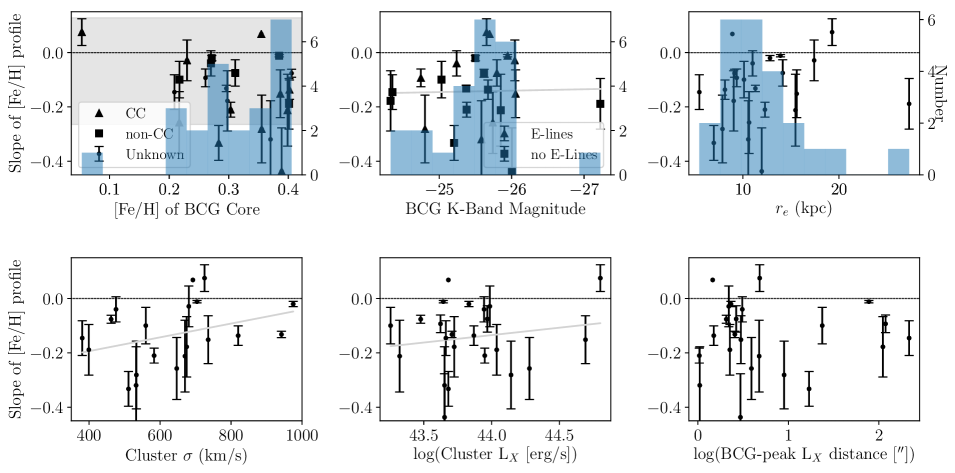
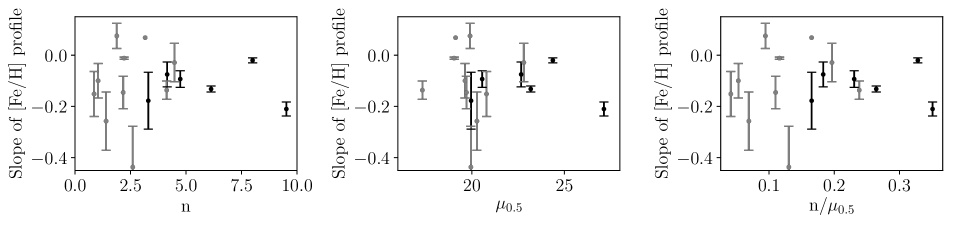
Figure 12 shows the slope of the profile against the inner Sersic profile and central surface brightness for 17 BCGs in our sample that were studied in Donzelli, Muriel & Madrid (2011). We find no evidence in this dataset for a correlation between either the surface brightness slopes, parameterized by the Sersic index, n, or the central surface brightness with the gradient in metallicity.

3.2 BCG and Cluster Dynamics
Three dynamical measures are presented in this paper. The first is maps of the peculiar velocity with respect to the cluster recessional velocity which are presented in Figure 13. The second is the velocity dispersion within each BCG region, which is presented in Figure 7, above. A third measure attempts to describe how dynamically disturbed or relaxed the cluster may be, and is parameterized by calculating the distance between the BCG peak to the peak of the X-ray luminosity.
3.2.1 No large scale rotations in BCG sample
The majority of BCGs are dispersion dominated, only A160, A602, A757, A2199, A2634, MKW3 and Z8338 show regions where the average velocity is at or near the value of . Furthermore, any large scale rotations measured from concentric rings around the BCG core, would be diluted. Thus, only the spectra throughout the inner parts of the BCG are examined. These maps (Figure 13) provide no evidence for rotation speeds greater than the minimum region velocity dispersion, within the inner at the given resolution; therefore no correction for rotation is applied to the other dynamical properties studied. Jumps in the velocity are explained by the presence of nearby neighbours and multiple cores. For example, in A2199 a high secondary core is moving with respect to the rest of the BCG at km/s (Figure 13). Evidence for rotation speeds greater than km/s are seen only in six clusters (A193, A757, A2622, A2626, IIZW108, and MKW3s). All of these have multiple cores or nearby galaxies in projection which could account for the velocity differences (Figure 13). Newman et al. (2013) likewise found little evidence for rotation in a set of seven BCGs.
3.2.2 Positive velocity dispersion profiles rise to cluster value
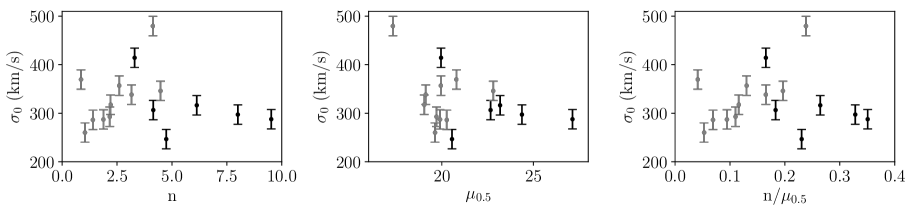
Figure 14 shows the central velocity dispersion as a function of Sersic parameters for the 17 BCGs studied in Donzelli, Muriel & Madrid (2011). Values for most BCGs are km/s. There is no evidence in this sample that systems with very flat cores (low n), or low central surface brightnesses have either higher or lower central velocity dispersions than other BCGs.
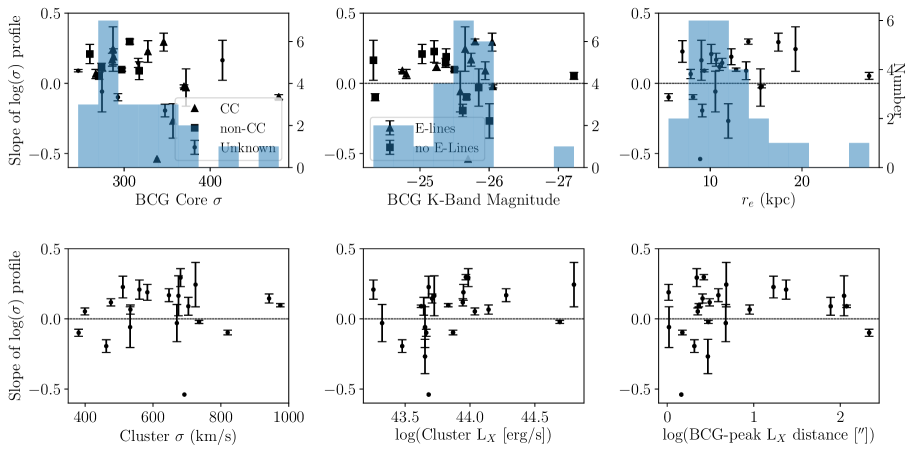
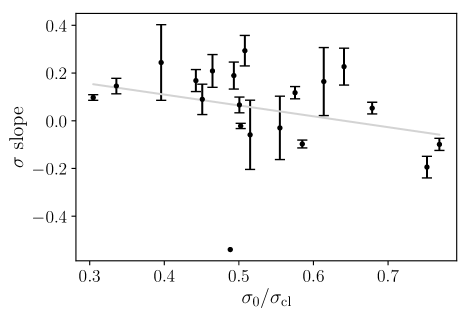
Most of the BCGs (17/23) have rising or flat velocity dispersion profiles, as can be seen in Figure 15 (see also Figure 7). The value of the slope is determined by the velocity dispersion of the ICL, as the core value is fairly constant throughout the subsample. Figure 16 shows that a variety of Sersic parameters are seen throughout the sample. However, those with negative velocity dispersion slopes tend to have fainter central surface brightnesses and flatter cores.
For the BCGs with positive velocity dispersion slopes, the value of the rises toward that of the cluster as a whole, as can be seen in Figure 17. Assuming equilibrium, positive slopes are expected if the ICL follows the cluster potential rather than that of the galaxy. For a galaxy inside a more massive host cluster, one would expect to start to see rising velocity dispersions if the ICL stars follow the cluster potential, forming a population dynamically distinct from the BCG. The rising velocity dispersions are seen in all types of galaxies and host clusters (Figure 15). Cluster scaling relations would suggest that those with higher are more massive clusters with deeper potential wells. There are only two high- clusters that do not have rising . A85 is pretty close to flat. A193 has clear multiple cores which may be a signal of a recent upset in dynamical equilibrium. This illustrates the difficulty in disentangling the physical processes causing a variation in velocity dispersion. Projected companion galaxies are the subject of a forthcoming paper.
As for the low- clusters, A407 has a flat profile. This cluster is believed to be currently forming its BCG (Schneider & Gunn, 1982; Mackie, 1992; Biju et al., 2017) with 9 bright red galaxies occupying the geometric centre. There are two X-ray peaks on either side of the proto-BCG. It is unlikely in dynamic equilibrium. Z8338, A2457, AZ2844, A2634 have falling velocity dispersion profiles. Most of the spread in the velocity dispersion happens beyond .
For the six BCGs with falling velocity dispersions, most (4/6) are in low- clusters, only A85 has kpc, and all are bright with . Further, none of them are in known non-cool core clusters, they all have high central metallicities (), and 4/6 have high central ages (Gyr). Thus, the subset of BCGs with negative velocity dispersion gradients are massive galaxies in low X-ray luminosity clusters. This is expected if the galaxy mass profile is dominating the stellar motions, further discussed in Section 4.4.5. As they are in cool core clusters, these systems have had enough time without being disturbed by cluster-scale mergers to have come to equilibrium.
One potential criticism of a fixed FOV observational study is that the falling profiles may not be observed out to the physical scale of the ICL. To verify the fixed width FOV is not an issue for this result, the physical size of the BCGs and the FOV in kpc for the falling sample was compared to that of the BCGs with positive slopes. The negative gradient BCGs are within the range of the positive gradient BCGs in terms of size (kpc), and how far the observations reach past the cluster core. For example, both sets cover at least out to kpc from the core. Only one of the six negative gradient BCGs is observed with an extent less than 25 kpc on a side. Together, this means that the field of view covers out to for the negative gradient sample and for the full sample (Figure 10).
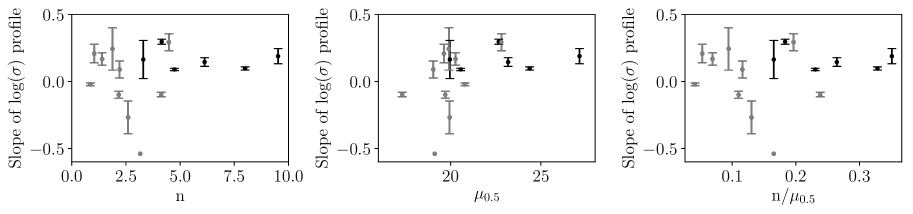
Figure 17 shows that for the BCGs with flat and falling velocity dispersion slopes, the value stays low, hovering around the value of km/s. The figure also shows that there are some clusters with large values of velocity dispersion, where the ICL region does not appear to follow the potential of the host cluster, even though they lie on the X-ray peak (A376, A193, A85, A1795, A2634. All of these except A1795 have flat or falling slopes. One (A2634) has a smaller physical FOV, and so the observations may not reach the ICL. A2634, A1795, A85 are all massive, bright () galaxies, so perhaps the host galaxy gravitational potential is dominant. Inspection of the velocity maps shows that A193 may have some rotation, so may not be a good mass indicator in this case. A376 remains an outlier.

3.2.3 Cluster Environment
Flat velocity dispersion profiles are found throughout the range of observed cluster velocity dispersions (Figure 15). There is no strong correlation with age, , or slope and the distance between the BCG and the cluster centroid. However, most BCGs that are offset from the X-ray peak, have slightly negative metallicity gradients and moderately rising profiles, consistent with that of the parent population.
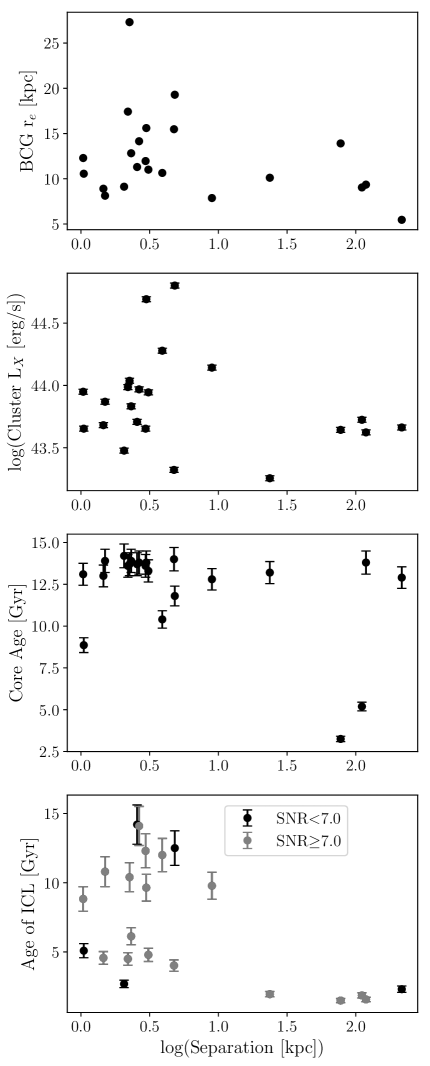
Figure 18 shows the separation of the BCG from the X-ray luminosity peak against several properties of the BCG and host cluster, including BCG size (), cluster X-ray luminosity, BCG core age, and ICL age. The few BCGs with large separations from the X-ray luminosity peak are smaller in size, are found in lower X-ray luminosity clusters, and have younger ICL age. They have a median effective radius of kpc, compared with kpc for BCGs close to the cluster centre. If the formation of BCG outskirts includes a component from minor merging, one would expect the observed result: that the large BCGs were more centrally located, where the galaxy density is highest and the rate of gravitational interactions is higher. Furthermore, minor merging is thought to cause an increase in BCG size, without significantly increasing the mass.
For the BCGs with large separations from the X-ray peak, the outermost region (labelled here as the ICL,) is likely more heavily weighted by the galaxy’s own outskirts, as the ICL is usually more concentrated in the core of the cluster. Thus, the especially young ages being measured, are likely those of the outskirts of these galaxies, which may be new arrivals into the cluster.
4 Discussion
An analysis of the stellar populations and dynamics for the largest sample BCGs observed with integral field spectroscopy beyond , are presented above. A discussion of the ages, metallicities and velocity dispersions of these 23 BCGs in X-ray luminous clusters follows.
4.1 The ICL is younger than the BCG
4.1.1 Age of the BCG core
This study finds that the BCG cores are very old, with 70% of the population having average core ages of Gyr, and 87% having core ages above Gyr, out to , as has been seen in previous studies (Postman & Lauer, 1995; Brough et al., 2007; Bildfell et al., 2008; Loubser et al., 2009; Coccato, Gerhard & Arnaboldi, 2010; Bender et al., 2015). Old stars in massive galaxies are expected in the downsizing scenario (Treu et al., 2005), where the largest galaxies are formed first. The semi-analytic models of De Lucia & Blaizot (2007) predict that most stars of today’s BCGs formed by (Gyr). This picture is supported by these data.
The Oliva-Altamirano et al. (2015) study finds that 6/9 of their BCGs have intermediate age cores (Gyr). Their population is at a slightly higher mean redshift of and they define their central region as less than , which encompasses the core and central regions of the present sample. Even considering a 1.3 Gyr evolutionary correction and the core and central regions together, only 4/23 of the present sample have intermediate core ages, a much smaller fraction. One unknown in the Oliva-Altamirano et al. (2015) sample is whether the systems are in high or low- clusters. For low- clusters in this study, the fraction of intermediate ages is higher (3/12). Furthermore, the youngest BCG cores are mostly line-emitting galaxies in CC clusters, as previously seen by Loubser et al. (2009) and Bildfell et al. (2008). Perhaps the Oliva-Altamirano et al. (2015) sample is dominated by cool cores clusters.
Loubser & Sánchez-Blázquez (2012) and Oliva-Altamirano et al. (2015) measure flat or slightly rising age gradients. This is also consistent with the present study. When constraining the SparsePak data to within most of the age gradients are flat; they do not tend to decrease until beyond . For example, A376 is a common galaxy to both this study and Loubser & Sánchez-Blázquez (2012). While its age stays constant to , the picture is quite different beyond .
4.1.2 BCG age beyond
This is the first study to present a large sample of spectroscopically derived stellar populations of BCGs to beyond . In this sample of X-ray selected BCGs, negative age gradients are common: 6/23 show strong negative age gradients and 11/23 show weak negative age gradients. They likewise take hold sharply beyond , consistent with being a separate component from the BCG core. Exquisite IFU measurements of the BCG in Hydra I found negative age gradients beyond (Barbosa et al., 2016). The present study shows this is a common occurrence for local X-ray bright BCGs.
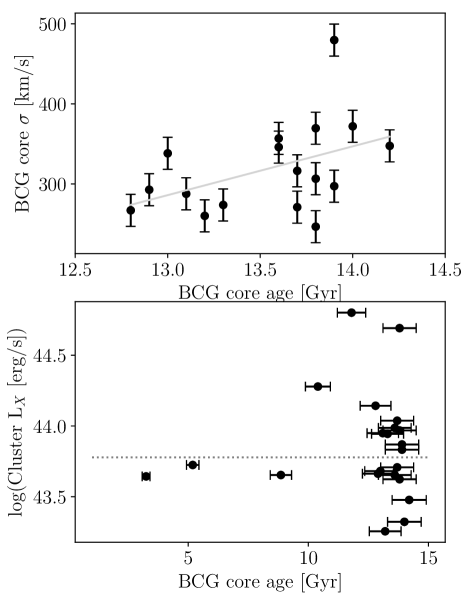
The three BCGs studied in Brough et al. (2007) were all found to have uniformly old populations out to . This is not at odds with the present findings, as six of the BCGs in the present sample show flat and positive age gradients beyond . The three positive age gradients of this sample are associated with central emission lines and CC clusters. The Brough et al. (2007) study also found a correlation in age with galaxy mass and with cluster . Considering only BCGs with central ages above Gyr, Figure 19 (top panel) also presents a trend in central age with galaxy mass, in this case indicated by central velocity dispersion. But, the trend does not exist over the entire sample. The core age of BCGs is higher in the high- sample, but this is only because all of the core ages below Gyr belong to the low- subsample (Figure 19, bottom panel).
4.1.3 Age of the ICL
The average age of the ICL in this study is Gyr, compared to Gyr for the BCG core. This is in line with colour-based ages of the photometric studies of BCGs using HST data. Montes & Trujillo (2018) find negative colour gradients beyond 10 kpc from the galaxy core with age differentials of Gyr at kpc. This is in great agreement with the present study. The photometrically determined ages continue to drop, beyond what the SparsePak FOV covers, out to kpc from the BCG core, where the ICL ages ultimately become Gyr less than those of the cluster galaxies.
The stars of the ICL formed more recently than those that make up the BCG, and according to downsizing, this would happen in lower-mass galaxy haloes. While the average value of the ICL is young compared to its host BCG, the ICL ages measured here vary widely from very old (Gyr; A2457) to very young (Gyr; A671), implying the build up of the ICL is an ongoing process. An ICL dominated by old stars reflects that of the host BCG observed by Melnick et al. (2012). While an old ICL is not a common case in the present sample, it is occasionally seen (for example, in A2457).
Note that the young ICL component is not associated with CCs as is the case for BCG cores.
4.2 BCG formation is a two-phase process
Negative metallicity gradients have been interpreted as supporting the two-phase build up, with low metallicity outskirts signaling stars that formed in shallower potentials, subsequently joining the main galaxy though mergers. The change in the metallicity from the BCG core to outskirts is discussed in this context.
4.2.1 BCG metallicities
In this sample, 91% of the core metallicities are above 0.2. Such high central metallicities are ubiquitous throughout the quoted studies above, as expected for massive galaxies. In contrast to the ages, which remain high out to , the metallicity gradients are set up well within . Eleven of the sample have steep negative gradients , ten have moderately negative gradients, and two have positive gradients. Smaller samples of the metallicity gradients in BCGs have shown shallow (Oliva-Altamirano et al., 2015) and steep metallicity gradients (Brough et al., 2007). The Loubser & Sánchez-Blázquez (2012) sample is also dominated by negative metallicity gradients. The two samples share a similar range in core and metallicity gradients. A correlation between the two is found in Loubser & Sánchez-Blázquez (2012) and for the 3 BCGs of Brough et al. (2007), but it is not recovered here. Loubser & Sánchez-Blázquez (2012) also measure a weak correlation with the K-band magnitude of the galaxy (which was not seen by Brough et al. (2007)). K-band magnitude, cluster , and cluster velocity dispersion were explored in Figure 11. This dataset shows no evidence for a correlation with K-band magnitude ( ). Brough et al. (2007) find a correlation with . This data is unable to support or refute the correlation with as the trend is unreliable ( ), being dominated by one exceptionally high luminosity point. However, a weak trend is measured with the cluster velocity dispersion ( ).
Cosmological simulations predict the formation of steep radial metallicity gradients ( to ) when galaxies are formed through dissipative collapse (Kobayashi, 2004; Hirschmann et al., 2015), and a flattening of the gradients governed by merging history (Hopkins et al., 2009). This naturally accounts for a diversity in metallicity gradients, and in this picture, the galaxies with more recent merging histories would have shallower metallicity gradients. All the galaxies with large separations from the X-ray peak have shallow metallicity gradients. Loubser & Sánchez-Blázquez (2012) find a correlation with separation between the X-ray peak and the BCG which is not recovered in this study. A major merger between clusters would bring a large number of galaxies within the vicinity of the cluster core, increasing the possibility for merging and encounters with the BCG. The steepest metallicity gradients are in clusters with low- and low . These may have just formed – allowing for less time to encounter a major merger. They are also in cool cores and close to the X-ray peak, evidence that no cluster-scale merging has happened recently. The large scatter in metallicity gradients reflects the diversity in the individual cluster’s merging history.
4.2.2 Metallicity of the ICL
The ICL stars formed more recently, and from gas that has a range of metallicity. The metallicity of our ICL regions range from to . A broad range in metallicity could be explained from gas or stars that join the ICL through gravitational interactions with the BCG, providing lower mass galaxies with lower metallicity gas or stars. But this would have happened after the core and central parts of the BCG were formed. This older, more metal-rich BCG, compared to ICL is also found in cosmological simulations analysed by Cui et al. (2014).
The average is , which is much lower than the average of the core (). Within the context of hierarchical building, the mass-metallicity relationship (Gallazzi et al., 2005) can help identify progenitors of the ICL. At 40 kpc, it suggests they are massive galaxies with . Following the measured average gradient for local BCGs, at kpc from the core, the metallicity would be about and the corresponding progenitor mass would be .
The photometric studies of ICL from Montes & Trujillo (2018) also find negative metallicity gradients in 4/6 of the Frontier Fields. The metallicites measured at 40 kpc () are in line with this survey’s results, and continue to much lower values at kpc from the BCG core (), as expected given the strong radial gradients. At kpc, the ICL metallicity is similar to the Milky Way outskirts, and plausible ICL progenitors would be galaxies. Coma and Hydra I haloes show low metallicity, but old stars dominate the ICL, such that stripping from massive early type galaxies are likely sources (Coccato, Gerhard & Arnaboldi, 2010; Barbosa et al., 2016). Note that merging today with an galaxy would constitute a minor merger with the BCG, normally considered to be a mass ratio of 4:1 or greater.
4.2.3 Population synthesis - beyond the average age and metallicity
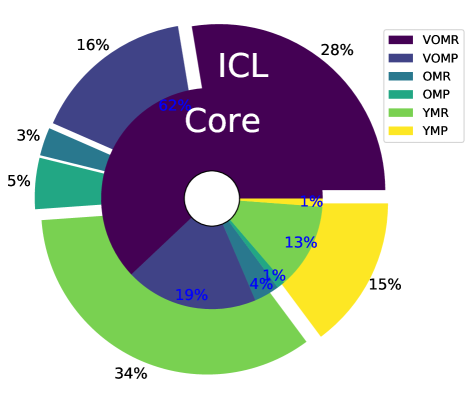
The combined spectra average out any inhomogeneous elements to the ICL populations at physical scales smaller than the analysed regions. Thus, although the physical location of separate populations cannot be garnered in this analysis, stellar population synthesis does return the fractions of the single stellar populations required for best-fitting. Figure 20 shows the percentage of individual populations that make up the average populations. The make-up of the average core and ICL is very different, although all populations are found in both regions. The ICL has very old metal-rich (VOMR) populations, which is the dominant core population, and suggesting some shared formation history with the BCG.
This information from population synthesis can be used to test some of the predictions from cosmological models. In the models of Murante et al. (2007), 50% of the ICL stars come from the progenitors that form the BCG, and another 25% from the progenitors that form the other large red galaxies in the cluster. Even beyond 100 kpc, the ICL stars are mostly sourced from what are today the other massive cluster galaxies. Figure 20 does show that of the populations of the observed BCG cores are shared with the ICL, however, the much younger ages and lower metallicities of the ICL suggest a source other than cluster LRGs. On the other hand, the models of Martel, Barai & Brito (2012) and Contini, Yi & Kang (2018) find that the majority of the ICL is from galaxies, consistent with the observation that the average metallicity of the ICL is lower than that of the BCG. Figure 20 shows the ICL contains 36% metal-poor (MP) populations, compared to 21% metal-poor (MP) populations in the BCG core.
Note that the comparisons above are first-order estimates. Extracting information for simulations that can then be compared to observations is not trivial. The basic approach consists of applying to simulation results the same methods that are used with actual observations. Several studies have addressed this issue, and shown that results can be quite sensitive to the observational parameters used (Dolag, Murante & Borgani, 2010; Tang et al., 2018).
4.3 Some local BCGs are still assembling
Jimmy et al. (2013) find a diverse merging history for four BCGs. However, with this larger sample of uniformly massive BCGs in massive clusters, we find little evidence for rotation greater than km/s within , consistent with other recent studies of larger samples (Newman et al., 2013; Veale et al., 2018; Loubser et al., 2018), supporting the idea that any mass added to BCGs in the current epoch generally builds through minor mergers.
In their large photometric study of BCG+ICL, Kluge et al. (2019) find the brighter systems have a larger fraction of faint light, are in richer, more massive and larger clusters, suggesting the ICL grows with cluster growth. On the other hand, Brough et al. (2002) found that BCGs in high- clusters (; A1795 and A85 in this sample) have uniform K-band magnitudes from redshifts 0.02 to 0.8, consistent with not experiencing significant stellar mass evolution since . In low- clusters, the K-band magnitude of the BCGs are scattered, suggesting they are still increasing in mass. The high- BCGs are larger and have fainter mean surface brightnesses than the low- counterparts (Brough et al., 2005), signaling they have undergone more accretion and assembled their mass at . The BCGs in low- clusters are still assembling. Two possible cases are present in this sample: IIZW108 and A407. In these two clusters, the large number of similar luminosity and colour galaxies appear to still be undergoing BCG formation by major mergers, as must have been common during the formation of galaxies in the early universe (Contini, Yi & Kang, 2018).
4.4 The ICL is a distinct kinematic component, separate from the BCG
The kinematics of planetary nebulae in galaxies in the Virgo cluster have been studied by many authors (Longobardi et al., 2013, 2015; Hartke et al., 2018; Longobardi et al., 2018). These studies have found that in M87 and M49 the planetary nebulae of the ICL have different velocity and spatial distributions than those in the BCG halo. Additionally, the planetary nebulae in the BCG are found to be older and more metal-rich than those in the ICL. This is in line with the different stellar populations we have discussed for the BCG and ICL stars. Below, we discuss kinematic evidence in our dataset that also suggests the BCG and ICL are different components.
4.4.1 Rising velocity dispersion profiles are common among BCGs, when observed beyond
Two-thirds of the BCGs of this X-ray selected sample exhibit positive velocity dispersion gradients.
On the other hand, this is uncommon in the general population of elliptical galaxies (Carollo et al., 1995; Gerhard et al., 2001; Padmanabhan et al., 2004) where (González, 1993). None the less, rising velocity dispersions have been observed in BCGs (often cD galaxies) since Dressler (1979) observed the BCG in A2029. A2029, however, remained essentially an outlier in the following decades, when data was not observed much beyond (Tonry, 1983; Fisher, Illingworth & Franx, 1995; Loubser et al., 2008) or samples remained small (Brough et al., 2007). Several of the galaxies observed in this paper had already been observed out to , and were determined to have falling profiles (A85, A2634, A193, A376, A2199, A2589, A2622). Only A85 and A2634 remain falling beyond , all other profiles are seen in the right panels of Figure 7 to rise past this point.
Newman et al. (2013) observe 7 BCGs at to finding all 7 have rising velocity dispersion profiles, and recent spectroscopic surveys of the MASSIVE team (Veale et al., 2017, 2018) and Loubser et al. (2018) have likewise found a significant fraction of rising velocity dispersion profiles for BCGs. The MASSIVE survey is an IFU survey of massive red galaxies that covers a similar extent at a similar spatial resolution as the present study, but only includes a few BCGs. The Loubser et al. (2018) long-slit study observes 35 BCGs at with twice the spatial resolution as the present study, but only out to kpc. They find a similar fraction of BCGs with positive velocity dispersion slopes (69%).
4.4.2 Signature of the host cluster halo
One interpretation is that the large velocity dispersions are signaling the large total mass-to-light ratio of the host cluster. If the ICL stars are kinematically connected to the underlying massive cluster potential, rather than to the BCG, positive velocity dispersion slopes would be expected, where the velocity dispersion of the ICL eventually reaches that of the host cluster. This was seen in Misgeld et al. (2011) and Richtler et al. (2011) for Hydra I using globular clusters, as well as for A2199 in Bender et al. (2015) with the diffuse stellar light. There are 7 BCGs in the present sample with ICL region spectra that have , which indeed show a trend of the ICL velocity dispersion increasing to the value of the cluster velocity dispersion, illustrated in Figure 17. Bender et al. (2015) concluded that the outer diffuse stellar component is recognizable not from the photometry, but rather the kinematics. As in this study, they find A2199 to have old, and slightly metal-rich populations. When looking at the present sample of BCGs as a whole, the ages and metallicities also appear to define the outer halo as a separate component, apart from the BCG.
4.4.3 Mass of the galaxy
Complicating this simple picture are the isolated, satellite and brightest group (BGG) galaxies observed by Veale et al. (2017, 2018) out to kpc from the galaxy core. All types of galaxies are found to contain some fraction of rising, falling and flat velocity dispersion profiles. Surprisingly, the highest velocity dispersion slopes are the satellite galaxies. It would be interesting to determine whether the velocity dispersion of satellite galaxies rises all the way to the cluster value. Veale et al. (2018) discuss the possibility that the physical mechanism behind the rising velocity dispersions in central BCGs and satellite galaxies may differ, where subhalo masses and velocity anisotropies may play a role. They find a strong trend with galaxy mass, where their highest mass bin () has the highest fraction of positive velocity dispersion slopes (8/11). This is in contrast to this sample of only BCGs, where no trend with galaxy mass is observed (either measured by or ). Perhaps the mass dependency is coming from the satellite galaxies. Note that the single power-law slopes calculated for the present sample are not exactly comparable to those of Veale et al. (2017), who use a broken power-law fit. The more complex fit is possible because their sample is more local, translating into a higher physical spatial resolution. For the BCGs in this paper, the kpc break radius defined by Veale et al. (2017) is generally within the first SparsePak resolution element (ie. core region). Thus, the total slopes are moderated by the inner core and central regions. However, the sign of the velocity dispersion slope is usually independent of the core and central values. The fits in this paper are to single power-laws, in the same way as Loubser et al. (2018).
Loubser et al. (2018), who have a larger baseline of stellar mass than the present sample, likewise observe a correlation with galaxy mass, as measured by central velocity dispersion. No strong trend is measured in the present data, likely because the current sample does not probe the BGG range. None the less, the overall results do overlap with those of Loubser et al. (2018). Their Figure 3 shows that high-mass BCGs () show a wide range of velocity dispersion slopes ( to ). Over the same mass range, the slopes observed here show values of to . Furthermore, the highest values of velocity dispersion slope are in galaxies with large K-band magnitude and large values of . We note that many of the systems in the present study have different slopes within kpc and beyond kpc (like the u-shaped profiles of Veale et al. (2017)). Thus the Loubser et al. (2018) results are best compared with the inner slope results of Veale et al. (2017) and the core and central regions here. For example, A1795 is shared in both surveys. In Loubser et al. (2018), km/s, at is km/s, and the slope is 0.037. In this study, km/s, at 5km/s and at km/s. That is, the velocity dispersion slope is flat within the central kpc before it rises.
4.4.4 The host cluster mass
ICL from cosmological simulations was characterized by Cui et al. (2014). The velocity dispersion was found to rise steeply as a function of the cluster M200. Veale et al. (2018) sample a wide range of environmental density and host halo mass, and also measured a correlation. The present sample shows no correlation, which is not surprising as it is dominated by rich, X-ray bright clusters.
4.4.5 BCGs with falling velocity dispersion slopes
What about the BCGs that do not show rising velocity dispersions? Figure 10 illustrates that this is not because of a small physical field of view, and Figure 15 shows it is not the distance from the X-ray peak. Beyond velocity anisotropies, it could be that the BCG dark matter or stellar core is large, dominating the stellar dynamics beyond. As an example, A85 has a flat velocity dispersion profile, and is known to have a particularly large core (López-Cruz et al., 2014). Figure 21 supports the idea of a BCG core occasionally dominating the dynamics. The velocity dispersion slope is negative only when the ratio of BCG to cluster velocity dispersion is . It also shows a slight trend where the velocity dispersion slope falls as the ratio of the BCG to cluster mass increases ( when the very negative slope point is removed).
5 Summary and Conclusions
The main findings and conclusions of the paper are:
-
•
The stars in the BCG core were the first in the galaxy to form and did so rapidly in deep potential wells long ago. The ages of the BCG cores are overwhelmingly very old with 70% of the population having average core ages of Gyr, and 87% having core ages above Gyr, out to . The highest metallicities are seen throughout , and the spectra are fit well by -enhanced stellar population models. This is expected in the downsizing picture, where the largest galaxies are formed from the oldest stars, and it is consistent with the Toft et al. (2014), van de Voort (2016) scenarios where the BCG cores have been quiescent since . The consistent old ages within kpc echo the size of the most massive, compact galaxies observed at high (Trujillo et al., 2006; van Dokkum et al., 2008).
-
•
The BCG cores in X-ray selected clusters are similar to each other in population and mass. Similar core stellar populations are seen throughout the sample and most core velocity dispersions are around km/s. Any emission lines are associated with BCGs adjacent to the X-ray peak of cool core clusters and young stellar populations form a relatively minor contribution. The stellar populations and velocity dispersion within the core and centre are similar for the galaxies in the sample, suggesting that there has been a long time for populations to mix.
-
•
The ages and metallicities then decrease with distance from the core, as expected if minor mergers continue to add mass to the BCG outskirts. Isotropic, dry minor mergers are expected to remove most of the initial angular momentum of BCGs, resulting in the slowly rotating galaxies of this local sample. The few BCGs with positive age gradients also host the youngest average core age. New central star formation, again associated with an X-ray cooling core (Crawford et al., 1999; Edge et al., 2002; Edwards et al., 2007; Bildfell et al., 2008), could provide a small amount of bright stars that would make an otherwise negative gradient age gradient become flat or positive.
-
•
The most extended BCGs are more centrally located in the cluster, consistent with a large number of minor mergers increasing the size of the galaxy without much increasing the mass.
-
•
This assembly of the BCG outskirts happened after core assembly, and the ICL stars formed more recently from gas that has a range of metallicity. This broad range in metallicity could be explained by gravitational encounters with the BCG. High-metallicity material may originate from the BCG core, while lower-mass galaxies could provide the lower-metallicity gas or stars. This would have happened after the core and central parts of the BCG were formed.
-
•
The ICL stars are part of the cluster, rather than the BCG. Both the kinematics and stellar populations support this scenario. In the majority of cases, the velocity dispersion rises from the BCG core to the outskirts, often reaching the cluster velocity dispersion value. The average age and metallicity of the ICL are both significantly lower than in the BCG. A small subset of BCGs with negative velocity dispersion gradients are observed. This is expected if the galaxy mass profile is dominating the stellar motions. Indeed, these galaxies are massive, but in low X-ray luminosity clusters such that the ratio of BCG to cluster velocity dispersion is . Many are in cool core clusters. Such BCGs would have had enough time without being disturbed by cluster-scale mergers to have come to equilibrium.
The formation of local BCGs is a long process. The stars observed in the core of these systems are consistent with the oldest possible ages in stellar population models. Yet, their outskirts formed over billions of years through the merging and interactions with other galaxies in the cluster. Even today, some large red galaxies in massive clusters are undergoing major mergers, forming what will be even brighter cluster galaxies of tomorrow. In future papers we will quantify the amount of merging currently taking place through a study of the close companions identified here. We will also more closely examine the emission line systems.
These findings support efforts to obtain spectroscopic observations deep into the ICL so that stellar populations and kinematics together can be determined. As the endpoint of hierarchical merging, brightest cluster galaxies provide strong constraints for cosmological simulations. This paper presents constraints that cosmological evolution models should be able to reproduce: the gradients in metallicity and velocity dispersion for BCGs, and the lower stellar ages past .
Acknowledgements
We thank the anonymous referee for helpful and insightful comments. This study uses data gathered with SparsePak on the WIYN Telescope at Kitt Peak National Observatory, through time generously granted by the Yale University Astronomy department. We would like to thank instrument scientist Jenny Power and telescope operators Krissy Reetz and Dave Summers for their valuable assistance in obtaining observations. We thank Eric Wilcots for securing the final six cluster members through UW Madison, and Malanka Riabokin for performing the observations the evening Willow Edwards was born. Many undergraduate students were involved in this project and their funding sources were from: the Yale STARS and the CT Space Grant Consortium, the Cal Poly BEACON research, an NSF LSAMP grant (number HRD-1302873), as well as Frost Research Scholars supported by The Bill and Linda Frost Fund. This work is supported by the NSF AAG Award Number 1814375. PC acknowledges support from FAPESP project 2018/05392-8 and CNPq 305066/2015-3. HM acknowledges support from NSERC. We would also like to thank Anthony Festa, Vasilije Dobrosavljevic, Tara Abraham, Victoria Beizer, and Emily Lucas for their contributions to the project. This project also makes extensive use of data from several publicly accessible astronomical databases. Funding for the Sloan Digital Sky Survey IV has been provided by the Alfred P. Sloan Foundation, the U.S. Department of Energy Office of Science, and the Participating Institutions. SDSS-IV acknowledges support and resources from the center for High-Performance Computing at the University of Utah. The Two Micron All Sky Survey, is a joint project of the University of Massachusetts and the Infrared Processing and Analysis center/California Institute of Technology, funded by the National Aeronautics and Space Administration and the National Science Foundation. The NASA/IPAC Extragalactic Database (NED), which is operated by the Jet Propulsion Laboratory, California Institute of Technology, under contract with the National Aeronautics and Space Administration. Data from the Chandra Data Archive and the Chandra Source Catalog, and software provided by the Chandra X-ray center (CXC) in the application packages CIAO, ChIPS, and Sherpa was also used. The STARLIGHT project is supported by the Brazilian agencies CNPq, CAPES and FAPESP and by the France-Brazil CAPES/Cofecub program.
References
- Barai, Brito & Martel (2009) Barai P., Brito W., Martel H., 2009, Journal of Astrophysics and Astronomy, 30, 1
- Barbosa et al. (2016) Barbosa C. E., Arnaboldi M., Coccato L., Hilker M., Mendes de Oliveira C., Richtler T., 2016, A&A, 589, A139
- Bender et al. (2015) Bender R., Kormendy J., Cornell M. E., Fisher D. B., 2015, ApJ, 807, 56
- Bershady et al. (2004) Bershady M., Anderson M., Harker J., Ramsey L., Verheijen M., 2004, PASP, 116, 565
- Bezanson et al. (2009) Bezanson R., van Dokkum P. G., Tal T., Marchesini D., Kriek M., Franx M., Coppi P., 2009, ApJ, 697, 1290
- Biju et al. (2017) Biju K. G. et al., 2017, MNRAS, 471, 617
- Bildfell et al. (2008) Bildfell C., Hoekstra H., Babul A., Mahdavi A., 2008, MNRAS, 389, 1637
- Brough et al. (2005) Brough S., Collins C. A., Burke D. J., Lynam P. D., Mann R. G., 2005, MNRAS, 364, 1354
- Brough et al. (2002) Brough S., Collins C. A., Burke D. J., Mann R. G., Lynam P. D., 2002, MNRAS, 329, L53
- Brough et al. (2007) Brough S., Proctor R., Forbes D. A., Couch W. J., Collins C. A., Burke D. J., Mann R. G., 2007, MNRAS, 378, 1507
- Bruzual & Charlot (2003) Bruzual G., Charlot S., 2003, MNRAS, 344, 1000
- Calzetti et al. (2000) Calzetti D., Armus L., Bohlin R. C., Kinney A. L., Koornneef J., Storchi-Bergmann T., 2000, ApJ, 533, 682
- Carollo et al. (1995) Carollo C. M., de Zeeuw P. T., van der Marel R. P., Danziger I. J., Qian E. E., 1995, ApJL, 441, L25
- Cavagnolo et al. (2008) Cavagnolo K. W., Donahue M., Voit G. M., Sun M., 2008, ApJL, 683, L107
- Cavagnolo et al. (2009) Cavagnolo K. W., Donahue M., Voit G. M., Sun M., 2009, ApJS, 182, 12
- Chabrier (2003) Chabrier G., 2003, ApJL, 586, L133
- Chen et al. (2007) Chen Y., Reiprich T. H., Böhringer H., Ikebe Y., Zhang Y. ., 2007, ArXiv Astrophysics e-prints
- Cid Fernandes et al. (2007) Cid Fernandes R., Asari N. V., Sodré L., Stasińska G., Mateus A., Torres-Papaqui J. P., Schoenell W., 2007, MNRAS, 375, L16
- Cid Fernandes et al. (2005) Cid Fernandes R., Mateus A., Sodré L., Stasińska G., Gomes J. M., 2005, MNRAS, 358, 363
- Coccato et al. (2010) Coccato L., Arnaboldi M., Gerhard O., Freeman K. C., Ventimiglia G., Yasuda N., 2010, A&A, 519, A95
- Coccato, Gerhard & Arnaboldi (2010) Coccato L., Gerhard O., Arnaboldi M., 2010, MNRAS, 407, L26
- Coelho et al. (2007) Coelho P., Bruzual G., Charlot S., Weiss A., Barbuy B., Ferguson J. W., 2007, MNRAS, 382, 498
- Coelho, Mendes de Oliveira & Cid Fernandes (2009) Coelho P., Mendes de Oliveira C., Cid Fernandes R., 2009, MNRAS, 396, 624
- Conroy & van Dokkum (2012) Conroy C., van Dokkum P. G., 2012, ApJ, 760, 71
- Contini et al. (2014) Contini E., De Lucia G., Villalobos Á., Borgani S., 2014, MNRAS, 437, 3787
- Contini, Yi & Kang (2018) Contini E., Yi S. K., Kang X., 2018, MNRAS, 479, 932
- Cooke et al. (2019) Cooke K. C., Kartaltepe J. S., Tyler K. D., Darvish B., Casey C. M., Le Fèvre O., Salvato M., Scoville N., 2019, ApJ, 881, 150
- Cowie et al. (1983) Cowie L. L., Hu E. M., Jenkins E. B., York D. G., 1983, ApJ, 272, 29
- Coziol et al. (2009) Coziol R., Andernach H., Caretta C. A., Alamo-Martínez K. A., Tago E., 2009, AJ, 137, 4795
- Crawford et al. (1999) Crawford C. S., Allen S. W., Ebeling H., Edge A. C., Fabian A. C., 1999, MNRAS, 306, 857
- Crawford, Sanders & Fabian (2005) Crawford C. S., Sanders J. S., Fabian A. C., 2005, MNRAS, 361, 17
- Croton et al. (2006) Croton D. J. et al., 2006, MNRAS, 365, 11
- Cui et al. (2014) Cui W. et al., 2014, MNRAS, 437, 816
- De Lucia & Blaizot (2007) De Lucia G., Blaizot J., 2007, MNRAS, 375, 2
- De Lucia, Kauffmann & White (2004) De Lucia G., Kauffmann G., White S. D. M., 2004, MNRAS, 349, 1101
- De Maio et al. (2015) De Maio T., Gonzalez A., Zabludoff A. I., Zaritsky D., Bradac M., 2015, MNRAS, 448, 1162
- Dolag, Murante & Borgani (2010) Dolag K., Murante G., Borgani S., 2010, MNRAS, 405, 1544
- Donzelli, Muriel & Madrid (2011) Donzelli C. J., Muriel H., Madrid J. P., 2011, ApJS, 195, 15
- Dressler (1979) Dressler A., 1979, ApJ, 231, 659
- Ebeling et al. (1998) Ebeling H., Edge A. C., Bohringer H., Allen S. W., Crawford C. S., Fabian A. C., Voges W., Huchra J. P., 1998, MNRAS, 301, 881
- Ebeling et al. (1996) Ebeling H., Voges W., Bohringer H., Edge A. C., Huchra J. P., Briel U. G., 1996, MNRAS, 281, 799
- Edge (1991) Edge A. C., 1991, MNRAS, 250, 103
- Edge et al. (2002) Edge A. C., Wilman R. J., Johnstone R. M., Crawford C. S., Fabian A. C., Allen S. W., 2002, MNRAS, 337, 49
- Edwards et al. (2016) Edwards L. O. V., Alpert H. S., Trierweiler I. L., Abraham T., Beizer V. G., 2016, MNRAS, 461, 230, Paper I
- Edwards et al. (2007) Edwards L. O. V., Hudson M. J., Balogh M. L., Smith R. J., 2007, MNRAS, 379, 100
- Edwards & Patton (2012) Edwards L. O. V., Patton D. R., 2012, MNRAS, 425, 287
- Edwards et al. (2009) Edwards L. O. V., Robert C., Mollá M., McGee S. L., 2009, MNRAS, 396, 1953
- Fabian et al. (2001) Fabian A. C., Sanders J. S., Ettori S., Taylor G. B., Allen S. W., Crawford C. S., Iwasawa K., Johnstone R. M., 2001, MNRAS, 321, L33
- Fisher, Illingworth & Franx (1995) Fisher D., Illingworth G., Franx M., 1995, ApJ, 438, 539
- Gallazzi et al. (2005) Gallazzi A., Charlot S., Brinchmann J., White S. D. M., Tremonti C. A., 2005, MNRAS, 362, 41
- Gerhard et al. (2001) Gerhard O., Kronawitter A., Saglia R. P., Bender R., 2001, AJ, 121, 1936
- González (1993) González J. J., 1993, PhD thesis, Thesis (PH.D.)–UNIVERSITY OF CALIFORNIA, SANTA CRUZ, 1993.Source: Dissertation Abstracts International, Volume: 54-05, Section: B, page: 2551.
- Greene et al. (2015) Greene J. E., Janish R., Ma C.-P., McConnell N. J., Blakeslee J. P., Thomas J., Murphy J. D., 2015, ApJ, 807, 11
- Hartke et al. (2018) Hartke J. et al., 2018, A&A, 616, A123
- Hatch (2007) Hatch N., 2007, in Boehringer H. and Schuecker P. and Pratt G.W. and Finoguenov A., eds., ESO Astrophysics Symposia, Heating vs. Cooling in Galaxies and Clusters of Galaxies. Springer-Verlag, Garching
- Hausman & Ostriker (1978) Hausman M. A., Ostriker J. P., 1978, ApJ, 224, 320
- Hilker et al. (2018) Hilker M., Richtler T., Barbosa C. E., Arnaboldi M., Coccato L., Mendes de Oliveira C., 2018, ArXiv e-prints
- Hirschmann, De Lucia & Fontanot (2016) Hirschmann M., De Lucia G., Fontanot F., 2016, MNRAS, 461, 1760
- Hirschmann et al. (2015) Hirschmann M., Naab T., Ostriker J. P., Forbes D. A., Duc P.-A., Davé R., Oser L., Karabal E., 2015, MNRAS, 449, 528
- Hopkins et al. (2009) Hopkins P. F., Cox T. J., Dutta S. N., Hernquist L., Kormendy J., Lauer T. R., 2009, ApJS, 181, 135
- Hudson et al. (2010) Hudson D. S., Mittal R., Reiprich T. H., Nulsen P. E. J., Andernach H., Sarazin C. L., 2010, A&A, 513, A37
- Hudson & Ebeling (1997) Hudson M. J., Ebeling H., 1997, ApJ, 479, 621
- Jimmy et al. (2013) Jimmy, Tran K.-V., Brough S., Gebhardt K., von der Linden A., Couch W. J., Sharp R. G., 2013, ApJ, 778, 171
- Kluge et al. (2019) Kluge M. et al., 2019, arXiv e-prints, arXiv:1908.08544
- Kobayashi (2004) Kobayashi C., 2004, MNRAS, 347, 740
- Krick & Bernstein (2007) Krick J. E., Bernstein R. A., 2007, AJ, 134, 466
- Krick, Bernstein & Pimbblet (2006) Krick J. E., Bernstein R. A., Pimbblet K. A., 2006, ApJ, 131, 168
- Krogager et al. (2014) Krogager J.-K., Zirm A. W., Toft S., Man A., Brammer G., 2014, ApJ, 797, 17
- La Barbera et al. (2012) La Barbera F., Ferreras I., de Carvalho R. R., Bruzual G., Charlot S., Pasquali A., Merlin E., 2012, MNRAS, 426, 2300
- Laine et al. (2003) Laine S., van der Marel R. P., Lauer T. R., Postman M., O’Dea C. P., Owen F. N., 2003, AJ, 125, 478
- Lakhchaura & Singh (2014) Lakhchaura K., Singh K. P., 2014, AJ, 147, 156
- Lauer et al. (2014) Lauer T. R., Postman M., Strauss M. A., Graves G. J., Chiasri N. E., 2014, AJ, 797, 82
- Longobardi et al. (2013) Longobardi A., Arnaboldi M., Gerhard O., Coccato L., Okamura S., Freeman K. C., 2013, A&A, 558, A42
- Longobardi et al. (2015) Longobardi A., Arnaboldi M., Gerhard O., Mihos J. C., 2015, A&A, 579, L3
- Longobardi et al. (2018) Longobardi A., Arnaboldi M., Gerhard O., Pulsoni C., Söldner-Rembold I., 2018, A&A, 620, A111
- López-Cruz et al. (2014) López-Cruz O., Añorve C., Birkinshaw M., Worrall D. M., Ibarra-Medel H. J., Barkhouse W. A., Torres-Papaqui J. P., Motta V., 2014, ApJL, 795, L31
- Lotz et al. (2017) Lotz J. M. et al., 2017, ApJ, 837, 97
- Loubser et al. (2018) Loubser S. I., Hoekstra H., Babul A., O’Sullivan E., 2018, MNRAS, 477, 335
- Loubser & Sánchez-Blázquez (2012) Loubser S. I., Sánchez-Blázquez P., 2012, MNRAS, 425, 841
- Loubser et al. (2009) Loubser S. I., Sánchez-Blázquez P., Sansom A. E., Soechting I. K., 2009, MNRAS, 398, 133
- Loubser et al. (2008) Loubser S. I., Sansom A. E., Sánchez-Blázquez P., Soechting I. K., Bromage G. E., 2008, MNRAS, 391, 1009
- Mackie (1992) Mackie G., 1992, ApJ, 400, 65
- Maraston (2011) Maraston C., 2011, in Astronomical Society of the Pacific Conference Series, Vol. 445, Why Galaxies Care about AGB Stars II: Shining Examples and Common Inhabitants, Kerschbaum F., Lebzelter T., Wing R. F., eds., p. 391
- Martel, Barai & Brito (2012) Martel H., Barai P., Brito W., 2012, ApJ, 757, 48
- Martel, Robichaud & Barai (2014) Martel H., Robichaud F., Barai P., 2014, ApJ, 786, 79
- McDonald & Veilleux (2009) McDonald M., Veilleux S., 2009, ApJL, 703, L172
- Melnick et al. (2012) Melnick J., Giraud E., Toledo I., Selman F., Quintana H., 2012, MNRAS, 427, 850
- Misgeld et al. (2011) Misgeld I., Mieske S., Hilker M., Richtler T., Georgiev I. Y., Schuberth Y., 2011, A&A, 531, A4
- Montes & Trujillo (2014) Montes M., Trujillo I., 2014, ApJ, 794, 137
- Montes & Trujillo (2018) Montes M., Trujillo I., 2018, MNRAS, 474, 917
- Murante et al. (2004) Murante G. et al., 2004, ApJL, 607, L83
- Murante et al. (2007) Murante G., Giovalli M., Gerhard O., Arnaboldi M., Borgani S., Dolag K., 2007, MNRAS, 377, 2
- Navarro, Frenk & White (1996) Navarro J. F., Frenk C. S., White S. D. M., 1996, ApJ, 462, 563
- Newman et al. (2013) Newman A. B., Treu T., Ellis R. S., Sand D. J., Nipoti C., Richard J., Jullo E., 2013, ApJ, 765, 24
- Oliva-Altamirano et al. (2015) Oliva-Altamirano P., Brough S., Jimmy, Kim-Vy T., Couch W. J., McDermid R. M., Lidman C., von der Linden A., Sharp R., 2015, MNRAS, 449, 3347
- Oyarzún et al. (2019) Oyarzún G. A. et al., 2019, ApJ, 880, 111
- Padmanabhan et al. (2004) Padmanabhan N. et al., 2004, NewAstRev, 9, 329
- Postman et al. (2012) Postman M. et al., 2012, ApJS, 199, 25
- Postman & Lauer (1995) Postman M., Lauer T. R., 1995, ApJ, 440, 28
- Presotto et al. (2014) Presotto V. et al., 2014, A&A, 565, A126
- Puchwein et al. (2010) Puchwein E., Springel V., Sijacki D., Dolag K., 2010, MNRAS, 406, 936
- Purcell, Bullock & Zentner (2007) Purcell C. W., Bullock J. S., Zentner A. R., 2007, ApJ, 666, 20
- Ragone-Figueroa et al. (2018) Ragone-Figueroa C., Granato G. L., Ferraro M. E., Murante G., Biffi V., Borgani S., Planelles S., Rasia E., 2018, MNRAS, 479, 1125
- Richtler et al. (2011) Richtler T., Salinas R., Misgeld I., Hilker M., Hau G. K. T., Romanowsky A. J., Schuberth Y., Spolaor M., 2011, A&A, 531, A119
- Rudick et al. (2009) Rudick C. S., Mihos J. C., Frey L. H., McBride C. K., 2009, ApJ, 699, 1518
- Rudick, Mihos & McBride (2006) Rudick C. S., Mihos J. C., McBride C., 2006, ApJ, 648, 936
- Rudick, Mihos & McBride (2011) Rudick C. S., Mihos J. C., McBride C. K., 2011, ApJ, 732, 48
- Salomé & Combes (2003) Salomé P., Combes F., 2003, A&A, 412, 657
- Schneider & Gunn (1982) Schneider D. P., Gunn J. E., 1982, ApJ, 263, 14
- Skibba et al. (2011) Skibba R. A., van den Bosch F. C., Yang X., More S., Mo H., Fontanot F., 2011, MNRAS, 410, 417
- Smith et al. (2004) Smith R. J. et al., 2004, AJ, 128, 1558
- Sommer-Larsen, Romeo & Portinari (2005) Sommer-Larsen J., Romeo A. D., Portinari L., 2005, MNRAS, 357, 478
- Tang et al. (2018) Tang L., Lin W., Cui W., Kang X., Wang Y., Contini E., Yu Y., 2018, ApJ, 859, 85
- Toft et al. (2014) Toft S. et al., 2014, ApJ, 782, 68
- Tonini et al. (2012) Tonini C., Bernyk M., Croton D., Maraston C., Thomas D., 2012, ApJ, 759, 43
- Tonry (1983) Tonry J. L., 1983, ApJ, 266, 58
- Tremblay et al. (2015) Tremblay G. R. et al., 2015, MNRAS, 451, 3768
- Tremonti et al. (2004) Tremonti C. A. et al., 2004, ApJ, 613, 898
- Treu et al. (2005) Treu T., Ellis R. S., Liao T. X., van Dokkum P. G., 2005, ApJL, 622, L5
- Trujillo et al. (2006) Trujillo I. et al., 2006, MNRAS, 373, L36
- Tutukov, Dryomov & Dryomova (2007) Tutukov A. V., Dryomov V. V., Dryomova G. N., 2007, Astronomy Reports, 51, 435
- Tutukov & Fedorova (2011) Tutukov A. V., Fedorova A. V., 2011, Astronomy Reports, 55, 383
- van de Voort (2016) van de Voort F., 2016, MNRAS, 462, 778
- van Dokkum et al. (2008) van Dokkum P. G. et al., 2008, ApJL, 677, L5
- Vazdekis et al. (2015) Vazdekis A. et al., 2015, MNRAS, 449, 1177
- Veale et al. (2018) Veale M., Ma C.-P., Greene J. E., Thomas J., Blakeslee J. P., Walsh J. L., Ito J., 2018, MNRAS, 473, 5446
- Veale et al. (2017) Veale M. et al., 2017, MNRAS, 464, 356
- von der Linden et al. (2006) von der Linden A., Best P. N., Kauffmann G., White S. D. M., 2006, astro-ph/0611196
- Vulcani et al. (2014) Vulcani B. et al., 2014, ApJ, 797, 62
- Walcher et al. (2009) Walcher C. J., Coelho P., Gallazzi A., Charlot S., 2009, MNRAS, 398, L44
- White, Jones & Forman (1997) White D. A., Jones C., Forman W., 1997, MNRAS, 292, 419
- Willman et al. (2004) Willman B., Governato F., Wadsley J., Quinn T., 2004, MNRAS, 355, 159
- Worthey (1994) Worthey G., 1994, ApJS, 95, 107