Stress relaxation above and below the jamming transition
Abstract
We numerically investigate stress relaxation in soft athermal disks to reveal critical slowing down when the system approaches the jamming point. The exponents describing the divergence of the relaxation time differ dramatically depending on whether the transition is approached from the jammed or unjammed phase. This contrasts sharply with conventional dynamic critical scaling scenarios, where a single exponent characterizes both sides. We explain this surprising difference in terms of the vibrational density of states (vDOS), which is a key ingredient of linear viscoelastic theory. The vDOS exhibits an extra slow mode that emerges below jamming, which we utilize to demonstrate the anomalous exponent below jamming.
Amorphous materials such as suspensions, emulsions, foams, and granular materials are important in engineering science, and a better understanding of their rheology is of central importance in many manufacturing processes Larson (1999). Although the rheophysics of amorphous materials has a long history, predictive description of their elasto-visco-plastic response remains challenging Bonn et al. (2017). Recently, physicists have focused on steady shear flow near the jamming transition at the packing fraction Olsson and Teitel (2007, 2012); Vågberg et al. (2014); Olsson (2019); Tighe et al. (2010); Hatano (2010); Otsuki and Hayakawa (2009); Nordstrom et al. (2010); Andreotti et al. (2012); Ikeda et al. (2012); Kawasaki et al. (2015); Saitoh and Tighe (2019). Sufficiently close to jamming (), rheological flow curves (stress-strain rate relations) can be collapsed to master curves Olsson and Teitel (2007), reminiscent of critical scaling functions near a second order phase transition Halperin and Hohenberg (1969). Critical scaling implies the existence of a diverging time scale . While details of the jamming scaling scenario remain controversial, there is general agreement that the exponent is the same on either side of the transition, with estimates for its value ranging from to Trulsson et al. (2012).
Steady shear flow is not the only way to probe time scales near jamming – viscoelastic tests can also be used. Viscosities measured via stress relaxation or oscillatory shear need not match the steady state viscosity, though in practice they are often comparable Larson (1999). Unlike steady flow, numerical studies of viscoelasticity typically apply perturbations to an isotropic reference state. This is an important distinction, because there is evidence that (nearly) jammed states encode their loading history in their vibrational spectrum. Lerner et al. related the divergence of to this self-organization under steady shear Lerner et al. (2012), and recently Ikeda et al. identified similar effects under isotropic compression Ikeda et al. (2019). However, it remains unclear what happens when a system is prepared isotropically and then subjected to a transverse stress increment, i.e. shear.
Above jamming, small amplitude oscillatory shear and stress relaxation tests in dimensions reveal a diverging relaxation time with Boschan et al. (2016, 2017); Baumgarten and Tighe (2017) – the viscoelastic relaxation time also diverges, albeit more slowly than . This result is consistent with theoretical predictions for both and , which relate to a broadening distribution of overdamped eigenmodes near Tighe (2011). 3D stress relaxation tests below jamming also reveal a diverging time scale, Hatano (2009). However, the exponent is much larger than unity, reminiscent of the exponent for steady flow. The large difference between and represents a surprising departure from conventional dynamic critical scaling, where a single exponent describes the divergence on both sides of the transition Halperin and Hohenberg (1969). The conventional scenario is in fact observed in closely related systems of overdamped spring networks, with Tighe (2012). Hence from this perspective is the anomalous exponent. Resolving this discrepancy and understanding its origin represent an important challenge in jamming and rheology.
In this Letter, we use molecular dynamics (MD) simulations of 2D stress relaxation tests to present the first simultaneous measurements of and . We verify the large difference between the two exponents, eliminating the possibility that their difference was spurious or due to different measurement techniques. We further establish qualitative similarities between viscoelastic relaxation and steady state rheology below jamming, including the anomalously large value of . We relate this difference to the same self-organization process identified previously in steady flow and isotropic cooling.
Numerical methods.— We perform simulations of binary mixtures of disks with diameter ratio , a standard model in the jamming literature O’Hern et al. (2003); Koeze et al. (2016). Initial conditions are prepared in a square periodic box Bitzek et al. (2006) at a controlled area fraction near the jamming point . The force between the disks, and , in contact is modeled as , where is the stiffness and with the relative position is the normal unit vector. The force is linear in the overlap , where () is the radius of the disk (). The motion of the disk is described by overdamped dynamics Olsson and Teitel (2007, 2012); Tighe et al. (2010); Hatano (2009), i.e. , where is introduced as the damping coefficient. In this model, the stiffness and damping coefficient determine a time scale .
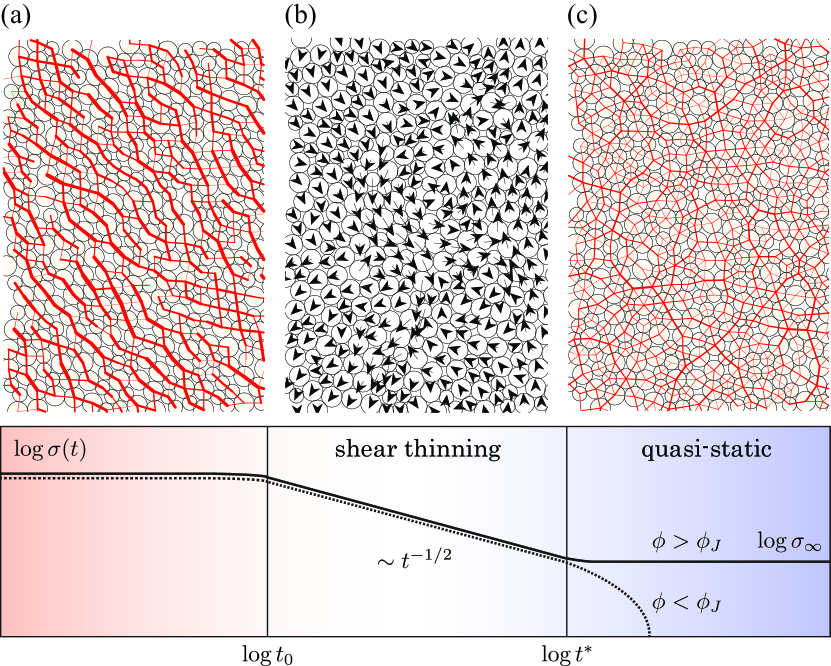
Relaxation tests.— To study viscoelastic properties of a packing, we apply a small strain step to the system, where every disk’s position is replaced with under the Lees-Edwards boundary conditions Hatano (2009). Figure 1(a) shows a snapshot of the anisotropic force-chains (solid lines) that develop immediately after the simple shear deformation. The affine displacements generate force imbalances, and for the particles are allowed to relax to a new mechanical equilibrium while is held fixed via the Lees-Edwards boundary conditions. As in Fig. 1(b), we observe complex non-affine displacements of the disks, , during the relaxation. After relaxation the initial force-chains are significantly weakened (Fig. 1(c)) and the shear stress has been reduced. Shear stress is calculated as , where and are the - and -components of the elastic force and relative position, respectively. We neglect infinitesimal kinetic contributions to the stress and subtract the pre-stress (the shear stress in prepared packing) from numerical data to reduce noise.
If the strain step is sufficiently small, , the shear stress is described by linear viscoelasticity Larson (1999),
| (1) |
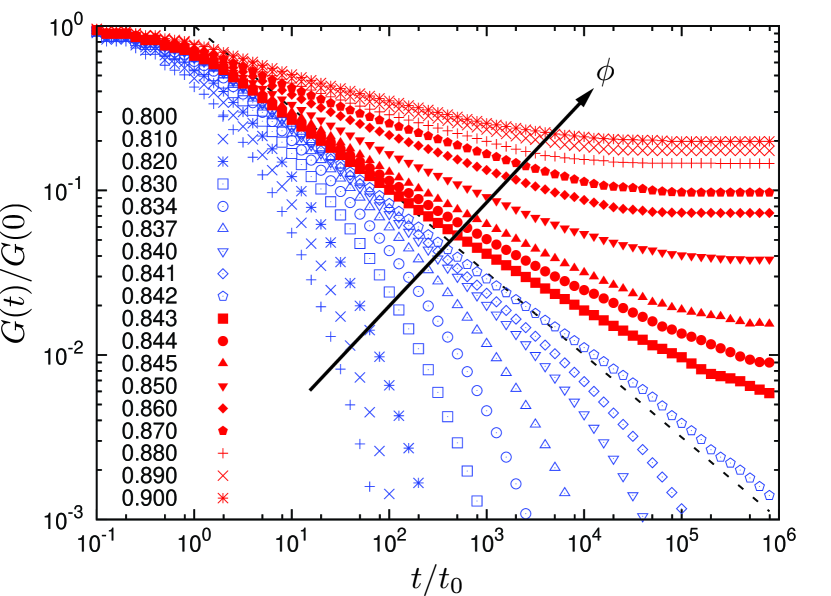
where is the imposed shear rate and is the time-dependent shear modulus. Figure 2 displays our numerical results of scaled shear modulus , where the area fraction increases across the jamming point (as indicated by the arrow). We observe instantaneous responses on a short time scale regardless of the area fraction. Below jamming (), the shear stress finally decays to zero, while it asymptotically decreases to a finite remnant stress above jamming (). As the system approaches the jamming transition, we find power-law decay in the intermediate time scale , where the relaxation time strongly depends on the proximity to jamming. From these observations, we divide the time development of shear modulus into three different regimes: (i) Instantaneous response , (ii) shear thinning , and (iii) quasi-static limit for and for Tighe (2011).
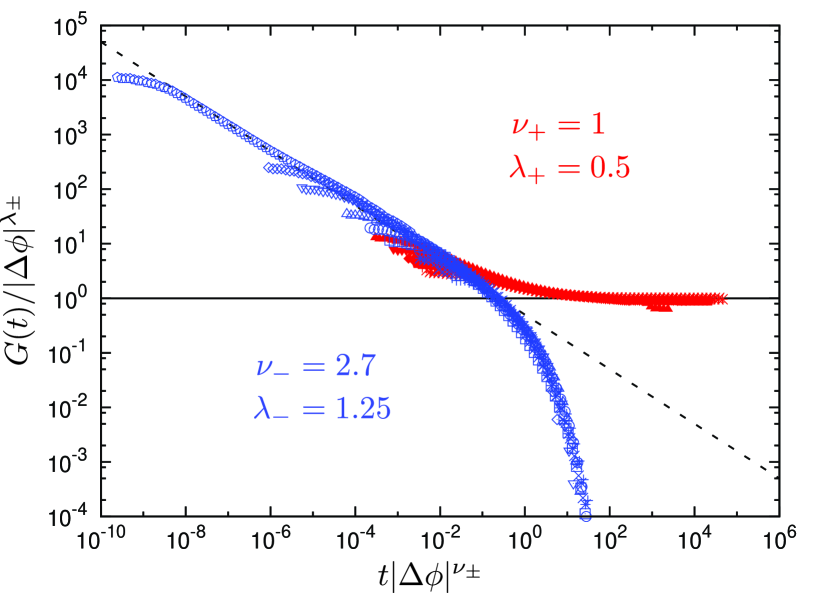
Critical divergence of the relaxation time.— To estimate the relaxation time , we collapse the data of the shear modulus. Figure 3 plots against time, where they are scaled by and , respectively. The data above jamming (closed symbols) are well collapsed by the exponents, and , implying emergence of the static shear modulus , and divergence of the relaxation time 111A smaller strain step is used for the data above jamming in Fig. 3 to demonstrate the linear responses Boschan et al. (2017); Otsuki and Hayakawa (2014).. These results are consistent with prior numerical measurements Boschan et al. (2016, 2017); Baumgarten and Tighe (2017) and theoretical predictions Tighe (2011). On the other hand, we find excellent data collapse for data below jamming (open symbols) using and . Note that the scaling relation is satisfied both above and below jamming (see Supplemental Material (SM) Sup ). Therefore, the relaxation time scales differently on either side of jamming,
| (2) |
Linear viscoelastic theory.— We now rationalize the two different scaling relations of Eq. (2) using viscoelastic theory Tighe (2011) and numerical measurements of the relaxation spectrum. To begin, it is useful to note certain properties of , the Fourier transform of . Here is known as the complex shear modulus, while and are the storage and loss moduli, respectively. Because is a real-valued function, () must be even (odd) in . Assuming is analytic and taking the limit , it follows that and . (We recall that is zero in a fluid and finite in a solid.) The relaxation time is the scale where these elastic and viscous contributions to the stress balance:
| (3) |
We will use Eq. (3) to evaluate within the harmonic approximation by expanding about a reference state. We choose the state at , as determined from numerics. Above jamming, one could also choose the initial condition as a reference state because, for any finite sized system, the strain step can always be taken small enough that no contacts are made or broken. Below jamming, however, the initial condition contains only “kissing” contacts and the initial, affine shear step necessarily alters the contact network, which violates the harmonic approximation. At long times, however, the contact network assumes its final topology (see SM Sup ) and the approximation can be applied. Given a reference configuration, the complex shear modulus can be calculated from
| (4) |
The ket contains the Fourier transform of the particles’ displacements from their reference positions, and is the Hessian matrix. The term is the affine shear modulus, which remains finite at jamming. The second term on the righthand side of Eq. (4) is the non-affine contribution to the modulus. A derivation of Eq. (4) is given in the SM Sup .
Next we introduce the eigenfrequencies and eigenvectors () of the Hessian . By expressing the -dimensional vector as a linear combination of the eigenvectors and taking the limit of vanishing frequency, Eq. (3) becomes
| (5) |
Here is the net force imbalance per unit affine shear and is its projection onto the mode. is a measure of the mode’s coupling to shear.
The vibrational density of states.— In order to analyze the scaling of Eq. (5) near jamming, it is necessary to quantify the spectrum of eigenfrequencies . We therefore introduce , the vibrational density of states (vDOS). As shown previously Silbert et al. (2005) and in the SM Sup , the vDOS above jamming exhibits a plateau, , extending to a characteristic scale that vanishes at unjamming van Hecke (2010). We find a similar scenario holds below jamming: Fig. 4(a) reveals the same plateau over a range (dotted line), with controlled by the excess coordination number ( in two dimensions) 222The coordination number is measured after fully relaxing the system and removing floating disks (with )..
In addition, as indicated by the arrow in Fig. 4(a), there is a narrow band of slow modes below . (Note that packings below jamming also contain a number of floppy modes with , which are not visible in a log-log plot.) The finite frequency band is centered on a peak value that also goes to zero as the system approaches from below. The finite width of this band is the result of averaging over different configurations – in fact, as we show in the SM Sup , each packing contributes a single mode near , well separated from the modes at . Such a “special mode” below jamming was previously observed by Lerner et al. in steady shear flow Lerner et al. (2012) and by Ikeda et al. Ikeda et al. (2019) in isotropic cooling. At the same time, randomly cut under-coordinated spring networks have no such special mode, although their vDOS is otherwise similar Düring et al. (2013). These results suggest that loading trains the system to “know about” a particular direction in stress-space, by (self-)organizing to support the load. This, in turn, is encoded in the special mode. Our systems are prepared via an isotropic process and then subjected to shear, so (unlike prior work) the stress increment is transverse to the preparatory load. It is therefore not self-evident if or how the special mode should influence the dynamic viscosity.
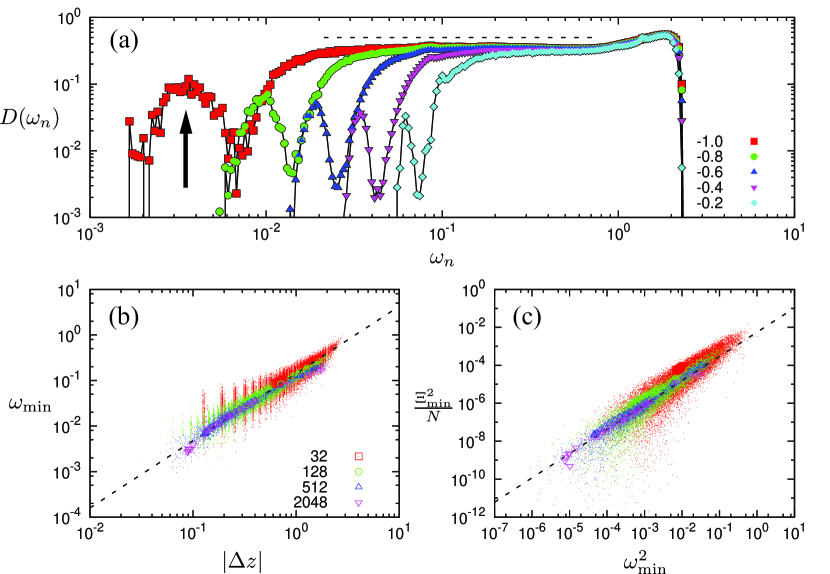
Scaling analysis.— The exponent characterizing relaxation above jamming was derived in Ref. Tighe (2011), so we focus here on the case below jamming. In order to perform scaling analysis, we numerically measure and the coupling strengths. Figure 4(b) displays scatter plots of and , where each dot is the result of one configuration of the disks. Each symbol is the average of over packings with the same area fraction . The mode frequency scales as (dotted line), independent of the system size (colors and symbols).
Excluding the special mode, the coupling strengths scale as , independent of . This relation, which implies that floppy modes have no shear coupling (), has been validated numerically for unstressed systems above jamming Mizuno et al. (2016). In the SM Sup we motivate it theoretically and confirm that it holds below jamming as well. In sharp contrast, Fig. 4(c) shows that coupling strengths for the special mode collapse when plotting versus for different sizes (colors and symbols). This implies (dotted line). Note, in particular, that is extensive, i.e. it couples to shear differently, and more strongly, than other modes. This strong coupling to shear is surprising, in the sense that the system was prepared isotropically. Evidently, the reorganization triggered by a small shear step is sufficient to develop the special mode – which does not occur above jamming. We attribute this difference to the fact that any strain step can make or break contacts, whereas finite size systems above jamming can be probed without inducing rearrangements Boschan et al. (2016, 2019); van Deen et al. (2014, 2016).
Because the special mode is the softest non-floppy mode in the system and couples extensively to shear, it dominates each of the sums on the righthand side of Eq. (5), with all other modes contributing sub-dominantly. One finds
| (6) |
which agrees with Eq. (2) because Sup ; Heussinger and Barrat (2009). Hence, while relaxation above jamming is controlled by Tighe (2011), below jamming it is set by . This explains the difference in scaling of the relaxation time on either side of the transition.
Summary and outlook.— In this study, we numerically studied stress relaxation in soft athermal disks. The relaxation time diverges when the system approaches the jamming point – but, unusually, the critical exponent depends on the direction of approach [Eq. (2)]. We calculated the vDOS and found its plateau above the characteristic scale . In contrast, the vDOS below jamming has a delta peak at a special mode (). Using scaling analysis, we showed that controls long time relaxation below jamming by setting the value of . As the same approach correctly predicts above jamming, as well Tighe (2011), we have unified the theoretical description of relaxation on either side of jamming.
The results presented here were in 2D. Recent work by Olsson has raised questions about the value of the scaling exponent for steady flow in 3D. Hence there is a need for a careful future study of in 3D, building on the work of Hatano Hatano (2009). As the special mode has also been demonstrated in 3D Lerner et al. (2012); Ikeda et al. (2019), we expect our approach to apply in that case as well. Other likely future directions include the role of the viscous force law Baumgarten and Tighe (2017) and, in particular, the role of inertia, where comparison with experiments D’Haene et al. (1993) is important for industrial applications.
Acknowledgements.
We thank E. Lerner, W. Kob, F. Radjai, K. Miyazaki, T. Kawasaki, H. Hayakawa, J. Boschan, and K. Baumgarten for fruitful discussions. This work was supported by KAKENHI Grant No. 16H04025 and No. 18K13464 from JSPS. Some computations were performed at the Yukawa Institute Computer Facility, Kyoto, Japan. BPT acknowledges support from the Dutch Organization for Scientific Research (NWO).References
- Larson (1999) R. G. Larson, The Structure and Rheology of Complex Fluids (Oxford University Press, Inc. 198 Madison Avenue, New York, New York, 10016, 1999).
- Bonn et al. (2017) D. Bonn, M. M. Denn, L. Berthier, T. Divoux, and S. Manneville, Rev. Mod. Phys. 89, 035005 (2017).
- Olsson and Teitel (2007) P. Olsson and S. Teitel, Phys. Rev. Lett. 99, 178001 (2007).
- Olsson and Teitel (2012) P. Olsson and S. Teitel, Phys. Rev. Lett. 109, 108001 (2012).
- Vågberg et al. (2014) D. Vågberg, P. Olsson, and S. Teitel, Phys. Rev. Lett. 112, 208303 (2014).
- Olsson (2019) P. Olsson, Phys. Rev. Lett. 122, 108003 (2019).
- Tighe et al. (2010) B. P. Tighe, E. Woldhuis, J. J. C. Remmers, W. van Saarloos, and M. van Hecke, Phys. Rev. Lett. 105, 088303 (2010).
- Hatano (2010) T. Hatano, Prog. Theor. Phys. Suppl. 184, 143 (2010).
- Otsuki and Hayakawa (2009) M. Otsuki and H. Hayakawa, Phys. Rev. E 80, 011308 (2009).
- Nordstrom et al. (2010) K. N. Nordstrom, E. Verneuil, P. E. Arratia, A. Basu, Z. Zhang, A. G. Yodh, J. P. Gollub, and D. J. Durian, Phys. Rev. Lett. 105, 175701 (2010).
- Andreotti et al. (2012) B. Andreotti, J.-L. Barrat, and C. Heussinger, Phys. Rev. Lett. 109, 105901 (2012).
- Ikeda et al. (2012) A. Ikeda, L. Berthier, and P. Sollich, Phys. Rev. Lett. 109, 018301 (2012).
- Kawasaki et al. (2015) T. Kawasaki, D. Coslovich, A. Ikeda, and L. Berthier, Phys. Rev. E 91, 012203 (2015).
- Saitoh and Tighe (2019) K. Saitoh and B. P. Tighe, Phys. Rev. Lett. 122, 188001 (2019).
- Halperin and Hohenberg (1969) B. I. Halperin and P. C. Hohenberg, Phys. Rev. 177, 952 (1969).
- Trulsson et al. (2012) M. Trulsson, B. Andreotti, and P. Claudin, Phys. Rev. Lett. 109, 118305 (2012).
- Lerner et al. (2012) E. Lerner, G. Düring, and M. Wyart, Proc. Natl. Acad. Sci. U. S. A. 109, 4798 (2012).
- Ikeda et al. (2019) A. Ikeda, T. Kawasaki, L. Berthier, K. Saitoh, and T. Hatano, arXiv 1904, 07359 (2019).
- Boschan et al. (2016) J. Boschan, D. Vågberg, E. Somfai, and B. P. Tighe, Soft Matter 12, 5450 (2016).
- Boschan et al. (2017) J. Boschan, S. A. Vasudevan, P. E. Boukany, E. Somfai, and B. P. Tighe, Soft Matter 13, 6870 (2017).
- Baumgarten and Tighe (2017) K. Baumgarten and B. P. Tighe, Soft Matter 13, 8368 (2017).
- Tighe (2011) B. P. Tighe, Phys. Rev. Lett. 107, 158303 (2011).
- Hatano (2009) T. Hatano, Phys. Rev. E 79, 050301(R) (2009).
- Tighe (2012) B. P. Tighe, Phys. Rev. Lett. 109, 168303 (2012).
- O’Hern et al. (2003) C. S. O’Hern, L. E. Silbert, A. J. Liu, and S. R. Nagel, Phys. Rev. E 68, 011306 (2003).
- Koeze et al. (2016) D. J. Koeze, D. Vågberg, B. B. Tjoa, and B. P. Tighe, Eur. Phys. Lett. 113, 54001 (2016).
- Bitzek et al. (2006) E. Bitzek, P. Koskinen, F. Gähler, M. Moseler, and P. Gumbsch, Phys. Rev. Lett. 97, 170201 (2006).
- Note (1) A smaller strain step is used for the data above jamming in Fig. 3 to demonstrate the linear responses Boschan et al. (2017); Otsuki and Hayakawa (2014).
- (29) See Supplemental Material at [URL will be inserted by publisher] for full details.
- Silbert et al. (2005) L. E. Silbert, A. J. Liu, and S. R. Nagel, Phys. Rev. Lett. 95, 098301 (2005).
- van Hecke (2010) M. van Hecke, J. Phys.: Condens. Matter 22, 033101 (2010).
- Note (2) The coordination number is measured after fully relaxing the system and removing floating disks (with ).
- Düring et al. (2013) G. Düring, E. Lerner, and M. Wyart, Soft Matter 9, 146 (2013).
- Mizuno et al. (2016) H. Mizuno, K. Saitoh, and L. E. Silbert, Phys. Rev. E 93, 062905 (2016).
- Boschan et al. (2019) J. Boschan, S. Luding, and B. P. Tighe, Granular Matter 21, 58 (2019).
- van Deen et al. (2014) M. S. van Deen, J. Simon, Z. Zeravcic, S. Dagois-Bohy, B. P. Tighe, and M. van Hecke, Phys. Rev. E 90, 020202(R) (2014).
- van Deen et al. (2016) M. S. van Deen, B. P. Tighe, and M. van Hecke, Phys. Rev. E 94, 062905 (2016).
- Heussinger and Barrat (2009) C. Heussinger and J.-L. Barrat, Phys. Rev. Lett. 102, 218303 (2009).
- D’Haene et al. (1993) P. D’Haene, J. Mewis, and G. G. Fuller, J. Colloid Int. Sci. 156, 350 (1993).
- Otsuki and Hayakawa (2014) M. Otsuki and H. Hayakawa, Phys. Rev. E 90, 042202 (2014).