Possible progression of mass flow processes around young intermediate-mass stars based on high-resolution near-infrared spectroscopy. I. Taurus
Abstract
We used the WINERED spectrograph to perform near-infrared high-resolution spectroscopy (resolving power ,000) of 13 young intermediate-mass stars in the Taurus star-forming region. Based on the presence of near- and mid-infrared continuum emission, young intermediate-mass stars can be classified into three different evolutionary stages: Phases I, II, and III in the order of evolution. Our obtained spectra (–1.35 m) depict He i 10830 and P lines that are sensitive to magnetospheric accretion and winds. We also investigate five sources each for P and He I lines that were obtained from previous studies along with our targets. We observe that the P profile morphologies in Phases I and II corresponded to an extensive variety of emission features; however, these features are not detected in Phase III. We also observe that the He I profile morphologies are mostly broad subcontinuum absorption lines in Phase I, narrow subcontinuum absorption lines in Phase II, and centered subcontinuum absorption features in Phase III. Our results indicate that the profile morphologies exhibit a progression of the dominant mass flow processes: stellar wind and probably magnetospheric accretion in the very early stage, magnetospheric accretion and disk wind in the subsequent stage, and no activities in the final stage. These interpretations further suggest that opacity in protoplanetary disks plays an important role in mass flow processes. Results also indicate that He I absorption features in Phase III sources, associated with chromospheric activities even in such young phases, are characteristics of intermediate-mass stars.
1 INTRODUCTION
Stars are formed owing to the gravitationally induced collapse of cold molecular gas. While the molecular clouds are contracted during the collapse, the initial rotation of the star-forming cloud is enormously magnified by the conservation of angular momentum. In this process, the rotating circumstellar disks are formed, and majority of the material of a typical star is accreted through its disk (Hartmann, 2009). Although almost all of the angular momentum (99 %) must be removed to form an observable star, we lack a conclusive theory explaining the mechanics of the angular momentum transfer (“angular momentum problem”, Bodenheimer 1995). As one of the most important processes, this study focuses on the mass flow processes occurring very close (radius AU) to central stars. In this region, a large population of close-in planetary systems has been reported, even around young stellar objects (YSOs) younger than 10 Myr (e.g., Donati et al. 2016). However, the manner in which planets are formed is still being debated (Winn & Fabrycky, 2015). Because the interaction between the stars and disks at which planets are formed occurs mainly in the inner disk region, it is essential to investigate the conditions of this region from the planet formation viewpoint.
As for mass flow processes, magnetospheric accretion and outflowing gas have been proposed. Because direct imaging for separations of less than 1 AU is considered to be very difficult using the existing instruments, spectroscopy has been employed. Traditionally, H, NaD, Ca II H&K, Mg II h&k lines have been used for conducting diagnostics (e.g., Mundt, 1984; Calvet & Hartmann, 1992). For mass accretion, these diagnostics have permitted the development of a general picture with respect to various factors, including the mass accretion rate, evolution, geometry, and stellar mass dependence (e.g., Muzerolle et al., 1998b; Hartmann et al., 1998; Muzerolle et al., 2004; Calvet et al., 2004). However, the actual mechanics of outflowing gas have not yet been completely elucidated. There are at least three possible configurations of wind formation: a disk wind (Ustyugova et al., 1995), an X-wind (Shu et al., 1994), and a stellar wind (Hartmann et al., 1982). To distinguish between different theoretical models, constraints on the nature or location of the wind-launching region are very important. However, the aforementioned traditional spectral lines exhibit blueshifted absorption superposed on the broad emission features. This observation signifies the presence of high-velocity wind close to the star (Ardila et al., 2002), yielding little information on the nature or location of the wind-launching region.
Recently, the He I 10,830 Å line has been suggested as a particularly suitable and sensitive probe of both mass accretion and outflow (Edwards et al., 2006). Edwards et al. (2006) exhibited that 70 % of their 39 sample classical T-Tauri stars (CTTSs) exhibit a blueshifted subcontinuum absorption that can be assumed to be a probe of outflow. This is in contrast to H, for which only 10 % of the stars show a similar type of absorption component. Additionally, 50 % of their CTTSs show redshifted absorption below the continuum in He I; this can be considered to be a probe of mass accretion. They also highlighted that the direct probes of the outflowing gas launch region can be created only by high-resolution spectroscopy of the He I line. While the targets for Edwards et al. (2006) were primarily low-mass stars, Oudmaijer et al. (2011) and Cauley & Johns-Krull (2014) presented a He I 10830 profile for Herbig Ae/Be stars (HAeBes), which are intermediate-mass pre-main sequence stars. The calculated He I model profile (e.g., Kwan et al. 2007, Fischer et al. 2008, Kurosawa et al. 2011, Kurosawa & Romanova 2012) suggests that the mass flow processes occurring in the inner part of the protoplanetary disks (disk wind, stellar wind, and magnetospheric accretion) can be distinguished based on the He I profile morphologies. Further, the hydrogen Paschen series can also serve as diagnostics for magnetospheric accretion. Because these series lines are of lower opacity when compared to the H lines, they depict signatures of infall of accreting material in a magnetospheric funnel flow more clearly, whereas H often do not show such signatures (Muzerolle et al., 2001). Folha & Emerson (1999, 2001) presented the P line profiles for 49 T Tauri stars and observed that inverse P Cygni profile features, indicating the magnetospheric mass accretion, can be observed at a relatively high frequency even though the blueshifted absorption features are absent. Edwards et al. (2006) also presented the P line profiles for 48 T Tauri stars. The calculated model profiles of the Paschen lines (e.g., Kurosawa et al. 2011, Kurosawa & Romanova 2012) suggest that the existence or absence of magnetospheric accretion can be determined based on the line morphology; however, these lines cannot serve as diagnostics for winds.
The progression of the dominant mass flow processes through stellar evolution should also impose constraints on the mechanistic theories. Edwards et al. (2006) proposed a progression involving veilings, which are considered to be correlated with the mass accretion rate (e.g., Beristain et al. 2001). In particular, these authors suggested that the emission equivalent width of P decreases with decreasing veiling. Based on He I profiles, Kwan et al. (2007) used a comparison of their theoretical line profiles with the profiles observed by Edwards et al. (2006) to suggest that the wind signatures of stars with high disk accretion rates are more likely to indicate stellar wind than disk wind. Further, although a moderate trend is evident in these factors, this pattern does not seem to be valid for all the stellar sources. This inconsistency may be attributed to an extensive variety of disk properties that have been revealed by recent observational studies, e.g., mass accretion rate, disk lifetime, and disk mass. The median disk lifetime has been estimated to be approximately 3 Myr even though the lifetimes vary from less than 1 Myr to a maximum of 10 Myr. The mass accretion rate and disk mass also exhibit large dispersions, 1 dex (for the mass accretion rate, see Figs. 2 and 3 in Hartmann 2008; for the disk mass, see Fig. 5 in Williams & Cieza 2011 and Fig. 7 in Ansdell et al. 2017). Furthermore, because the entirety of dust and gas in the inner and outer disks is dispersed almost simultaneously; at 0.5 Myr (Williams & Cieza, 2011), there appear to be no clear indicators of the protoplanetary disk evolutionary stages. However, this picture is obtained from low-mass stars (1 ), which constitute the majority in the solar neighborhood. Recent observations suggest that the protoplanetary disks surrounding the intermediate-mass stars show different evolutionary stages; for the intermediate-mass stars (1.5 ), only the innermost disk regions that are traced with the near-infrared (NIR) K-band ( AU) disperse at a very early time as compared to the outer disks by 3 to 4 Myr (Yasui et al., 2014). Therefore, based on the presence of innermost and outer disks, the intermediate-mass stars can be categorized into three phases; further, the intermediate-mass stars should be appropriate targets for investigating the time variation of dominant mass flow processes. Based on the He I line profiles, Cauley & Johns-Krull (2014) suggested that HAe stars exhibit signatures of magnetospheric accretion and stellar wind even though they do not exhibit disk wind. Although these authors have suggested that these processes are characteristic of the intermediate-mass stars, this may only be valid for the Phase I sources to which the HAe stars are comparable. To bridge this gap, it is necessary to observe young intermediate-mass stars in all the evolutionary phases.
In this study, we present the results of a census of He I 10830 and P in 13 young intermediate-mass stars in the Taurus star-forming region, which is one of the nearest active star-forming regions (distance of pc; Kenyon et al. 2008). Given its proximity, this region can be investigated using X-ray to radio wavelengths, and the members of Taurus have been more comprehensively identified (from early type stars to brown dwarfs) than those of any other star-forming region. Given the young age of the Taurus complex (1.5 Myr (Barrado y Navascués & Martín, 2003)), most members are still surrounded by circumstellar materials. Therefore, Taurus is the best target for conducting our first star-formation study with WINERED (Warm INfrared Echelle spectrograph for REalizing Decent infrared high-resolution spectroscopy). WINERED is a spectrograph of high sensitivity and high resolution (with two resolution modes of ,000 and ,000), specifically customized for short NIR bands at 0.9 to 1.35 m (Yasui et al., 2008). WINERED received its first light in 2012 May at the Araki 1.3 m telescope and is now attached to the New Technology Telescope (NTT) (Ikeda et al., 2018); further, it is planned to attach WINERED to the Magellan Telescope. We are continuing to investigate YSOs in the target star-forming regions, including Tr 37 and NGC 7160. By considering that the lifetime of the protoplanetary disks is approximately 10 Myr (e.g., Hernández et al. 2008), these regions are considered to be in different evolutionary phases than Taurus. Tr 37 (4 Myr) is in the middle phase, while NGC 7160 (10 Myr) is in the final phase. Our results for the other regions will be provided in a future work.
This study can be organized as follows. In Section 2, we discuss the target selection, observations, and data reduction. In Section 3, we present the obtained spectra of the Paschen series and He I 10830 and determine the excess continuum emission and residual profiles. We further discuss the properties of the P and He I 10830 lines. In Section 4, we discuss the statistics of the line profile morphologies and present an interpretation of the profile morphology of P and He I 10830 in different evolutionary phases of the protoplanetary disks in combination with other intermediate-mass stars that have been observed in previous studies. We further discuss the possible progression of dominant mass flow processes in the evolution of protoplanetary disks. After comparing the results with those of the previous studies, we finally discuss the implications for theories of mass flow processes.
2 TARGET SELECTION, OBSERVATION AND DATA REDUCTION
2.1 Selection and evolutionary phase of targets
We selected target intermediate-mass stars in the Taurus star-forming region. We defined stars within the mass range of 1.5–7 as intermediate-mass stars (Yasui et al., 2014). The intermediate-mass stars were selected in a similar manner to that of Yasui et al. (2014); assuming a typical age of the Taurus star-forming region, 1.5 Myr (Barrado y Navascués & Martín, 2003), we obtained the spectral types of cluster members from the literature. For the lower mass limit, we used a spectral type of K5 corresponding to 1.5 . Although Yasui et al. (2014) set the upper limit mass at 7 (spectral type B3), even the most massive stars in Taurus possess masses of 4 (spectral type B9), which is substantially lower than the upper mass limit. Among the candidates selected above, the final targets are limited to stars with J-band magnitudes of less than 9 mag in the Two Micron All Sky Survey (2MASS) Point Source Catalog (PSC; Skrutskie et al. 2006). This criterion is required by the limited sensitivity of the Araki 1.3 m telescope’s implementation of WINERED, with which this study’s spectra can be obtained (see Section 2.2). Therefore, 13 target intermediate-mass stars were selected. The properties of the selected target stars are summarized in Table 1.
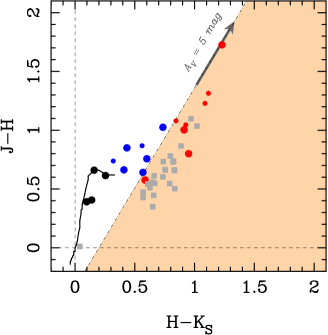
In a previous study (Yasui et al., 2014), we derived the intermediate-mass disk fraction in the near-infrared JHK photometric bands and in the mid-infrared (MIR) bands for young clusters in the age range of 0 to 10 Myr. Yasui et al. (2014) have defined the region to the right of the border line111The border line (the dot-dashed line) passes through the point of and is parallel to the reddening vector (shown with gray arrow in Fig. 1). (region highlighted in orange region in Fig. 1) as the disk excess region on vs. color—color diagram (Fig. 1); stars located on the disk excess region are recognized as stars traced by NIR excess emissions. MIR disk fraction is derived using Spitzer IRAC [3.6]–[8] photometric bands. The stars that have SED slope with the MIR bands () of 2.2 are recognized as stars traced by MIR excess emissions (Kennedy & Kenyon, 2009). In the case of 2.5 -stars, NIR and MIR continuum emissions trace innermost dust disk ( AU) and outer dust disk ( AU), respectively. Yasui et al. (2014) have suggested that in the very early phase, the intermediate-mass stars disperse only their innermost dust disks. They further disperse their outer dust disks with a time lag of 3 to 4 Myr. Therefore, the presence of innermost disks and outer disks surrounding the intermediate-mass stars can be a clear evolutionary indicator. Hereafter, we will refer to the three evolutionary phases of “Phase I” that contains stars with both innermost and outer disks, “Phase II” that contains stars without innermost disks but with outer disks, and “Phase III” that contains stars without innermost and outer disks.
The photometric data for 13 target intermediate-mass stars selected above are shown in Table 1. The data of NIR bands are obtained from the 2MASS PSC for targets, whose all JHK band photometric quality flags are denoted as “A” (signal-to-noise 10 for all JHK bands). Because AB Aur does not satisfy the condition, we used NIR data reported by Kenyon & Hartmann (1995). We plotted our target sources on vs. diagram in Fig. 1. Only four sources (V892 Tau, AB Aur, IRAS 04101+3103, and T Tau) are located in the disk excess region, suggesting that they have innermost dust disks. For MIR data, because IRAC photometric data for most target stars could not be obtained from the IRAC observations of the Taurus star-forming region (e.g., Hartmann et al. 2005), we adopted values derived using Spitzer IRS within –13 m. Nine sources (V892 Tau, AB Aur, IRAS 04101+3103, RY Tau, SU Aur, T Tau, RW Aur, V773 Tau, and UX Tau) have values of 2.2, suggesting that they have outer dust disks. Therefore, the selected targets cover all the evolutionary phases of the protoplanetary disks, with four Phase I sources, five Phase II sources, and four Phase III sources. Four sources (V892 Tau, AB Aur, IRAS 04101+3103, and T Tau) are categorized into Phase I, five sources (RY Tau, SU Aur, T Tau, RW Aur, V773 Tau, and UX Tau) are categorized into Phase II, and four sources (HP Tau/G2, HD 283572, HBC 388, and V410 Tau) are categorized into Phase III. Table 2 summarizes basic disk properties for all the targets, showing classification, mass accretion rate, and disk mass. Notably, no clear distinctive properties are observed between Phase I and II sources except for aforementioned NIR K-band excesses.
We indicate that disks around the intermediate-mass stars necessarily evolve from Phase I to Phase II and, subsequently, to Phase III, while the disks around the low-mass stars evolve from Phase I to Phase III, spending a considerably short time in Phase II (Yasui et al., 2014). It should be noted that HAeBes are categorized into Phase I sources because they are confirmed to contain NIR K-band excesses. Fig. 1 plots HAe stars in a sample used by Cauley & Johns-Krull (2014), whose mass range is roughly comparable to that of our target intermediate-mass stars and whose He I profile morphologies will be later compared with those of our targets (Sections 3.4, 3.4, 4.6); the stars are shown with gray squares. We used NIR data from 2MASS PSC and rejected four sources (V1578 Cyg, HD 17081, HD 37490, and Z CMa), which do not have an “A” photometric quality flag for at least one band in the catalog. Thus, we confirmed that all sources, except one source, are located in the disk excess region having large color excesses. The exception is HD 141569 (), which Cauley & Johns-Krull (2014) categorized into potentially misclassified objects and did not include in their final discussion by indicating that it may not be a HAe star. Fig. 1 also shows the intermediate-mass stars in samples reported by Folha & Emerson (2001) and Edwards et al. (2006) that satisfy the conditions for selecting intermediate-mass stars in Taurus, but are excluded from the sample used in this study due to the limited instrumental sensitivities. They are six sources and their properties are summarized in Table 3. Four of these sources (CW Tau, GM Aur, DR Tau, and DS Tau) are included in both the previous studies, while HP Tau and HN Tau are included in only one of these references (Folha & Emerson 2001 and Edwards et al. 2006). CW Tau, HP Tau, DR Tau, and HN Tau are categorized into Phase I based on their NIR and MIR excesses, while GM Aur and DS Tau are categorized into Phase II. For reference, CTTSs and weak T-Tauri stars (WTTSs) are almost comparable to Phase I and Phase III, respectively, in case of low-mass stars (Yasui et al., 2014).
2.2 WINERED spectroscopy and data reduction
We obtained the spectra of selected targets using the near-infrared (NIR) spectrograph WINERED (Kondo et al., 2015; Ikeda et al., 2016) attached to the Araki 1.3 m-telescope at Koyama Astronomical Observatory, Kyoto-Sangyo University, Japan (Yoshikawa et al., 2012). WINERED has a 1.7 m cutoff HAWAII-2RG infrared array with a pixel scale of pixel-1, simultaneously covering the wavelength range of 0.91–1.35 m. We used a 1.65′′-width slit, corresponding to 2 pixels, which proves a spectral resolving power of or 11 km s-1. Observations were performed during the following three periods: February to March 2013; November 2013 to January 2014; and September to October 2014. Seeing was typically 5′′. To avoid saturation in the emission lines, the exposure time for each frame was set to a duration ranging from 300 to 1200 s. Four to twelve sets of data were obtained for each target, resulting in a total exposure time of 1200 to 7200 s for each target. As the telluric standard stars, the spectra of bright stars with spectral types of late B to early A (B9–A2) at similar airmass () were obtained in a similar fashion within 2 hours of target data acquisition on the same night. As the sole exception, the spectra of an M1III spectral type star, HD 1041, as the telluric standard star were obtained for HP Tau/G2. We summarize the details of the observation in Table 4.
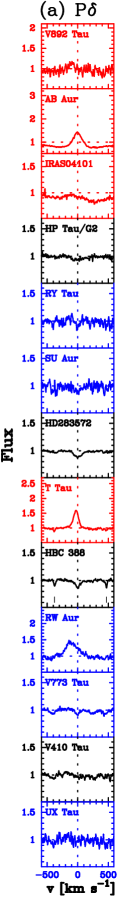
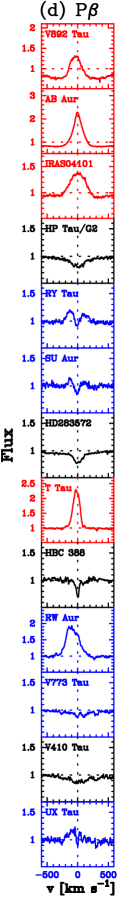
All the data were reduced by following the standard procedures using IRAF, including nodding sky subtraction, dome flat-fielding, and aperture extraction. The argon lamp spectra that were obtained at the end of the observing night were used for performing vacuum wavelength calibration. Each target spectrum was divided by the spectrum of the standard star to rectify for atmospheric absorption and instrumental response after the photospheric features of the standard spectrum were eliminated (Sameshima et al., 2018). For each echelle order, the spectra were normalized to 1.0. For the continuum level at Å, where there are no strong photospheric features in synthetic spectra (see Section 3.2) for all the targets, the estimated signal to noise ratios (S/N) were 30 to 110 (see Table 4 for each target). The spectra around P, P, P, and He I (orders of , and 52, respectively), reduced by following the above procedure, are depicted for all the targets with respect to the stellar velocities in Figure 2. The spectra are sorted by spectral type from the early to late type.
3 Results
The obtained spectra depict several lines, including those of hydrogen (Paschen series), He I, and metals (e.g., Fe I, Si I, Mg I). We focus on hydrogen lines and He I 10830 in this study because these are very sensitive to magnetospheric mass accretion and winds.
3.1 Hydrogen Paschen series
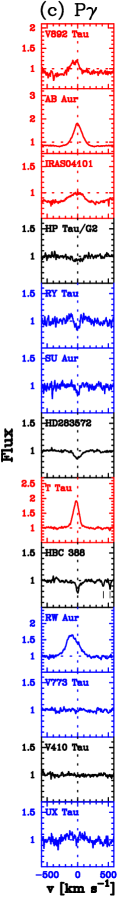
The WINERED wavelength range (–1.35 m) covers four hydrogen lines: P ( Å), P ( Å), P ( Å), and P ( Å), where the numbers in parentheses refer to the vacuum wavelengths. The spectra of P, P, and P are depicted in Figure 2 (panels a, b, and d, respectively). Although each spectrum appears to show similar features across various targets, the S/Ns of the spectra are higher at longer wavelengths, resulting in the features of those spectra becoming more prominent. These tendencies are clearly observed in, e.g., RY Tau, SU Aur, UX Tau, and HP Tau/G2. Consider UX Tau as an example. Although the P spectrum shown in Edwards et al. (2006) exhibits no features, the Pa spectrum in Figure 2 depicts significant features, including double peaks with centered subcontinuum absorption, thereby making the diagnostics of magnetospheric accretion possible. Therefore, we focus on the spectra of P among four lines in the hydrogen Paschen series in this study. This approach can help us to detect the possible characteristics of profile morphologies in different evolutionary phases.
3.2 Removal of photospheric features: Estimation of line broadening, radial velocities, and veilings
The observed spectra comprise circumstellar and photospheric features. To extract the circumstellar features, it is necessary to eliminate the photospheric features. The photospheric features are broadened (line broadening, ), and shifted because of radial velocities (RVs); further, they also exhibit continuum excesses. The excess can be referred to as “veiling,” which is defined as the ratio of the excess emission to the underlying stellar photosphere (see Hartigan et al. 1989). We eliminate the photospheric features using the following procedure. First, by comparing the observed spectra with the synthetic spectra, the stellar properties, line broadenings, radial velocities RVs, and veilings can be obtained. We further obtain the circumstellar features by subtracting the synthetic spectra from the observed spectra by considering the aforementioned stellar properties.
For each object, we constructed the synthetic spectra using the analysis program SPTOOL (Takeda, 1995; Takeda & Kawanomoto, 2005), which is based on the ATLAS9 programs from Kurucz (1993). We adopted the metal line list in Meléndez & Barbuy (1999) and the molecular lines from the Vienna Atomic Line Database (VALD3; Ryabchikova et al. 2015). Further, we assumed solar abundance and spectral type from the literature (see Table 1). The adopted parameters for the synthetic spectra, effective temperature (), surface gravity (), and microturbulent velocity are provided below. The effective temperatures were adopted from Gray (2005) (Table B.1. in Appendix B). In a case that the spectral types for targets were not listed in Gray (2005), close spectral types were used (see Table 5, column 2). The was calculated with , stellar mass (), and stellar luminosity (). Because the model dependence of is considered to be very small (Takagi et al., 2011), we used the values of , , and from a PMS isochrone model, Siess et al. (2000), by considering the age of Taurus (1.5 Myr old). The obtained values are 4.1 for spectral type B8, 3.5 for spectral type K0, and 3.7 for spectral types K3–K5. We adopted the values of 4.1 for late B to early A type stars (V892 Tau, AB Aur, and IRAS 04101+3103), 3.5 for G0–K1 type stars (HP Tau/G2, RY Tau, SU Aur, HD 283572, T Tau, and HBC 388), and 3.7 for K3–K5 type stars (RW Aur, V773 Tau, V410 Tau, and UX Tau). For microturbulent velocity, we adopted 2 km s-1 according to Gray et al. (2001), who observed a tight correlation between microturbulence and in the spectral range of late A- to early G-type (see Fig. 7 in Gray et al. 2001).
We derived line broadening , radial velocity RV, and Y- and J-band veilings ( and , respectively) for each target by fitting the obtained synthetic spectra with the observed spectra. First, we roughly estimated 222Here, is parameterized by FWHM. However, because the output velocity in MPFIT is a convolution of and the instrumental broadening, and is parameterized by the e-folding half width, it is converted to according to Takeda et al. (2008). and RV by fitting the obtained synthetic spectra with the observed spectra using the automatic profile-fitting program MPFIT (Takeda, 1995) included in SPTOOL. Note that the veilings are not yet considered at this stage. Among the spectra shown in Fig.2 (, 52, 51, and 44), our fitting procedure used spectra with interference order , which included He I 10830, because these spectra show a large number of relatively deep lines, with normalized counts of less than 0.7 in normalized synthetic spectra at km s-1. The deep lines used for the fitting, in the wavelength ranges of –10815 Å and 10855–10875 Å, are not affected by the He I 10830 features and do not include data with very low S/N due to the edges of the spectra. The lines used for the stars with spectral types G–K2 were Si I (10730.3, 10752.3, 10787.5, 10789.8, 10871.8, 10872.5), Mg I 10814.1, and C I 10732.5. For stars with spectral type of K3 or later, the Fe I lines (10756.0, 10786.0) were used in addition to the above lines; however, C I was not used because it was weak in case of later-type stars. We further derived , RVs, and by comparing several synthetic spectra. The best fit was determined using the minimum chi-squared value by varying the three parameters of , RV, and . The synthetic spectra were constructed using the following limits on each parameter: (1) values around initially estimated values with 5 km s-1 step; (2) values in the range of 0.0 to 2.0 with 0.1 step; and (3) observed spectra with wavelength shifts for RVs with 0.1 Å step. For the fitting, the same wavelength range was used as was used in the initial estimate of . When estimating and RV, we also estimated using spectra with order in the same way as the derivation of but in the spectral range of to 12700 using lines of Fe I 12642.2, Fe I 12652.2, and Na I 12682.7. The obtained properties (, RV, , and ) are summarized in Table 5. Finally, we obtained residual profiles of P and He I by subtracting synthetic spectra considering the obtained properties from observed spectra. The profiles relative to the stellar rest velocities are shown in Figure 3.
We note that we could not estimate , RV, and veilings using the above procedure for three early-type stars with spectral types of late B–early A: V892 Tau, AB Aur, and IRAS 0401+3103. This was due to a lack of prominent photospheric features in their spectra except for H I. There are only a small number of photospheric features in the spectra for such early-type stars, and even the existing features become quite broadened and very shallow due to the large rotation velocities (e.g., km s-1 for AB Aur; 100 km s-1 for V897 Tau). Instead, we used synthetic spectra assuming and RV values from the literature, without considering veilings (,), for the subtraction of photospheric features from the observed spectra. As for of AB Aur, only the projected rotation velocity () was provided by the literature (Alecian et al., 2013), km s-1. Nonetheless, we had to input , using combinations of and macroturbulence velocity (), when making synthetic spectra with SPTOOL. Alecian et al. (2013) assumed a of 2 km s-1, and suggested that in the case that is larger than 40 km s-1, is not a significant parameter. Therefore, we adopted their values for . Also, for the value for V892 Tau, only (116 km s-1) was provided by the literature (Mooley et al., 2013). Although we could not find the adopted value of , it should be negligible for , considering the large value. Therefore, we adopted this value as . However, we could not find any literature references for the and RV values for IRAS 04101+3103. We adopted the average value of RVs for all target objects in this paper (Table 1 Col. (9)) that all exist in the Taurus star-forming region, 20 km s-1. For , we assumed a value of 100 km s-1, similar to those for AB Aur and V892 Tau, considering that their spectral types are almost the same and their disks evolutionary phases are the same (Phase I). As for veilings, we could not find any references about veilings for these three sources. Because the photospheric He I lines show prominent features only in very early-type stars, B5 and earlier (Cauley & Johns-Krull, 2014), which are not included in our targets, variations of synthetic spectra have little impact on our residual profiles. However, because photospheric P lines show very prominent absorption features in late B- and early A-type stars (our early-type targets), differences between photospheric features in assumed synthetic spectra and those in actual spectra may have a great impact on the residual profiles in normalization. We discuss the possible impact of assuming zero veilings on obtained residual profiles in Section 3.3.
Estimated , RV, , and values for each target are summarized in Table 5. WTTSs, comparable to Phase III objects in this paper, are known to show no veiling (e.g., Edwards et al., 2006), while correlation between mass accretion rate and veiling for CTTSs is suggested (e.g., Beristain et al., 2001). For all four Phase III objects (HP Tau/G2, HD 283572, HBC 388, and V410 Tau), and are estimated to be almost zero although some estimated values are non-zero ( for HP Tau/G2; for HD 283572). Therefore, taking all results of Phase III objects into an account, estimated veilings are 0.1, suggesting that veilings are accurately estimated with uncertainties of 0.1.
3.3 P line profiles
Paschen line emissions are thought to arise primarily in the magnetospheric accretion column (Hartmann et al., 2016). Although profiles of Paschen lines in obtained spectra (P, P, P, and P) show similar morphologies, we discuss those of P that show the most prominent features, as discussed in § 3.1. In this section, we focus on the properties of P emission for each source. We discuss the implications for the profile morphology in Section 4.
We detected P in 8 of our 13 targets (all Phase I sources, and all Phase II sources except V773 Tau), while these lines are not detected in 5 sources (V773 Tau and all Phase III sources). The detection rates for Phase I, II, and III objects are 100 % (4/4), 80 % (4/5), and 0 % (0/4), respectively. In Table 6, we summarize the P profile parameters obtained from the residual profiles (Figure 3), showing object name in column 1, profile type in column 2, the maximum blueshifted and redshifted line velocities ( and ) in columns 3 and 4, the velocity of peak emission and absorption ( and ) in columns 5 and 6, the line fluxes relative to the continuum at the peak emission and absorption velocities ( and ) in columns 7 and 8, emission and absorption equivalent widths (Em. and Ab. ) in columns 9 and 10, and the type of subcontinuum absorption in column 11. In column 2, we categorize residual spectra into morphology groups based on the classification scheme of Cauley & Johns-Krull (2014). They divided the line profiles into six groups: (1) P-Cygni (PC), (2) inverse P-Cygni (IPC), (3) pure absorption (A), (4) single-peaked emission (E), (5) double-peaked emission (DP), and (6) featureless (F). We added a new category, a profile with both blueshifted and redshifted subcontinuum absorption but with zero or one emission peak (hereafter, “BR”). Reipurth et al. (1996) has reported another well-known classification. The groups E, PC, and IPC in the classification by Cauley & Johns-Krull (2014) correspond to type I, type IV B, and type IV R in the classification of Reipurth et al. (1996), respectively, and that group DP by Cauley & Johns-Krull (2014) comprises type II and type III of Reipurth et al. (1996).
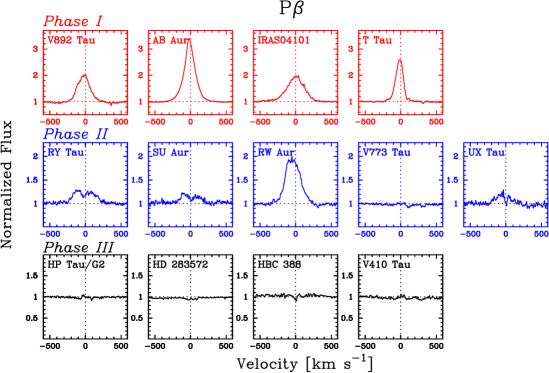
The P profiles for the targets are categorized into the following four groups; group E, group DP, group IPC, and group F. The profiles of all the four Phase I sources (V892 Tau, AB Aur, IRAS 04101+3103, and T Tau) are categorized into group E. They all exhibit approximately symmetric and broad features with km s-1 for all the sources, and and of 300 km s-1 except for T Tau ( km s-1). They have slightly redward absorption features judging from values exceeding by 50 km s-1. In addition, the profiles of three of the sources (RY Tau, SU Aur, and UX Tau) are categorized into group DP. All the sources in this group have influence from redward absorption, judging from . The profile for UX Tau shows subcontinuum absorption centered on the stellar rest velocity. The profile of RW Aur is categorized into group IPC, which has a very slight subcontinuum feature with . Finally, the profiles of the remaining five sources (V773 Tau, HP Tau/G2, HD 283572, HBC 388, and V410 Tau) are categorized into group F.
We note the possibility that photospheric features in P profiles for A- and B-type stars (V892 Tau, AB Aur, and IRAS 04101+3103) are not completely removed in residual profiles shown in Fig. 3 because there is no information on veilings for the early type stars and we tentatively adopted synthetic spectra assuming zero veilings as photospheric features (Section 3.2). We checked the variation of obtained residual profiles assuming the extreme case of high veilings, 2.0, as shown in Table 6 in parentheses. As a result, we found that variations are 100 km s-1. Although the variations are very large, their impacts are negligible because the interpretation of the profile is only based on line morphology and not line width or intensity (Section 4.2).
3.4 He I 10830 line profiles
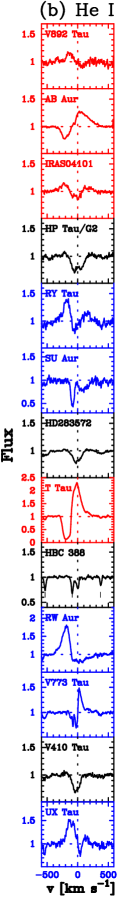
He I 10830 line emissions are thought to have a composite origin, including contributions from wind, from the funnel flow, and from an accretion shock (Edwards et al., 2006). In this section, we focus on the properties of He I emission for each source. We discuss the implication of the profile morphology in Section 4.
We detect He i 10830 features with absorption below the continuum in all of our targets. The detection rates of He I lines for Phase I, II, and III objects are 100 % (4/4), 100 % (5/5), and 100 % (4/4), respectively. In Table 7, we summarize the He I profile parameters that are obtained from residual profiles in Fig. 3, in the same manner as for P profile parameters in Section 3.3. In column 2, we categorize He I residual spectra into morphology groups in Section 3.3.
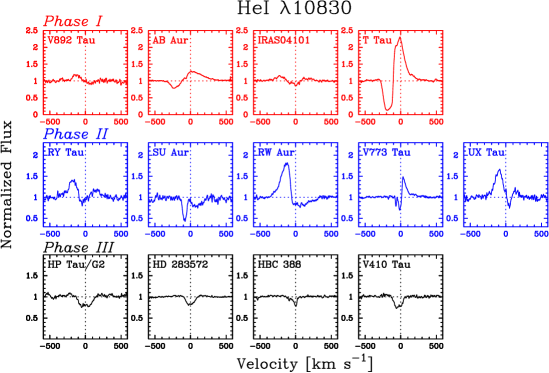
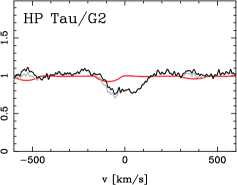
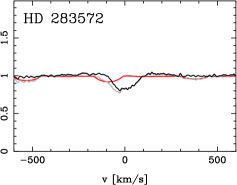
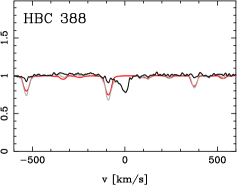
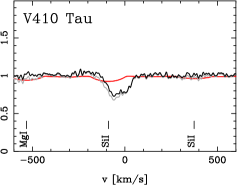
The He I profiles for the targets are categorized into five groups, group IPC, group PC, group DP, group BR, and group A. The profiles of two sources (V892 Tau and RW Aur) are categorized into group IPC; both exhibit broad features with and of 250 km s-1. The profiles of three of the sources (AB Aur, T Tau, and V773 Tau) are categorized into group PC; the profiles of AB Aur and T Tau exhibit broad features with and km s-1, while that of V773 Tau has relatively narrow features with and km s-1. The profiles of three of the sources (IRAS 04101+3101, RY Tau, and UX Aur) are categorized into group DP; they exhibit broad features with and of 250 km s-1. The profiles of all the four Phase III sources (HP Tau/G2, HD 283572, HBC 388, and V410 Tau) are considered to be group A; they demonstrate centered subcontinuum and exhibit narrow profiles with and of 150 km s-1. The profile of SU Aur is assigned to a new category, group BR; it exhibits redshifted and blueshifted subcontinuum absorption, which is relatively narrow feature with and km s-1.
4 DISCUSSION
Our WINERED data present a variety of profile morphologies in P and He I 10830 lines. In this section, 13 sources observed in this study and the six sources observed in previous studies (among them five sources each for P and He I; Folha & Emerson 2001, Edwards et al. 2006; see Section 2.1) are considered in combination for obtaining improved statistical accuracy. The statistics of the categorized line profile morphologies (Section 4.1) and the manner in which the profile morphology for each target provides an insight into magnetospheric accretion and inner winds (Section 4.2), and the possible progression of dominant processes thorough the disk evolutionary phases (Section 4.3) are discussed herein. The suggested progression is compared with previous studies (Section 4.4). The chromospheric activities in Phase III sources from He I profile morphologies are also evaluated (Section 4.5). Finally, the implications of the results are considered for the theories of mass flow processes (Section 4.6).
4.1 Profile morphologies
4.1.1 P line profile morphologies
Among the six additional stars, Folha & Emerson (2001) presented the P profiles for five of them (CW Tau, HP Tau, GM Aur, DR Tau, and DS Tau). The P line profile morphologies for 18 intermediate-mass stars (the 13 targets observed in the present study and the five additional targets observed in previous studies) are considered in combination. Based on the classification scheme in Section 3.3, they are categorized into two groups: two (CW Tau and DR Tau) in group DP and three (HP Tau, GM Aur, and DS Tau) in group IPC (see Table 3).
The statistics of the P line profile morphologies for 18 intermediate-mass stars for each evolutionary phase are summarized in Table 8. The P line profiles for Phase I sources are categorized into three groups: four (V892 Tau, AB Aur, IRAS 04101+3103, and T Tau) in group E; two (CW Tau and DR Tau) in group DP; and one (HP Tau) in group IPC. The P line profiles for Phase II sources are categorized into three groups: three (RY Tau, SU Aur, and UX Tau) in group DP; three (RW Aur, GM Aur, and DS Tau) in group IPC; and one (V773 Tau) in group F. Finally, the P line profiles of all of the Phase III sources are categorized into group F. The statistics of Phase III are clearly different from those of Phase I and II, while those of Phase I and Phase II do not appear to differ significantly, except for the fact that a large fraction of Phase I sources but none of the Phase II sources are present in group E. Edwards et al. (2006) reported the P profiles for five sources (CW Tau, GM Aur, DR Tau, DS Tau, and HN Tau) among the six additional sources noted in Section 2.1. The trends observed in this profiles are similar to those in the P profiles although the P profile features are sometimes weaker than the P features (Section 3.1): of the Phase I sources, among which two are in group E and one is in group IPC, and of the Phase II sources, among which one is in group F and one is in group IPC. However, it should be noted that the profile types are not necessarily the same for each source between P profiles presented by Folha & Emerson (2001) and P profiles presented by Edwards et al. 2006. Considering that the spectra of P and P show similar features across various targets in the same observation period (see Section 3.1), the differences of the profile types can be attributed to the differences in the observation period; this will be further discussed in Section 4.3.
We compared P profile morphologies for intermediate-mass stars and those from previous Paschen line spectroscopic observations of YSOs with high spectral resolution (Folha & Emerson, 2001; Edwards et al., 2006). These studies’ targets were primarily low-mass333Some of the targets by Folha & Emerson (2001) and Edwards et al. (2006) are the same as ours: V773 Tau, RY Tau, T Tau, SU Aur, and RW Aur in Folha & Emerson (2001); SU Aur, RW Aur, and UX Tau in Edwards et al. (2006). T Tauri stars. Folha & Emerson (2001) presented P line profiles for 49 T Tauri stars (44 CTTSs, four WTTSs, and one variable star between CTTS and WTTS). Among them, 45 sources (41 CTTSs, three WTTSs, and one variable star between CTTS and WTTS) with sufficient S/Ns are counted later in this paper444Folha & Emerson (2001) pointed out that for some sources P lines are too noisy to allow a reliable classification of their profiles: three CTTSs (DQ Tau, FX Tau and GH Tau), and one WTTS (DI Tau).. Edwards et al. (2006) presented P line profiles for 48 T Tauri stars (39 CTTSs, 6 WTTSs, and three Class I sources). Although the observations by Edwards et al. (2006) were not for P, the P morphology of the profile is known to be reminiscent of the P profile (Edwards et al., 2006). Folha & Emerson (2001) detected P emission in 38 of 41 CTTSs in their sample, while Edwards et al. (2006) detected P emission in 38 of 39 CTTSs in their sample. For profiles of low-mass stars from previous studies, redshifted absorption features are common, while none shows blueshifted absorption features. This is the case with obtained profiles for intermediate-mass stars in our sample. For comparison, we show the statistics of profile morphology of Paschen lines for CTTSs by Folha & Emerson (2001) and Edwards et al. (2006) in Table 8. For both samples, the occurrence rate of group E is highest (50 to 70 %). This tendency is similar to that for Phase I sources in the intermediate-mass star sample. Considering that CTTSs are comparable to Phase I (Section 2.1), this tendency seems to be a natural consequence. The occurrence rate of group IPC sources is the second highest for CTTSs in previous studies conducted by Folha & Emerson (2001) and Edwards et al. (2006), 20 to 30 %. This is not inconsistent with those for Phase I and II sources in the intermediate-mass star sample. Meanwhile, group DP sources are very rare in CTTSs (10 %), as suggested by Folha & Emerson (2001), while occurrence rate is relatively high for Phase I and II sources in the intermediate-mass star sample (30–40 %). This may be characteristics for intermediate-mass stars. However, the statistics of CTTSs do not appear to differ significantly from those of Phase I and II sources in the intermediate-mass star sample. Lastly, we also show the statistics of profile morphology of Paschen lines for WTTSs, which are comparable to low-mass stars in Phase III, by Folha & Emerson (2001) (P) and Edwards et al. (2006) (P) in Table 8. Paschen lines are undetected in almost all WTTSs, both in Folha & Emerson (2001) and in Edwards et al. (2006), prompting a classification in group F. This result is consistent with those for our target intermediate-mass stars in Phase III.
4.1.2 He I line profile morphologies
Among the six additional stars, Edwards et al. (2006) reported the He I profiles for five of them (CW Tau, GM Aur, DR Tau, DS Tau, and HN Tau). In this section, the He I line profile morphologies for 18 intermediate-mass stars (the 13 targets observed in the present study and the five additional targets observed in previous studies are considered. The sources are categorized into four groups based on the classification scheme in Section 3.3: two (CW Tau and HN Tau) are assigned to group DP, one (GM Aur) is assigned to group F, one (DR Tau) is assigned to group PC, and one (DS Tau) is assigned to group BR (see Table 3).
The statistics of the He I line profile morphologies for the 18 intermediate-mass stars for each evolutionary phase are shown in Table 9. The line profiles of Phase I sources are categorized into three groups: three (AB Aur, T Tau, and DR Tau) are categorized into group PC, three (IRAS 04101+3103, CW Tau, and HN Tau) are in group DP, and one (V892 Tau) is in group IPC. The Phase II sources are categorized into five groups: two (RY Tau and UX Tau) in group DP, two (SU Aur and DS Tau) in group BR, one (RW Aur) in group IPC, one (V773 Tau) in group PC, and one (GM Aur) in group F. Finally, all the Phase III sources are categorized into group A. Based on these statistics, the He I profiles of the sources in Phase I and II are similar to each other but the profiles of the Phase III sources are clearly different (all in group A) from those in the remaining phases. However, in terms of broadness of spectral features, there seem to be clear differences between Phase I and II sources: all four Phase I sources show broad features with or of 250 km s-1, while some Phase II sources (SU Aur and V773 Tau) show narrow features with or of 250 km s-1.
We compare He I 10830 profile morphologies for intermediate-mass stars with those from previous He I spectroscopic observations of YSOs with high spectral resolution. For these comparisons, we reference Oudmaijer et al. (2011) and Cauley & Johns-Krull (2014) for HAeBes (corresponding to intermediate-mass stars in Phase I) and Edwards et al. (2006) mainly for low-mass T Tauri stars. As for intermediate-mass stars, Oudmaijer et al. (2011) detected He I features in 79 out of 90 of their sample HAeBes. Although all of their spectra are not shown in their paper, the partially shown observed spectra (not residual profiles) show group PC, IPC, or DP profiles. Cauley & Johns-Krull (2014) observed 56 HAeBes, 28 HAe stars and 28 HBe stars. For HAe stars, whose mass range is roughly comparable to that of our targets in this paper, they detected He I features in 26 stars. We summarize statistics of profile morphology for their targets in Table 9 based on their Fig. 4. As a result, the occurrence frequencies of groups PC and IPC are relatively higher compared to those of the other types. The statistics of HAe stars are not inconsistent with those of Phase I and Phase II sources in the intermediate-mass star sample in this study. Cauley & Johns-Krull (2014) pointed out that narrow blueshifted absorption features are not seen in HAe stars in their sample while broad blueshifted absorption features are common. This tendency is also seen in our Phase I sources. Considering that narrow blueshifted absorption features are seen only in some Phase II objects in the sample of intermediate-mass stars (RY Tau, SU Aur, V773 Tau, and DS Tau), these features may be characteristics for Phase II objects.
As for low-mass stars, Edwards et al. (2006) detected He I features in 38 of 39 CTTSs in their sample. We show the statistics of He I profile morphology for low-mass stars from Edwards et al. (2006) in Table 9. CTTSs are categorized into almost all profile types. The occurrence frequency of group PC is highest, while that of group BR is second highest. Group PC sources are observed among both Phase I and II sources in the intermediate-mass star sample, but group BR sources are only observed among Phase II sources. However, the statistics of CTTSs do not appear to differ significantly from those of Phase I and II sources in the intermediate-mass star sample. Edwards et al. (2006) suggested that broad P Cygni-like profiles are more common among stars of high veilings (), while narrow emission coupled with both blueshifted and redshifted absorption is more common among stars with low veilings (). This tendency aligns with the results of the intermediate-mass samples for He I profiles: group PC sources are more common in Phase I, while some sources with narrow emission and redshifted and blueshifted absorption features are seen only in Phase II. On the contrary, we also show the statistics of He I profile morphology for WTTSs by Edwards et al. (2006), which are comparable to low-mass stars in Phase III, in Table 9. The highest occurrence frequency belongs to group F (featureless) for four sources, and the second highest is group E (pure emission) for two sources. This result is not consistent with those for our target intermediate-mass stars in Phase III, which will be discussed later (Section 4.2.3).
4.2 Interpretation of P and He I line profile morphologies
Paschen lines exhibit a centered emission peak and a redshifted absorption that can be used as diagnostics for magnetospheric accretion, while He i profiles show both blueshifted and redshifted absorptions that can be used as diagnostics for magnetospheric accretion flows and inner winds, respectively (Hartmann et al., 2016). We largely based our interpretations on profile morphology of P and He I line profile rather than line width or intensity.
4.2.1 Magnetospheric accretion
Both P and He i line profiles show redshifted absorptions that can be used as diagnostics for magnetospheric accretion (e.g., Folha & Emerson 2001, Edwards et al. 2006, Fischer et al. 2008, Kurosawa et al. 2011). First, we diagnose the sources in which sources magnetospheric accretions are functioning using the P line profiles. The line profiles for RW Aur, HP Tau, GM Aur, and DS Tau show redshifted subcontinuum features, displaying a clear magnetospheric accretion signature. For nine sources (V892 Tau, AB Aur, IRAS 04101+3103, T Tau, RY Tau, SU Aur, UX Tau, CW Tau, and DR Tau), the observed line profiles show emission features but do not show redshifted subcontinuum features. Among them, four sources (V892 Tau, AB Aur, IRAS 04101+3103, and T Tau) are categorized into group E (pure emission), whereas five sources (RY Tau, SU Aur, UX Tau, CW Tau, and DR Tau) are categorized into group DP (double-peaked emission). Considering the sources in group E have and that the sources in group DP, except for CW Tau, have , they show slight influence from redward absorption features, suggesting that magnetospheric accretion activities are functioning. The model Br line profiles555Br line profiles are known to show very similar features to P line profiles (Folha & Emerson, 2001). for sources with magnetospheric accretion calculated by Muzerolle et al. (1998a) also show a redward absorption feature (not subcontinuum features) at inclination angles of 60∘ (see their Fig. 5). Therefore, the P observed line profiles suggest that magnetospheric accretion processes are functioning in the eight sources that exhibit emission features but not redshifted subcontinuum features, except for CW Tau, in addition to four sources that do exhibit redshifted subcontinuum features.
He I can also be used as diagnostics for magnetospheric accretion. The observed line profiles for five sources (V892 Tau, SU Aur, RW Aur, UX Tau, and DS Tau) show redshifted subcontinuum features, displaying a clear magnetospheric accretion signature. For the other sources in Phase I and II, except for GM Aur, the line profiles show He I emissions but do not show the redshifted subcontinuum features. This seems to suggest that the activities of magnetospheric accretion are not functioning. However, Kurosawa et al. (2011) indicated that wind-related He I emissions are relatively minor, whereas the magnetosphere is a main emission contributor (see Fig. 12 in Kurosawa et al. 2011). The line profiles for three sources (RY Tau, CW Tau, and HN Tau), which are categorized into group DP, also show redward absorption features, judging from , suggesting magnetospheric accretion activities. Therefore, He I profiles for all Phase I and II sources, except for GM Aur, suggest magnetospheric activities.
In summary, all Phase I and II sources suggest magnetospheric activities from the observed line profiles of P and He I although the profile for approximately half of them (V892 Tau, SU Aur, RW Aur, UX Tau, HP Tau, GM Aur, and DS Tau) show redshifted subcontinuum features in P and/or He I lines, which are clear magnetospheric accretion signatures.
4.2.2 Inner winds
He i profiles show both blueshifted and redshifted absorptions that can be used as diagnostics for magnetospheric accretion flows and inner winds, respectively (Hartmann et al., 2016). Kwan et al. (2007) modeled blueshifted absorption at He I 10830 in CTTS via scattering of the stellar and veiling continua as a probe of inner winds, while Kurosawa et al. (2011) presented multidimensional non-local thermodynamic equilibrium radiative transfer models of hydrogen and helium line profiles formed in the magnetospherical accretion and inner winds of CTTSs, including He i 10830 and P. Both models are consistent with the scenario in which the narrow blueshifted absorption component of He i 10830 seen in observations is caused by a disk wind, and the wider blueshifted absorption component (the terminal velocity of the wind up to 400 km s-1) is caused by stellar wind.
In the sample of intermediate-mass stars, the line profiles for seven sources (AB Aur, RY Tau, SU Aur, T Tau, V773 Tau, DR Tau, and DS Tau) have blueshifted subcontinuum absorption features. Among them, the line profiles for AB Aur, T Tau, and DR Tau are categorized into group PC with broad blueshifted subcontinuum absorption (300–400 km s-1). They are consistent with the stellar wind case. The line profiles for RY Tau, SU Aur, V773 Tau, and DS Tau show narrow blueshifted subcontinuum absorption features, with terminal wind volocities of 150 km s-1. They are consistent with the disk wind case. The stellar wind is suggested to be functioning in AB Aur, T Tau, and DR Tau, whereas the disk wind is suggested to be functioning in RY Tau, SU Aur, V773 Tau, and DS Tau.
4.2.3 Phase III sources
The observed P profiles show group F features (featureless), while the observed He i profiles for all Phase III sources show group A features (pure absorption) with centered subcontinuum absorption. These features are not expected in model profiles in the case of disk wind, or stellar wind (e.g., Kurosawa et al. 2011). This suggests that these sources have no such activities. Moreover, because absorption features in He i are broader for sources with larger , the lines are more likely to be stellar intrinsic features than circumstellar features.
4.3 Progression of dominant processes with evolution of protoplanetary disks
In Section 4.2, observed P and He I profiles for each source were interpreted. In Phase I, three sources (AB Aur, T Tau, and DR Tau) show features of stellar wind, while the other four sources (V892 Tau, IRAS 04101+3103, CW Tau, and HN Tau) show no features of inner winds. For magnetospheric accretion, only V892 Tau and HP Tau show clear features, while the other sources show features suggesting the activity. In Phase II, four sources (RY Tau, SU Aur, V773 Tau, and DS Tau) show features of disk wind, while the other three sources (RW Aur, UX Tau, and GM Aur) show no features of inner winds. For magnetospheric accretion, five sources (SU Aur, RW Aur, UX Tau, GM Aur, and DS Tau) show clear features, while the other two sources show the feature suggesting the activities. In Phase III, no targets show activities of mass accretion, disk winds, or stellar winds. This suggests that dominant processes in different evolutionary phases are different, particularly for inner winds. This finding indicates a progression of dominant mass flow processes with disk evolution: stellar wind and probably magnetospheric accretion in Phase I, magnetospheric accretion and disk wind in Phase II, and no activities in Phase III. In particular, progression is observed for inner winds. The statistics of the blueshifted absorption types for He I lines, broad or narrow, which are used for diagnostics of dominant inner winds, are summarized in Table 9.
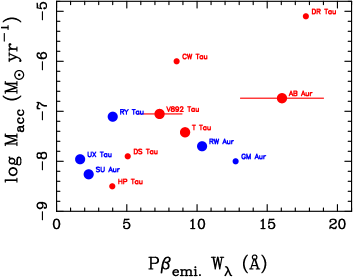
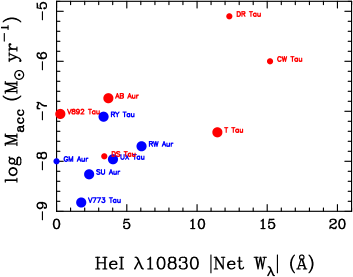
However, some points still need to be considered. i) YSOs tend to be variable, which can make line profiles differ among observation periods (Bouvier et al., 2003). Previous studies suggest that the general features of the observed line profiles do not change between periods although the lines can show 10 % variabilities (e.g., Kurosawa et al. 2005, Edwards et al. 2006). However, the times between observations were not very long (a year at longest in the study conducted by Edwards et al. (2006)). On the contrary, the P line profile morphologies reported by Folha & Emerson (2001) and the P line profile morphologies reported by Edwards et al. (2006) for the same sources show clear difference (e.g., those of CW Tau and DR Tau; see Table 3). Considering that the P morphology of the profile is known to be reminiscent of the P profile (Edwards et al. 2006, see also Section 3.1), the line profiles can vary by approximately seven rears, reported for the Paschen series, which has a long time separation (1994–1995 by Folha & Emerson 2001 and 2001–2002 by Edwards et al. 2006). Therefore, continuous observation of He I is necessary in the future. ii) The targets in this study are limited to only 19 sources. 11 sources are excluded due to limited instrumental sensitivities but they satisfy other conditions for selecting the target intermediate-mass stars (Section 2.1). A large fraction of the excluded sources are of the latest spectral type, K5, according to the criteria for selecting the intermediate-mass stars. Because each spectral type corresponds to a certain range of star masses and ages, the sources should have marginal masses between low mass and intermediate mass (Yasui et al., 2014). Thus, the exclusion may not be necessarily bad to avoid contaminating the sample of low-mass stars. However, because the excluded sources may alter the statistics, more observations are necessary in the future. To investigate the universality of the suggested progression, YSOs of a wide variety of ages and masses should be observed. iii) The spectral types of Phase I targets appear earlier (three A- or B- type and five K- type stars) than those of Phase II and III targets (G–K type stars). This bias may impact observed profiles, influencing our interpretation of dominant activities in each source and phase. However, such tendencies are not necessarily true for all intermediate-mass sources observed in this study, e.g., the later spectral type of T Tau (K0) than those of HP Tau/G2 (G0), RY Tau (G1), SU Aur (G1), and HD 283572 (G5). Also, such tendencies are not seen in the six intermediate-mass stars in the samples of Folha & Emerson (2001) and Edwards et al. (2006) (see Section 2.1). Therefore, the differences in spectral type should not generate a systematic bias. iv) From Tables 2 and 5, Phase I sources appear to have larger mass accretion rates. We plotted P and He I equivalent widths vs. mass accretion rate for our intermediate-mass targets with measured mass accretion rate in Fig. 4. Sources of Phase I and II are indicated in red and blue, respectively. P emission equivalent width are shown in the left panel. The figure suggests that P emission equivalent widths are moderately correlated with mass accretion rate (), as suggested in Folha & Emerson (2001), and that Phase I sources seem to have larger mass accretion. This may suggest that mass accretion rate determines dominant activities of inner winds. However, such tendencies are not necessarily true for all sources, e.g., T Tau (Phase I) has a smaller mass accretion rate than that of RY Tau (Phase II) for the targets observed in the present study, and the mass accretion rates of HP Tau and DS Tau (Phase I) are smaller or comparable to those for Phase II sources. This is also discussed in Section 4.4 in the context of previous studies (e.g., Edwards et al. 2006). For reference, we also plotted the sum of absolute values of emission and absorption of He I equivalent widths, which is introduced by Edwards et al. (2006), vs. mass accretion rate (Fig. 4, right panel). This shows that the equivalent values of He I are also correlated with mass accretion rate (), which Edwards et al. (2006) specified using their sample CTTSs. v) Finally, the weakening of stellar wind signatures and strengthening of disk wind signatures in Phase II may be due solely to an overall weakening in stellar wind activities through disk evolution. Kwan et al. (2007) indicated that excitation conditions for He I 10830 are more favorable in stellar wind than in disk wind. In any case, the suggested progression does not change significantly: stellar winds (and possibly disk winds as well) are active at first, and then disk winds become relatively active. However, further quantitative approaches using the fitting of observed profiles with model profiles are necessary in future work.
4.4 Comparison of suggested progression of dominant processes with previous studies
Although we could not find previous results for high-resolution spectroscopy of young intermediate-mass stars with both He I and P, the He I profiles for HAeBes are presented in Cauley & Johns-Krull (2014). For HAe stars, whose mass range is roughly comparable to that of our targets, the statistics of their P and He I line profile morphologies are not significantly different from those of Phase I and II sources, as discussed in Section 4.1. Cauley & Johns-Krull (2014) pointed out that in HAe stars, disk winds (evidenced by narrow blueshifted absorption features) are not functioning, while stellar winds (evidenced by commonly broad blueshifted absorption features) are functioning. A summary of the statistics of the He I blueshifted subcontinuum absorption features for the HAe stars is presented in Table 9. These results are consistent with our results for Phase I sources. Admittedly, our data set has a small sample size (seven Phase I sources). But the agreement between the results of their large sample (28 HAe stars) and those of our smaller sample reinforces the suggestion that dominant processes for Phase I are stellar wind and probably magnetospheric accretion.
Previous authors have posited alternative mechanisms for the progression of dominant processes. Edwards et al. (2006) mainly focused on veilings as an indicator of disk evolutionary phases, since veilings are suggested to be correlated with mass accretion rate. Kwan et al. (2007) used a comparison of their theoretical line profiles with observed profiles from Edwards et al. (2006). They identified 11 and 15 CTTSs having blueshifted absorption features that resemble the disk wind models and stellar wind models, respectively. A summary of the statistics of the He I absorption features for CTTSs is presented in Table 9. Edwards et al. (2006) suggested that stars with high disk accretion rates are more likely to have stellar wind signatures than disk wind signatures. However, note that CTTSs in all veiling groups show morphological features of group PC, with broad with broad redshifted absorption suggesting stellar wind, even with the lowest observed veiling, . In addition, all groups show profiles with narrow absorption features suggesting disk wind, even with the highest observed veiling, (see Fig. 10 in Edwards et al. 2006). This set of observations suggests that the trend is not so significant. We find this unsurprising, since the veiling, and thus the mass accretion rate, will not necessarily be a clear indicator of disk evolution as discussed in Section 2.1. As a result, a clear progression of profile morphologies with veilings is not observed.
4.5 Chromospheric activities in Phase III sources
In Section 4.2.3, Phase III sources were suggested to show no activities for mass accretion or inner winds. This is consistent with WTTSs reported in Edwards et al. (2006). WTTSs are known to exhibit high levels of chromospheric and coronal features (Stelzer et al., 2013), which persist at the age of 50 to 100 Myr (Stauffer et al., 1994). The chromospheric profile has often been observed as emission lines in X-ray and optical lines such as H, H, Ca II, and Na I lines. Chromospheric activities are also recognized from He I 10830 absorption lines (e.g., Vaughan & Zirin 1968), and are suggested to persist for star ages as advanced as those of Pop II stars (Takeda & Takada-Hidai, 2011). We suggest that He i absorption features detected here are most likely to be chromospheric features, considering that Phase III sources are almost comparable to WTTSs (Yasui et al., 2014) and that the observed He i features in this paper are suggested to be stellar intrinsic features (see Section 4.2.3). Note that the centered subcontinuum absorption features are not necessarily indicative of the chromospheric activities. When the features are accompanied by emissions, the profiles are categorized into group DP (e.g., IRAS 04101+3103). Cauley & Johns-Krull (2014) suggested that the profiles are most likely to be formed because of Keplerian rotation very close to the stellar surface. Also, it should be noted that the photospheric features have little impact on the He I residual profiles. Fig. 5 shows synthetic spectra, observed spectra, and residual profiles for all four Phase III sources. Three photospheric features are observed in the spectral region, Mg I 10814.1 and Si I (10830.1 and 10846.8); among them, only Si I 10830.1 profiles appear to cover He I profile. However, the line is very shallow for HP Tau/G2, HD 283572, and V410 Tau due to the large , 100 km s-1, while the line barely covers the He I profile for HBC 388 due to the small , 25 km s-1. Fig. 5 suggests that the photospheric features are moderately removed by subtracting synthetic spectra from observed spectra (Section 3.2).
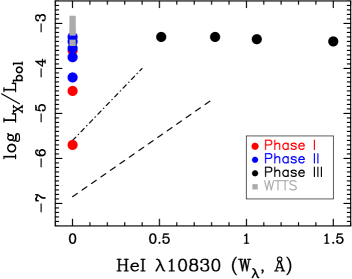
The He I line is a transition between lower metastable level of 23S and the upper level of 23P. Two mechanism have been proposed for populating the upper levels of He I: photoionization-recombination (PR) mechanism via EUV and X-ray radiations (Goldberg, 1939) and electron collisions from the ground level (Andretta & Jones, 1997). The existence or nonexistence of correlation between He I absorption and X-ray luminosity can discern which process is dominant (Zarro & Zirin, 1986); the correlation exists when PR mechanism is dominant, while the correlation is absent when collisional excitation is dominant. We show fractional X-ray luminosities () vs. He I absorption equivalent widths (EWs) for all Phase III sources in Fig. 6. EWs are obtained from Table 7, whereas is obtained from previous studies (Güdel et al. 2007, Wichmann et al. 1996). All Phase III sources have in the very small range of 3.4–3.5, whereas EWs span within 0.5–1.5. For comparison, we also show the results from Zarro & Zirin (1986) in Fig. 6, who presented the correlation in dwarfs and giants. Thus, EW and are not correlated in Phase III sources, suggesting that the dominant mechanism for these sources is electron collisions rather than PR mechanism. Phase I and II sources are plotted in Fig. 6 for reference although we could not find any literature references for the value of IRAS 04101+3103.
The He I absorption features associated with chromospheric activities had not been previously reported for YSOs, to our knowledge. In Edwards et al. (2006), no WTTSs show He i absorption features although He i line profiles for two WTTSs show emission features (see Section 3.4) and these authors surmised that these features arise in active chromosphere or very weak accretion. We suggest that the features detected even in such young phases are characteristics of intermediate-mass stars, considering that these authors’ targets were primarily low-mass stars and that all of our intermediate-mass star targets in Phase III show the He I absorption features. This pattern may be due solely to a positive correlation between stellar mass and X-ray luminosities (Güdel et al., 2007), which can be correlated with chromospheric activities. We show values of the WTTSs in Edwards et al. (2006) in Fig. 6 (gray squares). The values for the WTTSs (3.4–2.9; Güdel et al. 2007, Bertout et al. 2007, Yang et al. 2012, Kastner et al. 2016, Kastner et al. 2004), which are comparable to those of our Phase III sources. Therefore, the reason for the detection of He I chromospheric absorption features only in our intermediate-mass targets in Phase III is not likely the correlation between stellar mass and X-ray luminosities.
Correlations of chromospheric and higher-temperature features with stellar age, magnetic field, and rotation period properties have been previously reported (Linsky, 2017). For the first factor, the He I absorption features are not seen in the sample WTTSs of Edwards et al. (2006), which are also the sources in the same star forming-region as our targets, i.e., the Taurus star-forming region. Therefore, the stellar age does not seem to be the cause for the He I detection in Phase III sources. For the second factor, although there are only limited number of derivation of magnetic fields, there seem to be no significant differences between those for our Phase III sources and WTTSs reported in Edwards et al. (2006): 0.5–1.5 kG for HBC 388 and V410 Tau (Basri et al. 1992, Skelly et al. 2010), 0.5–2 kG for LkCa 4, V891 Tau, and V827 Tau (Donati et al. 2014, Donati et al. 2015, Giardino et al. 2006). Therefore, the magnetic field may not likely to be the cause for the He I detection in Phase III sources. For the last factor, i.e., rotation, Phase III sources generally have large , 100 km s-1 (Table 5), while WTTSs in the sample of Edwards et al. (2006) generally have small values, 20 km s-1 (Rebull et al., 2004). Most theoretical models of stellar magnetic dynamos predict increasing magnetic flux emerging through stellar photospheres with larger rotation velocities (Linsky, 2017). This suggests that the larger rotation velocities may be the possible cause for the detection of He I absorptions in Phase III sources.
4.6 Implication to theories of mass flow processes
Although configurations of mass flow processes around central stars have been proposed, we do not yet have a conclusive theory explaining angular momentum transport in the star formation process. From the suggested progression of dominant mass flow processes with evolution of protoplanetary disks in Section 4.3, we discuss what factors determine which processes dominate, or in which physical conditions one dominates the other. These connections may help put useful constraints on current theories.
Before launching into this discussion, it is necessary to pay attention to whether intermediate-mass stars can be regarded as simply massive T Tauri stars. Cauley & Johns-Krull (2014) presented high-resolution He I observations of HAeBes, which correspond to intermediate-mass stars in Phase I. They suggested that HAe stars, whose mass range is roughly comparable to that of our targets, cannot be regarded as massive CTTSs because they do not show signatures of magnetospheric accretion and inner winds in the same manner as CTTSs: HAe stars show signatures of magnetospheric accretion and stellar winds but do not show signatures of disk winds666Cauley & Johns-Krull (2014) suggested that HBe stars, in general, do not show signatures of magnetospheric accretion and disk winds, whereas show signatures of stellar winds.. They pointed out the possibility that the magnetospheres might be smaller, based on the paucity of detected magnetic fields for HAeBes, compared to CTTSs. They confirmed small magnetospheres from their results that maximum absorption velocities in the redshifted absorption profiles in their sample are a smaller fraction of the system escape velocity than in CTTSs. They suggested that the small magnetospheres may be less efficient at driving disk winds compared to CTTS magnetospheres. The similar trends are also suggested for CTTSs by Kwan et al. (2007): stars with the highest disk accretion rates are less likely to have redshifted absorption from magnetospheric funnel flows. They suggested that their disks have small magnetospheres, which may set up favorable conditions for stellar wind rather than disk wind. The maximum redshifted absorption velocities in all obtained He I line profiles of both Phase I and II sources in our intermediate-mass targets having redshifted absorption features are estimated to be as small as those of HAe stars, 400 km s-1. Assuming stellar radii of our targets (stellar mass of 1.5 ) based on the isochrone model at the age of 1.5 Myr by Siess et al. (2000), escape velocities of our targets are calculated to be 500km s-1. The fraction of the system escape velocity estimated with the above velocities (i.e., the maximum redshifted absorption velocities and escape velocities) for our targets is smaller than for CTTSs, corresponding to ballistic infall from distances of 2 toward central stars. This is again consistent with that for HAe stars (see Fig. 5 in Cauley & Johns-Krull 2014). This suggests that magnetospheres of intermediate-mass stars are generally smaller than those of CTTSs. Nonetheless, signatures of disk winds are seen in Phase II sources although the same trends (signatures of stellar winds) as seen in HAe stars are seen in Phase I sources. This suggests that the lack of disk wind signatures in HAe stars is not a characteristic for intermediate-mass stars, but only for HAe stars, or Phase I sources. Further, there should be another factor that functions more effectively than magnetosphere size for determining dominant mass flow processes.
The inner part of a protoplanetary disk in Phase II has low opacity and is where most dust settling/growth is expected to be occurring. In contrast, the inner disk in Phase I has high opacity but without substantial dust settling/growth (Yasui et al., 2014). Due to the low opacity in Phase II, radiation from central stars can penetrate deeply into disks, and thus the ionization fraction should be higher. This may be the reason why disk winds are active in Phase II. This interpretation is consistent with the theory of disk wind in which a sufficient magnetic field and ionization fraction launch magnetocentrifugal winds over a significant range of radii in the disk, from an inner truncation radius out to several AU (Ouyed & Pudritz, 1997). In addition, Phase III stars, having already lost their entire dust disks, show profiles with no signature of accretion or of inner winds. The absence of these signatures in Phase III, along with the presence of these signatures in Phase I and II, is consistent with the previous suggestion that inner winds (stellar winds and disk winds) are accretion-driven.
5 Conclusion
We performed near-infrared high-resolution (,000) spectroscopy of 13 young intermediate-mass stars in the Taurus star-forming region with WINERED. Our obtained spectra (–1.35 m) depict He i 10830 and P lines that are sensitive to magnetospheric accretion and winds. We investigate five sources each for P and He I lines from previous studies, in addition to the 13 targets observed in this study. Based on the presence of near- and mid-infrared continuum emission, young intermediate-mass stars can be classified into three different evolutionary stages: Phases I, II, and III in the order of evolution.
-
1.
Phase I and II sources exhibit a variety of profile morphologies in P, while all Phase III sources are in group F (i.e., they are featureless). The statistics of the P profile morphologies for Phase I and Phase II sources are not significantly different except that almost half of Phase I sources show group E features, while none of Phase II sources exhibit the features. The statistics of Phase I and II sources are not inconsistent with those of low-mass CTTSs. Furthermore, the morphology statistics for Phase III sources are consistent with those of low-mass WTTSs.
-
2.
Phase I and II sources also show variety of He I profile morphologies. The profile morphologies of Phase I and Phase II sources are mostly broad subcontinuum absorption lines and narrow subcontinuum absorption lines, respectively; however, the statistics of these profile morphologies are not significntly different and are comparable to those of low-mass CTTSs. On the contrary, all Phase III sources are in group A (i.e., they exhibit pure absorption) with centered subcontinuum absorption features, inconsistent with the characteristics of low-mass WTTSs.
-
3.
By comparing observed P and He I line profiles with model profiles, dominant mass flow processes are suggested to be stellar wind and probably magnetospheric accretion in Phase I; magnetospheric accretion and disk wind in Phase II; and no activities in Phase III.
-
4.
The different dominant processes in different phases indicate a clear progression of dominant mass flow processes with disk evolution. However, because this study may not contain a statistically significant number of sources, more statistical studies are necessary to draw a firm conclusion.
-
5.
The mass flow processes in HAe stars are consistent with Phase I, with stellar wind as the dominant process. As for the progression of mass flow processes, the trends in veilings found by other authors do not seem so significant compared to that suggested in this paper based on disk evolutionary phase. Although the absence of activities in Phase III is consistent with previous studies for low-mass WTTSs, we note that He I line profiles do show chromospheric activities in these sources.
-
6.
Disk wind signatures are seen in Phase II sources, despite their smaller magnetospheres, which was suggested to be the reason for the absence of the signature in HAe stars by other authors. Alternatively, we suggest that opacity in protoplanetary disks plays an important role in determining dominant mass flow processes.
References
- Akeson et al. (2002) Akeson, R. L., Ciardi, D. R., van Belle, G. T., & Creech-Eakman, M. J. 2002, ApJ, 566, 1124
- Alecian et al. (2013) Alecian, E., Wade, G. A., Catala, C., et al. 2013, MNRAS, 429, 1001
- Andretta & Jones (1997) Andretta, V., & Jones, H. P. 1997, ApJ, 489, 375
- Andrews & Williams (2005) Andrews, S. M., & Williams, J. P. 2005, ApJ, 631, 1134
- Andrews et al. (2011) Andrews, S. M., Wilner, D. J., Espaillat, C., et al. 2011, ApJ, 732, 42
- Ansdell et al. (2017) Ansdell, M., Williams, J. P., Manara, C. F., et al. 2017, AJ, 153, 240
- Ardila et al. (2002) Ardila, D. R., Basri, G., Walter, F. M., Valenti, J. A., & Johns-Krull, C. M. 2002, ApJ, 566, 1100
- Barrado y Navascués & Martín (2003) Barrado y Navascués, D., & Martín, E. L. 2003, AJ, 126, 2997
- Basri et al. (1992) Basri, G., Marcy, G. W., & Valenti, J. A. 1992, ApJ, 390, 622
- Beristain et al. (2001) Beristain, G., Edwards, S., & Kwan, J. 2001, ApJ, 551, 1037
- Bertout & Genova (2006) Bertout, C., & Genova, F. 2006, A&A, 460, 499
- Bertout et al. (2007) Bertout, C., Siess, L., & Cabrit, S. 2007, A&A, 473, L21
- Bessell & Brett (1988) Bessell, M. S., & Brett, J. M. 1988, PASP, 100, 1134
- Bodenheimer (1995) Bodenheimer, P. 1995, ARA&A, 33, 199
- Bouvier et al. (1995) Bouvier, J., Covino, E., Kovo, O., et al. 1995, A&A, 299, 89
- Bouvier et al. (2003) Bouvier, J., Grankin, K. N., Alencar, S. H. P., et al. 2003, A&A, 409, 169
- Calvet & Hartmann (1992) Calvet, N., & Hartmann, L. 1992, ApJ, 386, 239
- Calvet et al. (2004) Calvet, N., Muzerolle, J., Briceño, C., et al. 2004, AJ, 128, 1294
- Cauley & Johns-Krull (2014) Cauley, P. W., & Johns-Krull, C. M. 2014, ApJ, 797, 112
- Corder et al. (2005) Corder, S., Eisner, J., & Sargent, A. 2005, ApJ, 622, L133
- Donati et al. (2014) Donati, J.-F., Hébrard, E., Hussain, G., et al. 2014, MNRAS, 444, 3220
- Donati et al. (2015) Donati, J.-F., Hébrard, E., Hussain, G. A. J., et al. 2015, MNRAS, 453, 3706
- Donati et al. (2016) Donati, J. F., Moutou, C., Malo, L., et al. 2016, Nature, 534, 662
- Donehew & Brittain (2011) Donehew, B., & Brittain, S. 2011, AJ, 141, 46
- Dong et al. (2018) Dong, R., Najita, J. R., & Brittain, S. 2018, ApJ, 862, 103
- Edwards et al. (2006) Edwards, S., Fischer, W., Hillenbrand, L., & Kwan, J. 2006, ApJ, 646, 319
- Espaillat et al. (2010) Espaillat, C., D’Alessio, P., Hernández, J., et al. 2010, ApJ, 717, 441
- Fischer et al. (2008) Fischer, W., Kwan, J., Edwards, S., & Hillenbrand, L. 2008, ApJ, 687, 1117-1144
- Folha & Emerson (1999) Folha, D. F. M., & Emerson, J. P. 1999, A&A, 352, 517
- Folha & Emerson (2001) Folha, D. F. M., & Emerson, J. P. 2001, A&A, 365, 90
- Furlan et al. (2006) Furlan, E., Hartmann, L., Calvet, N., et al. 2006, ApJS, 165, 568
- Furlan et al. (2011) Furlan, E., Luhman, K. L., Espaillat, C., et al. 2011, ApJS, 195, 3
- Garcia Lopez et al. (2006) Garcia Lopez, R., Natta, A., Testi, L., & Habart, E. 2006, A&A, 459, 837
- Giardino et al. (2006) Giardino, G., Favata, F., Silva, B., et al. 2006, A&A, 453, 241
- Goldberg (1939) Goldberg, L. 1939, ApJ, 89, 673
- Grady et al. (1999) Grady, C. A., Woodgate, B., Bruhweiler, F. C., et al. 1999, ApJ, 523, L151
- Gray (2005) Gray, D. F. 2005, The Observation and Analysis of Stellar Photospheres, 3rd ed. (Cambridge: Cambridge Univ. Press)
- Gray et al. (2001) Gray, R. O., Graham, P. W., & Hoyt, S. R. 2001, AJ, 121, 2159
- Güdel et al. (2007) Güdel, M., Briggs, K. R., Arzner, K., et al. 2007, A&A, 468, 353
- Hamidouche (2010) Hamidouche, M. 2010, ApJ, 722, 204
- Hartigan et al. (1989) Hartigan, P., Hartmann, L., Kenyon, S., Hewett, R., & Stauffer, J. 1989, ApJS, 70, 899
- Hartmann (2008) Hartmann, L. 2008, Physica Scripta Volume T, 130, 014012
- Hartmann (2009) Hartmann, L. 2009, Accretion Processes in Star Formation, 2nd edition, by Lee Hartmann. Cambridge, UK: Cambridge University Press, 2009. ISBN-13: 9780521531993,
- Hartmann et al. (1982) Hartmann, L., Avrett, E., & Edwards, S. 1982, ApJ, 261, 279
- Hartmann et al. (1998) Hartmann, L., Calvet, N., Gullbring, E., & D’Alessio, P. 1998, ApJ, 495, 385
- Hartmann et al. (2016) Hartmann, L., Herczeg, G., & Calvet, N. 2016, ARA&A, 54, 135
- Hartmann et al. (2005) Hartmann, L., Megeath, S. T., Allen, L., et al. 2005, ApJ, 629, 881
- Hatzes (1995) Hatzes, A. P. 1995, ApJ, 451, 784
- Herbst (1989) Herbst, W. 1989, AJ, 98, 2268
- Herbst et al. (1997) Herbst, T. M., Robberto, M., & Beckwith, S. V. W. 1997, AJ, 114, 744
- Hernández et al. (2008) Hernández, J., Hartmann, L., Calvet, N., et al. 2008, ApJ, 686, 1195-1208
- Ingleby et al. (2013) Ingleby, L., Calvet, N., Herczeg, G., et al. 2013, ApJ, 767, 112
- Ikeda et al. (2016) Ikeda, Y., Kobayashi, N., Kondo, S., et al. 2016, Proc. SPIE, 9908, 99085Z
- Ikeda et al. (2018) Ikeda, Y., Kobayashi, N., Kondo, S., et al. 2018, Society of Photo-Optical Instrumentation Engineers (SPIE) Conference Series, 10702, 107025U
- Isella et al. (2010) Isella, A., Carpenter, J. M., & Sargent, A. I. 2010, ApJ, 714, 1746
- Johns-Krull, & Gafford (2002) Johns-Krull, C. M., & Gafford, A. D. 2002, ApJ, 573, 685
- Joncour et al. (1994a) Joncour, I., Bertout, C., & Bouvier, J. 1994a, A&A, 291, L19
- Joncour et al. (1994b) Joncour, I., Bertout, C., & Menard, F. 1994b, A&A, 285,
- Kastner et al. (2004) Kastner, J. H., Huenemoerder, D. P., Schulz, N. S., et al. 2004, ApJ, 605, L49
- Kastner et al. (2016) Kastner, J. H., Principe, D. A., Punzi, K., et al. 2016, AJ, 152, 3
- Kennedy & Kenyon (2009) Kennedy, G. M., & Kenyon, S. J. 2009, ApJ, 695, 1210
- Kenyon et al. (2008) Kenyon, S. J., Gómez, M., & Whitney, B. A. 2008, Handbook of Star Forming Regions, Volume I, 4, 405
- Kenyon & Hartmann (1995) Kenyon, S. J., & Hartmann, L. 1995, ApJS, 101, 117
- Kondo et al. (2015) Kondo, S., Ikeda, Y., Kobayashi, N., et al. 2015, arXiv:1501.03403
- Kurosawa et al. (2005) Kurosawa, R., Harries, T. J., & Symington, N. H. 2005, MNRAS, 358, 671
- Kurosawa & Romanova (2012) Kurosawa, R., & Romanova, M. M. 2012, MNRAS, 426, 2901
- Kurosawa et al. (2011) Kurosawa, R., Romanova, M. M., & Harries, T. J. 2011, MNRAS, 416, 2623
- Kurucz (1993) Kurucz, R. 1993, Diatomic Molecular Data for Opacity Calculations. Kurucz CD-ROM No. 15. Cambridge, Mass.: Smithsonian Astrophysical Observatory, 1993., 15,
- Kwan et al. (2007) Kwan, J., Edwards, S., & Fischer, W. 2007, ApJ, 657, 897
- Linsky (2017) Linsky, J. L. 2017, ARA&A, 55, 159
- Liu et al. (2011) Liu, T., Zhang, H., Wu, Y., Qin, S.-L., & Miller, M. 2011, ApJ, 734, 22
- Meléndez & Barbuy (1999) Meléndez, J., & Barbuy, B. 1999, ApJS, 124, 527
- Monnier et al. (2008) Monnier, J. D., Tannirkulam, A., Tuthill, P. G., et al. 2008, ApJ, 681, L97
- Mooley et al. (2013) Mooley, K., Hillenbrand, L., Rebull, L., Padgett, D., & Knapp, G. 2013, ApJ, 771, 110
- Mundt (1984) Mundt, R. 1984, ApJ, 280, 749
- Muzerolle et al. (1998a) Muzerolle, J., Calvet, N., & Hartmann, L. 1998a, ApJ, 492, 743
- Muzerolle et al. (2001) Muzerolle, J., Calvet, N., & Hartmann, L. 2001, ApJ, 550, 944
- Muzerolle et al. (2003) Muzerolle, J., Calvet, N., Hartmann, L., & D’Alessio, P. 2003, ApJ, 597, L149
- Muzerolle et al. (2004) Muzerolle, J., D’Alessio, P., Calvet, N., & Hartmann, L. 2004, ApJ, 617, 406
- Muzerolle et al. (1998b) Muzerolle, J., Hartmann, L., & Calvet, N. 1998b, AJ, 116, 2965
- Oudmaijer et al. (2011) Oudmaijer, R. D., van den Ancker, M. E., Baines, D., et al. 2011, Astronomische Nachrichten, 332, 238
- Ouyed & Pudritz (1997) Ouyed, R., & Pudritz, R. E. 1997, ApJ, 482, 712
- Rebull et al. (2004) Rebull, L. M., Wolff, S. C., & Strom, S. E. 2004, AJ, 127, 1029
- Reipurth et al. (1996) Reipurth, B., Pedrosa, A., & Lago, M. T. V. T. 1996, A&AS, 120, 229
- Rice & Strassmeier (1996) Rice, J. B., & Strassmeier, K. G. 1996, A&A, 316, 164
- Rieke & Lebofsky (1985) Rieke, G. H., & Lebofsky, M. J. 1985, ApJ, 288, 618
- Ryabchikova et al. (2015) Ryabchikova, T, Piskunov, N., Kurucz, R., et al. 2015, PhyS, 90, 054005
- Sameshima et al. (2018) Sameshima, H., Matsunaga, N., & Kobayashi, N., et al. 2018, accepted to PASP
- Sanz-Forcada & Dupree (2008) Sanz-Forcada, J., & Dupree, A. K. 2008, A&A, 488, 715
- Shu et al. (1994) Shu, F., Najita, J., Ostriker, E., Wilkin, F., Ruden, S., & Lizano, S. 1994, ApJ, 429, 781
- Siess et al. (2000) Siess, L., Dufour, E., & Forestini, M. 2000, A&A, 358, 593
- Simon et al. (2016) Simon, M. N., Pascucci, I., Edwards, S., et al. 2016, ApJ, 831, 169
- Skrutskie et al. (2006) Skrutskie, M. F., Cutri, R. M., Stiening, R., et al. 2006, AJ, 131, 1163
- Skelly et al. (2010) Skelly, M. B., Donati, J.-F., Bouvier, J., et al. 2010, MNRAS, 403, 159
- Stauffer et al. (1994) Stauffer, J. R., Caillault, J.-P., Gagne, M., Prosser, C. F., & Hartmann, L. W. 1994, ApJS, 91, 625
- Stelzer et al. (2013) Stelzer, B., Frasca, A., Alcalá, J. M., et al. 2013, A&A, 558, A141
- Strassmeier (1994) Strassmeier, K. G. 1994, A&A, 281, 395
- Strassmeier et al. (1998) Strassmeier, K. G., Bartus, J., Kovari, Z., Weber, M., & Washuettl, A. 1998, A&A, 336, 587
- Takagi et al. (2011) Takagi, Y., Itoh, Y., Oasa, Y., & Sugitani, K. 2011, PASJ, 63, 677
- Takeda (1995) Takeda, Y. 1995, PASJ, 47, 287
- Takeda & Kawanomoto (2005) Takeda, Y., & Kawanomoto, S. 2005, PASJ, 57, 45
- Takeda et al. (2008) Takeda, Y., Sato, B., & Murata, D. 2008, PASJ, 60, 781
- Takeda & Takada-Hidai (2011) Takeda, Y., & Takada-Hidai, M. 2011, PASJ, 63, 547
- Tang et al. (2012) Tang, Y.-W., Guilloteau, S., Piétu, V., et al. 2012, A&A, 547, A84
- Ustyugova et al. (1995) Ustyugova, G. V., Koldoba, A. V., Romanova, M. M., Chechetkin, V. M., & Lovelace, R. V. E. 1995, ApJ, 439, L39
- Vaughan & Zirin (1968) Vaughan, A. H., Jr., & Zirin, H. 1968, ApJ, 152, 123
- Weaver (1987) Weaver, W. B. 1987, ApJ, 319, L89
- White & Ghez (2001) White, R. J., & Ghez, A. M. 2001, ApJ, 556, 265
- Wichmann et al. (1996) Wichmann, R., Krautter, J., Schmitt, J. H. M. M., et al. 1996, A&A, 312, 439
- Williams & Cieza (2011) Williams, J. P., & Cieza, L. A. 2011, ARA&A, 49, 67
- Winn & Fabrycky (2015) Winn, J. N., & Fabrycky, D. C. 2015, ARA&A, 53, 409
- Wittkowski et al. (2002) Wittkowski, M., Schöller, M., Hubrig, S., Posselt, B., & von der Lühe, O. 2002, Astronomische Nachrichten, 323, 241
- Yang et al. (2012) Yang, H., Herczeg, G. J., Linsky, J. L., et al. 2012, ApJ, 744, 121
- Yasui et al. (2014) Yasui, C., Kobayashi, N., Tokunaga, A. T., & Saito, M. 2014, MNRAS, 442, 2543
- Yasui et al. (2008) Yasui, C., Kondo, S., Ikeda, Y., et al. 2008, Proc. SPIE, 7014, 701433
- Yoshikawa et al. (2012) Yoshikawa, T., Ikeda, Y., Fujishiro, N., et al. 2012, Proc. SPIE, 8444, 84446G
- Zarro & Zirin (1986) Zarro, D. M., & Zirin, H. 1986, ApJ, 304, 365
| Object | R.A. | Decl. | SpT | ||||
| (J2000.0) | (J2000.0) | (mag) | (mag) | (mag) | |||
| (1) | (2) | (3) | (4) | (5) | (6) | (7) | (8) |
| V892 Tau | 04:18:40.62 | +28:19:15.5 | B9 | 8.5 | 6.6 | 6.2 | 1.75 |
| AB Aur | 04:55:45.85 | +30:33:04.3 | A0 | 6.3* | 5.5* | 4.5* | 0.79 |
| IRAS 04101+3103 | 04:13:20.02 | +31:10:47.3 | A1 | 9.2 | 8.7 | 8.1 | 0.97 |
| HP Tau/G2 | 04:35:54.15 | +22:54:13.6 | G0 | 8.1 | 7.5 | 7.2 | 0.43 |
| RY Tau | 04:21:57.41 | +28:26:35.6 | G1 | 7.2 | 6.1 | 5.4 | 0.16 |
| SU Aur | 04:55:59.38 | +30:34:01.5 | G1 | 7.2 | 6.6 | 6.0 | 0.32 |
| HD 283572 | 04:21:58.84 | +28:18:06.5 | G5 | 7.4 | 7.0 | 6.9 | 2.85 |
| T Tau | 04:21:59.43 | +19:32:06.4 | K0 | 7.2 | 6.2 | 5.3 | 0.56 |
| HBC 388 | 04:27:10.57 | +17:50:42.6 | K1 | 8.8 | 8.4 | 8.3 | 2.78 |
| RW Aur | 05:07:49.57 | +30:24:05.2 | K3 | 8.4 | 7.6 | 7.0 | 0.67 |
| V773 Tau | 04:14:12.92 | +28:12:12.3 | K3 | 7.5 | 6.6 | 6.2 | 1.10 |
| V410 Tau | 04:18:31.11 | +28:27:16.1 | K3 | 8.4 | 7.8 | 7.6 | 2.78 |
| UX Tau | 04:30:03.99 | +18:13:49.4 | K5 | 8.6 | 8.0 | 7.6 | 1.99 |
Notes.
Col. (4) Spectral types from Furlan et al. (2006, 2011).
Cols. (5)–(7) NIR magnitude from the 2MASS Point Source Catalog, J-band (Col. 5), H-band (Col. 6), and -band magnitude
(Col. 7).
Magnitudes for AB Aur are obtained from a study reported by
Kenyon & Hartmann (1995), shown with ‘*’.
Col. (8) SED slope () with Spitzer IRS 6–13 m presented in
Furlan et al. (2006).
| Object | Phase | SED | C/WTTS | |||
| (deg.) | ( yr-1) | () | ||||
| (1) | (2) | (3) | (4) | (5) | (6) | (7) |
| V892 Tau | I | II | W | 60 (Mo08), 59 (Ha10) | 10.5 (DNB18), 7.2 (Liu11) | 0.009 |
| AB Aur | I | II | C | 45 (Gr99), 22 (Co05), 40 (Ta12) | 14.1 (GNTH06), 1.8 (DB11), 39 (DNB18) | 0.004 |
| IRAS 04101+3103 | I | II | C | … | … | … |
| HP Tau/G2 | III | III | W | 50 (We87), 67 (Bo95) | … | … |
| RY Tau | II | II | C | 86 (Mu03), 66 (Is10) | 6.4–9.2 (Ca04) | 0.02 |
| SU Aur | II | II | C | 62 (Ak02), 86 (Mu03) | 0.5–0.6 (Ca04) | 0.0009 |
| HD 283572 | III | III | W | 35 (St98), 48 (Wi02), 60 (JBB94) | … | 0.0004 |
| T Tau | I | II | C | 19 (HRB97), 20 (Ar02) | 3.1–5.7 (Ca04), 3.2 (WG01) | 0.008 |
| HBC 388 | III | III | W | 45 (Ar02) | 0.9 (WG01) | 0.0003 |
| RW Aur | II | II | C | 40 (Ar02) | 2.0 (In13) | 0.004 |
| V773 Tau | II | II | W | 34 (Si16) | 0.15 (Si16) | 0.0005 |
| V410 Tau | III | III | W | 54 (Ha95), 70 (JBM94, St94, RS96), | 0.16 (WG01) | 0.0004 |
| 80 (He89), 90 (Bo95) | ||||||
| UX Tau | II | II | C | 35 (An11) | 1.1 (Es10) | 0.005 |
Notes.
Col. (2) Phase of dust disk (Phase I/II/III) from Yasui et al. (2014) (see
Section 2.1).
Col. (3) SED classification type (Class I/II/III).
Col. (4) Accretion-based classification type (CTTS or WTTS).
Col. (5) Inclination angles.
Note that the angles for Phase III sources are often estimated with
stellar rotation periods and stellar rotational velocities, while those
for Phase I and II sources are estimated from observations of their
disks.
Col. (6) Mass accretion rate.
Col. (7) Dust disk masses derived by Andrews & Williams (2005).
References.
Mo08: Monnier et al. (2008),
Ha10: Hamidouche (2010),
DNB18: Dong et al. (2018),
Liu11: Liu et al. 2011,
Gr99: Grady et al. (1999),
Co05: Corder et al. (2005),
Ta12: Tang et al. (2012),
GNTH06: Garcia Lopez et al. (2006),
DB11: Donehew & Brittain (2011),
We87: Weaver (1987),
Bo95: Bouvier et al. (1995),
Mu03: Muzerolle et al. (2003),
Is10: Isella et al. (2010),
Ca04: Calvet et al. (2004),
Ak02: Akeson et al. (2002),
St98: Strassmeier et al. (1998),
Wi02: Wittkowski et al. (2002),
JBB94: Joncour et al. (1994a),
HRB97: Herbst et al. (1997),
Ar02: Ardila et al. (2002),
WG01: White & Ghez (2001),
In13: Ingleby et al. (2013),
Si16: Simon et al. (2016),
Ha95: Hatzes (1995),
JBM94: Joncour et al. (1994b),
St94: Strassmeier (1994),
RS96: Rice & Strassmeier (1996),
He89: Herbst (1989),
An11: Andrews et al. (2011),
Es10: Espaillat et al. (2010).
| Object | SpT | Phase | P (P) | He I | ||||
|---|---|---|---|---|---|---|---|---|
| —————————————— | —————————— | |||||||
| Data | Group | Abs. Type | Data | Group | Abs. Type | |||
| (1) | (2) | (3) | (4) | (5) | (6) | (7) | (8) | (9) |
| CW Tau | K3 | I | ✓(✓) | DP (E) | … (…) | ✓ | DP | … |
| HP Tau | K3 | I | ✓ | IPC | r | |||
| GM Aur | K3 | II | ✓(✓) | IPC (F) | r (…) | ✓ | F | … |
| DR Tau | K5 | I | ✓(✓) | DP (IPC) | … (r) | ✓ | PC | b |
| DS Tau | K5 | II | ✓(✓) | IPC (IPC) | r (r) | ✓ | BR | b, r |
| HN Tau | K5 | I | (✓) | (E) | (…) | ✓ | DP | … |
Notes.
Col. (2): Spectral types from Furlan et al. (2006, 2011).
Col. (3): Phase of dust disk (Phase I/II/III) from Yasui et al. (2014)
(see Section 2.1).
Cols. (4)–(6): Properties of the P line profiles with those of
P profiles (shown in parenthes).
The tick marks in Col. 4 mean that the corresponding spectra are
available in Folha & Emerson (2001) for P and Edwards et al. (2006)
for P.
Col. (5): Morphology groups based on the classification scheme in
Section 3.3.
Col. (6): Type of subcontinuum absorption (blue, red, or centered
subcontinuum absorption, denoted by b, r, and c, respectively).
Cols. (7)–(9): Properties of He I line profiles; the tick
marks in Col. 7 indicate that the corresponding spectra are
available in Edwards et al. (2006).
Col. (8): Morphology groups based on the classification scheme in
Section 3.3.
Col. (9): Type of subcontinuum absorption (blue, red, or centered
subcontinuum absorption, denoted by b, r, and c, respectively).
| Object | Obs date | Airmass | Exp time | S/Na | Standardb |
|---|---|---|---|---|---|
| (YYYY/MM/DD) | (sec z) | (s) | |||
| V892 Tau | 2013/12/08 | 1.0–1.1 | 4800 () | 58 | HR 104 (A2Vs) |
| AB Aur | 2013/02/22 | 1.2 | 1200 | 82 | HIP53910 (A1V) |
| IRAS 04101+3103 | 2014/09/28 | 1.1–1.2 | 3000 () | 59 | HR 196 (A2Vs) |
| HP Tau/G2 | 2013/12/04 | 1.0 | 2400 () | 54 | HD 1041 (M1III) |
| RY Tau | 2013/02/23 | 1.3–1.4 | 1200 () | 43 | HIP58001 (A0Ve+K2V) |
| 2013/02/23 | 1.5–1.8 | 1200 () | HIP23179 (A1V) | ||
| SU Aur | 2013/03/03 | 1.8-2.5 | 1800 () | 34 | HIP76267 (A0V) |
| HD 283572 | 2013/11/30 | 1.0 | 2400 () | 113 | omi Aur (A2Vp) |
| T Tau | 2013/12/02 | 1.2-1.3 | 7200 () | 94 | HR 196 (A2Vs) |
| HBC 388 | 2014/10/15 | 1.2-1.3 | 2400 () | 84 | HR 922 (B9V) |
| RW Aur | 2013/12/03 | 1.0 | 4800 () | 55 | HR1736 (A2V) |
| V773 Tau | 2013/11/28 | 1.0-1.1 | 5400 () | 74 | 50 Cas (A2V) |
| V410 Tau | 2013/12/08 | 1.1–1.3 | 3600 () | 33 | HR 104 (A2Vs) |
| UX Tau | 2013/12/12 | 1.3 | 7200 () | 37 | 50 Cas (A2V) |
Notes.
aThe pixel-to-pixel S/N of the continuum level at Å. For RY Tau, the value (43) is from combined spectra of all
8 frames.
bStandard stars used for telluric correction. The spectral type for
each standard star is shown in parentheses.
| Object | SpT | RV | ||||
|---|---|---|---|---|---|---|
| (km s-1) | (km s-1) | |||||
| (1) | (2) | (3) | (4) | (5) | (6) | |
| V892 Tau | A0 (B9) | (100a) | (16.0b) | … | … | |
| AB Aur | A0 (A0) | (116c) | (24.7c) | … | … | |
| IRAS 04101+3103 | A0 (A1) | (100) | (20) | … | … | |
| HP Tau/G2 | G0 (G0) | 120 | 15.1 | 0.1 | 0.1 | |
| RY Tau | G0 (G1) | 65 | 22.9 | 0.4 | 0.3 | |
| SU Aur | G0 (G1) | 85 | 23.9 | 0.3 | 0.2 | |
| HD 283572 | G5 (G5) | 105 | 17.9 | 0.0 | 0.1 | |
| T Tau | K0 (K0) | 35 | 21.8 | 0.9 | 0.5 | |
| HBC 388 | K0 (K1) | 25 | 15.7 | 0.0 | 0.0 | |
| RW Aur | K3 (K3) | 35 | 13.5 | 1.0 | 0.2 | |
| V773 Tau | K3 (K3) | 60 | 5.6 | 0.4 | 0.3 | |
| V410 Tau | K3 (K3) | 130 | 26.2 | 0.0 | 0.0 | |
| UX Tau | K5 (K5) | 25 | 12.5 | 0.6 | 1.0 |
Notes.
Col. (2) Spectral types of target objects used for synthetic
spectra. Spectral types from the literature are shown in parentheses.
Col. (3) Line broadening measured in velocity units.
For V892 Tau and AB Aur, values from the literature are assumed, shown
in parentheses.
For IRAS 04101+3103, 100 km s-1 is assumed, shown in
parenthesis (see more detail in the main text).
Col. (4) Radial velocities. For V892 Tau and AB Aur, values from
the literature are assumed. For IRAS 04101+3103, the average RV value for
all targets, 20 km s-1, is assumed (see more detail in the main
text).
Col. (5) Y-band veiling.
Col. (6) J-band veiling.
References.
aMooley et al. (2013),
bBertout & Genova (2006),
cAlecian et al. (2013).
| Object | Profile type | Em. | Ab. | Ab. Type | ||||||
|---|---|---|---|---|---|---|---|---|---|---|
| (km s-1) | (km s-1) | (km s-1) | (km s-1) | (Å) | (Å) | |||||
| (1) | (2) | (3) | (4) | (5) | (6) | (7) | (8) | (9) | (10) | (11) |
| V892 Tau | E | 350 (250) | 250 (200) | 20 | … | 2.01 (1.64) | … | 8.93 (5.74) | … | … |
| AB Aur | E | 400 (350) | 400 (300) | 20 | … | 3.39 (2.69) | … | 19.0 (13.1) | … | … |
| IRAS 04101+3103 | E | 500 (350) | 400 (350) | 5 | … | 1.98 (1.57) | … | 12.2 (7.2) | … | … |
| HP Tau/G2 | F | … | … | … | … | … | … | … | … | … |
| RY Tau | DP | 400 | 300 | 100 | … | 1.27 | … | 4.00 | … | … |
| SU Aur | DP | 300 | 250 | 100 | … | 1.22 | … | 2.29 | … | … |
| HD 283572 | F | … | … | … | … | … | … | … | … | … |
| T Tau | E | 250 | 250 | 15 | … | 2.56 | … | 9.15 | … | … |
| HBC 388 | F | … | … | … | … | … | … | … | … | … |
| RW Aur | IPC | 400 | 450 | 50 | 305 | 1.99 | 0.96 | 10.36 | 0.20 | r |
| V773 Tau | F | … | … | … | … | … | … | … | … | … |
| V410 Tau | F | … | … | … | … | … | … | … | … | … |
| UX Tau | DP | 250 | 250 | 35 | … | 1.29 | … | 1.68 | … | … |
Notes.
Col. (2) Profile type based on classification scheme in
Section 3.3 (see main text in the detail).
Cols. (3) and (4): The maximum blueshifted and redshifted line
velocities.
For V892 Tau, AB Aur, and IRAS 04101+3103, estimated values assuming
are shown, while those assuming , are shown in parentheses.
Cols. (5) and (6): The velocity of peak emission and absorption.
Cols. (7) and (8): The line fluxes relative to the continuum at the peak
emission and absorption velocities.
Cols. (9) and (10): Emission and absorption equivalent widths.
Col. (11): The type of subcontinuum absorption: blue,
red, or centered subcontinuum absorption are marked by the letter b, r,
and c, respectively.
| Object | Profile type | Em. | Ab. | Ab. Type | ||||||
|---|---|---|---|---|---|---|---|---|---|---|
| (km s-1) | (km s-1) | (km s-1) | (km s-1) | (Å) | (Å) | |||||
| (1) | (2) | (3) | (4) | (5) | (6) | (7) | (8) | (9) | (10) | (11) |
| V892 Tau | IPC | 250 | 200 | 155 | 80 | 1.19 | 0.88 | 0.18 | 0.09 | r |
| AB Aur | PC | 400 | 400 | 45 | 225 | 1.29 | 0.79 | 2.71 | 0.98 | b |
| IRAS 04101+3103 | DP | 450 | 350 | 230 | 0 | 1.16 | 0.85 | 1.12 | 0.48 | c |
| HP Tau/G2 | A | 150 | 150 | … | 0 | … | 0.75 | … | 1.50 | c |
| RY Tau | DP | 400 | 300 | 155 | 40 | 1.41 | 0.79 | 3.03 | 0.32 | b |
| SU Aur | BR | 200 | 250 | … | 95 | … | 0.47 | … | 2.32 | b, r |
| HD 283572 | A | 100 | 100 | … | 0 | … | 0.83 | … | 0.82 | c |
| T Tau | PC | 400 | 10 | 185 | 2.31 | 0.13 | 7.47 | 3.98 | b | |
| HBC 388 | A | 100 | 50 | … | 0 | … | 0.78 | … | 0.51 | c |
| RW Aur | IPC | 400 | 350 | 140 | 60 | 1.81 | 0.76 | 4.32 | 1.73 | r |
| V773 Tau | PC | 100 | 250 | 30 | 15 | 1.49 | 0.70 | 1.32 | 0.44 | b |
| V410 Tau | A | 160 | 120 | … | 0 | … | 0.69 | … | 1.06 | c |
| UX Tau | DP | 300 | 250 | 85 | 50 | 1.71 | 0.74 | 3.69 | 0.33 | r |
Notes.
Col. (1): Object name. Col. (2): Profile type based on
classification scheme in Section 3.3 (see main text in the
detail).
Cols. (3) and (4): The maximum blueshifted and redshifted line
velocities.
Cols. (5) and (6): the velocity of peak emission and absorption.
Cols. (7) and (8): The line fluxes relative to the continuum at the peak
emission and absorption velocities.
Cols. (9) and (10): Emission and absorption equivalent widths.
Col. (11): The type of subcontinuum absorption: blue, red, or centered
subcontinuum absorption are marked by the letter b, r, and c,
respectively.
| E | DP | PC | IPC | A | F | BR | Reference | |
| Intermediate-mass stars | ||||||||
| Phase I | 57 % (4/7) | 29 % (2/7) | 0 % (0/7) | 14 % (1/7) | 0 % (0/7) | 0 % (0/7) | 0 % (0/7) | This study, FE01 |
| Phase II | 0 % (0/7) | 43 % (3/7) | 0 % (0/7) | 43 % (3/7) | 0 % (0/7) | 14 % (1/7) | 0 % (0/7) | This study, FE01 |
| Phase III | 0 % (0/4) | 0 % (0/4) | 0 % (0/4) | 0 % (0/4) | 0 % (0/4) | 100 % (4/4) | 0 % (0/4) | This study, FE01 |
| Low-mass stars | ||||||||
| CTTSa | 49 % (20/41) | 12 % (5/41) | 0 % (0/41) | 32 % (13/41) | 0 % (0/41) | 7 % (3/41) | 0 % (0/41) | FE01 |
| WTTS | 0 % (0/3) | 0 % (0/3) | 0 % (0/3) | 0 % (0/3) | 0 % (0/3) | 100 % (3/3) | 0 % (0/3) | FE01 |
| CTTS (P)b | 69 % (27/39) | 3 % (1/39) | 0 % (0/39) | 21 % (8/39) | 0 % (0/39) | 8 % (3/39) | 0 % (0/39) | Ed06 |
| WTTS (P)c | 17 % (1/6) | 0 % (0/6) | 0 % (0/6) | 0 % (0/6) | 0 % (0/6) | 83 % (5/6) | 0 % (0/6) | Ed06 |
Notes.
aThe line profiles for 41 CTTSs in a sample of
Folha & Emerson (2001) with sufficient S/Ns were used (see main text in
detail).
bThe P line profiles for all CTTSs except for 12 sources (DR
Tau, RW Aur A, DS Tau, YY Ori, AA Tau, GI Tau, CI Tau, BM And, RW Aur B,
SU Aur, UX Tau, and GM Aur) are categorized into
group E. The line profiles for the 12
sources are as follows:
group DP: SU Aur;
group IPC: DR Tau, RW Aur A, DS Tau, YY Ori, AA Tau, GI Tau, BM And, and
RW Aur B;
Group F: CI Tau, UX Tau, and GM Aur.
cThe P line profiles for all WTTSs except for V826 Tau are
categorized into group F.
Although classification is difficult for V826 Tau due to very subtle
features ( Å), we categorize it into group E.
References.
FE01: Folha & Emerson (2001), Ed06: Edwards et al. (2006).
| Spectral type | Blue abs. type | Reference | ||||||||
| E | DP | PC | IPC | A | F | BR | Broad | Narrow | ||
| Intermediate-mass stars | ||||||||||
| Phase I | 0 % (0/7) | 43 % (3/7) | 43 % (3/7) | 14 % (1/7) | 0 % (0/7) | 0 % (0/7) | 0 % (0/7) | 43 % (3/7) | 0 % (0/7) | This study, Ed06 |
| Phase II | 0 % (0/7) | 29 % (2/7) | 14 % (1/7) | 14 % (1/7) | 0 % (0/7) | 14 % (1/7) | 29 % (2/7) | 0 % (0/7) | 57 % (4/7) | This study, Ed06 |
| Phase III | 0 % (0/4) | 0 % (0/4) | 0 % (0/4) | 0 % (0/4) | 100 % (4/4) | 0 % (0/4) | 0 % (0/4) | 0 % (0/4) | 0 % (0/4) | This study |
| HAe | 7 % (2/28) | 11 % (3/28) | 36 % (10/28) | 32 % (9/28) | 7 % (2/28) | 7 % (2/28) | 0 % (0/28) | 36 (10/28) | 0 (0/28) | CJ14 |
| Low-mass stars | ||||||||||
| CTTSa | 3 % (1/39) | 21 % (8/39) | 36 % (14/39) | 13 % (5/39) | 0 % (0/39) | 3 % (1/39) | 26 % (10/39) | 38 (15/39) | 28 (11/39) | Ed06 |
| WTTSb | 33 % (2/6) | 0 % (0/6) | 0 % (0/6) | 0 % (0/6) | 0 % (0/6) | 67 % (4/6) | 0 % (0/6) | 0 (0/6) | 0 (0/6) | Ed06 |
Notes.
aThe line profiles for CTTSs are categorized as follows:
group E: BP Tau;
group DP: CW Tau, RW Aur A,
HN Tau, DS Tau,
GK Tau, UZ Tau E, V836 Tau, UX Tau;
group PC: DR Tau, AS 353A, DL Tau, HL Tau, DG Tau, DF Tau, DO Tau, GG Tau, GW Ori,
DE Tau, DD Tau, DQ Tau, TW Hya, XZ Tau;
group IPC: AA Tau, BM And, RW Aur B, LkCa8, DN Tau;
group F: GM Aur;
group BR: DK Tau, HK Tau, UY Aur, YY Ori, CI Tau, CY Tau, FP Tau, GI Tau, UZ
Tau W, SU Aur
bThe line profiles for all WTTSs except
for V826 Tau and TWA 14 are categorized into group F, while those for
V826 Tau and TWA 14 are categorized into group E.
Reference:
CJ14: Cauley & Johns-Krull (2014); Ed06: Edwards et al. (2006)