11email: sbhattac@eso.org 22institutetext: Harvard-Smithsonian Center for Astrophysics, 60 Garden Street, Cambridge, MA 02138, USA 33institutetext: Max-Planck-Institut für extraterrestrische Physik, Giessenbachstraße, 85748 Garching, Germany 44institutetext: NRC Herzberg Institute of Astrophysics, 5071 West Saanich Road, Victoria, BC V9E 2E7, Canada 55institutetext: European Southern Observatory, Alonso de Córdova 3107, Santiago de Chile, Chile 66institutetext: UCO/Lick Observatory, Department of Astronomy & Astrophysics, University of California Santa Cruz, 1156 High Street, Santa Cruz, California 95064, USA 77institutetext: Research School of Astronomy and Astrophysics, Mount Stromlo Observatory, Cotter Road, ACT 2611 Weston Creek, Australia
The survey of Planetary Nebulae in Andromeda (M31)
Abstract
Context. The age-velocity dispersion relation is an important tool to understand the evolution of the disc of the Andromeda galaxy (M31) in comparison with the Milky Way.
Aims. We use Planetary Nebulae (PNe) to obtain the age-velocity dispersion relation in different radial bins of the M31 disc.
Methods. We separate the observed PNe sample based on their extinction values into two distinct age populations in the M31 disc. The observed velocities of our high- and low-extinction PNe, which correspond to higher and lower mass progenitors respectively, are fitted in de-projected elliptical bins to obtain their rotational velocities, , and corresponding dispersions, . We assign ages to the two PNe populations by comparing central-star properties of an archival sub-sample of PNe, having models fitted to their observed spectral features, to stellar evolution tracks.
Results. For the high- and low-extinction PNe, we find ages of Gyr and Gyr respectively, with distinct kinematics beyond a deprojected radius R kpc. At RGC=17–20 kpc, which is the equivalent distance in disc scale lengths of the Sun in the Milky Way disc, we obtain km s-1 and km s-1. The age-velocity dispersion relation for the M31 disc is obtained in two radial bins, RGC=14–17 and 17–20 kpc.
Conclusions. The high- and low-extinction PNe are associated with the young thin and old thicker disc of M31 respectively, whose velocity dispersion values increase with age. These values are almost twice and thrice that of the Milky Way disc stellar population of corresponding ages. From comparison with simulations of merging galaxies, we find that the age-velocity dispersion relation in the M31 disc measured using PNe is indicative of a single major merger that occurred 2.5 – 4.5 Gyr ago with an estimated merger mass ratio 1:5.
Key Words.:
Galaxies: individual(M31) – Galaxies: evolution – Galaxies: structure – planetary nebulae: general1 Introduction
Discs in late-type galaxies contain two distinct dynamical populations, the “cold” thin disc and the “hot” thick disc, as found in the Milky Way (MW; e.g. Gilmore & Reid 1983) and nearby edge-on galaxies (Yoachim & Dalcanton 2006; Comerón et al. 2019). The thin disc stars are younger with rotational velocities close to that of the collisional gas (Roberts 1966). The thick disc stars are older and through dynamical heating, via secular evolution of the disc (Sellwood 2014) or mergers with satellite galaxies (Quinn & Goodman 1986), their rotational velocity decreases and velocity dispersion increases. In the solar neighborhood, velocity dispersion appears to increase monotonically with age (Delhaye 1965; Casagrande et al. 2011), but it is not known if that is representative of the entire MW disc. A major part of the MW thick disc is also found to be chemically distinct from its dominant thin disc (see review by Bland-Hawthorn & Gerhard 2016). While mergers of satellite galaxies can dynamically heat galactic discs, the cold MW disc does not seem to have undergone any major merger event in the last 10 Gyr.
The Andromeda (M31) galaxy is the closest giant spiral galaxy to the MW. A number of substructures have been observed in the inner halo of M31 (McConnachie et al. 2018), which may have resulted from a recent merger (Fardal et al. 2013; Hammer et al. 2018). This may also be linked to an observed burst of star formation Gyr ago (Bernard et al. 2015; Williams et al. 2017). It is well known that the velocity dispersion of a disc stellar population increases with age (Strömberg 1925; Wielen 1977). Dorman et al. (2015, hereafter D15) estimated the age-velocity dispersion relation (AVR) for the M31 disc with kinematics of stars from the SPLASH spectroscopic survey (Guhathakurta et al. 2005, 2006). They assigned ages to stars based on their position on the colour-magnitude diagram (CMD, see their Figure 6) from the PHAT survey (Dalcanton et al. 2012). While their main-sequence stars (MS) are well separated in this CMD, the red giant branch (RGB) and asymptotic giant branch (AGB) loci overlap, resulting in a more ambiguous age separation. They construct the line-of-sight (LOS) velocity dispersion () vs radius profiles for the different populations. Their Figure 16 shows a general trend of increasing with age, although with significant overlap of these profiles among populations and radii. On the basis of this trend, they state that the RGB population in M31 has a velocity dispersion that is nearly three times that of the MW.
Planetary Nebulae (PNe) are discrete tracers of stellar populations and their kinematics have been measured in galaxies of different morphological types (e.g. Coccato et al. 2009; Cortesi et al. 2013; Pulsoni et al. 2018; Aniyan et al. 2018). PNe in M31 have negligible contamination from MW PNe or background galaxies (Bhattacharya et al. 2019). A number of PN properties are related to the mass, luminosity and ages of their progenitor stars. For example, from the central star properties derived from modelling nebular emission lines of PNe in the Magellanic clouds and M31, Ciardullo & Jacoby (1999) find a correlation between PNe circumstellar extinction and their central-star masses. Dust production of stars in the AGB phase scales exponentially with their initial progenitor masses for the range after which it remains roughly constant (Ventura et al. 2014). Additionally, PNe with dusty high-mass progenitors evolve faster (Miller Bertolami 2016) and so their circumstellar matter has little time to disperse, while PNe with lower central star masses evolve sufficiently slowly that a larger fraction of dust is dissipated from their envelopes (Ciardullo & Jacoby 1999). Kinematics of young and old stellar populations are well-traced by high and low mass giant stars respectively in the MW through their rotational velocity and velocity dispersion (e.g. Aniyan et al. 2016). In the M31 disc, different kinematics of younger and older stellar populations are expected to correlate with high- and low-extinction PNe respectively.
In this letter, we identify PNe populations based on their extinction for the first time, allowing us to get two distinct age populations for the M31 disc. The data used in this work are described in Section 2. In Section 3, we first discuss classification of PNe based on their extinction values. We then obtain the rotational velocity curve and rotational velocity dispersion for the M31 disc high- and low-extinction PNe. We assign ages to the two PNe populations by comparing modelled central star properties in Kwitter et al. (2012, hereafter Kw+12) to the Miller Bertolami (2016) stellar evolution tracks. We then obtain the AVR for the M31 disc in Section 4 and compare it with previous determinations in M31 and the MW. From the comparison with simulated galaxies, we estimate the mass ratio of a possible merger event in the M31 disc. We summarise our results and conclude in Section 5.
2 Data description
Bhattacharya et al. (2019) identified PNe candidates in a 16 sq. deg. imaging survey of M31 with MegaCam at the CFHT, covering the disc and inner halo. Spectroscopic observations of a complete subsample of these PNe candidates were carried out with the Hectospec multifiber positioner and spectrograph on the Multiple Mirror Telescope (MMT; Fabricant et al. 2005). The Hectospec 270 gpm grating was used and provided spectral coverage from 3650 to 9200 at a resolution of . Each Hectospec fiber subtends 1.5 on the sky and were positioned on the PNe candidates in each field. On September 15, 2018, and October 10, 2018, with an exposure time of 9000 seconds each, two fields in the south-west region of the M31 disc were observed, while on December 4, 2018, with an exposure time of 3600 seconds, one field covering the northern part of the M31 disc and the Northern Spur substructure was observed. Of the 343 observed PNe candidates, 129 had confirmed detection of the [O iii] 4959/5007 emission-lines. Of these observed PNe, 92 showed the H line and their extinctions (AV) could be determined from the Balmer decrement. Details of the spectroscopic observations of the PNe, along with the extinction determination and chemical abundances will be presented in a forthcoming paper (Bhattacharya et al. 2019b in preparation, hereafter Bh+19b).
Sanders et al. (2012, hereafter San+12) also studied PNe and H ii regions in the M31 disc and outer bulge using Hectospec on the MMT. They observed 407 PNe, 321 with the H line detected and subsequent reliable extinction measurements. The combined sample of PNe with extinction measurements in M31 from San+12 and Bh+19b thus consists of 413 PNe.
3 Analysis
3.1 Classification of Planetary Nebulae based on extinction measurements
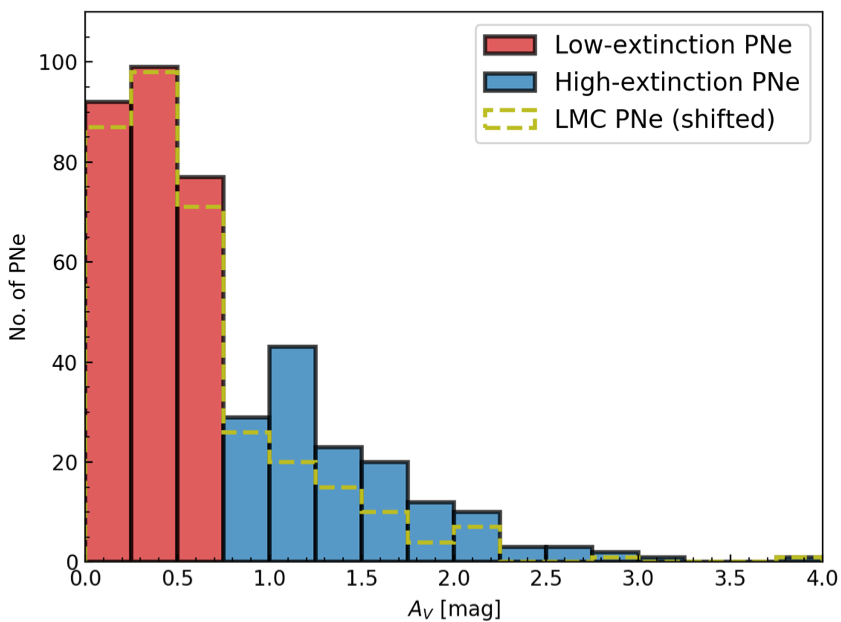
The distribution of the M31 PNe extinction values (see Figure 1) exhibits a sharp drop at A mag, increases again at A1–1.25 mag, and drops off gradually at larger values of AV. Figure 1 also shows the distribution of the LMC PNe extinction values (Reid & Parker 2010), shifted such that their peak (originally in the A 0.75–1 mag bin) is coincident with the distribution of the M31 PNe extinction values (A 0.25–0.5 mag bin). The shifted distribution of the LMC PNe extinction values also shows a sharp drop at A mag and gradually falls off while that of the M31 disc PNe shows a secondary peak at A1–1.25 mag. The distribution of M31 PNe extinction values around the first higher peak possibly results from an older parent stellar population (numerically more prevalent) spawning PNe having lower circumstellar extinction values (further discussions in Section 3.3), while the secondary peak at higher circumstellar extinction values would indicate the Presence of a younger parent stellar population.
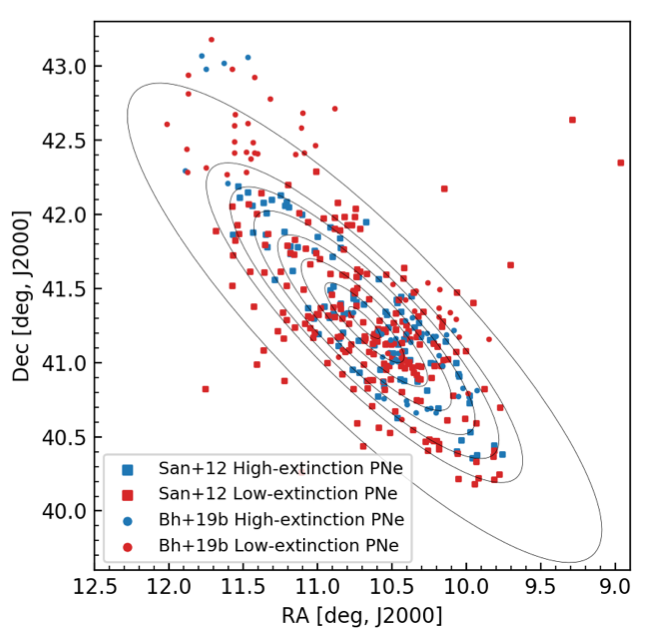
We thus classify M31 PNe with extinction values higher and lower than A mag as high- and low-extinction PNe respectively. Our PNe sample is then divided into 145 high- and 268 low-extinction PNe, which are expected to be associated with younger and older parent stellar populations respectively. We note that using a different extinction value within A mag range for the classification of the two PN populations has negligible effect on the rotation curves obtained in Section 3.2. The high-extinction PNe classification is not biased by the LOS dust attenuation in M31 as per our investigation in Appendix A. Figure 2 shows the spatial distribution of the PNe in the M31 disc.
3.2 Rotation curves
For both San+12 and Bh+19b PNe, the LOS velocities (LOSV) are obtained from full spectral fitting, resulting in an uncertainty of 3 km s-1. The PNe are de-projected on to the galaxy plane based on the position angle (PA = 38∘) and inclination (i = ) of M31 in the planer disc approximation. They are then binned into seven elliptical bins (Figure 2) with the first six bins covering 3 kpc each starting at a deprojected major axis radius R kpc from the center of M31 and the final bin covering R 20–30 kpc. PNe observed outside R 30 kpc probably belong to the inner halo substructures, possibly the Northern Spur, and are hence not included in the analysis. The position of the PNe in each bin can be described using cylindrical coordinates, with the z = 0 kpc plane as the local plane of the galaxy, r = 0 kpc as the galactic center, and measured counterclockwise from the position angle of M31. The LOSV for the PNe, , in each bin is then fitted by the following equation:
| (1) |
where is the systemic velocity of M31, assumed to be km s-1 (Merrett et al. 2006); is the rotational velocity in the plane of the galaxy; is the radial streaming motion that can be inwards or outwards; is the inclination of M31 mentioned previously and km s-1 is the uncertainty in measurement. LOSVs for the high- and low-extinction PNe are fitted separately in each elliptical bin using LMFIT (Newville et al. 2014) to obtain , and as the parameters describing the mean motion of the PNe populations in each bin. We note that , the off-plane motion in the z direction, is considered to be zero as no net off-plane motion is expected for PNe in the disc.
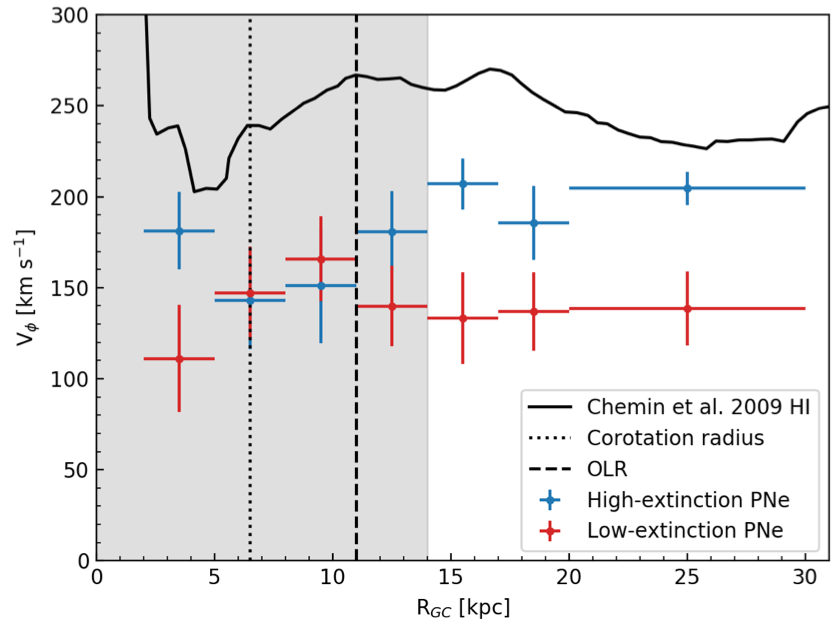
The obtained rotation curves for the high- and low-extinction PNe are shown in blue and red respectively in Figure 3. The uncertainty in the fitted is quite high and their values are close to zero in each bin. Thus, no clear evidence of radial streaming motion is found in either PNe population. Setting km s-1 also has negligible effect on the rotation curves. The difference in rotational velocities between the gas and the stellar population in a disc is a measure of the asymmetric drift and it is higher for older stellar populations which have more non-circular orbits as a result of dynamical heating (Strömberg 1946). Outside R kpc, the high-extinction PNe have a rotational velocity closer to that of the H i gas derived by Chemin et al. (2009), indicative of a dynamically young population, while that of the low-extinction PNe is much further away from that of the H i gas, indicative of a dynamically older population (Strömberg 1946).
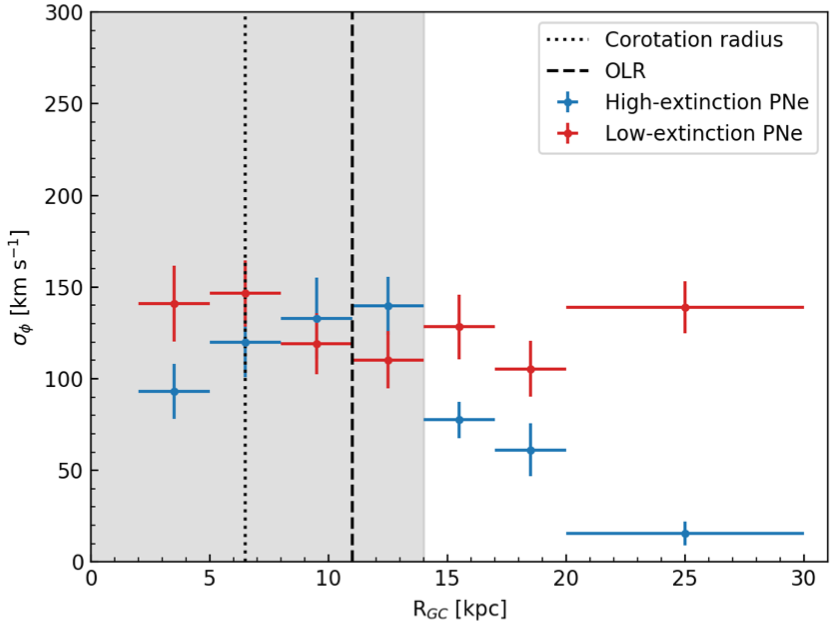
We estimate the rotational velocity dispersion, , as the standard deviation with respect to the fitted in each bin. The profiles for the high- and low-extinction PNe are shown in Figure 4. Outside R kpc, is lower for the high-extinction PNe, as expected for a dynamically young population, than that measured for low-extinction PNe, a dynamically older population. for the low-extinction PNe population increases sharply in the outermost bin. This may be due to the presence of PNe associated with the M31 inner halo substructures like the Northern Spur or the NGC 205 loop at this distance from the M31 center. Within 14 kpc, both the high- and low-extinction PNe samples show an overall reversal in the rotation curves and the but both populations are dynamically hot. While this maybe linked to the interaction of the disc with the bar in M31 as modelled by Blaña et al. (2018) for the inner two bins, other sources of dynamical heating may be at play for R kpc, either stemming just from the secular evolution of the disc and/or through a merger event. This will be investigated in a forthcoming paper (Bhattacharya et al. 2019b in preparation). Given the large values of km s-1 for the low-extinction PNe, their parent stellar population may be distributed as a flattened spheroid, rather than a planer disc. Given the inclination of the M31 disc, deprojecting these PNe as a planer disc may result in an overestimate of their RGC values, leading to a bias in the estimated . We investigate the effect of disc thickness in Appendix B. We find that the scale height of the low-extinction PNe is H kpc. Within our 3 kpc bin sizes, only of the low-extinction PNe may be included in a different bin. The effect on the estimated values of these PNe in different bins is within the measurement uncertainties.
3.3 Ages of the M31 disc Planetary Nebulae
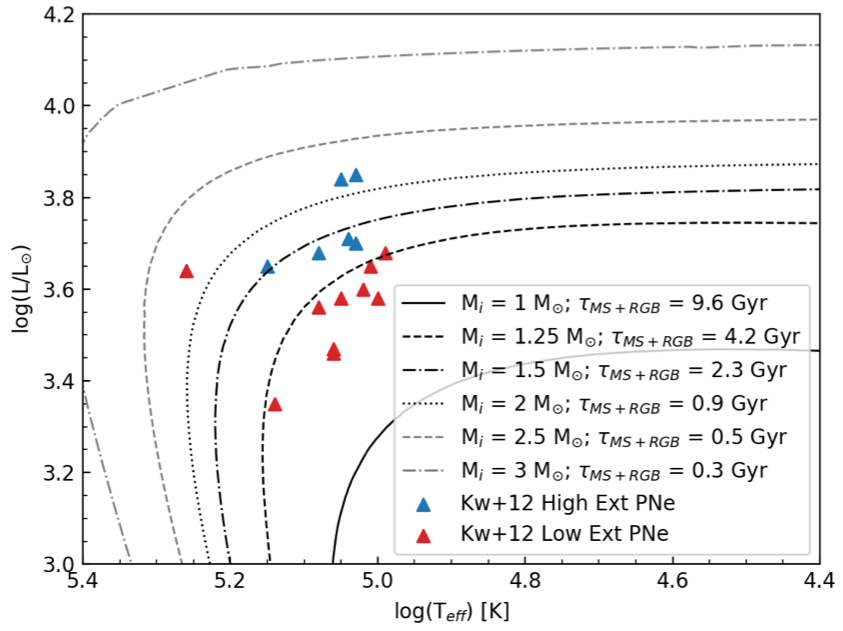
Kw+12 observed sixteen PNe in the outer disc of M31 to measure various emission lines and determine chemical abundances. They used the CLOUDY photoionization codes (Ferland et al. 1998) to estimate the bolometric luminosity () and effective temperature () of the central stars of these PNe. Figure 5 shows their estimated vs. , coloured by their extinction classification (high-extinction: blue; low-extinction: red). The post-AGB stellar evolution tracks from Miller Bertolami (2016) for a metallicity are also plotted in Figure 5. It is clear that the high-extinction PNe in this sub-sample lie either around the tracks corresponding to an initial progenitor mass of 1.5 and age (; lifetime in main-sequence and AGB phases) of 2.3 Gyr or are even younger with higher initial progenitor masses. The low-extinction PNe in this sub-sample, barring one, are older than 4.2 Gyr with initial progenitor mass lower than 1.25 . We note that these ages maybe uncertain up to Gyr based on the estimations by Kw+12. We may thus assign the mean ages corresponding to the Kw+12 high- ( Gyr) and low- ( Gyr) extinction PNe to those with the corresponding extinction values in the San+12 and Bh+19b PNe population.

4 Age-velocity dispersion relation
4.1 The observed age-velocity dispersion relation in M31
We obtain the AVR in M31 for two elliptical bins with R 14–17 and 17–20 kpc. They are presented in Figure 6, clearly showing the increase in the velocity dispersion with age. In Figure 6, we also present the age-velocity dispersion value for the MS ( Myr age), km s-1, obtained by D15 in the R 14–17 kpc bin.
Based on models fitting the star formation rate, gas profiles and metallicity distributions of the M31 and MW discs, Yin et al. (2009) find that RGC=19 kpc in the M31 disc is the equivalent distance, in disc scale lengths, of the Sun (R⊙=8 kpc) in the MW disc. We thus compare the velocity dispersion of the MW disc obtained in the solar neighbourhood by Nordström et al. (2004) to our in the RGC=17–20 kpc bin, where km s-1 and km s-1. Nordström et al. (2004) describe the MW velocity dispersion in space-velocity components (U, V, W), defined in a right-handed Galactic system with U pointing towards the Galactic centre, V in the direction of rotation, and W towards the north Galactic pole (Figure 6). The equivalent in the MW disc for the in the M31 disc would be some combination of and with a value intermediate between the two (D15). We compare our obtained of the M31 disc with the , which is km s-1 and km s-1 for 2.5 Gyr and 4.5 Gyr old populations respectively. In the RGC=17–20 kpc bin, the of the 2.5 Gyr and 4.5 Gyr old population in M31 are about twice and thrice that of the of the 2.5 Gyr and 4.5 Gyr old MW thin disc population respectively.
4.2 Comparison with previously measured and simulated age-velocity dispersion relations
The AVR in M31 was previously estimated by D15 from the of stars whose classification in different age bins suffered from ambiguity. Their observations were also limited to the PHAT survey footprint, covering about a quarter of the M31 disc along its major axis out to R kpc. Our observed PNe sample covers the entire M31 disc out R kpc, and the high- and low-extinction PNe are well separated in age (Figure 5). The values for the high- and low-extinction PNe agree within errors with that obtained by D15 for older AGB ( Gyr old) and RGB ( Gyr old) stars respectively. Quirk et al. (2019) fitted the rotation curves for stellar populations identified by D15. In the R kpc bin, for the high-extinction PNe is in good agreement with that obtained by Quirk et al. (2019) for older AGB stars, but for the low-extinction PNe it is lower than that of RGB stars by km s-1. This is possibly due to their RGB population being contaminated by younger AGB stars, resulting in a value that is closer to that of the HI gas.
The AVR for the M31 disc shows a steep slope between 0–2.5 Gyr age range and an even steeper slope between 2.5–4.5 Gyr age range than those for the MW disc in similar age bins. The AVR of the MW disc is considered to be driven by secular evolution channels (see review by Sellwood 2014). An AVR with velocity dispersion increasing gradually with age is also measured in simulated disc galaxies with similarly quiescent merger histories (from zoom-in cosmological simulations by House et al. 2011; Martig et al. 2014). However, simulated disc galaxies undergoing a single merger show significant increase in the velocity dispersion for stellar populations older than the end of the merger (Martig et al. 2014, see their Figure 2), with larger velocity dispersion for higher merger mass ratios. After the end of the merger, it takes Gyr for stellar populations to form with velocity dispersion values similar to those for quiescent discs. The high values in the M31 disc is reminiscent of those seen in populations older than the merger event in simulated galaxies. The lower values in the M31 disc is reminiscent of the lower values predicted by simulations some time after the end of the merger. Finally, the velocity dispersion for the MS in M31 is then akin to that for quiescent discs, also observed at least Gyr after the merger event in the simulated galaxies. Hence, we may deduce from the observed AVR in the M31 disc, that a single merger event took place 2.5 – 4.5 Gyr ago.
4.3 Estimation of the merger mass ratio
In the framework of a single merger in the M31 disc, we estimate the merger mass ratio and satellite mass required to produce the dynamically hot 4.5 Gyr old population with disc scale height H kpc (Appendix B). We utilize the relation between disc scale height (H) and satellite-to-disc-mass-ratio () described by Hopkins et al. (2008) for a satellite galaxy (assumed to be a rigid body) that merged with a disc galaxy (assumed to be a thin disc) on an in-plane prograde radial orbit. The relation in the case of a satellite merging with a Mestel (1963) disc galaxy, having constant circular velocity , is as follows:
| (2) |
where gives the increase in scale height in the disc galaxy following the merger; is a derived constant with , being the halo circular velocity; is the gas fraction in both the disc galaxy and satellite (assumed to be equal) before the merger; is the galactocentric radius of the population with scale height H ; and is the disc effective radius.
We assume that the M31 disc evolved by secular evolution prior to the merger event. Hence we adopt the scale height of the old thin disc of the MW as measured in the solar neighbourhood, H pc (see Bland-Hawthorn & Gerhard 2016, and references therein), as the pre-merger scale height for the M31 disc. Thus, kpc and kpc. is the median of the RGC=17–20 kpc bin, which is the equivalent disc scale lengths in M31 to the solar neighbourhood. From Blaña et al. (2018), we adopt km s-1, and km s-1. The present day gas fraction in M31 is (Yin et al. 2009) but M31 is observed to have undergone a burst of star formation Gyr ago which produced of its mass (Williams et al. 2017). Assuming that the stellar mass formed in this burst was present as gas mass before the merger, we adopt . Plugging these values into Equation 2, we obtain or . Given that the total mass of the M31 disc is (Yin et al. 2009), a satellite is required to dynamically heat the M31 disc.
5 Summary and conclusion
We classify the observed sample of PNe based on their measured extinction values into high- and low-extinction PNe which are respectively associated with 2.5 Gyr and 4.5 Gyr parent populations. By fitting rotation curves to the two PNe populations in de-projected elliptical bins, we find that the high- and low-extinction PNe are dynamically colder and hotter respectively, especially at R kpc (Figures 3, 4). We thus obtain the AVR at these radii to find that increases with age in the M31 disc, which is dynamically much hotter than the stars in the MW disc of corresponding ages.
There is an interesting timescale coincidence between the age of the high-extinction PNe and the Gyr old burst of star formation observed both in the stellar disc and inner halo of M31 (Bernard et al. 2015; Williams et al. 2017). We speculate that most of the high-extinction PNe, causing the secondary peak in the extinction distribution (Figure 1), are those whose progenitors formed during the Gyr old star formation burst, while the low-extinction PNe were likely formed earlier. The high-extinction PNe are kinematically tracing the younger thin disc of M31 outside R kpc from the center. They are clearly separated, both in and , from the dynamically hotter low-extinction PNe which may be associated with the thicker disc. Some low-extinction PNe may also be associated with the old thin disc and inner halo of M31.
Using hydrodynamical simulations, Hammer et al. (2018) argue that a single major merger 2 – 3 Gyr ago, where the satellite eventually coalesced to build up the M31 bulge after multiple passages, can explain the dynamical heating of the M31 disc. They also predict a merger with mass ratio of at least 1:4.5 from their simulations, and also a decreasing trend in the velocity dispersion with radius, as observed, albeit within errors, in Figure 4. Such a merger could also explain the burst of star formation Gyr ago and the presence of the M31 inner halo substructures. Fardal et al. (2013) also use hydrodynamical simulations to predict the formation of the giant stream from a merger Gyr ago with a satellite. The AVR measured in the M31 disc using PNe is indicative of a single merger occurring 2.5 – 4.5 Gyr ago with a merger mass ratio 1:5, with a satellite galaxy. Such a galaxy would have been the third largest member of the local group, more massive than M33 (Kam et al. 2017). This is consistent with the prediction from Hammer et al. (2018). In conclusion, the kinematics of the M31 disc PNe have been able to shed light on the recent dynamical evolution of M31. Our next step is to utilize PNe to further investigate the interface of the disc and inner halo of M31.
Acknowledgements.
SB acknowledges support from the IMPRS on Astrophysics at the LMU Munich. We are grateful to the anonymous referee for the constructive comments that improved the manuscript. Based on observations obtained at the MMT Observatory, a joint facility of the Smithsonian Institution and the University of Arizona. Based on observations obtained with MegaPrime/MegaCam, a joint project of CFHT and CEA/DAPNIA, at the Canada-France-Hawaii Telescope (CFHT). This research made use of Astropy– a community-developed core Python package for Astronomy (Astropy Collaboration et al. 2013), Numpy (Oliphant 2015) and Matplotlib (Hunter 2007). This research also made use of NASA’s Astrophysics Data System (ADS111https://ui.adsabs.harvard.edu).References
- Aniyan et al. (2018) Aniyan, S., Freeman, K. C., Arnaboldi, M., et al. 2018, MNRAS, 476, 1909
- Aniyan et al. (2016) Aniyan, S., Freeman, K. C., Gerhard, O. E., Arnaboldi, M., & Flynn, C. 2016, MNRAS, 456, 1484
- Astropy Collaboration et al. (2013) Astropy Collaboration, Robitaille, T. P., Tollerud, E. J., et al. 2013, A&A, 558, A33
- Bernard et al. (2015) Bernard, E. J., Ferguson, A. M. N., Chapman, S. C., et al. 2015, MNRAS, 453, L113
- Bhattacharya et al. (2019) Bhattacharya, S., Arnaboldi, M., Hartke, J., et al. 2019, A&A, 624, A132
- Blaña et al. (2018) Blaña, M., Gerhard, O., Wegg, C., et al. 2018, MNRAS, 481, 3210
- Bland-Hawthorn & Gerhard (2016) Bland-Hawthorn, J. & Gerhard, O. 2016, Annual Review of Astronomy and Astrophysics, 54, 529
- Casagrande et al. (2011) Casagrande, L., Schönrich, R., Asplund, M., et al. 2011, A&A, 530, A138
- Chemin et al. (2009) Chemin, L., Carignan, C., & Foster, T. 2009, ApJ, 705, 1395
- Ciardullo & Jacoby (1999) Ciardullo, R. & Jacoby, G. H. 1999, ApJ, 515, 191
- Coccato et al. (2009) Coccato, L., Gerhard, O., Arnaboldi, M., et al. 2009, MNRAS, 394, 1249
- Comerón et al. (2019) Comerón, S., Salo, H., Knapen, J. H., & Peletier, R. F. 2019, A&A, 623, A89
- Cortesi et al. (2013) Cortesi, A., Arnaboldi, M., Coccato, L., et al. 2013, A&A, 549, A115
- Dalcanton et al. (2015) Dalcanton, J. J., Fouesneau, M., Hogg, D. W., et al. 2015, ApJ, 814, 3
- Dalcanton et al. (2012) Dalcanton, J. J., Williams, B. F., Lang, D., et al. 2012, The Astrophysical Journal Supplement Series, 200, 18
- Delhaye (1965) Delhaye, J. 1965, Solar Motion and Velocity Distribution of Common Stars (University of Chicago Press, Chicago, ILL USA), 61
- Dorman et al. (2015) Dorman, C. E., Guhathakurta, P., Seth, A. C., et al. 2015, ApJ, 803, 24
- Draine et al. (2014) Draine, B. T., Aniano, G., Krause, O., et al. 2014, ApJ, 780, 172
- Fabricant et al. (2005) Fabricant, D., Fata, R., Roll, J., et al. 2005, Publications of the Astronomical Society of the Pacific, 117, 1411
- Fardal et al. (2013) Fardal, M. A., Weinberg, M. D., Babul, A., et al. 2013, MNRAS, 434, 2779
- Ferland et al. (1998) Ferland, G. J., Korista, K. T., Verner, D. A., et al. 1998, Publications of the Astronomical Society of the Pacific, 110, 761
- Gilmore & Reid (1983) Gilmore, G. & Reid, N. 1983, MNRAS, 202, 1025
- Guhathakurta et al. (2005) Guhathakurta, P., Ostheimer, J. C., Gilbert, K. M., et al. 2005, arXiv e-prints [astro-ph/0502366]
- Guhathakurta et al. (2006) Guhathakurta, P., Rich, R. M., Reitzel, D. B., et al. 2006, AJ, 131, 2497
- Hammer et al. (2018) Hammer, F., Yang, Y. B., Wang, J. L., et al. 2018, MNRAS, 475, 2754
- Hopkins et al. (2008) Hopkins, P. F., Hernquist, L., Cox, T. J., Younger, J. D., & Besla, G. 2008, ApJ, 688, 757
- House et al. (2011) House, E. L., Brook, C. B., Gibson, B. K., et al. 2011, MNRAS, 415, 2652
- Hunter (2007) Hunter, J. D. 2007, Computing In Science & Engineering, 9, 90
- Kam et al. (2017) Kam, S. Z., Carignan, C., Chemin, L., et al. 2017, AJ, 154, 41
- Kwitter et al. (2012) Kwitter, K. B., Lehman, E. M. M., Balick, B., & Henry, R. B. C. 2012, ApJ, 753, 12
- Martig et al. (2014) Martig, M., Minchev, I., & Flynn, C. 2014, MNRAS, 443, 2452
- McConnachie et al. (2018) McConnachie, A. W., Ibata, R., Martin, N., et al. 2018, ApJ, 868, 55
- Merrett et al. (2006) Merrett, H. R., Merrifield, M. R., Douglas, N. G., et al. 2006, MNRAS, 369, 120
- Mestel (1963) Mestel, L. 1963, MNRAS, 126, 553
- Miller Bertolami (2016) Miller Bertolami, M. M. 2016, A&A, 588, A25
- Newville et al. (2014) Newville, M., Stensitzki, T., Allen, D. B., & Ingargiola, A. 2014, LMFIT: Non-Linear Least-Square Minimization and Curve-Fitting for Python
- Nordström et al. (2004) Nordström, B., Mayor, M., Andersen, J., et al. 2004, A&A, 418, 989
- Oliphant (2015) Oliphant, T. E. 2015, Guide to NumPy, 2nd edn. (USA: CreateSpace Independent Publishing Platform)
- Pulsoni et al. (2018) Pulsoni, C., Gerhard, O., Arnaboldi, M., et al. 2018, A&A, 618, A94
- Quinn & Goodman (1986) Quinn, P. J. & Goodman, J. 1986, ApJ, 309, 472
- Quirk et al. (2019) Quirk, A., Guhathakurta, P., Chemin, L., et al. 2019, ApJ, 871, 11
- Reid & Parker (2010) Reid, W. A. & Parker, Q. A. 2010, MNRAS, 405, 1349
- Roberts (1966) Roberts, M. S. 1966, ApJ, 144, 639
- Sanders et al. (2012) Sanders, N. E., Caldwell, N., McDowell, J., & Harding, P. 2012, ApJ, 758, 133
- Sellwood (2014) Sellwood, J. A. 2014, Reviews of Modern Physics, 86, 1
- Strömberg (1925) Strömberg, G. 1925, ApJ, 61, 363
- Strömberg (1946) Strömberg, G. 1946, ApJ, 104, 12
- Ventura et al. (2014) Ventura, P., Dell’Agli, F., Schneider, R., et al. 2014, MNRAS, 439, 977
- Wielen (1977) Wielen, R. 1977, A&A, 60, 263
- Williams et al. (2017) Williams, B. F., Dolphin, A. E., Dalcanton, J. J., et al. 2017, ApJ, 846, 145
- Yin et al. (2009) Yin, J., Hou, J. L., Prantzos, N., et al. 2009, A&A, 505, 497
- Yoachim & Dalcanton (2006) Yoachim, P. & Dalcanton, J. J. 2006, AJ, 131, 226
Appendix A Effect of line-of-sight dust attenuation in extinction-based selection of Planetary Nebulae
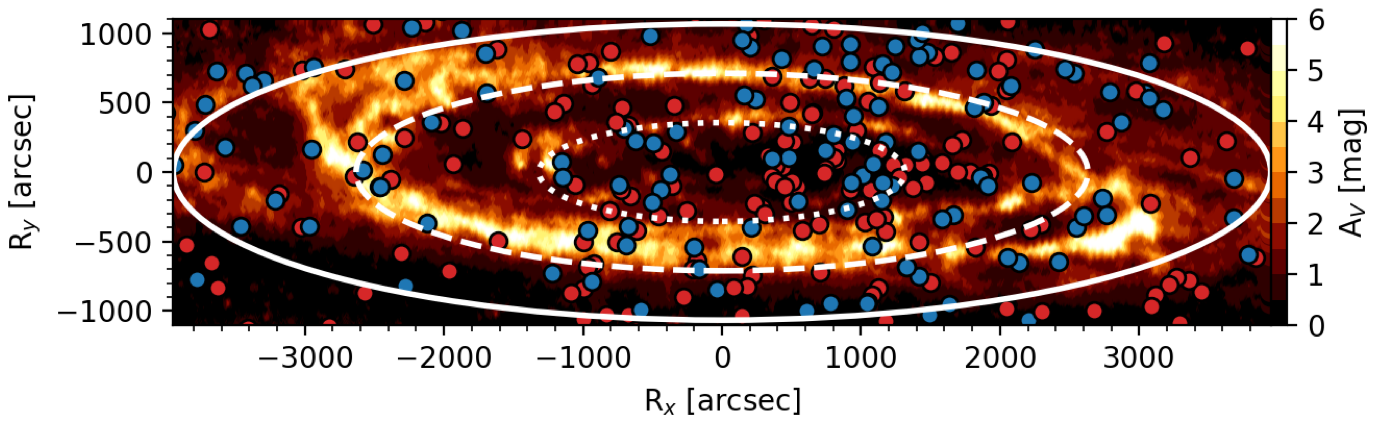
The PNe are separated into high and low extinction samples considering that the measured extinction values for high extinction PNe are dominated by their circumstellar extinction, with LOS dust attenuation equally affecting both samples. Any spatial correlation between higher LOS dust attenuation in the galaxy and the position of high-extinction PNe would result in PNe with low circumstellar extinction being misclassified. The dust in the M31 disc and IGM was mapped by Draine et al. (2014) using near-infrared data from the Spitzer Space Telescope. This was utilized by Blaña et al. (2018) to obtain the LOS extinction map of the inner disc of M31 shown in Figure 7, also showing the de-projected positions of the high- (blue) and low- (red) extinction PNe. It is clear that there is no preferential selection of the high-extinction PNe at the regions of high LOS extinction in the disc. Both the high- and low-extinction PNe are not spatially correlated with the distribution of LOS extinction.
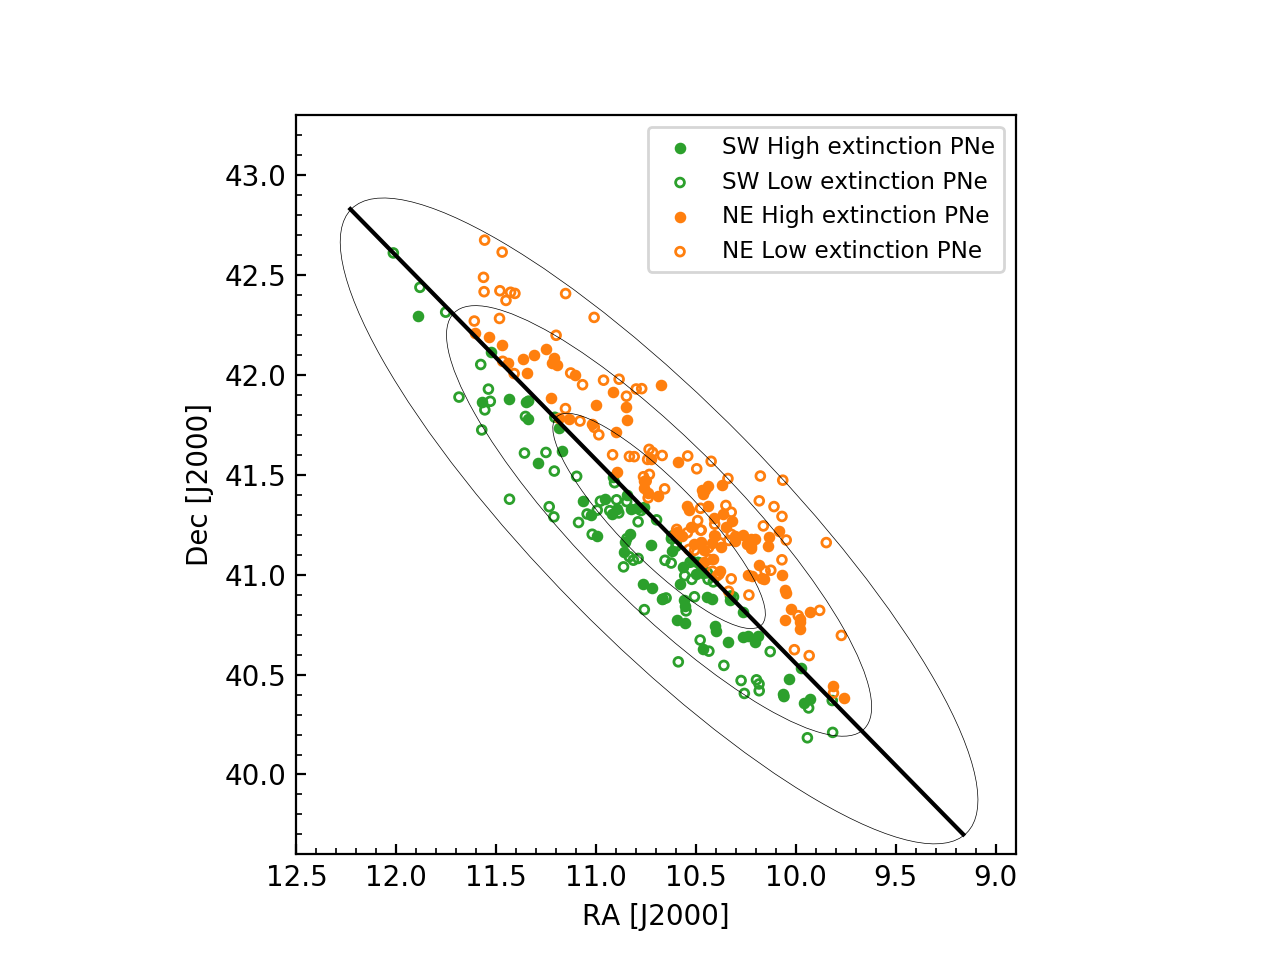
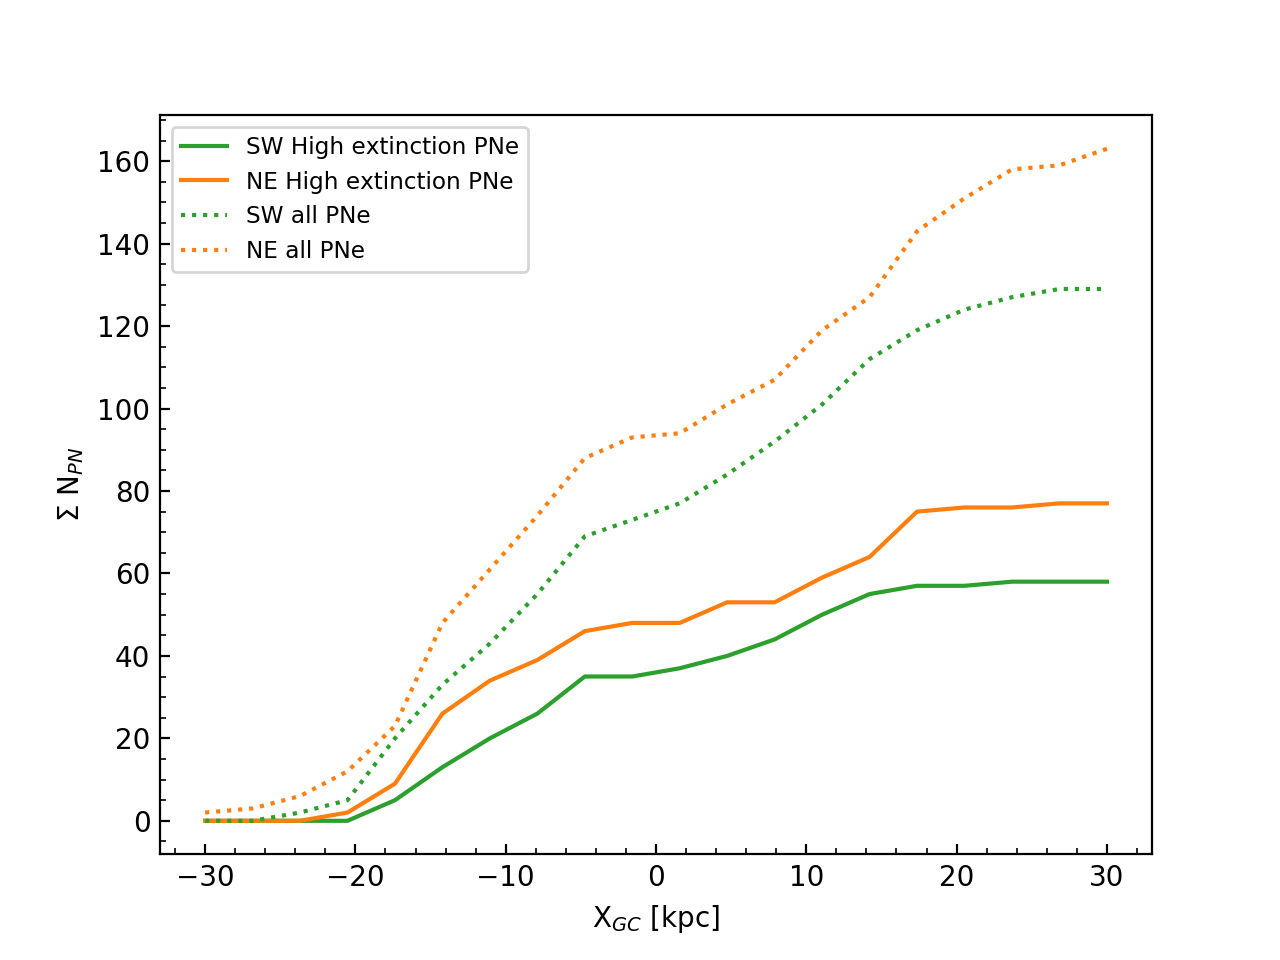
To further investigate this issue, we check whether the high-extinction PNe are preferentially found in the dustier regions of the M31 disc by taking in to account the geometry of its dust attenuation. The North East (NE) half of the M31 disc has higher LOS dust attenuation than the South West (SW) half (Draine et al. 2014). We thus divide the PNe sample into two halves corresponding to these two regions of the M31 disc, as shown in Figure 8. The cumulative number of PNe is obtained along their deprojected major-axis distances (XPC), with the negative values assigned to the southern side of M31, for the high-extinction PNe (solid) and all PNe (dashed), for both the NE (orange) and SW (green) halves for the M31 disc (Figure 9). The cumulative distribution of both high-extinction PNe and the entire PNe sample clearly follow a similar distribution in both halves of the M31 disc with a slightly higher number of PNe observed in the NE half. A KS test shows that the high-extinction PNe in both halves follow the same distribution with a pvalue=0.99. We classify 2% more PNe as high extinction in the SW half of M31 which is anti-correlated with the expected effects from the LOS dust attenuation. We thus conclude that the LOS dust attenuation effects do not drive the extinction-based classification of our PN populations.
Appendix B Validity of the planar disc assumption for the low-extinction Planetary Nebulae
At the inclination of M31, deprojecting the low-extinction PNe at high z on a planer disc may result in assigned RGC values which are different from the true ones. We first estimate the scale height of the low-extinction PNe (H). In order to establish an extinction map of M31 RGB stars found by the PHAT survey, Dalcanton et al. (2015) modelled the geometry of the M31 thicker disc to describe the distribution of RGB ( Gyr old; D15, ) and red clump stars in low-extinction regions. They found that this thicker disc has a ratio of vertical to horizontal exponential scale heights of . From IRAC 3.6 m band images of M31, Blaña et al. (2018) find that the M31 disc scale length kpc. Thus, for the M31 thicker disc. Since the RGB stars have mean age and kinematics close to that of the low-extinction PNe (see Sections 3.3 & 4.2 for details), H kpc.
Given the inclination of M31, PNe at z kpc may be deprojected with an estimated RGC that is 0.2 kpc different from its true RGC value. For an exponentially decreasing stellar density () profile of the low-extinction PNe with z, , 1/4 of the low-extinction PNe in any bin may lie at z kpc. Given the 3 kpc bin sizes used to determine , only of the low-extinction PNe may be included in a different bin. The measured values have error, as in Figure 4. Thus the planar disc assumption for PNe does not bias the and profiles within the estimated errors.