Hypermap Mapping Framework
and its Application to Autonomous Semantic
Exploration
Abstract
Modern intelligent and autonomous robotic applications often require robots to have more information about their environment than that provided by traditional occupancy grid maps. For example, a robot tasked to perform autonomous semantic exploration has to label objects in the environment it is traversing while autonomously navigating. To solve this task the robot needs to at least maintain an occupancy map of the environment for navigation, an exploration map keeping track of which areas have already been visited, and a semantic map where locations and labels of objects in the environment are recorded. As the number of maps required grows, an application has to know and handle different map representations, which can be a burden.
We present the Hypermap framework, which can manage multiple maps of different types. In this work, we explore the capabilities of the framework to handle occupancy grid layers and semantic polygonal layers, but the framework can be extended with new layer types in the future. Additionally, we present an algorithm to automatically generate semantic layers from RGB-D images. We demonstrate the utility of the framework using the example of autonomous exploration for semantic mapping.
I Introduction
In mobile robotics, the most common way to represent spatial information about the environment is through maps, which differ in precision and complexity depending on the application. If only navigation capabilities are required, 2D occupancy grid maps are the most common for indoor robots as they are usually sufficient for planar navigation. These maps represent the environment as a fixed size grid where each cell describes the occupancy probability of the area it represents [1]. However, as soon as tasks require a deeper understanding of the environment, occupancy alone is usually not enough and other properties of the environment need to be recorded in other specific maps. For example, autonomous robots with task level capabilities often require qualitative and richer information about the environment maintained in semantic maps, which assign labels to objects or places in the environment [2]. More advanced applications may require reasoning on an even more diverse number and types of maps [3, 4].
An example of these more advanced applications is autonomous semantic exploration, where a robot’s task is to label objects in the environment it is in while autonomously navigating in it. To solve this task the robot needs at least to maintain an occupancy map of the environment for navigation, an exploration map keeping track of which areas have already been visited and a semantic map where locations and labels of objects in the environment are recorded. As the number of maps required by an application grows, the interaction with each map requires to be handled independently as each map represents the environment using different constructs, which need to be known and handled by the application.
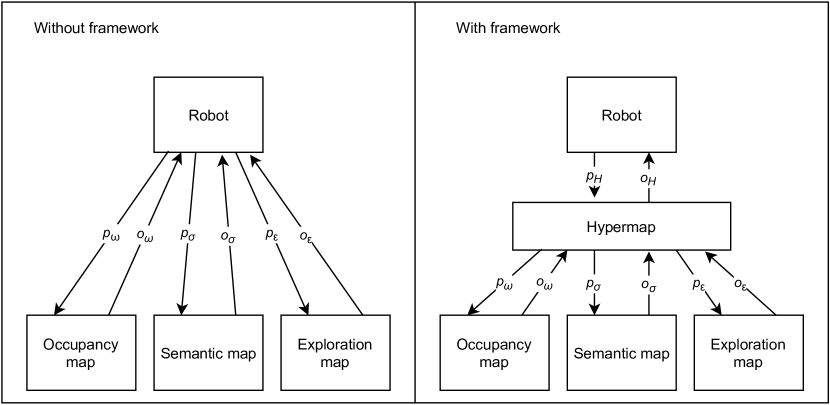
In this work, we propose a framework that integrates and manages multiple maps of different types. The framework works as an interface that unifies and simplifies the access to different types of maps for applications. Figure 1 shows the underlying concept. With the framework, it is not necessary to deal with various representations of different maps. Instead, unified access to all maps is provided, while the framework handles conversions internally. This unified access also improves flexibility of the used maps. For example, a grid based occupancy map could easily be replaced with a polygonal map, which could be accessed in the same way through the framework. An application using the hypermap framework would not need to adapt to this change.
Furthermore, we introduce a mapping algorithm that generates polygonal semantic maps from RGB-D images for the framework. We also demonstrate that the framework enables autonomous semantic mapping of arbitrary polygonal areas in an existing occupancy map.
The main contributions of this work are: (i) The introduction of a formalism for maps that defines them in terms of their functionalities and properties. (ii) A framework able to manage multiple maps of different types, presented both theoretically and with a software implementation. (iii) An algorithm to generate polygonal semantic maps from RBG-D images. (iv) A demonstration of the framework’s utility by showing its use for autonomous semantic exploration of a specified area.
II Related Works
Occupancy grid maps are the most common type of maps in robotics [5]. These maps, usually generated automatically through Simultaneous Localization and Mapping (SLAM) algorithms [1], decompose the space into a fixed-size grid where each cell contains a probability of occupancy of the area corresponding to that cell. This representation, although convenient, has some limitations, one of which is that each cell is treated separately and the extent of an object in the environment cannot intuitively be deduced.
Continuous-valued maps, on the other hand, allow for a more exact representation of the entities in the environment by representing obstacles as geometric primitives, e.g., polygons or lines [6, 7]. The map complexity is higher than for grid maps, and depends on the number and shape of obstacles. Often, simplifications are performed to reduce it, e.g., by replacing complex polygons with simpler ones or only displaying features relevant to the sensors and navigation. Several navigation algorithms [8] rely on a polygonal obstacle representation to find optimal or near-optimal paths. Recent research [9] also showed interest in polygonal maps due to advantages compared to grid maps, such as the ability to create visibility graphs for an environment.
While occupancy information is easily described by grid maps, semantic information has on the other end a less established mapping tradition. In semantic maps, labels are assigned to the environment in order to describe its qualitative features. The labels could either be direct descriptions for objects found in the environment, e.g., “chair”, “plant” and “desk” [10, 11, 12], or more abstract descriptions of places, like “office”, “floor” and “kitchen” [13, 14]. For a more extensive survey over semantic mapping, in [2] multiple approaches are compared and classified.
Models to describe an environment in multiple layers have been developed. The Spatial Semantic Hierarchy [15] represents an environment on five levels that contain sensory, control, causal, topological and metric data. While this model describes a multi-layered map, the layers are fixed and related to robot navigation. Our goal is to develop a generalized framework able to incorporate arbitrary information on a flexible amount of layers. Specifically, an implementation for a polygonal semantic layer is provided, which is not included in the SSH model.
Autonomous exploration for occupancy maps is a well-researched topic. A commonly used approach is frontier exploration [16], which aims to look for frontiers of the known maps to explore. Frontier cells are defined as free cells that are adjacent to unknown cells. Newer research focuses on exploration of 3D environments [17] and on utilizing learning methods to improve exploration behavior [18]. For semantic maps, however, only few papers focus on autonomous exploration. Jebari et al. [19] present an algorithm to autonomously explore an unknown environment while simultaneously building occupancy and semantic maps. They were however only interested in recognizing the positions of a few known objects and not their spatial extent, which is a problem we address in this work.
III Problem formulation
A map is an entity that records the spatial location of objects in the environment. Formally, let a map be defined by:
-
•
a position definition , which is used to refer to the spatial location of objects;
-
•
an object definition , which usually includes a value , where is a set of possible values, and a position ;
-
•
a set of object entities , following the object definition ;
-
•
a “content” function that, given a position, returns a set of objects at that position;
-
•
a “search” function that, given a value, returns the positions of objects having that value.
To provide an example, an occupancy map is most commonly represented as a grid map. Therefore, each position can be defined as a row and column pair; formally, . Each position refers to a cell , which has object representation , where represents the probability of occupancy of the cell. From this formulation, it can be noted that in grid maps there is no trivial way to obtain the extent of an object for objects spanning several cells since each cell is considered independently. On the other hand, semantic maps should store labeled objects with their extent. Therefore, the grid representation is not suitable for these maps, while polygonal maps are to be preferred. So, for semantic maps, we define an object by its label and occupied area, i.e., with and , where is the set of all class labels. The position definition in this case refers to coordinates in a frame of reference, therefore .
Since the representations of the maps differ, an application needing to treat information coming from multiple maps would need specific functions to handle the different types of representations separately. Ideally, the application should only communicate with a “master” map containing all knowledge about the environment arising from different maps. In this work, we propose a framework that provides a unified access method to maps of different types.
IV Method
IV-A Hypermap framework structure
Let us define a Hypermap as , where and are position and value definitions used by the framework, and is a set containing the maps together with two interface functions and . A function is used by the framework to convert from its own position definition to the -th layer’s one, while a function converts from the framework value definition to the -th layer’s one.
The and functions are used by the framework’s “content” and “search” functions, in the following way: the “content” function allows to access the content of a set of layers at position , and is defined as:
| (1) |
the “search” function instead allows to look for the position of objects having a certain value in a set of layers , and is defined as:
| (2) |
where is the inverse function of .
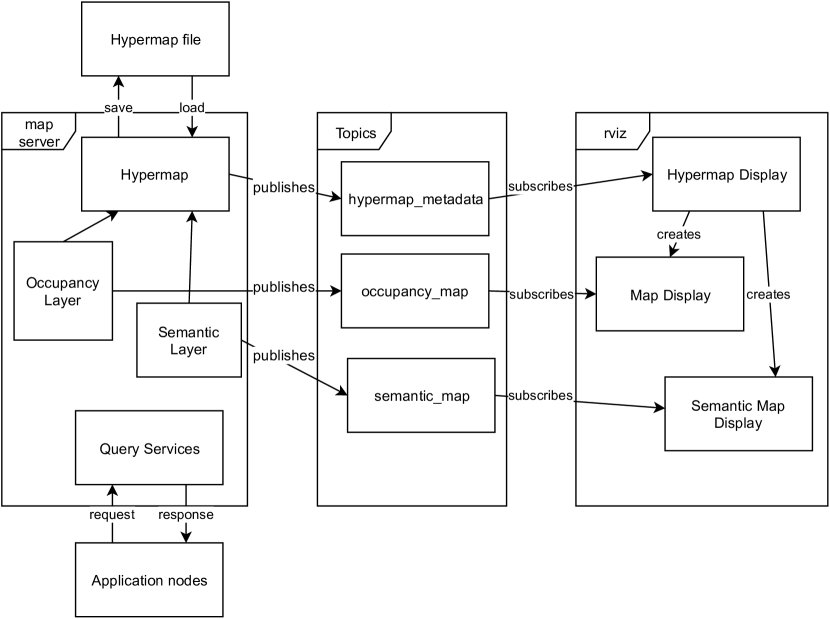
Figure 2 shows an overview of the structure of the framework implementation as a ROS node. The map server node stores the Hypermap with its layers. It can save and load Hypermap files and provides services, which allow other nodes to query the map for information. Furthermore, each layer publishes its content to a topic and the metadata of the Hypermap is published. The Hypermap display provided by the rviz plugin can subscribe to the metadata topic. It automatically creates the necessary displays for the layers, which subscribe to the respective topics.
For spatial queries, the global position definition is used. In addition to point queries, area queries are possible. The area can be specified by a list of points representing a simple polygon. The global value type is a string. If a service for a spatial query is called, the framework utilizes the content function to retrieve values from the layers, while the search function is used if a value service is queried.
The occupancy and the semantic layers are represented as a grid map and a polygonal map respectively, following the formalism presented in Section III. All conversion functions are handled by the layer implementation.
IV-B Semantic mapping on polygonal maps
While incremental mapping for grid maps is a well-studied problem, mapping on polygonal maps has been studied less. As described in Section III, a semantic object consists of a label and an area . The area is defined by a list of vertices forming a polygon. During the mapping process, new sensor information has to be integrated so that the area of this polygon can be incrementally estimated. This poses three main challenges: 1. after each new reading, the labeled objects in the scene have to be put on the map, with their coverage area estimated; 2. when a part of the environment is observed again after some time, new readings should be integrated with the estimate of the area of already known objects; 3. confidence over the existence of objects should be updated whenever an already mapped area is observed, and eventually objects with low confidence should be removed from the map.
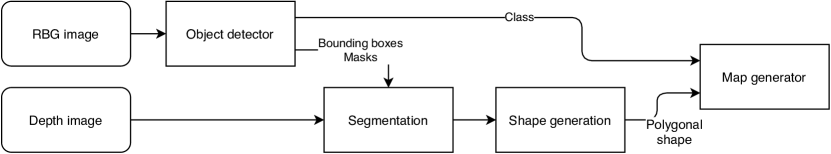
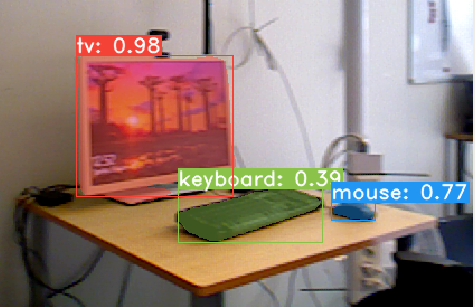
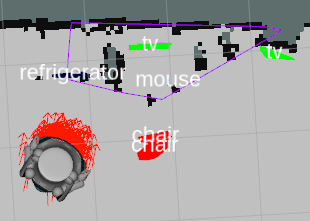
The process of collecting evidence for the semantic mapping can be divided into three phases: object detection, area generation, and map building. Figure 3 gives an overview over the information flow from the camera to the map generator. An RGB-D camera is used as sensor for the mapping. The object detection is performed on the RGB image by an off-the-shelf deep learning algorithm. For each detection, the algorithm provides a mask around the object, as shown in Figure 4(a). It can be noticed that these masks can sometimes include parts of the background. For this reason, the detected pixels are transferred to corresponding points in a point-cloud generated from the depth image of the RGB-D camera, and the background is removed by using a segmentation algorithm.
Then, to determine the area of the object on the map, the point-cloud cluster belonging to the object is projected on the - plane of the map frame. The transformation from the camera to the map frame has to be known, so a localization on the existing occupancy layer is performed. From the projected cloud, the convex hull is computed as object area. The area is passed on to the map generator.
The generator looks for similar areas of the same class on the map. The similarity is determined by computing the Jaccard index of the new areas with any overlapping area on the map. The Jaccard index between area and is computed as
| (3) |
If the index exceeds a set threshold, the areas are assumed to belong to the same object.
If an object is identified as a possible fit for the new area, the area is added to the area list of the object and the existence probability of the object is increased. Otherwise, a new object is created. If the existence probability exceeds a set threshold, the object is considered part of the map.
To determine the area to display for the object, the average centroid of all collected areas is computed. The area whose centroid is closest to the average is chosen as the best fitting area and is displayed on the map.
To be able to remove falsely detected objects, the existence probability has to be reduced in case an object is not detected. For this purpose, the visibility area of the camera is used: for each object in the map within the visibility area of a sensor measurement which has not received new evidence, the existence probability is reduced. The visibility area is determined by projecting the complete camera point-cloud to the - plane of the map frame and then computing the convex hull. An example of this visibility area is shown in purple in Figure 4(b).
IV-C Exploration
The autonomous exploration for semantic maps poses additional challenges compared to the exploration for occupancy maps. Occupancy maps store which cells are unknown. Therefore, exploration algorithms can determine from the map which areas have yet to be explored. A polygonal semantic map, on the other hand, can be sparsely populated with objects, which makes it impossible to differentiate between unexplored and empty areas.
To keep track of which area has been explored, a new map type is introduced. An exploration map describes which parts of the environment have already been explored. Since a known grid-based occupancy map is used for navigation, it is beneficial to use a grid representation for the exploration map. Therefore, . However, the value type differs from occupancy maps: instead of describing the occupancy probability, is 1 for explored cells and 0 for unexplored ones.
During the exploration, the values of the exploration map have to be updated. As discussed in the previous segment, the current visibility area is determined during the mapping process. However, this area uses the representation of the semantic layer, that is, . If the maps were used separately, the conversion of the visibility area to the explored cells would have to be performed on the application side. With the framework, the cells can simply be accessed through the provided interface.
The mapping process continuously uses the currently observed area to update the exploration map. An exploration application can access the values on this map to determine which areas to explore next. Once all cells within a set area are discovered, the exploration can be stopped.
V Experiments
For the experiments, we first evaluated the capabilities of the semantic mapping algorithm by generating maps through manually recorded data. We used a simulated office created by Rasouli et al. [20] as well as two real environments, the robot laboratory and a floor. Furthermore, we wanted to demonstrate the utility of using multiple layers of the framework. Therefore, we show how the framework can be used to autonomously explore a limited area of an existing occupancy map and populate it with semantic objects on a new layer.
V-A Platforms
For the simulation, a simulated turtlebot was used. The real experiments were performed on a Care-O-bot 4 mobile platform. The robot is equipped with three laser scanners to provide omnidirectional obstacle detection. The base can be moved in any direction. Spherical joints also allow for 360° rotations without moving the robot. Additionally, the robot contains multiple RGB-D cameras. For the conducted mapping experiments, the camera placed on the sensor ring below the head of the robot was used, as it provided the most complete view of the environment in front of the robot.
The semantic mapping requires a localization on an existing occupancy map. The occupancy maps of the environments were generated before the experiments from odometry and laser scan data using off-the-shelf Gmapping [1].
For object detection, a ROS wrapper for Yolact [21] was implemented. Yolact offers real-time instance segmentation for images. No training of the network was performed. Instead, the pre-trained base model trained on the COCO dataset [22] was used.
For the segmentation of the object point-clouds to remove background points, PCL’s region growing algorithm was used. The resulting segment with the most points is assumed to belong to the detected object.
The minimal Jaccard index for areas to be considered evidence for the same object was set to 0.2. The value was chosen low as often, only parts of an object are contained in the detected point-cloud111All the code, together with the simulated environment used for experiments, is available here: https://github.com/Eruvae/hypermap.
V-B Environments
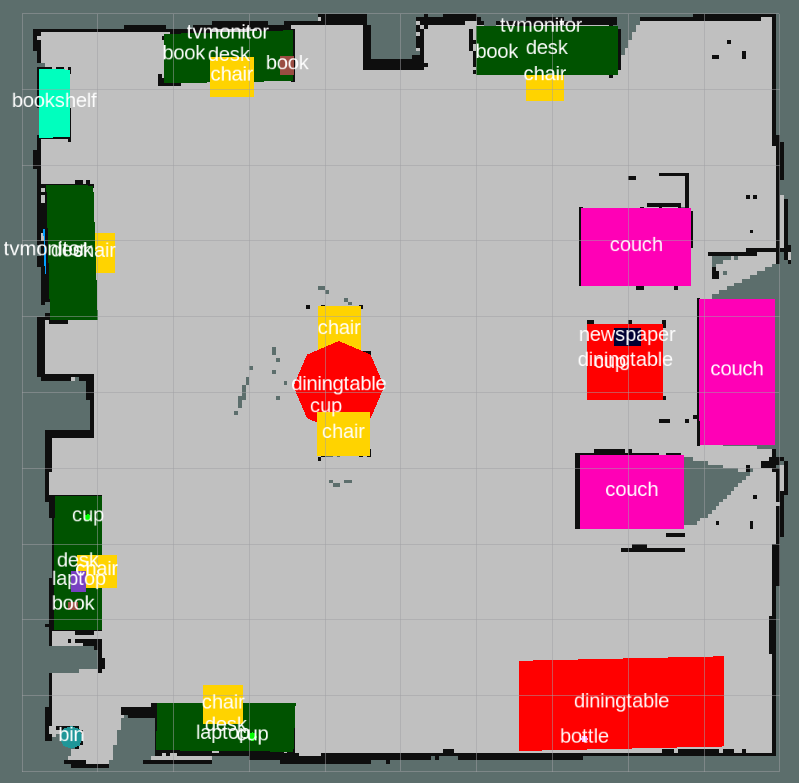
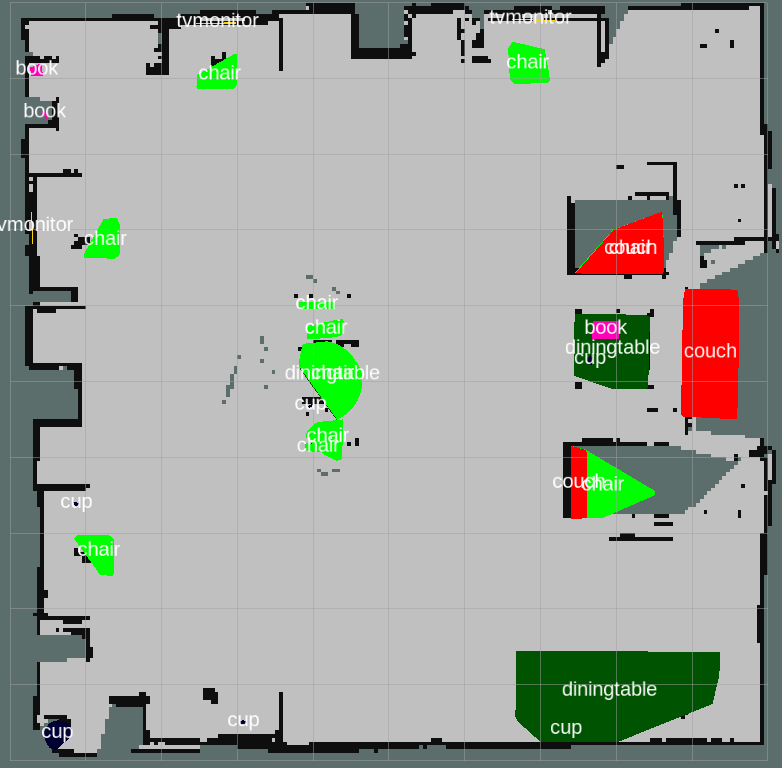
The simulated environment is an office with multiple desks and chairs. Monitors, cups, and books are placed on the desks. Additionally, there are multiple dining tables and a few couches. Figure 5(a) shows the manually labeled ground truth map of the office. The duration of the mapping sequence was 134 s, during which the robot moved around the whole office. We will refer to this environment as Office.
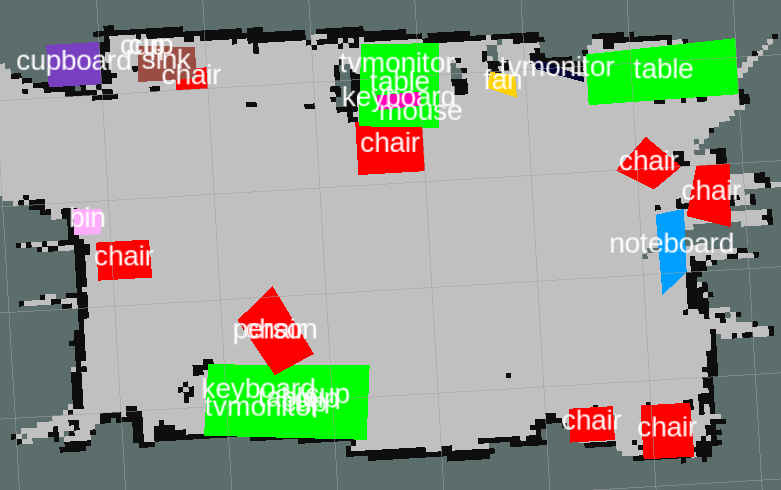
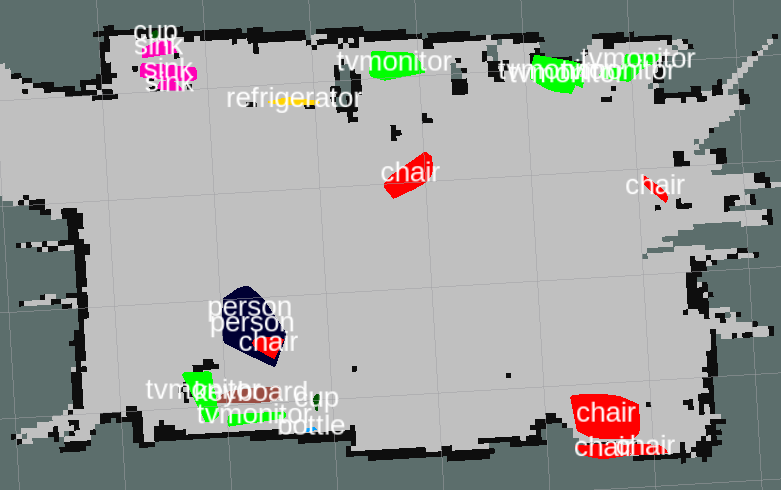
The first real environment is a laboratory. Figure 6(a) shows the manually labeled ground truth map. It contains multiple chairs, a sink, a cupboard and tables with monitors, keyboards, mouses and cups. In the recorded sequence, the robot moved for 143 seconds through the laboratory, moving from its home position to the door and back while rotating a few times. We will refer to this environment as Laboratory.
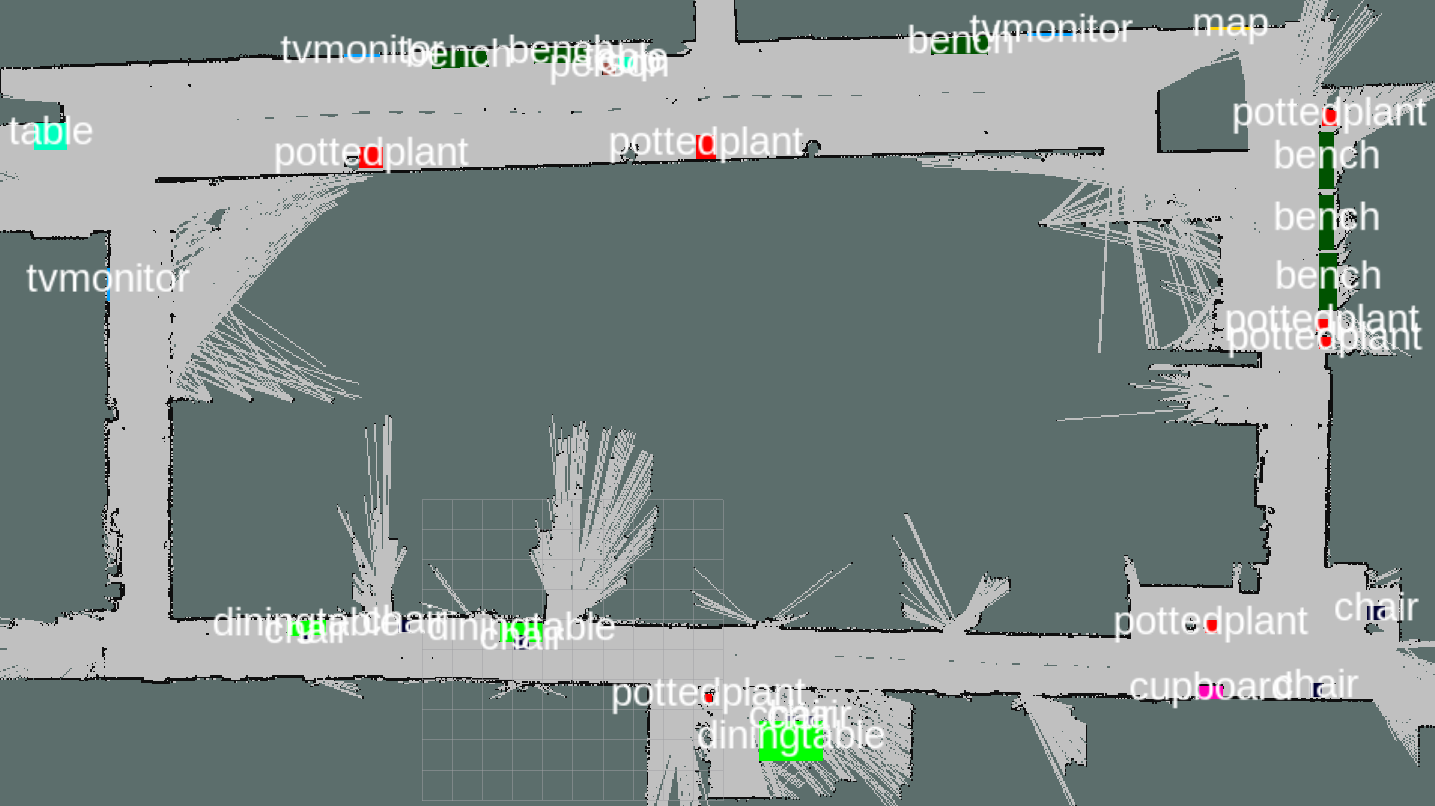
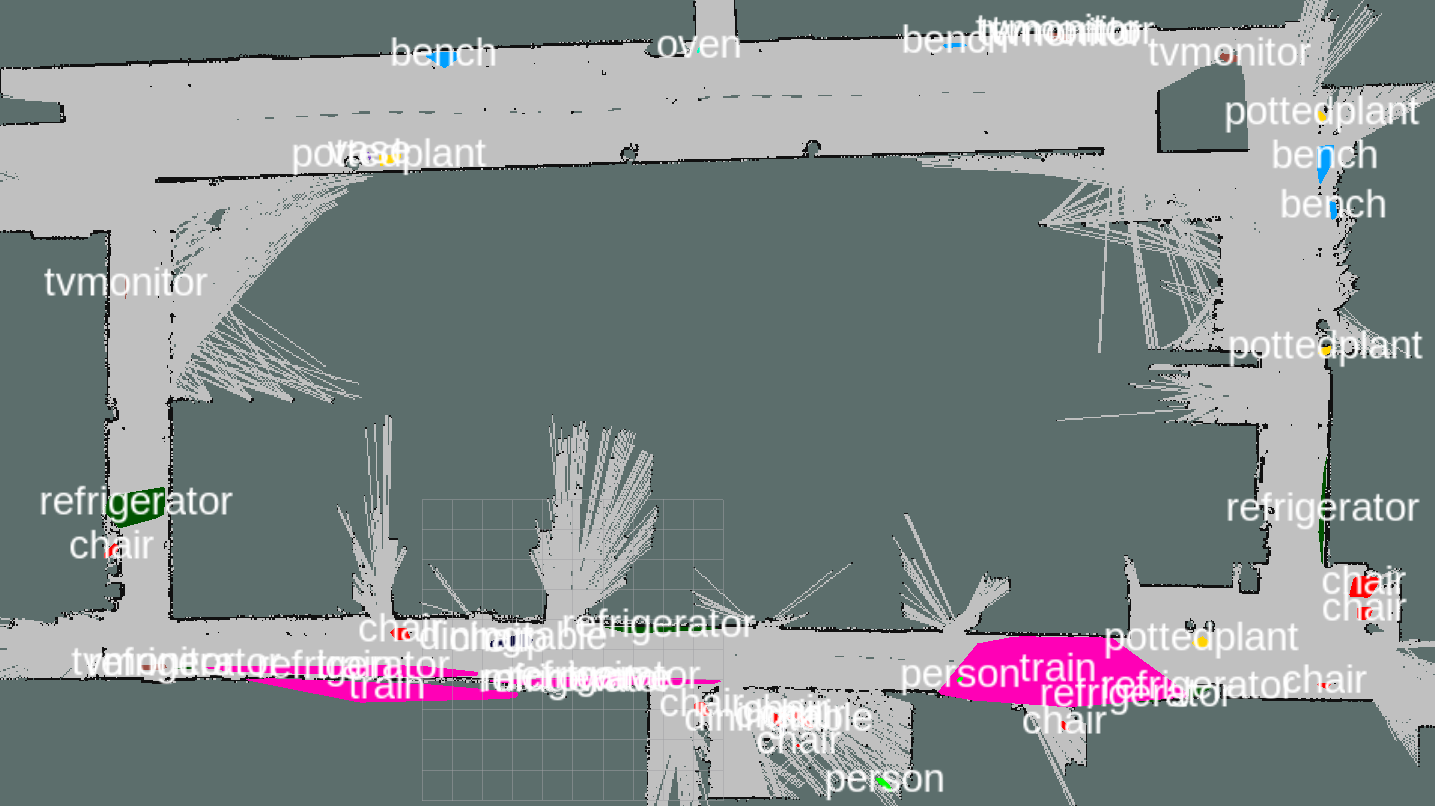
The second real environment is a floor of a university building. Figure 7(a) shows the corresponding ground truth map. The most common types of objects are benches, chairs and potted plants, but the environment also contains some tables and monitors. The recorded sequence was 7 minutes long, during which the robot moved one time around the floor. We will refer to this environment as Floor.
The ground truth maps contain some objects that the neural network was not trained to recognize, such as desks and cupboards. These objects were included to provide a more complete overview of the environment but were ignored in the detection analysis.
V-C Results
The generated maps were compared to the ground truth maps. An object was counted as detected if an object of that class was found within 1 m of the ground truth object. For each successful detection, the quality was analyzed using two parameters: the Jaccard index is computed as a measure of shape similarity, and the centroid distance as a measure of localization accuracy.
| Ground truth | Detected | Jaccard | Centroid dist. | |
|---|---|---|---|---|
| diningtable | 3 | 3 | 0.76 | 0.034 |
| cup | 4 | 4 | 0.41 | 0.087 |
| couch | 3 | 3 | 0.41 | 0.32 |
| chair | 7 | 7 | 0.53 | 0.19 |
| tvmonitor | 3 | 3 | 0.54 | 0.08 |
| book | 4 | 0 | - | - |
| laptop | 2 | 0 | - | - |
| bin | 1 | 0 | - | - |
| bottle | 1 | 0 | - | - |
| Total | 28 | 20 | 0.52 | 0.15 |
Figure 5(b) shows the map generated in the Office. The detection results are presented in Table I. 20 out of 28 detectable objects were found, with an average Jaccard index of 0.52 and a centroid distance of 0.15 m. The map also contains some false detections. Two armchairs (labeled as couch in the ground truth) were simultaneously recognized as chair and couch. The central dining table was recognized as both a chair and a dining table. The bin at the bottom left corner as well as the bottle on the bottom right dining table were labeled as cups. While none of the books placed on the desks were recognized, two books were found in the bookshelf on the top left corner.
| Ground truth | Detected | Jaccard | Centroid dist. | |
|---|---|---|---|---|
| chair | 8 | 5 | 0.27 | 0.23 |
| tvmonitor | 3 | 3 | 0.37 | 0.055 |
| keyboard | 2 | 1 | 0.63 | 0.077 |
| mouse | 1 | 0 | - | - |
| sink | 1 | 1 | 0.43 | 0.086 |
| cup | 5 | 2 | 0.48 | 0.073 |
| person | 1 | 1 | 0.80 | 0.23 |
| bin | 1 | 0 | - | - |
| Total | 22 | 13 | 0.40 | 0.14 |
Figure 6(b) shows the detections in the Laboratory and Table II the corresponding results. Here, 13 out of 22 objects were detected, with an average Jaccard index of 0.4 and a centroid distance of 0.14 m. The map contains a few doubled objects; the sink was placed 3 times in different positions, and a few monitors and as well as the person is recognized twice. A reason for this could be localization inaccuracies of the robot, which causes the same object to be seen in slightly different places.
| Ground truth | Detected | Jaccard | Centroid dist. | |
|---|---|---|---|---|
| pottedplant | 7 | 4 | 0.44 | 0.44 |
| diningtable | 3 | 2 | 0.27 | 0.57 |
| chair | 7 | 5 | 0.48 | 0.30 |
| bench | 6 | 4 | 0.27 | 0.31 |
| tvmonitor | 3 | 2 | 0.32 | 0.40 |
| person | 1 | 0 | - | - |
| cup | 1 | 0 | - | - |
| Total | 28 | 17 | 0.38 | 0.38 |
Figure 7(b) shows the map of the Floor, with Table III for the corresponding results. 17 out of 28 objects were detected, with an average Jaccard index of 0.38 and a centroid distance of 0.38 m. This map contains more false detections than the previous environments. Parts of the floor were sometimes recognized as trains by the neural network. These kinds of detection faults could be prevented by training the network specifically for an environment.
V-D Application: Autonomous Semantic Exploration
The exploration capabilities of the framework were tested in the simulated Office. For the experiments, the exploration area was specified using an rviz plugin for publishing polygons. After the border is set, the robot starts exploring the area. To determine the exploration goals, a node designed for occupancy map exploration [23] is utilized.
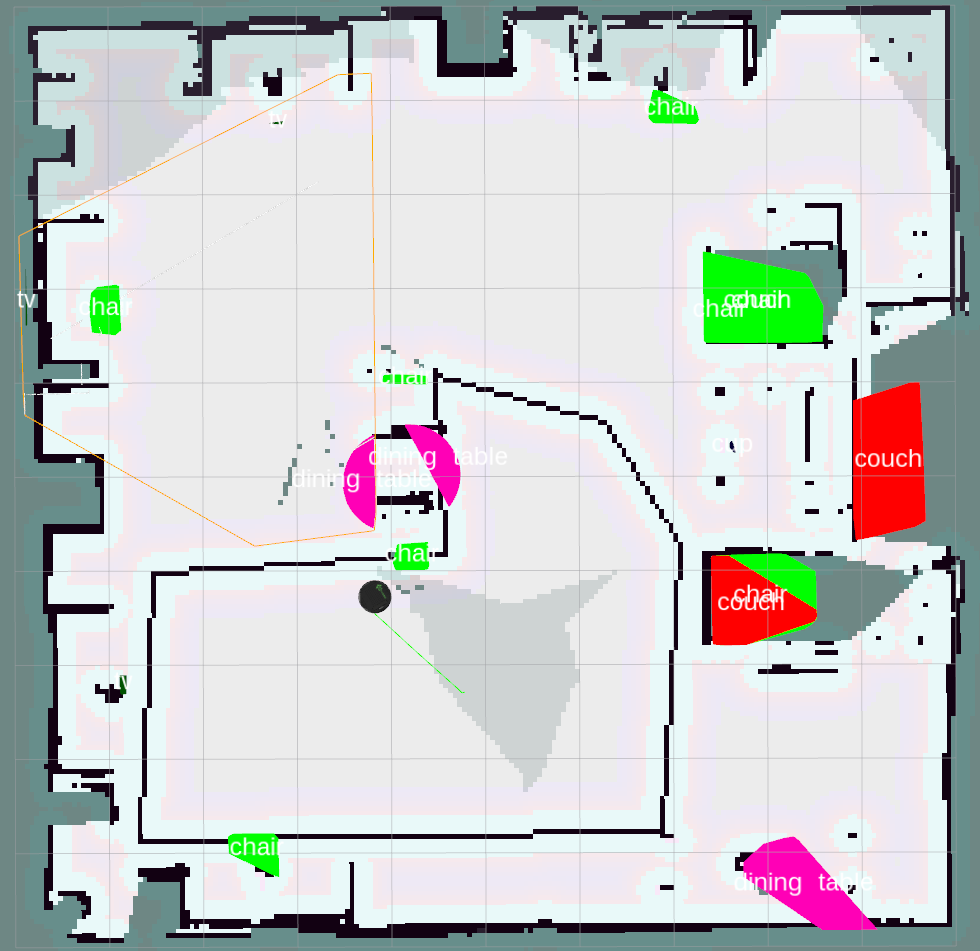
Figure 8 shows the resulting map for the described setup. The bright cells mark the explored area, while the darker cells are unexplored. The orange polygon shows the currently visible area. The exploration border is marked by a polygon of occupied cells. While objects outside of the border are still added to the map, the robot only moves within the marked area. Although fewer objects were recognized than during the manually navigated tour around the office, most objects close to the border were included in the map.
It is important to note that all interactions with the three maps required to complete this task happened through the Hypermap framework and the application only required and to handle all the different underlying map definitions.
V-E Discussion
The experiments on the semantic mapping algorithm showed that it is capable of estimating rough object positions and shapes. However, if the exact shape of objects is needed, the method is not suitable yet, as sometimes, only parts of the shapes are recognized. Furthermore, some objects are detected multiple times in different positions.
One major problem is the dependency of the mapping on the localization through the occupancy map. An algorithm that takes localization inaccuracies into account and detects and removes duplicate objects could help improving the map quality.
Furthermore, the approach could benefit from a neural network trained for office environments. The COCO dataset is missing classes that are important to generate complete semantic maps for offices, especially tables. On the other hand, it contains classes that do not occur (e.g. trains), and therefore lead to false detections.
For an accurate object shape representation, the shape combination would need to be improved. Currently, one of the detected polygons is selected as the best fitting shape. This can lead to incomplete shapes if an object was only partially visible from most viewpoints. While merging overlapping shapes could prevent that, it also leads to inflated shapes, especially in combination with localization inaccuracies. A more intelligent approach would be necessary to guarantee accurate and complete object shapes.
Regarding the autonomous exploration, we showed that the framework allows to easily use existing nodes intended for occupancy exploration to semantically explore parts of an existing map. While this demonstrates the benefits of a multi-layered mapping framework, it does not exhaust its capabilities. Future works could use the provided service to easily access other properties of the environment.
VI Conclusions
In this work, we presented the Hypermap framework, that allows to manage multiple layers of different types of maps. We furthermore introduced a mapping algorithm that creates polygonal semantic maps from RGB-D camera images. The semantic mapping process has proven to be able to detect several different objects and produce reasonable hypotheses for object placements and shapes. The framework simplifies applications that depend on multiple map types, since they do not need to handle different representations if they use the framework. As an example, we demonstrated an autonomous mapping process that utilizes the framework to provide and update an exploration layer while a semantic map is being built. This process could update the exploration layer using polygonal areas, even if internally a grid map was used.
For future work, the framework could be extended with new layer types for different purposes. Furthermore, applications could be developed that use the features provided by the framework to simplify tasks that require multiple types of information about an environment.
References
- [1] G. Grisetti, C. Stachniss, and W. Burgard, “Improved techniques for grid mapping with rao-blackwellized particle filters,” IEEE transactions on Robotics, vol. 23, no. 1, pp. 34–46, 2007.
- [2] I. Kostavelis and A. Gasteratos, “Semantic mapping for mobile robotics tasks: A survey,” Robotics and Autonomous Systems, vol. 66, pp. 86–103, Apr. 2015.
- [3] H. Deeken, T. Wiemann, and J. Hertzberg, “Grounding semantic maps in spatial databases,” Robotics and Autonomous Systems, vol. 105, pp. 146–165, Jul. 2018.
- [4] F. Verdoja, J. Lundell, and V. Kyrki, “Deep Network Uncertainty Maps for Indoor Navigation,” in 2019 IEEE-RAS International Conference on Humanoid Robots (Humanoids), Nov. 2019.
- [5] R. Siegwart, I. R. Nourbakhsh, D. Scaramuzza, and R. C. Arkin, Introduction to Autonomous Mobile Robots. Cambridge, USA: MIT Press, 2011.
- [6] G. Foux, M. Heymann, and A. Bruckstein, “Two-dimensional robot navigation among unknown stationary polygonal obstacles,” IEEE Transactions on Robotics and Automation, vol. 9, no. 1, pp. 96–102, Feb. 1993.
- [7] L. Zhang and B. K. Ghosh, “Line segment based map building and localization using 2d laser rangefinder,” in IEEE International Conference on Robotics and Automation (ICRA), vol. 3, Apr. 2000, pp. 2538–2543.
- [8] N. S. Rao, S. Kareti, W. Shi, and S. S. Iyengar, “Robot navigation in unknown terrains: Introductory survey of non-heuristic algorithms,” Oak Ridge National Lab., TN (United States), Tech. Rep., 1993.
- [9] M. Missura, D. D. Lee, and M. Bennewitz, “Minimal Construct: Efficient Shortest Path Finding for Mobile Robots in Polygonal Maps,” in 2018 IEEE/RSJ International Conference on Intelligent Robots and Systems (IROS), Oct. 2018, pp. 7918–7923.
- [10] D. Meger, P.-E. Forssén, K. Lai, S. Helmer, S. McCann, T. Southey, M. Baumann, J. J. Little, and D. G. Lowe, “Curious George: An attentive semantic robot,” Robotics and Autonomous Systems, vol. 56, no. 6, pp. 503–511, Jun. 2008.
- [11] G. Costante, T. A. Ciarfuglia, P. Valigi, and E. Ricci, “A transfer learning approach for multi-cue semantic place recognition,” in 2013 IEEE/RSJ International Conference on Intelligent Robots and Systems (IROS), Nov. 2013, pp. 2122–2129.
- [12] A. J. Trevor, S. Gedikli, R. B. Rusu, and H. I. Christensen, “Efficient organized point cloud segmentation with connected components,” Semantic Perception Mapping and Exploration (SPME), 2013.
- [13] A. Pronobis and P. Jensfelt, “Large-scale semantic mapping and reasoning with heterogeneous modalities,” in 2012 IEEE International Conference on Robotics and Automation (ICRA), May 2012, pp. 3515–3522.
- [14] O. M. Mozos, H. Mizutani, R. Kurazume, and T. Hasegawa, “Categorization of Indoor Places Using the Kinect Sensor,” Sensors, vol. 12, no. 5, pp. 6695–6711, May 2012.
- [15] B. Kuipers, “The spatial semantic hierarchy,” Artificial intelligence, vol. 119, no. 1-2, pp. 191–233, 2000.
- [16] B. Yamauchi, “A frontier-based approach for autonomous exploration,” Proceedings 1997 IEEE International Symposium on Computational Intelligence in Robotics and Automation CIRA’97. ’Towards New Computational Principles for Robotics and Automation’, pp. 146–151, 1997.
- [17] S. Shen, N. Michael, and V. Kumar, “Autonomous indoor 3d exploration with a micro-aerial vehicle,” in 2012 IEEE International Conference on Robotics and Automation, May 2012, pp. 9–15.
- [18] D. Zhu, T. Li, D. Ho, C. Wang, and M. Q. Meng, “Deep Reinforcement Learning Supervised Autonomous Exploration in Office Environments,” in 2018 IEEE International Conference on Robotics and Automation (ICRA), May 2018, pp. 7548–7555.
- [19] I. Jebari, S. Bazeille, E. Battesti, H. Tekaya, M. Klein, A. Tapus, D. Filliat, C. Meyer, S. Ieng, R. Benosman, E. Cizeron, J. Mamanna, and B. Pothier, “Multi-sensor semantic mapping and exploration of indoor environments,” in 2011 IEEE Conference on Technologies for Practical Robot Applications, Apr. 2011, pp. 151–156.
- [20] A. Rasouli and J. K. Tsotsos, “The Effect of Color Space Selection on Detectability and Discriminability of Colored Objects,” arXiv:1702.05421 [cs], 2017.
- [21] D. Bolya, C. Zhou, F. Xiao, and Y. J. Lee, “Yolact: Real-time instance segmentation,” in ICCV, 2019.
- [22] T.-Y. Lin, M. Maire, S. Belongie, J. Hays, P. Perona, D. Ramanan, P. Dollár, and C. L. Zitnick, “Microsoft COCO: Common objects in context,” in European Conference on Computer Vision (ECCV). Springer, 2014, pp. 740–755.
- [23] M. Lauri and R. Ritala, “Planning for robotic exploration based on forward simulation,” Robotics and Autonomous Systems, vol. 83, pp. 15–31, 2016.