Adsorption anomalies in a 2D model of cluster-forming systems
Abstract
Adsorption on a boundary line confining a monolayer of particles self-assembling into clusters is studied by MC simulations. We focus on a system of particles interacting via competing interaction potential in which effectively short-range attraction is followed by long-range repulsion, mimicking the so called SALR system. For the chemical potential values below the order-disorder phase transition the adsorption isotherms were shown to undergo non-standard behavior, i. e. the adsorption exhibits a maximum upon structural transition between structureless and disordered cluster fluid. In particular, we have found that the adsorption decreases for increasing chemical potential when (i) clusters dominate over monomers in the bulk, (ii) the density profile in the direction perpendicular to the confining line exhibits an oscillatory decay, (iii) the correlation function in the layer near the adsorption wall exhibits an oscillatory decay in the direction parallel to this wall. Our report indicates striking differences between simple and complex fluid adsorption processes.
I Introduction
Traditionally, adsorption is considered as a deposition of particles on a surface. In the case of simple atomic or molecular species, polymers, liquid crystals, proteins, other biological objects it has received a huge amount of attention, considering different aspects of the phenomena. In particular, monolayer and multilayer adsorption including wetting, prewetting, different phase transitions and criticallity of adsorbed layers were investigated in detail Roe (1974); Dash (1975); Kreuzer and Gortel (1986); Kukushkin and Osipov (1998); Jerome (1991); Patrykiejew et al. (2000); Netz and Andelman (2003); Bruch et al. (2007); Rabe et al. (2011). On the other hand, not much attention has been given to adsorption in monolayers on restricting walls. If the adsorbed monolayer is modeled as a two-dimensional (2D) system, then the confining walls are one-dimensional (1D) and one can consider layers of particles formed in the neighborhood of the 1D walls as adsorbed layers. In the present study, we describe how particles interacting via nonmonotonical pair potential in which effectively hard-core repulsion is followed by attraction well and repulsive tail (SALR system) adsorb on a straight 1D wall that confines a flat surface.
For 2D systems, the influence of confinement on pattern formation was previously investigated experimentally Antelmi et al. (1995); Yu et al. (2006, 2008); Su et al. (2003); Li et al. (2005); Huang et al. (2006); Haghgooie et al. (2006), theoretically Tasinkevych and Ciach (2001); Imperio and Reatto (2007); Imperio et al. (2008); Archer (2008); Chi et al. (2011) and by computer simulations Almarza et al. (2016); Pȩkalski et al. (2019). When the pattern formation is induced by competing attractive and repulsive interactions the size and shape of the confinement was shown to be crucial when the aim is to fabricate a defect free pattern Almarza et al. (2016) or a chiral structure Pȩkalski et al. (2019). The confinement effects on SALR clusters were described also in 1D case, where the aggregates were shown to induce spatial bistability Pȩkalski et al. (2014) or pressure decrease upon increase of the density Pȩkalski et al. (2014). To our knowledge, however, for particles interacting with isotropic competing interactions 2D adsoprtion isotherms have not been described so far.
In dilute SALR systems, formation of clusters has been observed when the particle density exceeds the value corresponding to the critical cluster density Santos et al. (2017); Litniewski and Ciach (2019), analogous to the critical micelle density in surfactant mixtures. While the ordered periodic phases in the SALRZhuang et al. (2016) systems have not been observed experimentally yet Royall (2018); Zhuang and Charbonneau (2016), the cluster fluids, first reported in Ref. Stradner et al. (2004), are quite often observed for various systems. Only recently, the effect of clustering on the adsorption on confining walls has been studied Litniewski and Ciach (2019) and it was shown that the effect of clustering on the adsorption phenomena in 3D is very strong, and deserves further investigation.
In this work we study the entirely unexplored question of the effect of self-assembly into clusters on adsorption on a confining line in a 2D system of SALR particles. In the case of a single boundary line at , the line excess amount or the Gibbs adsorption is defined as follows:
| (1) |
where and are the average density at the distance from the wall and in the bulk, respectively, for fixed chemical potential .
We calculate the adsorption isotherms for a triangular lattice model introduced earlier in Refs.Pȩkalski et al. (2014); Almarza et al. (2014) and summarized in sec. II. In the same section our Monte Carlo simulation method is briefly described. In addition, we calculate structural characteristics such as the cluster distribution in the bulk and near the wall, density profile in direction perpendicular to the wall and the correlation function in the layers parallel to the wall. The results are presented in sec.III, where the relation between the shape of the adsorption isotherm and the structure of the fluid is also discussed. We summarize our results and present our conclusions in sec.IV.
II The model and the simulation procedure
In order to allow close-packed structure, we have used a triangular lattice with a lattice constant equal to the particle diameter. After Ref.Almarza et al. (2016, 2014), we assume the following interaction potential between the particles on the lattice sites:
| (2) |
where and represent the energy of interparticle attraction and repulsion, respectively. We used the ratio as in Refs Pȩkalski et al. (2014); Almarza et al. (2016, 2014).
The thermodynamic Hamiltonian for our system has the following form:
| (3) |
where is the sum over all lattice sites, is the sum over the sites nearest to the wall (or walls), is the occupation number. or 0 if the site with the coordinate is occupied or vacant. is the interaction energy of a particle with the wall. It can be negative (attractive boundary), positive (repulsive boundary) or vanishing (neutral wall). In experimental systems, the long-range repulsion between the particles is often of electrostatic origin. In such a case, the walls interacting with the particles only at short distances are charge-neutral. In calculations, the dimensionless values , , , are used.
The phase diagram as well as the ground states of this system in the bulk were investigated in Ref.Almarza et al. (2014); Pȩkalski et al. (2014). As shown in Ref.Almarza et al. (2016) for the stripe (lamellar) phase, the confinement between two parallel lines can drastically change the structure in the whole slit. The presence of a single wall may change the particle arrangement in its vicinity, but the effect of a single confining line has not been studied in this model yet.
In theory, the phenomenon of adsorption is considered as the deposition of particles on a planar boundary in a semi-infinite system, Eq.(1), but in the computer simulation, a stripe between two walls has to be modelled. We define the adsorption for our model by
| (4) |
where and are the average density at the distance from the wall and in the central one third part of the system, respectively, and both densities are calculated for the chemical potential . For large enough inter-wall distance , should be the same as the density in the bulk, ; otherwise the finite-size effects have to be taken into account. The finite size effects can be studied by varying the wall-wall distance, but it goes beyond the scope of this work. In the direction parallel to the walls, periodic boundary conditions are specified.
The Monte Carlo simulation procedure was carried out in the grand canonical ensemble according to the Metropolis algorithm with a standard importance sampling. We chose the distances between the walls and the system size along the walls the same as to be sure that this distance is several times larger of the largest correlation length in the system. To verify that , we computed in a system with periodic boundary conditions.
III Results
III.1 The ground State ()
As noted above, we assume that the interaction between the particles and the walls exists only in the rows closest to them. The walls can be neutral , attractive or repulsive .
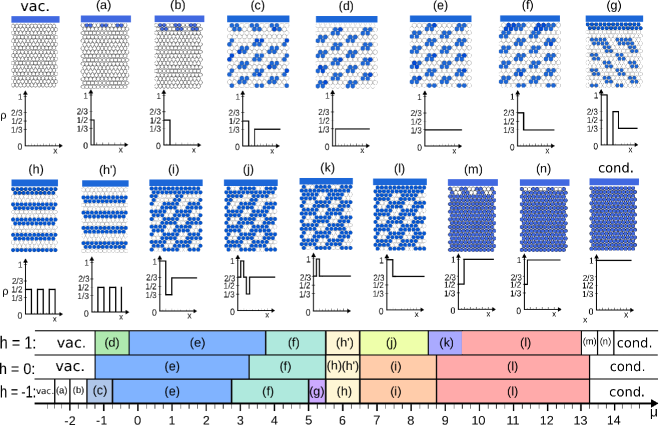
In the case of neutral walls (), the ground states are cluster (e,f), lamellar (h) and bubble (i,l) phases (Fig. 1) that are similar to that in the bulk. The phase (e) only indicates absence of adsorption on the wall with homogeneous distribution of the average density in layers parallel to the wall. The lamellar phases (h) and (h’) are strictly periodic in the direction perpendicular to the wall and filled layers start directly from the attractive wall. The other phases are separated from the wall by different structures in two (f,l) or four (i) adjoining layers. For not neutral walls the same bulk structures appear with more rich adsorbed structures within six adjoining rows at most.
It is interesting to consider an attractive wall and small values of the chemical potential corresponding to the ordered cluster phase shown in panel (c) in Fig.1. In the two rows closest to the boundary (rows 1 and 2), the clusters are packed more densely than in the bulk. The two following rows (rows 3 and 4), however, are empty because of the repulsion between the third neighbors. As a result, the adsorption is negative, . This counter-intuitive result showing that the attractive surface can lead to a desorption follows from the formation of the depletion (empty) zone following the adsorbed layer. Let us focus on the vacuum that is the state of the disordered dilute phase studied at in the following sections. A layer of thin or thick clusters is formed for or respectively. The adsorption is positive in the two cases, in contrast to the case discussed above. At there is a discontinuous change from to , next at the adsorption jumps from to , and at from to .
III.2 The adsorption isotherms
We investigated the behavior of the adsorption at various temperatures and the interaction with the walls (Fig. 2). The chemical potential values are restricted by for , respectively, to avoid the influence of phase transition effects on the adsorption phenomena.

For the walls with attracting character (), the maximum of adsorption at the low temperature is observed at the value of the chemical potential, which corresponds to the disordered gas phase in the bulk. At the lowest value of the chemical potential, the adsorption is weak due to very low density of particles. With increasing the chemical potential and correspondingly the bulk density, the adsorption increases as well up to an intermediate value of the chemical potential and then starts to decrease.
In a warmer environment (), the adhesion of particles to the wall becomes less intense. As a result, the maximum values of adsorption decrease with increasing temperature and the peak of the adsorption is smoothed out. It is of interest to investigate the effect of the formation of this peak in more detail. To this end, the partial adsorption is introduced as
| (5) |
The partial adsorption for the chemical potential values smaller, at the adsorption maximum and above the latter is shown in Fig. 3.
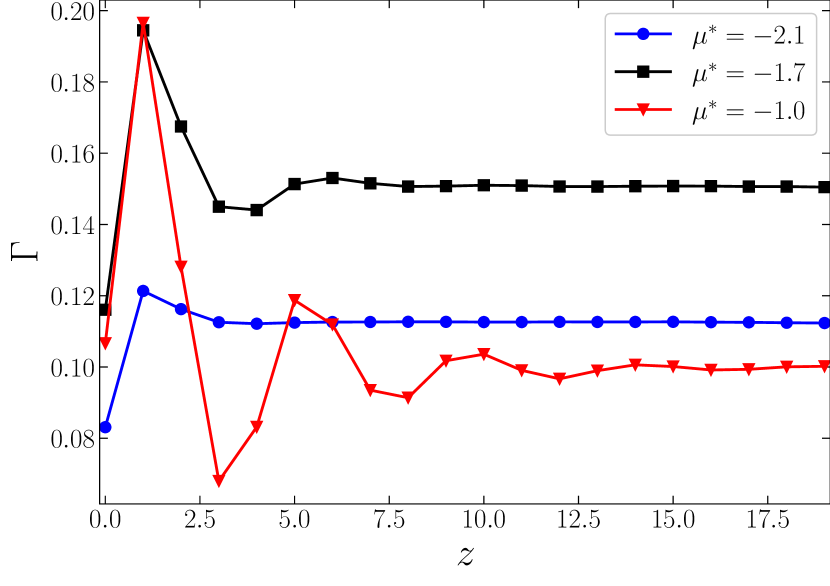
The partial adsorption is asymptotically approaching the total adsorption for the same chemical potential. However, the deviations of the partial adsorption from the asymptotic value are growing when the chemical potential and bulk density are increasing. This is a consequence of the clusters formation in the system. The partial adsorption dependence on allows to estimate the distance from the wall where its influence spans. It strongly increases with the density and involve 4, 8 and 16 layers for and -1.0, consecutively.
III.3 The density profile
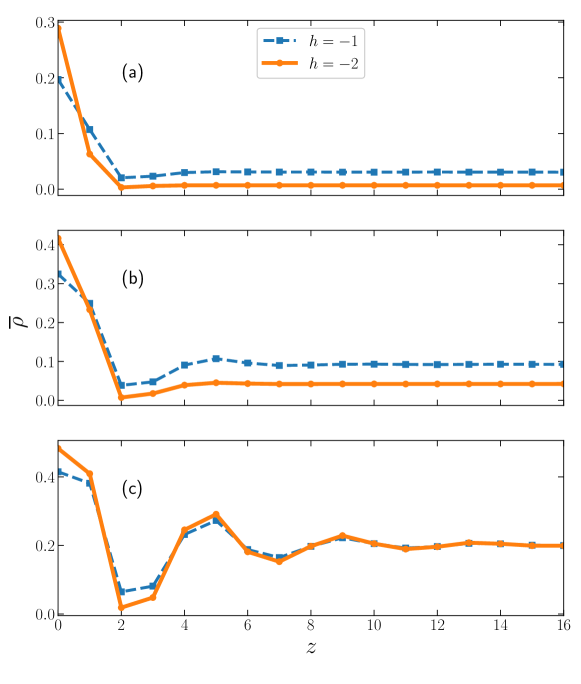
The distribution of particles in the near wall region demonstrates considerable changes with increasing the chemical potential and correspondingly the bulk concentration (Fig. 4). At low density at the system states before and at the adsorption maximum four or eight nearest to the wall rows show deviation from the bulk density. The closest row is excessively populated due to attraction to the wall and the next row is populated as well because of the interparticle attraction of the first neighbours. Two subsequent rows are depleted in view of the repulsion of the next-next-nearest neighbours. At low density of particles the influence of the wall decreases fast with the distance to the wall. At larger concentration (for ) the relay mechanisms transfer the density deviations for longer distances.
The qualitative behavior of the density profiles at higher reduced temperatures (0.7 and 0.9) remains the same. However, because of larger densities at the damped oscillations are visible already at the chemical potential corresponding to the adsorption maximum.
With an increase in the energy of interaction with the wall , the density of adsorbed particles near it increases and the peak position of shifts to the region of lower chemical potential (Fig. 2).
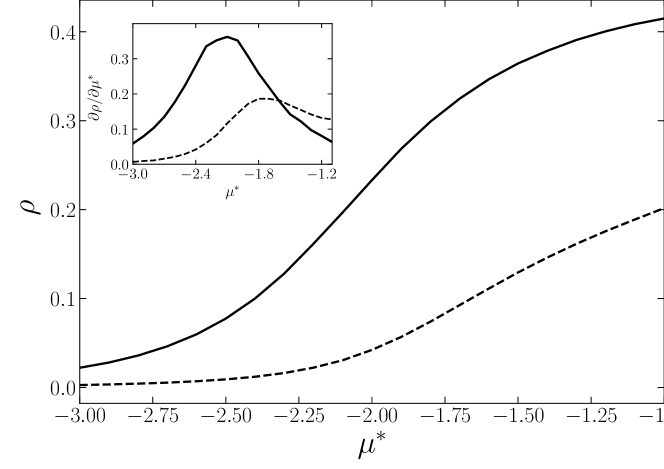
Because of the attraction to the wall, the density of particles in the row adjoining to it grows initially faster with the chemical potential increase than in the bulk (Fig. 5). However, when attains the value corresponding to the maximal adsorption, its growth slows down.
The total adsorption is mainly determined by the rivalry of the density deviations in the two rows closest to the wall and the two subsequent ones that is the result of the competing interparticle interactions. The long range repulsive interaction is of minor importance at low density of particles. With the chemical potential increase and due to the wall attraction, the density of the particles in the layers closest to the wall increases to the values when the interparticle repulsion joins the game and starts to hamper the density increase. It is well illustrated by the dependence of the density on the intensity of the wall attraction (Fig. 4). Even at the lowest bulk density (Fig. 4a) the ratio () is considerably smaller than the Boltzmann factor exp, especially at . This is just the influence of the interparticle repulsion, because is large enough when the repulsion can order the system into succession of rhombusesAlmarza et al. (2014). The upper bound for for a layer of clusters that do not repel one another is (see Fig.1). At the same time, the bulk density increases as well, and the density in the rows 3 and 4 decreases to very small values. These two layers lead to a negative contribution to the adsorption, and the absolute value of this contribution increases with increasing bulk density. The result of this is the maximum on the chemical potential dependence of the total adsorption.
An additional information can be drawn from adsorption at neutral and repulsive walls. The neutral wall behaves like an attractive one, especially at the chemical potentials corresponding to not very small concentrations (Fig. 2). Definitely, this is the result of the long range interparticle repulsion. The particles in the rows closest to the wall feel repulsion from the bulk side of the system and do not experience such an action from the wall. This effect comes even out for the repulsive wall resulting in a considerably weaker negative adsorption as compared to that at the attractive one.
III.4 Cluster formation
In systems with competing interactions the formation of clusters plays an important role in general Almarza et al. (2014); Bomont and Costa (2012); Santos et al. (2017) as well as in adsorption phenomena as it was demonstrated for a 3D off-lattice systemLitniewski and Ciach (2019). Thus, the analysis of possible clusters and their distribution in the near wall region can give an additional insight into characterization of the adsorption in our 2D lattice system.
The following types of clusters are predominantly found in the gas phase of these systems: monomers, dimers, 2 types of triangular clusters and rhomboidal clusters. The contribution of each of them changes with increasing the chemical potential or density both in the bulk and in the border area (Fig. 6).
The distribution is shown for cluster sizes since the contribution of clusters of higher sizes is much lower of the order of . In addition, for each of the sizes greater than or equal to 3, the sum of the probabilities of all possible configurations was calculated due to the fact that the probability of the most energetically favorable configuration is much higher than the others for the same cluster size (an equilateral triangle for =3, a rhombus for =4, a trapezoid for =5) and is approximately 95% relative to the total number of clusters of a given size for the chemical potential values considered. As an exception, three-particle clusters can be distinguished: the contribution of the clusters that form the equilateral triangle is about 80%, about 20% is a part of the clusters, forming an irregular triangle, and much less than 1% are for linear clusters.
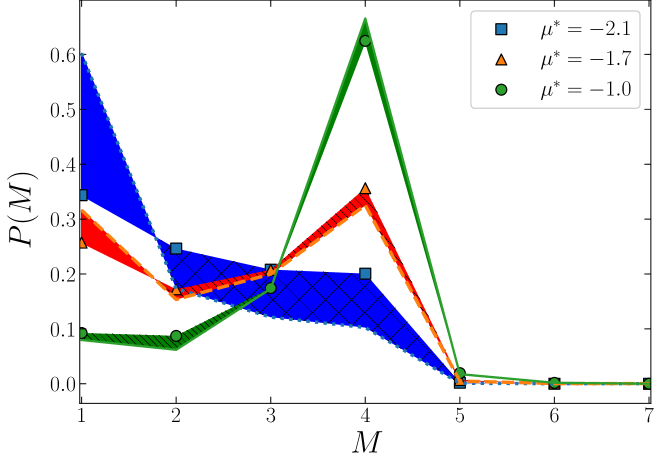
With the density increase, the particle distribution shifts to larger cluster sizes. As compared to the bulk, the excess of isolated particles in the near-wall region decreases with the chemical potential increase and takes a negative value for . At the chemical potential that corresponds to the maximum of the adsorption, the probability distribution of particles among the clusters is a qualitatively different from two other situations. The probability distribution has two highs, one for isolated particles and the other for rhombuses.
A similar situation takes place in the bulk that can be explained by the density increase although there is a large difference in the bulk and the near-wall mean particle densities (0.2 against 0.4 at and ). The ordered structures in these regions are different. In the near-wall region a two-row stripe filled by the rhomboid clusters is followed by almost empty two rows while in the bulk they are homogeneously distributed. Thus, the most ordered rhombus state in the bulkAlmarza et al. (2014) is observed at , while in the near-wall region at (Fig. 1) that leads to similar distributions of particles among the clusters in both regions. Two orientations of rhomboid clusters in the near-wall region are observed with the edges parallel to the wall.
III.5 Correlation effect
For a detailed analysis, we decided to study the behavior of the correlation functions depending on the distance between the sites of the lattice in the direction parallel to the wall, for several layers at the distance from it.
| (6) |
For small values of , when the density is very low, the density at the surface grows faster with increasing the chemical potential than the density in the bulk, because interaction with the wall makes it favourable to introduce a particle or a cluster at the surface. When the density becomes larger, and the average distance between the clusters at the surface is too small to introduce another cluster without causing a repulsion with the new and the existing clusters, it becomes more favourable to introduce a cluster to the bulk, where the density is smaller. At this value of the chemical potential the correlation function (Fig. 7) in the near-wall row starts to show an oscillatory decay. This short-range ordering of clusters allows to avoid repulsion between some pairs of clusters if the distribution of clusters would be random. No correlation was observed in the positions of particles in the first and fifth rows due to very low density of particles in the third and fourth rows.
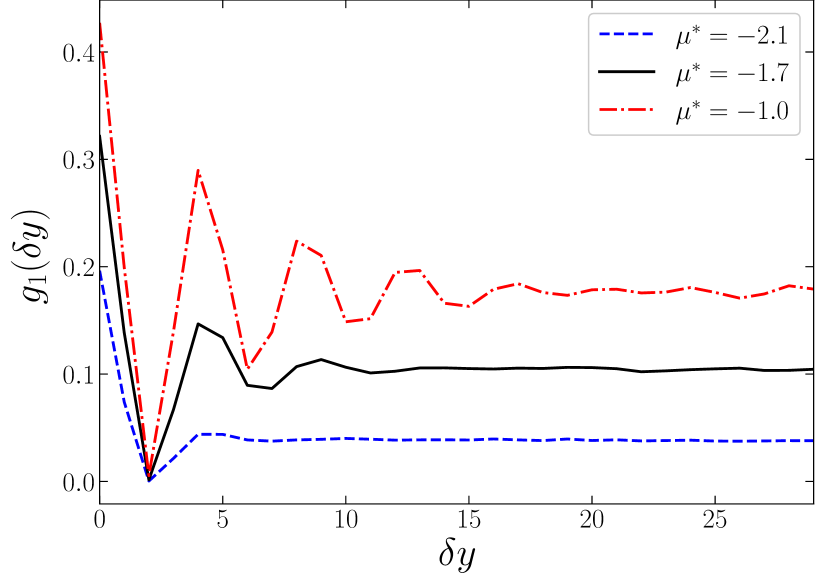
The oscillatory decay of the correlation function in the parallel direction and of the density profile in the perpendicular direction both start when the adsorption begins to decay as a function of . This is consistent with the slower increase of the density at the wall than in the bulk. In the bulk the density is still low enough and the probability that a cluster introduced randomly will be close to existing clusters is low.
Since the density at the surface (rows 1 and 2) grows more slowly, and in the layer next to them (rows 3 and 4) the density attains very small values, the difference between the mean near-wall density and the density in the bulk must decrease. This is an effect of the repulsion between the clusters when the density is relatively large. It leads to the local periodic ordering on the one hand, and to the decreasing adsorption on the other hand.
As a result of which, it can be noted that the attractive surface covered by clusters changes to an efficiently repulsive one: the repulsive barrier in it is formed by adsorbed particlesLitniewski and Ciach (2019), which, due to interaction with each other, have a stronger repulsion at long distances.
IV Summary and Conclusions
The purpose of this work was investigation of the effect of cluster formation on adsorption phenomena. We focused on a monolayer of SALR particles confined by a straight wall. In order to determine general effects common to many SALR systems, we considered a generic model with a phase diagram determined earlier in Ref.Almarza et al. (2014). We assumed that the particles occupied sites of the 2D triangular lattice, and interacted as in the model introduced in Ref. Pȩkalski et al. (2014) (first neighbor attraction and third neighbor repulsion). The wall modeled by a straight line interacted only with the particles in the first row (next to the wall).
We have obtained the adsorption isotherm as a function of the chemical potential, , for a few values of temperature and for different strengths of the wall-particle interaction. In addition, structural characteristics such as cluster size distribution in the bulk and near the wall, density profile in the direction perpendicular to the wall, correlation function in the direction parallel to the wall, density in the first row and in the bulk, and partial adsorption defined in Eq.(5) were computed. All quantities were obtained by MC simulations.
We have found that the shape of the adsorption isotherm is qualitatively different than in simple fluids. In the case of the dilute phase, the adsorption is a nondecreasing function of the chemical potential when the long-range repulsion between the particles is absent. In contrast, if the long-range repulsion is present, the adsorption takes a pronounced maximum for the chemical potential that is significantly smaller than its value at the phase transition (i.e. still in the low-density disordered phase). We have found this characteristic non-standard shape of for all studied temperatures and even in the absence of wall-particle attraction.
Interestingly, all the studied structural characteristics undergo a qualitative change for . When is an increasing function of , the system behavior is dominated by individual particles. Even though clusters are present when exceeds a certain value, the probability of finding an isolated particle is larger than the probability of finding a particle belonging to the optimal cluster (Fig.6). The density in the first row increases faster than the density in the bulk for increasing (Fig.5), but it is still low enough so that the average distance between the particles is larger than the range of the repulsion. No short-range order is present near the wall. In this low-density regime, it is more probable that single particles rather than clusters of particles will be introduced to the system upon increase of . Moreover, with a large probability the new particles will be adsorbed at the attractive wall. Even a neutral wall effectively attracts particles, because the long-range repulsion by the particles at is not compensated due to missing neighbors for .
For , however, the probability of finding an isolated particle is smaller than the probability of finding a particle belonging to the optimal cluster (Fig.6). In this case, we may expect that clusters will be introduced to the system with a larger probability than isolated particles when increases. For this range of , the density in the first row is larger, and the average distance between the clusters is significantly smaller than in the bulk. For this reason the long-range repulsion can be more easily avoided when a new cluster is introduced to the bulk, rather than to the near-surface region. As a result, the density in the bulk grows faster than at the wall, and the adsorption decreases for increasing . Moreover, to avoid the repulsion between the clusters, a short-range order near the wall appears. This short-range order is represented by the oscillatory density and correlation function in the perpendicular and parallel directions, respectively. The density in the layer of clusters at the wall (rows 1 and 2) approaches , and the density in the rows 3 and 4 approaches when (Fig5). This empty layer gives a negative contribution to the adsorption, and shows that an attractive surface covered by the clusters of the SALR particles becomes effectively repulsive. A similar depletion zone was observed in a 3D system Litniewski and Ciach (2019). We expect the remaining anomalies to hold in 3D as well. However, due to a repulsive barrier between the adsorbed particles and the bulk, it can be tricky to study and would require nontrivial sampling methods.
It would be interesting to verify our predictions experimentally. The maximum of could serve as an indication of a crossover between monomer- and cluster-dominated fluid, and of appearance of short-range order near the system boundary.
V Acknowledgements
This project has received funding from the European Union’s Horizon 2020 research and innovation program under the Marie Skłodowska-Curie grant agreement No 734276. Additional support in the years 2017–2020 has been granted for the CONIN project by the Polish Ministry of Science and Higher Education (agreement no. 3854/H2020/17/2018/2). Financial support from the National Science Center under Grant No. 2015/19/B/ST3/03122 is also acknowledged.
References
- Roe (1974) R.-J. Roe, J. Chem. Phys. 60, 4192 (1974).
- Dash (1975) J. G. Dash, Films on solid surfaces: the physics and chemistry of physical adsorption (Elsevier, 1975).
- Kreuzer and Gortel (1986) H. Kreuzer and Z. Gortel, 1 (1986).
- Kukushkin and Osipov (1998) S. A. Kukushkin and A. V. Osipov, Physics-Uspekhi 41, 983 (1998).
- Jerome (1991) B. Jerome, Reports on Progress in Physics 54, 391 (1991).
- Patrykiejew et al. (2000) A. Patrykiejew, S. Sokołowski, and K. Binder, Surface science reports 37, 207 (2000).
- Netz and Andelman (2003) R. R. Netz and D. Andelman, Physics reports 380, 1 (2003).
- Bruch et al. (2007) L. W. Bruch, M. W. Cole, and E. Zaremba, Physical adsorption: forces and phenomena (Courier Dover Publications, 2007).
- Rabe et al. (2011) M. Rabe, D. Verdes, and S. Seeger, Advances in colloid and interface science 162, 87 (2011).
- Antelmi et al. (1995) D. Antelmi, P. Kékicheff, and P. Richetti, J. Phys. II France 5, 103 (1995).
- Yu et al. (2006) B. Yu, P. Sun, T. Chen, Q. Jin, D. Ding, B. Li, and A.-C. Shi, Phys. Rev. Lett. 96, 138306 (2006).
- Yu et al. (2008) B. Yu, Q. Jin, D. Ding, B. Li, and A.-C. Shi, Macromolecules 41, 4042 (2008).
- Su et al. (2003) G. Su, Q. Guo, and R. Palmer, Langmuir 19, 9669 (2003).
- Li et al. (2005) J. Li, R. Xing, W. Huang, and Y. Han, Colloids and Surfaces A: Physicochemical and Engineering Aspects 269, 22 (2005).
- Huang et al. (2006) W. Huang, J. Li, C. Luo, J. Zhang, S. Luan, and Y. Han, Colloids and Surfaces 273, 43 (2006).
- Haghgooie et al. (2006) R. Haghgooie, C. Li, and P. S. Doyle, Langmuir 22, 3601 (2006).
- Tasinkevych and Ciach (2001) M. Tasinkevych and A. Ciach, J. Chem. Phys. 115, 8705 (2001).
- Imperio and Reatto (2007) A. Imperio and L. Reatto, Phys. Rev. E 76, 040402 (2007).
- Imperio et al. (2008) A. Imperio, L. Reatto, and S. Zapperi, Phys. Rev. E 78, 021402 (2008).
- Archer (2008) A. J. Archer, Phys. Rev. E 78, 031402 (2008).
- Chi et al. (2011) P. Chi, Z. Wang, B. Li, and A.-C. Shi, Langmuir 27, 11683 (2011).
- Almarza et al. (2016) N. G. Almarza, J. Pȩkalski, and A. Ciach, Soft Matter 12, 7551 (2016).
- Pȩkalski et al. (2019) J. Pȩkalski, E. Bildanau, and A. Ciach, Soft Matter pp. – (2019), URL http://dx.doi.org/10.1039/C9SM01179J.
- Pȩkalski et al. (2014) J. Pȩkalski, P. Rogowski, and A. Ciach, Mol. Phys 113, 1022 (2014).
- Pȩkalski et al. (2014) J. Pȩkalski, A. Ciach., and N. G. Almarza, J. Chem. Phys. 140, 114701 (2014).
- Santos et al. (2017) A. P. Santos, J. Pȩkalski, and A. Z. Panagiotopoulos, Soft Matter 13, 8055 (2017).
- Litniewski and Ciach (2019) M. Litniewski and A. Ciach, J. Chem. Phys. 150, 234702 (2019).
- Zhuang et al. (2016) Y. Zhuang, K. Zhang, and P. Charbonneau, Phys. Rev. Lett. 116, 098301 (2016).
- Royall (2018) P. Royall, Soft matter (2018).
- Zhuang and Charbonneau (2016) Y. Zhuang and P. Charbonneau, J. Phys. Chem. B 120, 7775 (2016).
- Stradner et al. (2004) A. Stradner, H. Sedgwick, F. Cardinaux, W. Poon, S. Egelhaaf, and P. Schurtenberger, Nature 432, 492 (2004).
- Almarza et al. (2014) N. G. Almarza, J. Pȩkalski, and A. Ciach, J. Chem. Phys. 140, 164708 (2014).
- Bomont and Costa (2012) J.-M. Bomont and D. Costa, J. Chem. Phys. 137, 164901 (2012).