RELICS: Spectroscopy of gravitationally-lensed reionization-era analogs and implications for CIII] detections at
Abstract
Recent observations have revealed the presence of strong CIII] emission (EW Å) in galaxies, the origin of which remains unclear. In an effort to understand the nature of these line emitters, we have initiated a survey targeting CIII] emission in gravitationally-lensed reionization era analogs identified in HST imaging of clusters from the RELICS survey. Here we report initial results on four galaxies selected to have low stellar masses (2-8107 M⊙) and J125-band flux excesses indicative of intense [OIII]+H emission (EW[OIII]+Hβ=500-2000 Å), similar to what has been observed at . We detect CIII] emission in three of the four sources, with the CIII] EW reaching values seen in the reionization era (EW Å) in the two sources with the strongest optical line emission (EW Å). We have obtained a Magellan/FIRE near-infrared spectrum of the strongest CIII] emitter in our sample, revealing gas that is both metal poor and highly ionized. Using photoionization models, we are able to simultaneously reproduce the intense CIII] and optical line emission for extremely young (2-3 Myr) and metal poor (0.06-0.08 Z⊙) stellar populations, as would be expected after a substantial upturn in the SFR of a low mass galaxy. The sources in this survey are among the first for which CIII] has been used as the primary means of redshift confirmation. We suggest that it should be possible to extend this approach to with current facilities, using CIII] to measure redshifts of objects with IRAC excesses indicating EW Å, providing a method of spectroscopic confirmation independent of Ly.
keywords:
Galaxy evolution – high-z – lensed–ISM–reionization1 Introduction
Over the past decade, our view of galaxies in the early universe has been revolutionized by deep infrared imaging campaigns conducted with the Hubble Space Telescope (HST). These surveys have led to the discovery of a large photometric sample of galaxies at (e.g. McLure et al. 2013; Bradley et al. 2014; Finkelstein et al. 2015; Bouwens et al. 2015a; Livermore et al. 2017; see Stark 2016 for a review), providing our first window on the sources thought to be responsible for the reionization of intergalactic hydrogen (e.g. Robertson et al. 2013; Bouwens et al. 2015b; Stanway et al. 2016; Finkelstein et al. 2019). Analysis of the broadband spectral energy distributions (SEDs) associated with these galaxies reveals a population of galaxies that are compact and low stellar mass, with large specific star formation rates (sSFR; e.g. Labbé et al. 2013; Stark et al. 2013; González et al. 2014; Salmon et al. 2015; Ono et al. 2013; Curtis-Lake et al. 2016).
The first insights into the emission line properties have emerged from Spitzer/IRAC broadband photometry, revealing significant flux excesses in bandpasses covering rest-optical lines (Ono et al., 2012; Finkelstein et al., 2013; Labbé et al., 2013; Smit et al., 2014, 2015). The amplitude of the flux excess indicates the presence of extremely large equivalent width (EW) rest-frame optical line emission in some individual cases at (EW-2000 Å), as would be expected for galaxies dominated by very young ( Myr) stellar populations. In other galaxies, older stellar populations ( Myr) appear present, and the [OIII] emission lines are less prominent (e.g., Hashimoto et al. 2018; Strait et al. 2019). The typical reionization-era galaxy appears somewhat between these two extremes. Analysis of composite SEDs constructed from galaxies at (Labbé et al., 2013) reveals a stellar population that powers strong [OIII]+H emission (EW Å) but is also old enough (50-200 Myr) to have a small Balmer Break. While the nebular emission implied by the average SED is less intense than in the individual examples noted above, it is still well above the threshold used to define extreme emission line galaxies (EELGs) at lower redshifts (EW Å; Amorín et al. 2014), assuming standard [OIII]/H ratios for EELGs (Tang et al., 2019). While these EELGs are rare at lower redshifts (e.g. Atek et al. 2011; van der Wel et al. 2011), they become more frequent at as large sSFRs become typical (Salmon et al., 2015).
In another few years, our view of these early star forming sources will be advanced by the spectroscopic capabilities on the James Webb Space Telescope (JWST), providing our first chance to study the nature of the massive stars and the metallicity of the ionized gas in the reionization era. A preview of the type of spectra that JWST is likely to observe at has recently emerged, revealing nebular emission line properties very different from what is common at lower redshifts. Strong CIII] emission has been identified in galaxies at (Stark et al., 2015a), z=7.51 (Hutchison et al., 2019), and (Stark et al., 2017). The rest-frame CIII] EW is greater than 20 Å in two of the three galaxies, more than an order of magnitude greater than what is seen typically at (e.g. Shapley et al. 2003; Du et al. 2017; Du et al. 2018; Steidel et al. 2016; Le Fèvre et al. 2019). Strong nebular CIV emission has been detected in two low mass galaxies (Stark et al., 2015b; Mainali et al., 2017; Schmidt et al., 2017), pointing to a hard ionizing spectrum that is usually associated with active galactic nuclei (AGNs) in galaxies at lower redshifts (Hainline et al., 2011; Le Fèvre et al., 2019). Most recently, the nebular NV emission line has been reported in several additional galaxies (Hu et al., 2017; Tilvi et al., 2016; Laporte et al., 2017; Mainali et al., 2018), requiring an intense radiation field with significant flux of photons more energetic than 77 eV. Many of these sources have IRAC colors that are suggestive of extreme optical line emission (EW-2000 Å), larger than the typical values inferred at .
The origin of the strong UV nebular line emission that we are seeing in galaxies remains unclear. While the detection of nebular NV likely points to AGN activity, the powering mechanism of the intense ( Å) CIII] emission is still a matter of debate in the literature. Stark et al. (2017) investigated the spectral properties of the CIII] emitter using BEAGLE (Chevallard & Charlot, 2016), a flexible tool for modeling stellar and nebular emission in a consistent manner. With the latest version of the Bruzual & Charlot (2003) population synthesis code (Charlot & Bruzual 2019, in prep) as the input radiation field, they found that the SED and CIII] emission could be reproduced by models with the hard ionizing spectrum of a metal poor ( Z⊙) stellar population. Similar results were found in Stark et al. (2015a) when fitting the spectrum of the CIII] emitter described above. A different picture emerges from Nakajima et al. (2018). They explore the range of UV nebular line spectra that can be powered by stellar populations, considering both single star models using POPSTAR models (Mollá et al., 2009) and binary star models using BPASS (v2, Stanway et al. 2016). Their results show that stellar photoionization is unlikely to power CIII] emission with Å, only reaching such large values when C/O ratios are elevated above the solar abundance ratio, or if the stellar population is hotter than predicted by models as might be expected for an extremely top-heavy IMF. As these cases are not likely to be the norm, they suggest that CIII] emitters with Å are more likely explained by an ionizing spectrum from a mixture of young massive stars and AGN.
The tension between these two interpretations highlights the challenges we are soon to face once JWST begins collecting large spectroscopic samples at . The problem largely reflects how little we know about the extreme UV (EUV) radiation field powered by low metallicity massive stellar populations in high redshift galaxies. Current population synthesis models make different predictions for the shape of the EUV radiation field at low metallicity, making it difficult to link the observed nebular line detections to a unique physical picture. If not addressed prior to the launch of JWST, there are bound to be large systematic uncertainties in the physical properties derived from spectra at .
Motivated by this shortcoming, attention has begun to focus on characterizing the rest-UV spectra of star forming galaxies at (e.g. Erb et al. 2010; Stark et al. 2014; Rigby et al. 2015; Du et al. 2017; Le Fèvre et al. 2019; Amorín et al. 2017) and at (e.g., Berg et al. 2016, 2018; Senchyna et al. 2017; Senchyna et al. 2019). These studies have demonstrated that prominent metal line emission does appear in star forming galaxies, provided they are both low metallicity and have a stellar population weighted toward very young ages. The latter trend is clearly seen in the relationship between CIII] EW and [OIII] EW. In spite of the strong CIII] emission, many of the metal poor line emitters are found to have sub-solar C/O ratios (Erb et al., 2010; Berg et al., 2016, 2018). These observations can be collectively explained by photoionization models (e.g. Gutkin et al. 2016; Jaskot & Ravindranath 2016; Feltre et al. 2016; Byler et al. 2018), with intense UV metal line emission requiring the hard radiation field from young low metallicity stars and the high electron temperature (Te) associated with metal poor gas.
Of particular interest is the nature of sources with extremely intense CIII] emission (EW Å), matching the values seen in the first samples at . At intermediate redshifts (), there are a small number of galaxies above this threshold (Le Fèvre et al., 2019; Amorín et al., 2017), but they appear very different from the galaxies described above, with signatures of low luminosity AGN or atypically large C/O ratios. These results are fully consistent with the picture put forward in Nakajima et al. (2018), whereby the stellar radiation field is in most cases incapable of powering the intense line emission we are now observing at . If true, this would imply that low luminosity AGN or large C/O ratios are present among reionization-era spectroscopic samples.
However such conclusions remain premature as our current census of star forming galaxies is incomplete. While many metal poor galaxies have been targeted with rest-UV spectroscopy, most lack the extreme optical line emission (EW Å) which appears associated with the UV line emitters at . The extremely young stellar populations (1-5 Myr) probed by these galaxies should produce a very intense EUV ionizing spectrum (Tang et al., 2019), yet little is known about the rest-UV spectra that they power. To address this issue, we have initiated a campaign which aims to characterize the range of CIII] EWs powered by metal poor galaxies with large EW optical line emission. In order to efficiently identify EELGs, we apply well-established color selection techniques (van der Wel et al., 2011; Maseda et al., 2014) to pick out galaxies with flux excesses in the J125-band from strong [OIII]+H emission. To ensure our sample preferentially consists of metal poor systems, we focus our search on gravitationally lensed galaxies with blue UV colors and low masses in the Reionization Lensing Cluster Survey (RELICS) fields (Coe et al., 2019). The combination of depth and volume probed by RELICS makes it ideal for building samples of low mass sources with apparent magnitudes bright enough for ground-based spectroscopy. In this paper, we present rest-UV spectra of four lensed EELGs (including two with EW Å), allowing us to test whether the upper bound of the CIII] EW distribution in star forming galaxies extends to EW Å. We have obtained a rest-optical spectrum for the most extreme UV line emitter, allowing us to investigate the origin of the line emission in more detail.
This paper is organized into the following sections. We describe our photometric selection method and spectroscopic observations in §2. We then discuss the results of our spectroscopic observations in §3 and describe the ionized gas conditions and stellar population properties implied by the spectra in §4. We then discuss implications for reionization-era studies in §5 and close with a brief summary in §6. Throughout the paper, we adopt a -dominated, flat universe with , and . We use solar oxygen abundance of 12+log(O/H)⊙=8.69 (Asplund et al., 2009). We quote magnitudes in the AB system and equivalent widths in the rest-frame.


2 Spectroscopic Observations
2.1 Selection of EELGs in RELICS fields
Our goal is to characterize the range of rest-UV spectra seen in galaxies with moderately low metallicities and extreme EW optical line emission. Recent studies have focused on EELGs in the CANDELS fields (e.g., Maseda et al. 2014; Tang et al. 2019). Here we seek to extend these efforts to lower mass and hence lower metallicity EELGs. We thus focus our search on gravitationally lensed galaxies in the 41 cluster fields imaged by HST as part of the RELICS program (GO-14096;Coe et al. 2019). The volume covered by this large dataset is ideal for identifying highly-magnified objects that are bright enough for ground-based spectroscopy (m.
We first use HST imaging data to photometrically select our sample. The RELICS program provides HST/WFC3 infrared imaging data in four filters (F105W, F125W, F140W, and F160W filters) in all 41 clusters. For those clusters lacking existing archival ACS imaging, RELICS also provides HST/ACS optical imaging in F435W, F606W, and F814W filters (see Coe et al. 2019 for details). In addition to RELICS program, the data used in this paper comes from the online HST archive: GO-12477 (F. High), GO-12755 (J. Hughes), GO-9722 (H. Ebeling), GO-10493 (A. Gal-Yam), GO-10793 (A. Gal-Yam), GO-14165 (S. Seitz). We then make use of the publicly-available photometric catalog prepared by the RELICS team based on detection images in a weighted sum of ACS and WFC3 images111https://archive.stsci.edu/prepds/relics/.
To efficiently select EELGs in the RELICS fields, we make use of well-established color selection criteria which identify the presence of strong [OIII]+H emission in galaxies at (van der Wel et al., 2011; Maseda et al., 2014; Tang et al., 2019). At these redshifts, both lines are situated in the J125-band (F125W). Galaxies with large EW [OIII]+H emission are easily identifiable by the large flux excess that appears in the J125-band relative to the adjacent I814 (F814W) and H160 (F160W) bands. We follow the color cuts used in van der Wel et al. (2011), selecting sources with and where refers to the uncertainty in the color. The amplitude of the J125-band excess can be directly related to the rest-frame equivalent width given by
| (1) |
where W is the effective width of the J125 filter, ftotal is the flux density fν in the J125 filter, and fcont is the average flux density in the I814 and H160 filters. The color cuts described above thus select sources with rest-frame [OIII]+H EW 500 Å.
We apply the EELG selection criteria in all 41 RELICS clusters, utilizing the broadband fluxes from the publicly-available photometric catalog prepared by the RELICS team. Most cluster fields have 1-2 EELGs with typical apparent magnitude of in the I814 band. We focus spectroscopic follow-up on sources that have bright continuum magnitudes (<25.5) and large J125-band excesses implying extremely intense optical line emission.
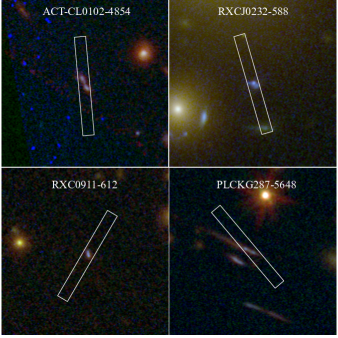
In this paper, we present observations of four lensed EELGs from the parent sample with 600 Å [OIII]+H EW 2000 Å. HST imaging postage stamps are shown in Fig. 1, revealing the very compact sizes of each of the four sources. The impact of [OIII]+H emission on the J125-band is clearly visible in the spectral energy distributions (SEDs) shown in Fig. 2. We provide details of the four sources in Table 1 and discuss each individually below. The magnification provided by the cluster is calculated from lens models prepared by the RELICS team and available to the public.1 Further details on the lens modeling procedure have been presented in recent RELICS papers (Cerny et al., 2018; Paterno-Mahler et al., 2018; Cibirka et al., 2018; Acebron et al., 2018). In calculating the magnification and the absolute magnitude, we assume the confirmed spectroscopic redshift presented in §3.
RXCJ0232-588 is a compact (re=), blue () galaxy with a pronounced J125-band flux excess (Fig. 2) indicative of strong rest-optical nebular emission (EW[OIII]+Hβ=1990200 Å). Its apparent optical magnitude is the brightest in our sample (I814=23.6), making it an ideal target for spectroscopy. The RXCJ0232.2-4420 lens model indicates a magnification factor of . After correcting for magnification, we calculate an absolute UV magnitude of M.
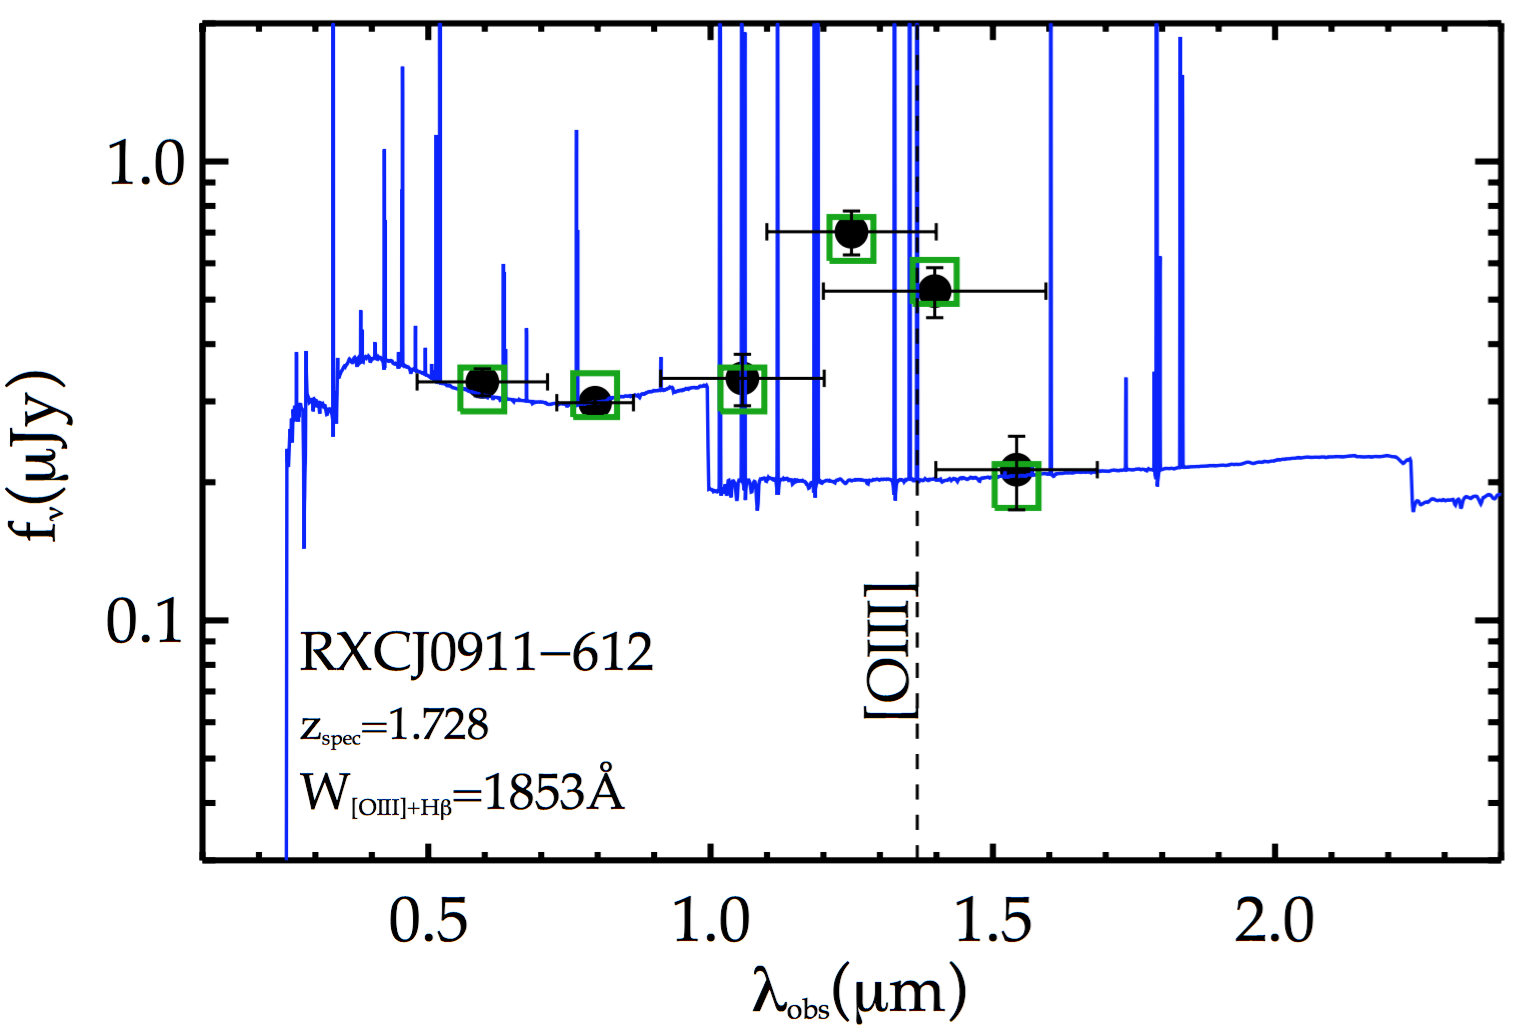
RXCJ0911-612 is a bright (I814=25.2) compact galaxy (re=) with a prominent -band flux excess (Fig. 2), indicating extremely strong optical line emission ([OIII]+H EW = 1850170 Å). Based on the lens model for RXCJ0911.1+1746, we estimate that the cluster has magnified this object by a factor of . After correcting for the magnification, we find that RXCJ0911-612 has an absolute magnitude of MUV=-.
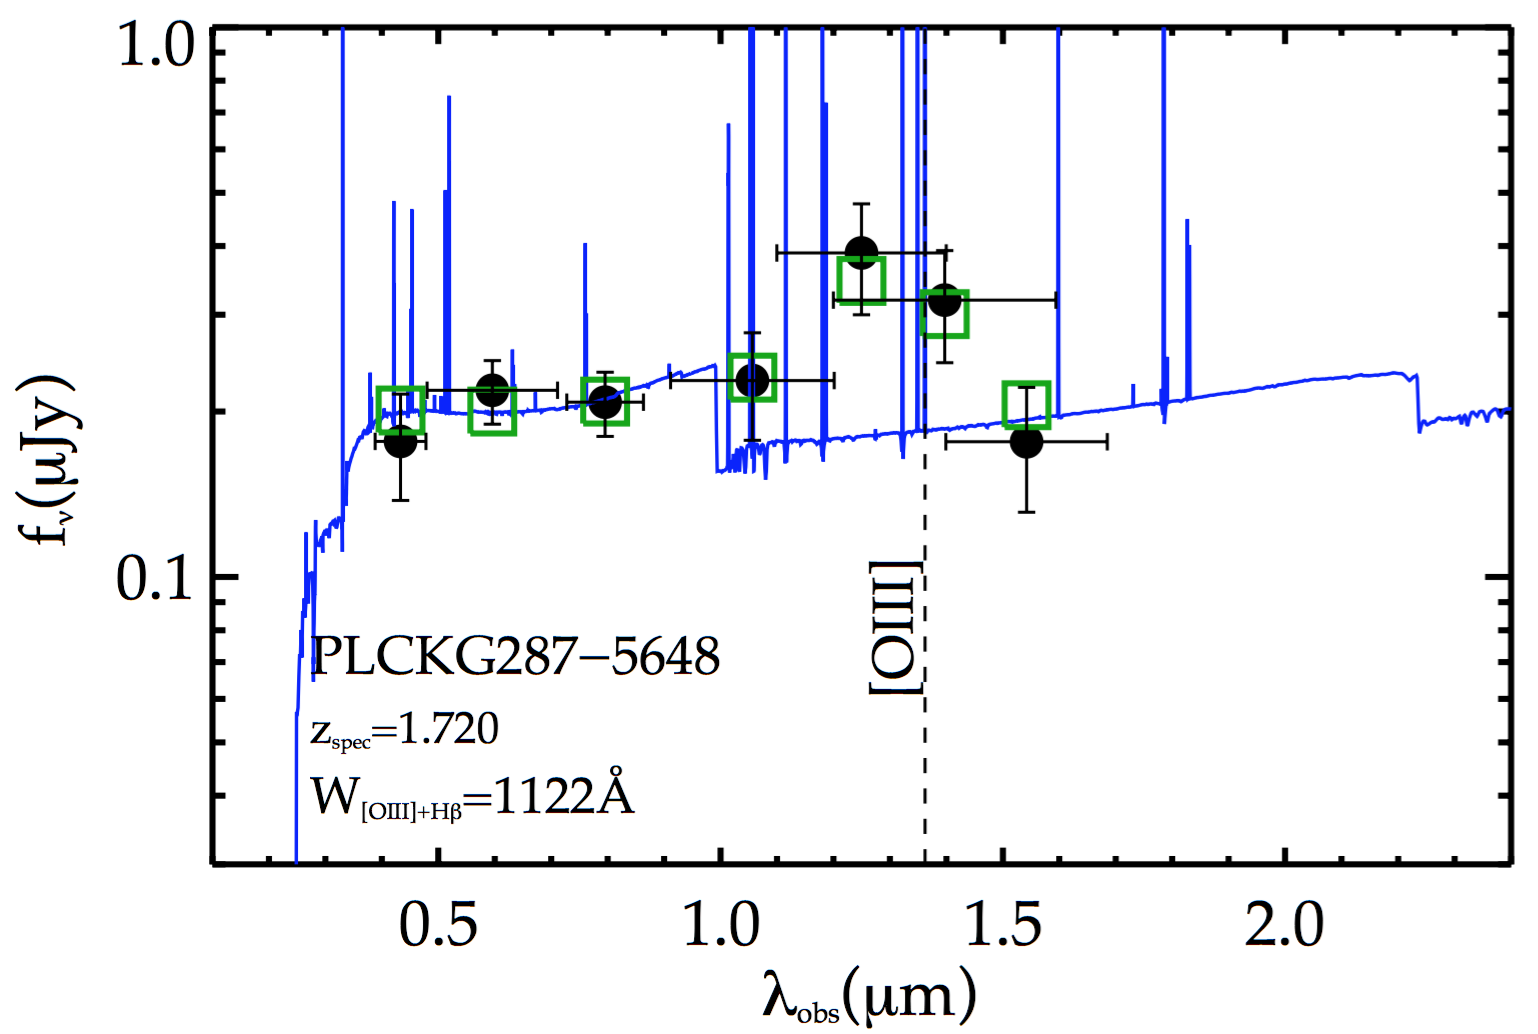
PLCKG287-5648 was previously identified as a multiply-imaged system by Zitrin et al. (2017) (ID number 2 in their paper). Among the three images, only 2.3 has near-infrared imaging coverage necessary for the EELG color selection. The source is relatively bright (I814=24.4), has a blue UV slope (), and shows a slightly extended arc-like structure in the HST images (Fig. 1). The -band flux excess is evident in the SED (Fig. 2), implying an [OIII]+H EW of 1120150 Å. Using the cluster lens model, we find that the galaxy is magnified by a factor of . After correcting for this factor, we derive an absolute magnitude of MUV=-, more than an order of magnitude less than M at (e.g., Alavi et al. 2016).
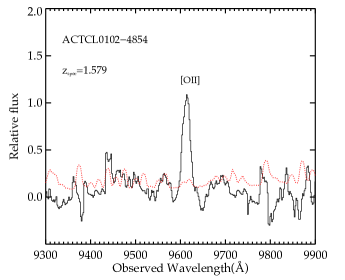
ACTCL0102-4854 is the second brightest source in our sample (I814=24.8) but has a less pronounced -band flux excess than the three sources discussed above. While still an EELG, its optical line EW is the weakest in our spectroscopic sample (EW[OIII]+Hβ=620220 Å). The source shows a slightly elongated structure (Fig. 1) with a blue UV slope (). We compute a magnification factor of using the RELICS lens model for ACT-CL0102-49141. Applying this magnification factor to the apparent magnitude, we compute an absolute UV magnitude of MUV=-, making ACTCL0102-4854 the most luminous object in our sample.
| Cluster | ID | RA | DEC | I814 | UV slope () | EW[OIII]+Hβ (Å) | Magnification factor () | |
|---|---|---|---|---|---|---|---|---|
| ACT-CL0102-49151 | 4854 | 1.579 | 01:03:04.619 | -49:17:04.62 | 24.2 | -1.9 | 620220 Å | |
| RXCJ0232.2-4420 | 588 | 1.645 | 02:32:16.124 | -44:20:55.72 | 23.6 | -2.3 | 1990200 Å | |
| PLCK G287.0+32.9 | 5648 | 1.720 | 11:50:52.800 | -28:06:03.24 | 24.4 | -1.9 | 1120150 Å | |
| RXCJ0911.1+1746 | 612 | 1.727 | 09:11:09.912 | 17:46:54.84 | 25.2 | -2.2 | 1850170 Å |
2.2 Optical spectroscopy
| Cluster | Cluster | Mask | Mask Center | Instrument | Dates | PA | ||
|---|---|---|---|---|---|---|---|---|
| redshift | RA | DEC | (deg) | (ks) | ||||
| RXCJ0232.2-4420 | 0.2836 | rxc0232 | 02:32:17.683 | -44:20:35.67 | LDSS3 | 2016 Nov 27 | 196 | 7.2 |
| RXCJ0911.1+1746 | 0.5049 | rxc0911 | 09:10:56.692 | 17:49:06.94 | IMACS | 2019 Mar 6-7 | -30 | 20.4 |
| PLCK G287.0+32.9 | 0.3900 | p287 | 11:51:04.021 | -28:04:56.58 | IMACS | 2019 Mar 6-7 | 40 | 13.2 |
| ACT-CL0102-49151 | 0.8700 | elgordo | 01:02:58.980 | -49:16:01.52 | LDSS3 | 2016 Aug 2 | 185 | 7.2 |
The four EELGs described above were observed over three Magellan observing runs between 2016 and 2019. For the first two observing runs, we used the Low Dispersion Survey Spectrograph 3 (LDSS3) spectrograph on the Magellan Clay telescope, targeting the cluster fields with ACTCL0102-4854 and RXCJ0232-588. These observing runs formed part of a larger spectroscopic survey of lensed galaxies in the RELICS fields using University of Michigan and University of Arizona time allocation that we will present in a future paper (Mainali et al. 2019, in prep). In our most recent run, we used the Inamori-Magellan Areal Camera and Spectrograph (IMACS; Dressler et al. 2011) on the Magellan Baade telescope to target the fields with RXCJ0911-612 and PLCKG287-5648. Below we first describe the LDSS3 observations and reduction, then detail the same for IMACS. Details of the observing setup are provided in Table 2.
We utilize LDSS3 in multi-object mode, designing two masks targeting the ACTCL0102 and RXCJ0232 fields. In addition to the EELGs discussed in §2.1, we include other gravitationally-lensed systems and cluster members. Slit widths were set to 10, while the typical slit lengths were 60. We used the VPH-ALL grism (400 lines mm-1) with no order blocking filter, providing continuous spectral coverage from 4000 Å to 10000 Å with a spectral resolution of 7.7 Å. This setup allows us to detect CIII] throughout the redshift range selected by our color selection. For sources at , we should also be able to confirm redshifts by detection of the [OII] doublet. We observed the ACT-CL0102 field on 2016 Aug 02 and the RXCJ0232 field on 2016 Nov 27. Both masks were observed for 2 hours with typical seeing of .
The LDSS3 data were reduced using the publicly available Carnegie Observatories System for MultiObject Spectroscopy (COSMOS) pipeline.222http://code.obs.carnegiescience.edu/cosmos We obtained bias fields during each afternoon prior to observations. Flat fields were obtained using quartz lamps, and arcs were observed using HeNeAr lamps. Both flat fields and arcs were taken during the nights prior to observing each field. The pipeline performs bias subtraction, flat-fielding, and a wavelength calibration using the comparison arcs. The wavelength solutions have typical rms of 1.5 Å. The pipeline does sky subtraction using the optimal method from Kelson (2003) before outputting the final 2D spectra. Finally, the 1D spectrum is produced using a boxcar extraction with an aperture of 11 (6 pixels). The final 1D error spectrum is extracted from the output 2D error spectrum generated by the pipeline. We observed a standard star to compute instrumental response across the detector. The absolute flux calibration is then obtained from the known continuum magnitudes of several slit stars that are placed on our masks. The LDSS3 spectra provide a median line flux limit (3) of 1.310-17 erg cm-2 s-1 in the wavelength range 5000-6000 Å. This flux limit provides rest-frame equivalent width limits (3) as low as 3-5 Å for CIII] over the same wavelength range.
We observed the PLCK G287 and RXCJ0911 fields using IMACS in multi-object mode. As with the LDSS3 observations, we designed slitmasks that include a mixture of the EELGs, candidate lensed galaxies, and cluster galaxy members. For the PLCK G287 mask, we also placed a slit on one of the other images of EELG PLCKG287-5648 (source 2.2 using the Zitrin et al. 2017 nomenclature). We used the 300 lines/mm grating blazed at an angle of 17.5∘ with the f/2 camera. The grating is optimized to provide wavelength coverage from 3900 Å to 8000 Å, covering CIII] and other UV metal lines in the expected wavelength range. We used a slit width of 10 that provided a spectral resolution of 6.7 Å.
Both masks were observed on 2019 March 6-7. Conditions were clear throughout the observations with an average seeing of 07. Because of the fainter continuum magnitudes of the EELGs in these fields, we obtained longer exposure times (3.5-5.5 hr) in order to reach sufficient depth to detect emission lines with rest-frame equivalent widths as low as 3-5 Å. The data were reduced using the same pipeline and procedure as described above. Similar to the LDSS3 spectra, the absolute calibration is performed using continuum magnitudes of slit stars placed on our masks. We reached median line flux sensitivities (3) of 7.210-18 erg cm-2 s-1 (RXCJ0911-612) and 9.610-18 erg cm-2 s-1 (PLCK G287-5648) in the wavelength range (5000-6000 Å) where CIII] is situated, enabling constraints to be placed on lines with rest-equivalent widths as low as 5 Å.

2.3 Near Infrared Spectroscopy of RXCJ0232-588
We recently initiated near-infrared spectroscopic follow-up of the EELGs, targeting RXCJ0232-588 with Folded-port InfraRed Echellette (FIRE; Simcoe et al. 2013) on the Magellan Baade telescope. Spectra in the near-infrared are required to detect strong rest-optical nebular lines (i.e., [OII], H, [OIII], H) which constrain the physical conditions of the ionized gas, allowing us to better understand the properties most important for regulating the strength of the UV metal lines. Observations were obtained on 2018 September 02. FIRE was operated in echelle mode, providing spectral coverage between 0.82 and 2.51 m. The observations were carried out using a slit width of 10, resulting in a resolving power of R=3600. RXCJ0232-588 was observed for a total on-source integration time of 3 hours. Throughout the observations, the conditions were excellent with an average seeing of 05.
The spectrum of RXCJ0232-588 was reduced using standard routines in the FIREHOSE data reduction pipeline333wikis.mit.edu/confluence/display/FIRE/FIRE+Data+Reduction. The pipeline uses lamp and sky flats for flat fielding. Two dimensional sky models are then iteratively calculated following Kelson (2003). The wavelength solutions are provided by fitting OH skylines in the spectra. Flux calibration and telluric corrections to the data are applied using A0V star observations. Finally, we the 1D spectrum was extracted using a boxcar with aperture of 09 (15 pixels).
3 Results
Here we present the results from our spectroscopic observations of lensed EELGs. In all cases, the spectra confirm the redshifts to lie in the range () predicted by the J125-band excess. We first present redshift measurements and constraints on CIII] and other UV lines (§3.1) before discussing the rest-optical lines detected in the FIRE spectrum of RXCJ0232-588 (§3.2).
3.1 Rest-UV Spectra: Probing CIII] Emission in EELGs
3.1.1 RXCJ0232-588 (EW[OIII]+Hβ=1990 Å)
The LDSS3 spectrum of RXCJ0232-588 covers rest-frame wavelengths between 1654(1523) and 3891(3584) Å assuming the extrema of the redshift range predicted by the J-band excess, . The spectrum shows four emission lines at 4406.6 Å, 4980.1 Å, 5046.3 Å and 9861.2 Å together with a continuum trace between 4200 and 9200 Å (Fig. 3). We derive a redshift solution of with the lines corresponding to OIII]1666, Si III]1883, and the blended CIII]1908 and [OII]3728 doublets. We also identify a tentative detection (S/N=1.9) at 5004.1 Å. This corresponds to the location of Si III]1892 component (Fig. 3). We do not see emission from OIII]1661. The upper limit on the non-detection implies OIII] doublet ratio of 1666:16611 (at 3). This limit is fully consistent with the observed doublet ratio in similar galaxies (e.g., Erb et al. 2010; Stark et al. 2014; Berg et al. 2019).
We measure line fluxes of each emission feature by directly integrating fluxes after subtracting continuum near each line. We then correct for the small aperture losses via methods described in previous papers (e.g., Stark et al. 2014). Briefly, we convolve the HST image with the ground-based seeing and calculate the fraction of the object falling on the slit. We then do the same for the slit star that was used to compute the absolute flux calibration. The ratio of the object and star slit losses gives the factor by which we must correct our measured line fluxes, accounting for the spatial extent of the sources. In the galaxies considered in this paper, the sizes are sufficiently compact that this correction factor is negligible. In the case of RXCJ0232-588, we derive a very small correction factor of 1.05, consistent with its compact nature. We finally compute the equivalent widths, dividing the emission line fluxes by the continuum flux level near the line of interest. The continuum is derived from the spectrum when it is detected confidently (S/N10) in a window of 200 Å surrounding the emission line in question. In cases where the continuum is not detected at the desired wavelength, we use the value implied by the best-fit population synthesis model (see §4.2).
The rest-UV line measurements of RXCJ0232-588 are presented in Table 3. It is clear from the Table that this source is one of the most extreme UV line emitters known outside the reionization era. In particular, the spectrum clearly shows a strong CIII] emission feature with EWCIII]=21.72.8 Å. This is larger than the 20 Å threshold that has been suggested is a signpost for photoionization from AGN or super-solar C/O ratios (Nakajima et al., 2018), although we note that the EW uncertainty is such that this source could have a CIII] EW just below 20 Å. As we will show in §5, RXCJ0232-588 is consistent with an extension of the relationship between CIII] and [OIII] EW derived from a compilation of sources in the literature, with the largest CIII] strengths seen in galaxies with the most extreme optical line emission. The other detected UV lines are also very strong (EW Å and EW Å), with values among the largest seen in metal poor star forming galaxies (e.g., Vanzella et al. 2016a, 2017; Senchyna et al. 2017; Berg et al. 2018, 2019). The blended [OII] doublet is detected with EW Å, similar to the strengths seen in other EELGs (Tang et al., 2019). We will present the rest-optical spectrum of this source in §3.2, providing a more detailed picture of the physical conditions of the nebular gas, a topic we will come back to in §4.1.
3.1.2 RXCJ0911-612 (EW[OIII]+Hβ=1850 Å)

The optical spectrum of RXCJ0911-612 spans 1556(1434) Å to 3502(3226) Å in the rest-frame, corresponding to the extrema of the redshift range predicted by the J-band excess, . In this wavelength window, we expect CIII] to be our best probe of the redshift. Over the redshift range predicted by the J125-band excess, CIII] is expected to be situated at observed wavelengths between 4903 Å and 5322 Å. We scan this wavelength window for lines and detect a confident (S/N=6.6) emission feature at 5204.4 Å (Fig. 4). We identify this as the blended CIII] doublet at a redshift of . To calculate this redshift, we assume a rest-frame wavelength of 1907.709 Å for the unresolved doublet (see Erb et al. 2010). We detect no other confident (>5) emission features throughout the spectrum, consistent with expectations that CIII] should be the brightest line in this portion of the spectrum.
We measure the flux and upper limits of emission lines using the same procedure described above. The integrated flux of the combined CIII] doublet is 1.70.310-17 erg cm-2 s-1. The aperture correction relative to the slit star is again very small (1.08), not surprising given the compact size of RXCJ0911-612. Using the continuum measured from the SED, we compute the rest-frame EW of CIII] and place upper limits on the other lines. Similar to RXCJ0232-588, we find a value (EWCIII]=16.93.2 Å) that is similar to what has been seen at . Our measurements are presented in Table 3.
3.1.3 PLCKG287-5648 (EW[OIII]+Hβ=1120 Å)
The IMACS spectrum of PLCKG287-5648 covers the same rest-wavelength window as for RXCJ0911-612. We expect CIII] emission to be the strongest line in the spectrum. We search for line emission in the observed wavelength window where CIII] is expected to lie (4903 Å to 5322 Å). As shown in Fig. 5 (right panel, blue), we detect a 3.2 emission feature at an observed wavelength of 5189.8 Å. If this is indeed CIII], we should see emission at the same wavelength in PLCKG287-5404, another lensed image of the same galaxy (see discussion in §2.1). As is apparent in Fig. 5 (right panel, green), an emission line is seen at the same wavelength in the second image. By median stacking the two spectra (Fig. 5, left panel), we detect the emission feature at higher significance (S/N=4.6). We classify the detected feature as CIII] emission at a redshift of , consistent with the redshift range implied by the strong J125-band excess. We do not detect any other emission lines in the IMACS spectrum, as expected given the faint continuum of this EELG.
Following the same procedures we have described above, we measure a flux of 9.12.010-18 erg cm-2 s-1 for the CIII] line in the stacked spectrum. After making a small correction (1.21) for slit losses (relative to the slit star used for flux calibration), we compute the rest-frame EW. For this source, we use the continuum derived from the SED. The resulting value (EWCIII]=4.81.1 Å) is considerably lower than in the EELGs described above with more intense [OIII] emission. Looking at the relationship between CIII] and [OIII]+H EW (see §5), we see that the measured CIII] strength in PLCKG287-5648 is lower than most sources with EW Å). Further follow-up in the near-infrared should help clarify the origin of the scatter in this relationship.
3.1.4 ACTCL0102-4854 (EW[OIII]+Hβ=620 Å)
| Object | Line | Flux | EW | ||
| (Å) | (Å) | ( erg ) | (Å) | ||
| RXCJ0232-588 | OIII] | 1666.15 | 4406.6 | ||
| Si III] | 1882.71 | 4980.1 | |||
| Si III] | 1892.03 | 5004.1 | |||
| CIII] | 1907.71 | 5046.3 | |||
| 3728.6 | 9861.2 | ||||
| PLCKG287-5648 | CIV | 1549 | … | <1.2 | <6.6 |
| He II | 1640.42 | … | <1.1 | <5.5 | |
| OIII] | 1666.15 | … | <1.1 | <5.5 | |
| CIII] | 1907.71 | 5189.8 | |||
| RXCJ0911-612 | CIV | 1549 | … | <0.8 | <5.9 |
| He II | 1640.42 | … | <0.7 | <7.3 | |
| OIII] | 1666.15 | … | <0.7 | <7.3 | |
| CIII] | 1907.71 | 5204.4 | |||
| ACTCL0102-4854 | CIII] | 1907.71 | … | <1.1 | <4.0 |
| 3728.6 | 9615.4 |
The LDSS3 spectrum of ACTCL0102-4854 covers rest-frame wavelengths between 1654(1523) and 3891(3584) Å, assuming the extrema of the redshift range predicted by the J-band excess, . We first scan for lines in the observed wavelength range where [OII] is expected (9583 to 10402 Å). A strong emission feature is readily apparent at 9615.4 Å (Fig. 6). This is consistent with a redshift of , assuming a rest-wavelength of 3728.6 Å for the unresolved doublet. This rest-wavelength is calculated assuming a doublet flux ratio consistent with that seen in galaxies (e.g., Sanders et al. 2016). At this redshift, we would expect CIII] to appear at 4920 Å. No emission feature is seen in the vicinity of this wavelength, allowing us to place an upper limit on the line flux. The other rest-UV lines (CIV, He II and OIII]) are all blueward of the LDSS3 spectral coverage, so we cannot put constraints on their strength.
We derive the line flux of [OII] using the same methods as we described for the other three EELGs. The integrated line flux is 4.40.310-17 erg cm-2 s-1. We correct this flux by a very small factor (1.14), accounting for the excess slit losses of ACTCL0102-4854 relative to the stars used for flux calibration. We finally calculate the rest-frame EW, using the continuum predicted near [OII] from the SED model. The resulting value (EW[OII]=59.25.7 Å) is within the range seen in similar strength [OIII] emitters (Tang et al., 2019). The absence of CIII] suggests an upper limit of EW[CIII]=4.0 Å, slightly weaker than average for galaxies with similar EW[OIII]+Hβ. We present line measurements and upper limits in Table 3.
3.2 Rest-optical spectroscopy
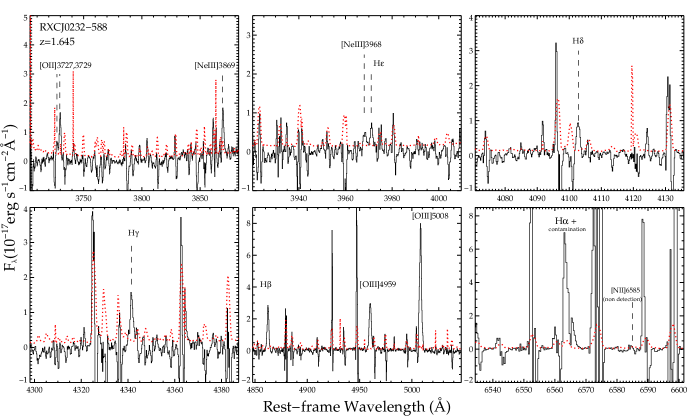
The FIRE spectrum of RXCJ0232-588 reveals ten unique emission features ([OII]3727,3729,, , H, H, H, H, ). Using the wavelength centroid calculated from the highest signal-to-noise nebular lines (H, ), we estimate a redshift of , consistent with the spectroscopic redshift derived from the LDSS3 data. The line widths are narrow (FWHM=106.4 km s-1, corrected for instrumental resolution). To compute line fluxes, we need to establish the absolute flux scale in the FIRE spectrum. Since the [OII] emission line is also detected in our optical spectrum (see §3.1), we can bootstrap the flux calibration of FIRE to that of LDSS3, the latter of which is determined with more confidence owing to the availability of slit stars observed simultaneously with the science spectra. This process takes into account flux calibration uncertainty in both FIRE and LDSS3 data whenever measuring line ratios that involve emission lines from the two spectra.
In Fig. 7, we present the 1D spectrum in the vicinity of the strong rest-frame optical emission lines. The majority of these lines are not significantly affected by skylines, enabling robust measurements of the integrated line flux. We obtain these measurements using the MPFITPEAK routine in IDL, and corresponding errors are calculated using the error spectrum. Looking at the lower right panel in Fig. 7, it is clear that H is coincident with a sky feature. While the line is clearly detected, residuals from the sky subtraction make a reliable flux measurement challenging. We will discuss this further below. Since the stellar continuum is undetected in the FIRE spectrum, we compute equivalent widths using the continuum derived from our best-fit broadband SED models (see Fig. 2 and §4.2). The measurement of line fluxes and corresponding equivalent widths are presented in Table 4.
We characterize the impact of nebular attenuation using the observed flux ratios of the hydrogen Balmer lines. Since H is partially contaminated by a skyline, we consider the ratio of H and H. For case B recombination, no dust, and an electron temperature of 104 K, we expect to see FHγ/FHβ = 0.468 (Osterbrock & Ferland, 2006). The presence of dust will act to decrease this ratio relative to the theoretical value. The observed flux ratio in the FIRE spectrum (FHγ/FHβ=) thus suggests little to no dust attenuation, consistent with the very blue UV continuum slope () seen in the HST imaging (Fig. 2). In the analysis that follows, we assume that the source is not significantly reddened (E(B-V)neb=0.00), similar to other EELGs with similar [OIII] EW (Tang et al., 2019). In our analysis that follows in §4, we thus take the observed line ratios as those intrinsic to the source. Whenever required, we use the H line strength implied by scaling the observed H flux by the theoretical flux ratio (FHα/FHβ=2.86) for case B recombination and 104 K gas (Osterbrock & Ferland, 2006).
The FIRE spectrum confirms the extreme emission lines implied by the photometry, revealing [OIII]5007 with EW=142657Å and H with EW=32523 Å (Table 4). These values place RXCJ0232-588 among the most extreme optical line emitters known at high redshift (e.g., Tang et al. 2019), likely implying a very young stellar population (see §4.2). The spectrum constrains numerous emission line ratios which are sensitive to the abundance and ionization state of the gas. We list and define these in Table 5.
| Line | (Å) | (Å) | / | EW (Å) |
|---|---|---|---|---|
| 3727.13 | 9857.5 | |||
| 3729.92 | 9864.9 | |||
| 3869.66 | 10235.1 | |||
| 3968.2 | 10494.5 | |||
| H | 3970.07 | 10851.3 | ||
| H | 4102.90 | 10851.3 | ||
| H | 4341.58 | 11482.6 | ||
| H | 4862.55 | 12860.5 | 1.00 | |
| 4960.25 | 13118.9 | |||
| 5008.27 | 13245.9 | |||
| 6585 | … |
F(H)=(1.520.04) erg
| Quantity | Value | Notes |
|---|---|---|
| Electron Density Sensitive Line Ratios | ||
| [OII] 3727/3729 | =80 cm-3 | |
| Ionization Sensitive Line Ratios | ||
| O32 | [OIII]4959,5008 /[OII]3727,3729 | |
| Ne3O2 | [NeIII]3869/[OII]3727,3729 | |
| Abundance-Sensitive Line Ratios | ||
| N2 | [NII]6585/H | |
| R23 | ([OIII]4959,5008+[OII]3727,3729)/H | |
| Nebular Oxygen Abundances (Direct Method) | ||
| 12+log(O/H) | Using auroral line OIII]1666 | |
| Nebular Oxygen Abundances (Strong Line Methods) | ||
| 12+log(O/H)R23 | Using Jones et al. (2015) | |
| 12+log(O/H)Ne3O2 | Using Jones et al. (2015) | |
| Inferred Gas Phase Abundance Ratios | ||
| log(C/O) | - | |
4 Analysis
In this section, we explore the properties of the four gravitationally-lensed EELGs described in §3. We first explore the properties of RXCJ0232-588 in detail, leveraging the large number of emission lines that we have detected in our spectra of this source. We then consider the properties of our full sample, as implied by photoionization models. In addition to constraining the gas conditions, these results reveal the population has low stellar masses and young stellar populations, as would be expected for galaxies that have recently undergone a substantial upturn in their star formation.
4.1 Ionized Gas Properties of a Reionization Era Analog with Intense UV Metal Line Emission
We use the emission line spectrum of RXCJ0232-588 to investigate the ionized gas properties of one of the few-known low mass star forming galaxies that powers CIII] as strong as that found at . In addition to constraining the metallicity and ionization conditions of the galaxy, we seek to put this CIII] emitter in a broader context, comparing the observed line ratios to those of more massive and older star forming systems which are far more typical at . We use the insight gained from this analysis to comment on the likely powering mechanism of the CIII] emission.
We first estimate the gas-phase oxygen abundance using the direct electron temperature (Te) method. While we do not detect the [OIII]4363 auroral line, we do secure detection of OIII]1666, another auroral line commonly used to derive Te. We use PyNeb PYTHON package (version 1.1.8; Luridiana et al. 2015) to calculate Te([OIII]) from the observed flux ratio of OIII]1666 and [OIII]5007. We fix the electron density to =80 cm-3, as implied by the [OII] doublet ratio (Table 5). Since the Balmer decrement suggests negligible nebular attenuation (§3.2), we use the observed ratio of OIII]1666 and [OIII]5007 as intrinsic, propagating the errors on the Balmer decrement through to the temperature. With these assumptions, we derive an electron temperature of 165002400 K for the O++ zone. We next calculate Te([OII]) following the relation given in Pérez-Montero (2017) which estimates Te([OII]) using Te([OIII]) and an electron density (). This gives a temperature of Te([OII])=148002100 K for the O+ zone. Using these temperatures in and zones, we calculate and from PyNeb. Combining the two ionic contributions, we calculate an oxygen abundance of 12+log(O/H)=7.600.24 (0.08 Z⊙; Asplund et al. 2009). This is 3.5 lower than the direct method oxygen abundance inferred for galaxies with more typical optical line EWs (e.g., Steidel et al. 2016). We note that the oxygen abundances derived from collisionally excited lines (CELs) are known to be systematically lower than those derived from faint recombination lines (e.g., Peimbert & Peimbert 2002; Esteban et al. 2014), with the latter thought to be a more reliable measure of the true gas-phase metallicity. But regardless of the precise absolute value of O/H, the key point we wish to emphasize is that our data imply that RXCJ0232-588 has a significantly lower gas-phase metallicity than is found in the more massive high redshift star forming galaxies that have been studied in the MOSDEF and KBSS surveys.
We now consider the ionization state of the gas in RXCJ0232-588. This is often parameterized as a dimensionless ionization parameter (U=nγ/nH), the ratio of the density of hydrogen ionizing photons that are incident on the gas and the number density of hydrogen atoms within the gas. The ionization parameter can be constrained observationally by the ratio of emission lines from the same element with different ionization potentials. Most commonly used is the O32 index, defined as the flux ratio of the [OIII] and [OII] doublets. The Ne3O2 index ([Ne III]/[OII]) provides another useful constraint since the Ne/O abundance ratio does not vary substantially with O/H. Over the past several years, the first statistical measures of O32 and Ne3O2 have been obtained at high redshift from the MOSDEF and KBSS surveys (e.g.,Shapley et al. 2015; Sanders et al. 2016; Steidel et al. 2016; Strom et al. 2017), revealing evidence for a significantly higher ionization parameter than is common in local HII regions. The trend in redshift could reflect a combination of lower metallicities, harder ionizing spectra, or changes in the geometry of the nebular gas (see Sanders et al. 2016 for a detailed discussion). However the EELGs we present in this paper are very different from the galaxies in these surveys, with lower stellar masses, large [OIII] EWs, lower metallicities, and a stellar population weighted much more toward very massive stars. Recent work has demonstrated that both O32 and Ne3O2 increase with the [OIII] EW over Å (Tang et al., 2019), implying that the gas in the most extreme line emitters is much more highly ionized than in the typical sources discussed above.
Measurements of the ionization-sensitive ratios in RXCJ0232-588 support this picture, revealing nebular gas that is much more highly ionized than in typical galaxies. The O32 ratio () is 8 larger than the average of the MOSDEF galaxy sample (Sanders et al., 2016) and 5 larger than is found in the composite spectrum from the KBSS survey (Steidel et al., 2016). The Ne3O2 ratio () similarly points to highly-ionized gas, with a value that is 6 larger than is found in the KBSS composite (Steidel et al., 2016). The gas conditions in RXCJ0232-588 instead appear very similar to the EELGs presented in Tang et al. (2019), with values of O32 and Ne3O2 that are fully consistent with objects matched by [OIII] EW. These results suggest a physical picture whereby the ISM in dwarf galaxies is found in a very highly ionized state for a short period following a burst of star formation. Given the frequent association between ionizing photon escape and large O32 (e.g., Vanzella et al. 2016b; de Barros et al. 2016; Izotov et al. 2018; Fletcher et al. 2019), it has been suggested that these bursts may initiate a short window where the ISM is conducive to substantial Lyman Continuum leakage in low mass systems (Tang et al., 2019).
As explained in §1, the C/O ratio of the nebular gas is another critical parameter for regulating CIII] emission line strengths. While metal poor star forming galaxies are often found with sub-solar C/O ratios (Berg et al., 2016, 2019), it has been suggested that solar or super-solar C/O ratios are required to explain the large CIII] EWs that have been detected at if stars are responsible for powering the line emission (e.g., Nakajima et al. 2018). The LDSS spectrum of RXCJ0232-588 allows us to investigate whether this is the case for a system at with EWCIII] similar to what has been seen in the reionization era. We used PyNeb to calculate the ratio of doubly ionized carbon and oxygen from the flux ratios of CIII] and OIII]1666. To calculate the C/O ratio, we must apply an ionization correction factor (ICF) to
| (2) |
The ICF accounts for the possibility that volume fraction of C and O in their respective doubly-ionized states may not be identical. Berg et al. (2019) have calculated the ICF as a function of the ionization parameter using photoionization models from CLOUDY v17.00 (Ferland et al., 2013). They use BPASSv2.14 burst models (Eldridge & Stanway, 2016) with ages ranging between 106 to 107 years and stellar metallicities ranging from 0.05 to 0.40 Z⊙. The gas-phase metallicity is taken to be the same as the stars, and the ionization parameter is allowed to vary in the range To apply this to RXCJ02232-588, we must first calculate the ionization parameter of the nebular gas. To do so, we use the polynomial fitting functions for log U presented in Berg et al. (2019). Taking the average value using the coefficients for the Z=0.05 and 0.10 Z⊙ photoionization models and our measured value of O32, we find , where the error bar corresponds to the scatter between the two metallicity models. For this value of log U, we find an ICF of (see Berg et al. 2019), which implies for the total C/O ratio. This is 0.4 the solar C/O ratio (), consistent with the sub-solar values typically found in metal poor systems in the literature (Garnett et al., 1995; Erb et al., 2010; Christensen et al., 2012; Stark et al., 2014; Berg et al., 2016; Pérez-Montero & Amorín, 2017; Amorín et al., 2017; Senchyna et al., 2017; Berg et al., 2019). This suggests that it is possible to power the intense line emission seen in the reionization-era with sub-solar C/O ratios.
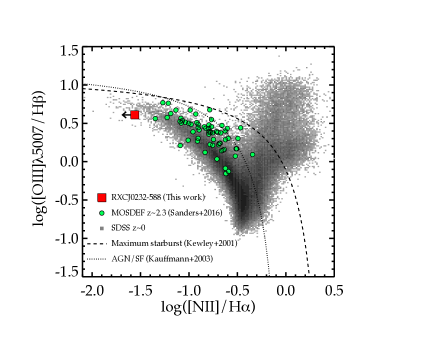
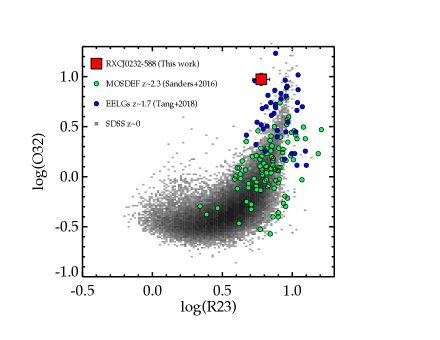
The ionization and excitation conditions of the nebular gas can be further explored through investigation of the RXCJ0232-588 in the [OIII]5007/H versus [NII]6584/H diagnostic diagram (the BPT diagram; Baldwin et al. 1981). The flux ratios of RXCJ0232-588 place it in the upper left of the BPT diagram (Fig. 8), in a region consistent with the lines being powered by metal poor massive stellar populations. The upper limit on N2 (log ([NII]6584/H) ) is indicative of low metallicity gas, as we have shown above. The value of O3 ([OIII]5007/H = ) is very large, consistent with the gas being both highly ionized and elevated in Te. While the O3 measurement is somewhat larger than the average value found in the MOSDEF survey (Fig. 8; Sanders et al. 2016), it is nearly identical to that derived from the composite spectrum of KBSS galaxies (Steidel et al., 2016). While the larger ionization parameter of RXCJ0232-588 shifts it toward larger O3, this effect is counterbalanced by the much lower O/H, resulting in an O3 measurement that is similar to that of the less extreme MOSDEF and KBSS galaxies. Recent investigations of Lyman-alpha emitters within the KBSS survey have also revealed many systems with low values of O3 (Trainor et al., 2016), likely also reflecting very low gas-phase oxygen abundances. The position of RXCJ0232-588 in the O32 vs R23 diagram (Fig. 9) provides further information on the physical state of the gas. As we motivated above, the large O32 of RXCJ0232-588 is consistent with the trend between O32 and [OIII] EW presented in the EELG survey of Tang et al. (2019). But as can be seen in Fig. 9, RXCJ0232-588 has a lower value of R23 () than the majority of galaxies with similarly large O32. This is consistent with RXCJ0232-588 having lower metallicity gas than the bulk of the EELGs from the CANDELS fields in Tang et al. (2019), possibly a result of lensing allowing us to probe lower mass galaxies.
One of the key goals in this paper is to ascertain the powering mechanism of the CIII] emission in RXCJ0232-588. The data presented here reveal that the ionized gas in the galaxy is metal poor, with an SED that is suggestive of a stellar population weighted toward extremely young stars (see §4.2 for model constraints on the age, mass, and sSFR). These properties are very different from CIII] emitters with Å presented in Le Fèvre et al. (2019), with lower masses, much younger stellar populations, and no clear signatures of AGN activity. Given the low metallicity of the ionized gas in RXCJ0232-588, we expect the massive stars in the galaxy are likely to power a hard EUV radiation field capable of powering strong nebular line emission. We note that if the stellar metallicity (effectively set by the abundance of iron and iron peak elements) is lower than implied by the gas-phase oxygen abundance due to a delay in iron production (e.g., Steidel et al. 2016; Strom et al. 2018; Sanders et al. 2019), this conclusion will only be strengthened. Given the young age of the stellar population, we also expect a relatively weak underlying optical continuum. The combination of strong nebular emission and weak continuum provide a natural explanation for the extremely large CIII] EW seen in the LDSS spectrum of RXCJ0232-588.
While massive stars are likely to provide a large source of EUV photons that contribute to the the CIII] intensity in RXCJ0232-588, we currently cannot rule out the presence of other sources of ionization. There could be contribution from a narrow-lined AGN (e.g., Feltre et al. 2016; Volonteri et al. 2017), provided it is low enough metallicity to not shift the galaxy away from the upper left of the BPT diagram (e.g., Groves et al. 2006; Izotov & Thuan 2008; Reines et al. 2013; Feltre et al. 2016). There also could be contribution from fast radiative shocks (e.g., Allen et al. 2008; Jaskot & Ravindranath 2016), but as with the AGN, we would require the gas to be sufficiently low metallicity for consistency with the low [NII]/H ratio (Allen et al., 2008). Constraints on the strength of higher ionization lines in the far-UV (CIV1550, He II1640) should help disentangle whether shocks or AGN make a non-negligible contribution to the EUV output (e.g., Feltre et al. 2016; Jaskot & Ravindranath 2016; Mainali et al. 2017), but all current evidence appears consistent with massive stars dominating the ionizing output. In the following sub-section, we will consider whether photoionization from a stellar population alone can self-consistently explain the CIII] emission and other spectral constraints in our EELG sample. Failure to do so might already point to the need to consider the alternative sources of ionization described above.
4.2 Photoionization modeling
| Object | Stellar Mass | SFR | sSFR | Ionization Parameter | Metallicity | Stellar Age | |
|---|---|---|---|---|---|---|---|
| log(M⋆/M⊙) | (M⊙yr-1) | (Gyr-1) | log(US) | log(Z/) | (Myr) | ||
| RXCJ0232-588 | |||||||
| RXCJ0911-612 | |||||||
| PLCKG287-5648 | |||||||
| ACTCL0102-4854 |
We now investigate the physical properties of the four lensed EELGs in our sample, comparing the observed spectra and photometry to a suite of photoionization models. We make use of the Bayesian galaxy SED modeling and interpreting tool BEAGLE (version 0.20.3; Chevallard & Charlot 2016). BEAGLE is based on photoionization models of star forming galaxies in Gutkin et al. (2016) which combine the latest version of Bruzual & Charlot (2003) stellar population synthesis models with the photoionization code CLOUDY (Ferland et al., 2013) to calculate emission from star and interstellar gas clouds. Our goals in using BEAGLE are twofold. First, we seek to infer bulk stellar population parameters (i.e., stellar mass, sSFR) implied by the broadband SED and emission line properties. Second, in cases where the spectra are sufficiently constraining, we consider the ionized gas properties required by the data and explore whether stellar photoionization is capable of powering the observed CIII] emission.
The models allow us to adjust the interstellar metallicity (ZISM), the ionization parameter of the HII regions (US), here defined at the edge of the Strömgren sphere, and the dust-to-metal ratio (), accounting for the depletion of metals on to dust grains. We consider models with a hydrogen density of nH=100 . We assume a C/O abundance that is 0.52 that of the solar value [(C/O)], although we will also explore how models with solar C/O ratios would impact our findings. Our preferred use of a sub-solar C/O ratio is motivated by results demonstrating that galaxies with 12+log O/H8.0 tend to have C/O ratios that are less than 0.7 that of solar (e.g., Berg et al. 2019). We showed in §4.1 that the UV spectrum of RXCJ0232-588 points toward sub-solar C/O ratios, providing further support for this assumption. We assume a constant star formation history, allowing the maximum stellar age to vary freely between 1 Myr and the age of the Universe at the redshift of the source we are considering. We assume Chabrier (2003) initial mass function and a Calzetti et al. (2000) extinction curve. We consider metallicities in the range of -2.2log(Z/Z)⊙0.25. Similar to our previous work, we assume that the interstellar metallicity is the same as the stellar metallicity (Z⋆=ZISM). The redshift of the models is fixed to the spectroscopically determined values for each source. The ionization parameter and dust-to-metal mass ratio are allowed to vary in the range -4.0-1.0 and =0.1-0.5, respectively.
We fit the broadband photometry and the emission line equivalent widths simultaneously. The broadband SED includes seven HST filters spanning the optical to near-infrared: B435, V606, I814, Y105, J125, JH140, H160. For one of the four EELGs (RXCJ0911-612), the F555W filter replaces B435 and V606. The BEAGLE fits to the photometry and emission-line EWs are overlaid on the SEDs in Fig. 2. The model constraints on the magnification-corrected stellar masses, star formation rates, dust content (), and sSFRs on the four EELGs are given in Table 6. As can be seen in Fig. 2, the models reproduce the broadband SEDs. They are also able to reproduce the rest-UV line measurements, and in the case of RXCJ0232-588, they match the rest-optical emission lines (see Table 7).
The stellar masses of the EELGs are very low, ranging from 1.3107 M⊙ (RXCJ0911-612) to 7.9107 M⊙ (ACTCL0102-4854). The fits suggest that there is little dust attenuation in these systems (), consistent with the blue UV continuum slopes that we observed in the broadband data (§3.1). As expected, we find that the sSFRs are very large and broadly increase with the amplitude of the J125-band excess, ranging from 58 Gyr-1 (ACTCL0102-4854) and 66 Gyr-1 (PLCKG287-5648) to 310 Gyr-1 (RXCJ0232-588) and 490 Gyr -1 (RXCJ0911-612). These sSFRs imply very young mean stellar ages ( Myr) for the assumed constant star formation history. The young stellar age reflects that a recent burst dominates the observed SED and may not necessarily imply absence of faint older stellar populations from a past star formation activity. Under an assumption that the star formation proceeded with a recent burst on top of an evolved stellar population, we found that the stellar age of oldest stars could be several hundred Myr. For instance, in case of RXCJ0232-588 when we assume a recent burst within the last 5 Myr along with the presence of evolved stars (represented by a delayed star formation history), we found that the maximum stellar age could be as high as 260 Myr. We note that the composite stellar population model increases our stellar mass estimates by 0.5 dex, since this takes into account older generation of stars in the galaxy. However, the implied age of the recent burst is still low (1.6 Myr). It is only at these young ages that the ratio of O to A stars is large enough to reproduce the large EW optical line emission. The ages range from 2.0 and 3.3 Myr for RXCJ0911-612 and RXCJ0232-588 to 15 Myr and 17 Myr for PLCKG287-5648 and ACTL0102-4854. At ages of less than 3 Myr, the O star population will not have had time to equilibrate and will be weighted more strongly to the hottest O stars, resulting in a harder EUV spectrum. We thus expect the models that reproduce RXCJ0911-612 and RXCJ0232-588 will have harder ionizing spectra than those of the other EELGs in our sample.
In the case of RXCJ0232-588, the rest-UV and optical spectra have enough emission line detections to enable characterization of the ionized gas properties. For our assumed sub-solar C/O ratio, the implied metallicity is very low (log Z/Z), the dust attenuation is minimal (=0.03), and the ionization parameter is large (log US = -2.06). These parameters are capable of reproducing the optical line ratios and CIII] EW within observational uncertainties (Table 7), and we note that the metallicity implied by the photoionization modeling ( Z⊙) is fully consistent with that implied by the Te analysis in §4.1 ( Z⊙). We also consider models with C/O ratios consistent with the solar value. In this case, the derived properties remain very similar, but the model CIII] EW (29 Å) significantly exceeds the value determined observationally, providing additional support for a sub-solar C/O ratio. We thus find that there are viable sets of parameters (i.e., metallicity, age, ionization parameter) that can reproduce the large CIII] EW of RXCJ0232-588 with stellar photoionization. The BEAGLE modeling procedure suggests that such strong UV metal lines are a natural byproduct of the radiation field and gas conditions associated with an extremely young (3 Myr) and low metallicity (0.06 Z⊙) stellar population, as might expected to appear during a burst of star formation. While we cannot rule out other sources of ionization, the mere detection of CIII] with EW20 Å should not necessarily imply the presence of AGN.
For RXCJ0911-612, we do not have a rest-optical spectrum, but the detection of strong CIII] together with the pronounced J125-band excess is already enough to place some constraints on the range of gas properties that can reproduce the data. When we adopt the sub-solar C/O models, we find that the data prefer low metallicity (log Z/Z⊙= -1.27), minimal dust attenuation (= 0.18), and a large ionization parameter (log US = -2.32). Not surprisingly, these properties are very similar to those derived for RXCJ0232-588, although the uncertainties in the gas properties of RXCJ0911-612 are considerably larger, owing to the absence of rest-optical line constraints. Nonetheless, all evidence points toward the observations being consistent with another young system dominated by low metallicity massive stars. We are unable to usefully constrain the ionized gas properties for the two objects where the rest-UV lines are weak (or undetected) and rest-optical spectroscopy is not yet available (PLCKG287-5648 and ACTCL0102-4854). While the broadband SED suggests that these systems are slightly older than the two systems described above (Table 6), it is not clear whether the metallicity or ionization parameter is significantly different. Near-infrared spectroscopy will be required to usefully constrain the gas conditions, providing a complete explanation as to why these systems power weaker CIII] emission.
| Object | Quantity | Data | Model |
| RXCJ0232-588 | CIII] EW (Å) | 20.5 | |
| O32 | 11.85 | ||
| R23 | 2.06 | 6.47 | |
| [OIII]5007/H | 4.47 | ||
| [OIII]5007 EW (Å) | 156 | 1692 | |
| RXCJ0911-612 | CIII] EW (Å) | 15.9 | |
| PLCKG287-5648 | CIII] EW (Å) | 4.9 | |
| ACTCL0102-4854 | CIII] EW (Å) | 3.8 | |
| [OII] EW (Å) | 54.2 |
5 Discussion
The spectroscopic study of reionization-era galaxies is one of the primary science drivers behind the development of near-IR spectrographs for the current and future generation of O/IR telescopes. Whereas JWST will be able to detect strong rest-optical nebular lines such as [OIII] and H from galaxies, ground-based O/IR facilities will be limited to the spectral features within the rest-UV. Identifying the optimal spectral features in the UV is particularly important for our ability to spectroscopically study the large sample of galaxies that will be identified photometrically by future imaging campaigns, for example, with the Wide Field Infrared Survey Telescope (WFIRST), as the areas covered will be much too wide for JWST follow-up.
The discovery of intense UV metal line emission in galaxies suggests a path toward achieving this goal. While the faint lines are a challenge for existing facilities, their detection will become much easier with upcoming 25-40m class telescopes, potentially opening the door for CIII] and CIV to be used for large redshift surveys in the reionization era. However it is worth emphasizing that we are currently very far from this goal. Each of the UV metal line detections are associated with relatively bright galaxies (H26) for which the redshift was already known from Ly emission; efforts to target CIII] in galaxies lacking spectroscopic confirmation have proven extremely challenging for current facilities (e.g., Zitrin et al. 2015). Focusing on galaxies with Ly redshifts is a natural starting place for the demonstration of method, but this approach almost certainly leads to a biased spectroscopic sample, including only those sources in large enough ionized regions of the IGM for Ly to be detectable at .
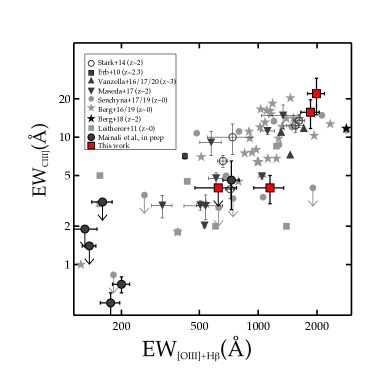
The last few years have seen several key steps taken toward the eventual use of CIII] and other faint UV lines as the primary means of spectroscopic confirmation at . Most importantly, we have improved our understanding of the stellar populations and gas conditions which support the strong line emission we are now seeing at (e.g.,Stark et al. 2014; Rigby et al. 2015; Du et al. 2017; Senchyna et al. 2017). Intense metal line emission is found in galaxies that are both metal poor ( Z⊙ for CIII]; Senchyna et al. 2017) and dominated by very young stellar populations. The latter trend is most clearly seen in the relation between CIII] EW and the [OIII] or H EWs. In Fig. 10, we present an updated compilation of the dependence of the CIII] EW on the [OIII]+H EW. With the inclusion of the sources from our survey, it is now apparent that the CIII] EW reaches the values seen at (EW Å) in a subset of sources with [OIII]+H EW Å. In the context of the photoionization models discussed in §4.2, the CIII] detections at imply extremely young stellar populations expected within several Myr after a burst of star formation.
This relationship guides the survey strategy for targeting CIII] as the primary redshift indicator in metal poor star forming galaxies. The results of this paper demonstrate the feasibility of such efforts. The sources we have targeted lacked spectroscopic confirmation but showed photometric flux excesses indicative of intense [OIII]+H emission at . We were able to spectroscopically confirm the redshifts of the sources with the three largest broadband flux excess (i.e., the largest [OIII]+H EWs) through detection of CIII] emission. These are among the first sources at high redshift for which CIII] was used as the primary means of spectroscopic confirmation. In each case, we guided our spectroscopic exposure times by expectations from the relationship between CIII] EW and [OIII]+H EW seen in Fig. 10.
The success of this approach motivates a renewed focus on current efforts to use CIII] as a redshift probe for reionization-era galaxy candidates. The Spitzer/IRAC imaging necessary to identify intense rest-optical line emission is now available over large areas (e.g., Strait et al. 2019; De Barros et al. 2019; Stefanon et al. 2019), allowing efficient selection of bright galaxies likely to have detectable CIII] emission. In particular, Fig. 10 suggests that identification of sources with CIII] EW in excess of 10-20 Å requires pre-selecting those galaxies with broadband flux excesses implying an [OIII]+H EW above 1500 Å. As discussed in §1, this [OIII]+H EW is not typical of galaxies in the reionization-era, corresponding to roughly twice the value implied by composite SEDs (Labbé et al., 2013). But by limiting spectroscopic searches to this subset of intense optical line emitters, it should be possible to efficiently identify CIII] emission independently of Ly in deep near-infrared spectra. In the era of the ELTs, these surveys can be extended to more typical sources with less extreme [OIII]+H EWs. With spectroscopic flux limits expected from the ELTs (e.g., Papovich et al. 2019), the relationship in Fig. 10 suggests that it should be possible to identify CIII] in typical galaxies down to , thereby providing one of the only means of building large redshift samples at from future imaging surveys conducted by WFIRST and other wide area near-infrared missions, opening new doors for insight into early galaxies and reionization.
6 Summary
The detection of intense CIII] and CIV emission in the spectra of galaxies has proven challenging to interpret. Some have suggested that AGN may be required to power the line emission (e.g., Nakajima et al. 2018) whereas other have suggested that the radiation field from young metal poor stellar populations is sufficient (Stark et al., 2017). The difficulty stems in part from our poor understanding of the EUV radiation field powered by low metallicity stellar populations. Without an improved reference sample of UV nebular line spectra of metal poor galaxies at lower redshifts, it will be impossible to distinguish between these two pictures.
With the aim of beginning to assemble such a sample at , we have obtained Magellan/IMACS and LDSS spectra targeting CIII] in four gravitationally lensed reionization-era analogs identified in HST imaging of cluster fields from the RELICS survey. The galaxies were selected to have a flux excess in the -band, indicative of strong [OIII]+H emission ( Å), similar to what has been inferred from the SEDs of the galaxies with CIII] detections. Our goal is to improve our understanding of the stellar populations and gas physical conditions that are required to power the intense CIII] emission that has been observed at . We summarize our main findings below.
1. We detect CIII] emission in three out of the four EELGs in our sample, with the EW of CIII] scaling with the [OIII]+H EW. The two objects with the largest [OIII]+H EWs are found to have CIII] strengths approaching those seen at (EW Å). These results suggest that the relationship between CIII] EW and [OIII] EW continues well into the EELG regime, with the intense CIII] emission seen at linked to the most intense optical line emitters (EW Å).
2. Each of the four lensed galaxies in our sample are characterized by very low stellar masses (1.3-7.9107 M⊙), large sSFRs (58-490 Gyr-1) and low dust attenuation (V-band optical depth =0.0-0.5), consistent with a population of dwarf galaxies that have recently undergone a burst of star formation. The broadband SED and extreme optical line emission imply very young luminosity-weighted ages (for a constant star formation history), ranging from 2-3 Myr for the most extreme line emitters to 15-20 Myr for the two EELGs with less prominent [OIII]+H emission.
3. We have obtained a Magellan/FIRE near-infrared spectrum of RXCJ0232-588, providing insight into the gas conditions in one of the only low mass galaxies known at with an integrated CIII] EW as large as at (EW20 Å). We find that the galaxy is very metal poor (12+log O/H =7.60.2) with a highly ionized ISM (O32=9.39) and a sub-solar C/O ratio (). The properties of the source are very different from previously-known CIII] emitters with EW Å at (Le Fèvre et al., 2019), each of which have shown super-solar C/O ratios or evidence for AGN activity. Instead these properties appear to be very similar to recent studies of metal poor low mass galaxies at similar redshifts (Amorín et al., 2017; Vanzella et al., 2016a, 2017; Berg et al., 2018).
4. We fit the emission lines and broadband SEDs of the EELGs in our sample using the BEAGLE photoionization modeling tool (Chevallard & Charlot, 2016). We find that stars are capable of powering the observed CIII] emission without contribution from additional sources of ionization (AGN, shocks), in spite of the sub-solar C/O ratio. In particular, the EUV radiation field associated with a young (2-3 Myr), metal poor stellar population (0.05-0.06 Z⊙) is able to simultaneously reproduce the CIII] emission, optical nebular line ratios, and broadband SED in our sample of extreme line emitters. In this context, the increased detection rate of intense CIII] emission at (Mainali et al., 2018) may suggest that such young, metal poor stellar populations are becoming more common in the reionization era.
5. The three UV line emitters in our sample are among the first sources for which CIII] was successfully used as the primary means of redshift confirmation. We discuss implications for the use of CIII] as a spectroscopic tool in the reionization era, arguing that the relationship between CIII] EW and [OIII] EW should already make it feasible to confirm redshifts of carefully-selected galaxies that have yet to be confirmed via Ly. In particular, dropouts with Spitzer/IRAC flux excesses indicative of EW Å are likely to have prominent CIII] emission, making spectroscopic confirmation tractable in sufficiently bright galaxies. In the era of the ELTs, it should be feasible to detect CIII] in less extreme sources, providing one of the most efficient means of redshift confirmation for photometric sources identified in WFIRST imaging.
Acknowledgements
We thank Xinnan Du, Anna Feltre, Taylor Hutchison, Alice Shapley, and Casey Papovich for helpful discussions. DPS acknowledges support from the National Science Foundation through the grant AST-1410155. This paper includes data gathered with the 6.5 meter Magellan Telescopes located at Las Campanas Observatory, Chile. This work is based on observations taken by the RELICS Treasury Program(GO-14096) with the NASA/ESAHST. Program GO-14096 is supported by NASA through a grant from the Space Telescope Science Institute, which is operated by the Association of Universities for Research inAstronomy, Inc., under NASA contract NAS5-26555. The paper uses high level science products (HLSP) from the RELICS program, including catalogs and lens models, which were retrieved from the Mikulski Archive for Space Telescopes (MAST).
References
- Acebron et al. (2018) Acebron A., et al., 2018, ApJ, 858, 42
- Alavi et al. (2016) Alavi A., et al., 2016, ApJ, 832, 56
- Allen et al. (2008) Allen M. G., Groves B. A., Dopita M. A., Sutherland R. S., Kewley L. J., 2008, ApJS, 178, 20
- Amorín et al. (2014) Amorín R., et al., 2014, A&A, 568, L8
- Amorín et al. (2017) Amorín R., et al., 2017, Nature Astronomy, 1, 0052
- Asplund et al. (2009) Asplund M., Grevesse N., Sauval A. J., Scott P., 2009, ARA&A, 47, 481
- Atek et al. (2011) Atek H., et al., 2011, ApJ, 743, 121
- Baldwin et al. (1981) Baldwin J. A., Phillips M. M., Terlevich R., 1981, PASP, 93, 5
- Berg et al. (2016) Berg D. A., Skillman E. D., Henry R. B. C., Erb D. K., Carigi L., 2016, ApJ, 827, 126
- Berg et al. (2018) Berg D. A., Erb D. K., Auger M. W., Pettini M., Brammer G. B., 2018, preprint, (arXiv:1803.02340)
- Berg et al. (2019) Berg D. A., Erb D. K., Henry R. B. C., Skillman E. D., McQuinn K. B. W., 2019, ApJ, 874, 93
- Bouwens et al. (2015a) Bouwens R. J., Illingworth G. D., Oesch P. A., Caruana J., Holwerda B., Smit R., Wilkins S., 2015a, preprint, (arXiv:1503.08228)
- Bouwens et al. (2015b) Bouwens R. J., et al., 2015b, ApJ, 803, 34
- Bradley et al. (2014) Bradley L. D., et al., 2014, ApJ, 792, 76
- Bruzual & Charlot (2003) Bruzual G., Charlot S., 2003, MNRAS, 344, 1000
- Byler et al. (2018) Byler N., Dalcanton J., Conroy C., Johnson B., Levesque E., Berg D., 2018, preprint, (arXiv:1803.04425)
- Calzetti et al. (2000) Calzetti D., Armus L., Bohlin R. C., Kinney A. L., Koornneef J., Storchi-Bergmann T., 2000, ApJ, 533, 682
- Cerny et al. (2018) Cerny C., et al., 2018, ApJ, 859, 159
- Chabrier (2003) Chabrier G., 2003, PASP, 115, 763
- Chevallard & Charlot (2016) Chevallard J., Charlot S., 2016, MNRAS, 462, 1415
- Christensen et al. (2012) Christensen L., et al., 2012, MNRAS, 427, 1953
- Cibirka et al. (2018) Cibirka N., et al., 2018, ApJ, 863, 145
- Coe et al. (2019) Coe D., et al., 2019, arXiv e-prints,
- Curtis-Lake et al. (2016) Curtis-Lake E., et al., 2016, MNRAS, 457, 440
- De Barros et al. (2019) De Barros S., Oesch P. A., Labbé I., Stefanon M., González V., Smit R., Bouwens R. J., Illingworth G. D., 2019, MNRAS, p. 907
- Dressler et al. (2011) Dressler A., et al., 2011, PASP, 123, 288
- Du et al. (2017) Du X., Shapley A. E., Martin C. L., Coil A. L., 2017, ApJ, 838, 63
- Du et al. (2018) Du X., et al., 2018, preprint, (arXiv:1803.05912)
- Eldridge & Stanway (2016) Eldridge J. J., Stanway E. R., 2016, MNRAS, 462, 3302
- Erb et al. (2010) Erb D. K., Pettini M., Shapley A. E., Steidel C. C., Law D. R., Reddy N. A., 2010, ApJ, 719, 1168
- Esteban et al. (2014) Esteban C., García-Rojas J., Carigi L., Peimbert M., Bresolin F., López-Sánchez A. R., Mesa-Delgado A., 2014, MNRAS, 443, 624
- Feltre et al. (2016) Feltre A., Charlot S., Gutkin J., 2016, MNRAS, 456, 3354
- Ferland et al. (2013) Ferland G. J., et al., 2013, Rev. Mex. Astron. Astrofis., 49, 137
- Finkelstein et al. (2013) Finkelstein S. L., et al., 2013, Nature, 502, 524
- Finkelstein et al. (2015) Finkelstein S. L., et al., 2015, ApJ, 810, 71
- Finkelstein et al. (2019) Finkelstein S. L., et al., 2019, arXiv e-prints, p. arXiv:1902.02792
- Fletcher et al. (2019) Fletcher T. J., Tang M., Robertson B. E., Nakajima K., Ellis R. S., Stark D. P., Inoue A., 2019, ApJ, 878, 87
- Garnett et al. (1995) Garnett D. R., Skillman E. D., Dufour R. J., Peimbert M., Torres-Peimbert S., Terlevich R., Terlevich E., Shields G. A., 1995, ApJ, 443, 64
- González et al. (2014) González V., Bouwens R., Illingworth G., Labbé I., Oesch P., Franx M., Magee D., 2014, ApJ, 781, 34
- Groves et al. (2006) Groves B. A., Heckman T. M., Kauffmann G., 2006, MNRAS, 371, 1559
- Gutkin et al. (2016) Gutkin J., Charlot S., Bruzual G., 2016, MNRAS, 462, 1757
- Hainline et al. (2011) Hainline K. N., Shapley A. E., Greene J. E., Steidel C. C., 2011, ApJ, 733, 31
- Hashimoto et al. (2018) Hashimoto T., et al., 2018, Nature, 557, 392
- Hu et al. (2017) Hu W., et al., 2017, ApJ, 845, L16
- Hutchison et al. (2019) Hutchison T. A., et al., 2019, arXiv e-prints, p. arXiv:1905.08812
- Izotov & Thuan (2008) Izotov Y. I., Thuan T. X., 2008, ApJ, 687, 133
- Izotov et al. (2018) Izotov Y. I., Worseck G., Schaerer D., Guseva N. G., Thuan T. X., Fricke Verhamme A., Orlitová I., 2018, MNRAS, 478, 4851
- Jaskot & Ravindranath (2016) Jaskot A. E., Ravindranath S., 2016, ApJ, 833, 136
- Jones et al. (2015) Jones T., Martin C., Cooper M. C., 2015, ApJ, 813, 126
- Kauffmann et al. (2003) Kauffmann G., et al., 2003, MNRAS, 346, 1055
- Kelson (2003) Kelson D. D., 2003, PASP, 115, 688
- Kewley et al. (2001) Kewley L. J., Dopita M. A., Sutherland R. S., Heisler C. A., Trevena J., 2001, ApJ, 556, 121
- Labbé et al. (2013) Labbé I., et al., 2013, ApJ, 777, L19
- Laporte et al. (2017) Laporte N., Nakajima K., Ellis R. S., Zitrin A., Stark D. P., Mainali R., Roberts-Borsani G. W., 2017, ApJ, 851, 40
- Le Fèvre et al. (2019) Le Fèvre O., et al., 2019, A&A, 625, A51
- Leitherer et al. (2011) Leitherer C., Tremonti C. A., Heckman T. M., Calzetti D., 2011, AJ, 141, 37
- Livermore et al. (2017) Livermore R. C., Finkelstein S. L., Lotz J. M., 2017, ApJ, 835, 113
- Luridiana et al. (2015) Luridiana V., Morisset C., Shaw R. A., 2015, A&A, 573, A42
- Mainali et al. (2017) Mainali R., Kollmeier J. A., Stark D. P., Simcoe R. A., Walth G., Newman A. B., Miller D. R., 2017, ApJ, 836, L14
- Mainali et al. (2018) Mainali R., et al., 2018, MNRAS, 479, 1180
- Maseda et al. (2014) Maseda M. V., et al., 2014, ApJ, 791, 17
- McLure et al. (2013) McLure R. J., et al., 2013, MNRAS, 432, 2696
- Mollá et al. (2009) Mollá M., García-Vargas M. L., Bressan A., 2009, MNRAS, 398, 451
- Nakajima et al. (2018) Nakajima K., et al., 2018, A&A, 612, A94
- Ono et al. (2012) Ono Y., et al., 2012, ApJ, 744, 83
- Ono et al. (2013) Ono Y., et al., 2013, ApJ, 777, 155
- Osterbrock & Ferland (2006) Osterbrock D. E., Ferland G. J., 2006, Astrophysics of gaseous nebulae and active galactic nuclei
- Papovich et al. (2019) Papovich C., et al., 2019, in BAAS. p. 266 (arXiv:1903.04524)
- Paterno-Mahler et al. (2018) Paterno-Mahler R., et al., 2018, ApJ, 863, 154
- Peimbert & Peimbert (2002) Peimbert M., Peimbert A., 2002, in Claria J. J., Garcia Lambas D., Levato H., eds, Revista Mexicana de Astronomia y Astrofisica Conference Series Vol. 14, Revista Mexicana de Astronomia y Astrofisica Conference Series. pp 47–52 (arXiv:astro-ph/0204087)
- Pérez-Montero (2017) Pérez-Montero E., 2017, PASP, 129, 043001
- Pérez-Montero & Amorín (2017) Pérez-Montero E., Amorín R., 2017, MNRAS, 467, 1287
- Reines et al. (2013) Reines A. E., Greene J. E., Geha M., 2013, ApJ, 775, 116
- Rigby et al. (2015) Rigby J. R., Bayliss M. B., Gladders M. D., Sharon K., Wuyts E., Dahle H., Johnson T., Peña-Guerrero M., 2015, ApJ, 814, L6
- Robertson et al. (2013) Robertson B. E., et al., 2013, ApJ, 768, 71
- Salmon et al. (2015) Salmon B., et al., 2015, ApJ, 799, 183
- Sanders et al. (2016) Sanders R. L., et al., 2016, ApJ, 816, 23
- Sanders et al. (2019) Sanders R. L., et al., 2019, arXiv e-prints, p. arXiv:1907.00013
- Schmidt et al. (2017) Schmidt K. B., et al., 2017, ApJ, 839, 17
- Senchyna et al. (2017) Senchyna P., et al., 2017, MNRAS, 472, 2608
- Senchyna et al. (2019) Senchyna P., Stark D. P., Chevallard J., Charlot S., Jones T., Vidal García A., 2019, arXiv e-prints,
- Shapley et al. (2003) Shapley A. E., Steidel C. C., Pettini M., Adelberger K. L., 2003, ApJ, 588, 65
- Shapley et al. (2015) Shapley A. E., et al., 2015, ApJ, 801, 88
- Simcoe et al. (2013) Simcoe R. A., et al., 2013, PASP, 125, 270
- Smit et al. (2014) Smit R., et al., 2014, ApJ, 784, 58
- Smit et al. (2015) Smit R., et al., 2015, ApJ, 801, 122
- Stanway et al. (2016) Stanway E. R., Eldridge J. J., Becker G. D., 2016, MNRAS, 456, 485
- Stark (2016) Stark D. P., 2016, ARA&A, 54, 761
- Stark et al. (2013) Stark D. P., Schenker M. A., Ellis R., Robertson B., McLure R., Dunlop J., 2013, ApJ, 763, 129
- Stark et al. (2014) Stark D. P., et al., 2014, MNRAS, 445, 3200
- Stark et al. (2015a) Stark D. P., et al., 2015a, MNRAS, 450, 1846
- Stark et al. (2015b) Stark D. P., et al., 2015b, MNRAS, 454, 1393
- Stark et al. (2017) Stark D. P., et al., 2017, MNRAS, 464, 469
- Stefanon et al. (2019) Stefanon M., et al., 2019, arXiv e-prints, p. arXiv:1902.10713
- Steidel et al. (2016) Steidel C. C., Strom A. L., Pettini M., Rudie G. C., Reddy N. A., Trainor R. F., 2016, ApJ, 826, 159
- Strait et al. (2019) Strait V., et al., 2019, arXiv e-prints, p. arXiv:1905.09295
- Strom et al. (2017) Strom A. L., Steidel C. C., Rudie G. C., Trainor R. F., Pettini M., Reddy N. A., 2017, ApJ, 836, 164
- Strom et al. (2018) Strom A. L., Steidel C. C., Rudie G. C., Trainor R. F., Pettini M., 2018, ApJ, 868, 117
- Tang et al. (2019) Tang M., Stark D. P., Chevallard J., Charlot S., 2019, MNRAS, 489, 2572
- Tilvi et al. (2016) Tilvi V., et al., 2016, ApJ, 827, L14
- Trainor et al. (2016) Trainor R. F., Strom A. L., Steidel C. C., Rudie G. C., 2016, ApJ, 832, 171
- Vanzella et al. (2016a) Vanzella E., et al., 2016a, ApJ, 821, L27
- Vanzella et al. (2016b) Vanzella E., et al., 2016b, ApJ, 825, 41
- Vanzella et al. (2017) Vanzella E., et al., 2017, ApJ, 842, 47
- Vanzella et al. (2020) Vanzella E., et al., 2020, MNRAS, 491, 1093
- Volonteri et al. (2017) Volonteri M., Reines A. E., Atek H., Stark D. P., Trebitsch M., 2017, ApJ, 849, 155
- Zitrin et al. (2015) Zitrin A., et al., 2015, ApJ, 810, L12
- Zitrin et al. (2017) Zitrin A., et al., 2017, ApJ, 839, L11
- de Barros et al. (2016) de Barros S., et al., 2016, A&A, 585, A51
- van der Wel et al. (2011) van der Wel A., et al., 2011, ApJ, 742, 111