Strong coupling of two individually controlled atoms via a nanophotonic cavity
Abstract
We demonstrate photon-mediated interactions between two individually trapped atoms coupled to a nanophotonic cavity. Specifically, we observe superradiant line broadening when the atoms are resonant with the cavity, and level repulsion when the cavity is coupled to the atoms in the dispersive regime. Our approach makes use of individual control over the internal states of the atoms, their position with respect to the cavity mode, as well as the light shifts to tune atomic transitions individually, allowing us to directly observe the anti-crossing of the superradiant and subradiant two-atom states. These observations open the door for realizing quantum networks and studying quantum many-body physics based on atom arrays coupled to nanophotonic devices.
Controlled interactions between individual photons and quantum emitters are an important ingredient for the realization of scalable quantum information systems DiVincenzo (2000); Reiserer and Rempe (2015). Nanophotonic devices in which the light is confined to sub-wavelength dimensions constitute a promising approach for engineering strong light-matter coupling Lodahl et al. (2015); Chang et al. (2018). The appeal of a nanophotonic platform is due to two key features. On one hand, nanophotonic devices allow the photonic dispersion to be tailored to achieve tunable-range interactions between coupled emitters Lodahl et al. (2004); Englund et al. (2010); Thompson et al. (2013a); Sipahigil et al. (2016); Miyazono et al. (2016); Dibos et al. (2018) and engineer a range of interaction Hamiltonians Douglas et al. (2015); González-Tudela et al. (2015). On the other hand, the nanoscale mode volume enables an efficient high cooperativity emitter-photon interface suitable for realizing potentially scalable systems Duan and Kimble (2004a, 2003); Briegel et al. (1998); Duan et al. (2001). In particular, cold neutral atoms have recently emerged as a promising approach for realizing large-scale quantum systems due to the ability to generate large numbers of identical, individually trapped atoms Kim et al. (2016); Endres et al. (2016); Kim et al. (2016); Barredo et al. (2016, 2018); Kumar et al. (2018). While significant effort is currently being directed towards coupling multiple isolated atoms to nanophotonic systems Goban et al. (2015); Kim et al. (2019); Vetsch et al. (2010); Thompson et al. (2013a), achieving a strong coupling of a deterministic number of atoms remains a challenge. The atoms must be trapped closely enough to the device to maximize the coupling within the evanescent field, while overcoming attractive surface forces Antezza et al. (2004); Obrecht et al. (2007), and preserving the excellent atomic coherence properties.
In this Letter, we report on the observation of strong coupling of two individually controlled atoms via a nanophotonic cavity. In particular, we spectroscopically demonstrate superradiant line broadening in the resonant regime, and level repulsion in the dispersive regime. These experiments utilize individual control of the positions of the atoms with respect to the cavity mode, their internal states, and the frequencies of their transitions. This allows us to observe the anti-crossing of the superradiant and subradiant two-atom states, in analogy to prior observations involving superconducting qubits and color centers in diamond Majer et al. (2007); Evans et al. (2018).
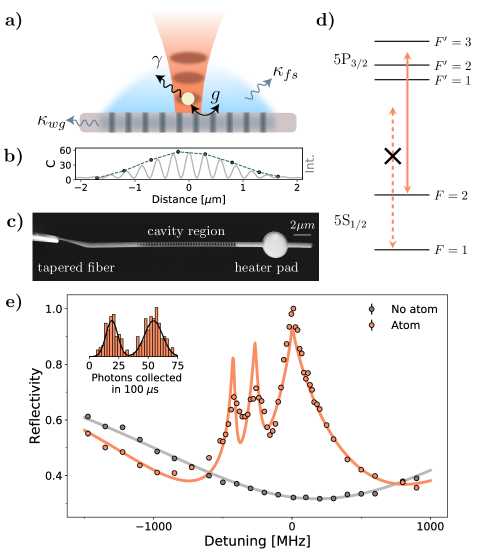
Our experiments utilize a cavity QED system consisting of 87Rb atoms coupled to the evanescent field of a photonic crystal (PC) cavity (Fig. 1a, b) Thompson et al. (2013a). The SiN nanophotonic device is suspended in a vacuum chamber on a tapered optical fiber, which is also used for efficient interrogation of the cavity by exciting and collecting photons through its fiber-optic interface Tiecke et al. (2015). This approach minimizes the physical footprint of the system, thus allowing for good optical access and unobstructed trapping and cooling while retaining the flexibility to control the atomic position and confinement. The atoms are trapped using tightly focused optical tweezers that localize them to within tens of nanometers and can be steered to desired locations. The internal states of the atoms are individually manipulated with light fields co-propagating with the optical tweezers. We interrogate the response of the atom-cavity system by scanning the frequency of the probe field to measure the reflection spectrum. The frequency of the cavity is tuned thermally with a laser beam pointed at the heater pad (Fig. 1c).
We probe the atom-cavity spectrum by tuning the cavity to the transition at 780 nm. The spectrum is acquired by scanning the probe field from the ground state manifold across the excited state manifolds (Fig. 1d), while the atom is positioned at the center of the cavity mode. We note that for all the spectra presented in this Letter, the probe detuning is relative to the bare transition, and the error bars are obtained from statistical uncertainties acquired over multiple experimental runs.
Fig. 1e shows the reflection spectrum of the cavity with and without an atom present. For the case without an atom, the reflection spectrum is a resonance dip of the empty cavity. The presence of an atom drastically changes the spectrum, and we observe three atomic lines that are significantly broadened due to resonant coupling between the atom and the cavity. This effect can be understood in terms of the Purcell enhancement. In the resonant regime, the radiative decay rate into the cavity mode is enhanced by the single-atom cooperativity , where is the single-photon Rabi frequency, the atomic spontaneous decay rate. The cavity decays at the rate into the waveguide and elsewhere, yielding the total cavity decay rate (Fig. 1a). The observed lineshape is accurately described using a model incorporating a distribution of cooperativities resulting from fluctuations in the atomic positions (see Fig. 3 and si for further discussions). Taking these considerations into account, we fit the spectrum in Fig. 1e and extract the average cooperativity , corresponding to the cavity QED parameters . Given the geometry of the trapping potential of the tweezer and the evanescent field of the cavity, we estimate that the atom in the closest lattice site at a distance of 260 nm from the surface of the PC experiences a single-photon Rabi frequency GHz in the absence of the cooperativity fluctuation, corresponding to GHz after averaging si . This estimate is consistent with the single-photon Rabi frequency extracted from our experimental data.
The efficient atom-photon interface allows us to determine the presence of an atom in a single shot. We tune the probe frequency to the line and count reflected photons collected within (Fig. 1e inset). When repeated multiple times, the photon number follows a bimodal normal distribution with overlap, which is adequately separable to determine if the atom is coupled to the cavity. The atom becomes uncoupled from the cavity if it falls into the manifold via off-resonant scattering. We deplete the population in the manifold by sending in an additional beam co-propagating with the optical tweezer on the transition, at 795 nm, which is sufficiently detuned from the cavity and can be filtered out from the collected photons. In addition to the line, the spectrum in Fig. 1e also shows the transitions, which are not cycling and would not be visible without applying the repumping beam.
The reflection spectrum can be used to study the cooperativity dependence on experimental parameters such as the position of the atom. Taking advantage of the individual position control, we scan the tweezer position along the axis of the PC by steering the galvanometer mirrors and acquire a spectrum associated with each position si . We then determine the cooperativity at each location from the Purcell-enhanced linewidth and find that the resulting cooperativity dependence (Fig. 1b, blue) traces out the envelope of the numerically simulated field profile intensity (gray).
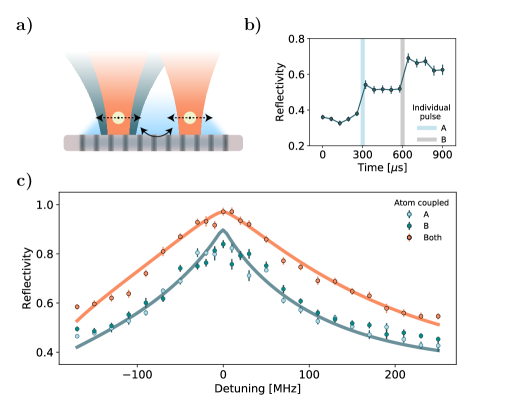
Having characterized the single-atom coupling, we now turn to the case of two atoms to study their resonant coupling via the cavity (Fig. 2a). The two tweezers must be placed away from each other to avoid overlap and cross-talk, hence inevitably lowering their individual cooperativities. The experiments involving two atoms are operated with the tweezers placed away from the mode center, corresponding to the average single-atom cooperativity (Fig. 1b, blue), well within the strong coupling regime.
In addition to the position control, the two-atom experiments also make use of internal state manipulation of individual atoms. This is achieved by having repumping beams co-propagating with the tweezers, selectively bringing the desired atom into the manifold. We demonstrate this by applying long repumping pulses at on one tweezer and on the other while constantly probing the spectrum with the probe blue-detuned to 100 MHz and monitoring the collected photon counts in time (Fig. 2b). The average collected counts step up following each pulse, indicating the influence of repumping the atoms one at a time. The capability of individual repumping is utilized for detection and postselection on having two atoms coupled to the cavity in each trial of the experiment si .
With these capabilities, we explore the collective behavior of two atoms simultaneously coupled to the cavity by acquiring a reflection spectrum centered on the line (Fig. 2c, orange). As compared to the single-atom case, we observe twofold broadening of the two-atom line, which can be interpreted as a result of superradiance Goban et al. (2015); Mlynek et al. (2014). The spectrum is consistent with our theoretical model generated using the sum of individual cooperativities extracted from the single-atom spectra with no additional parameters si .
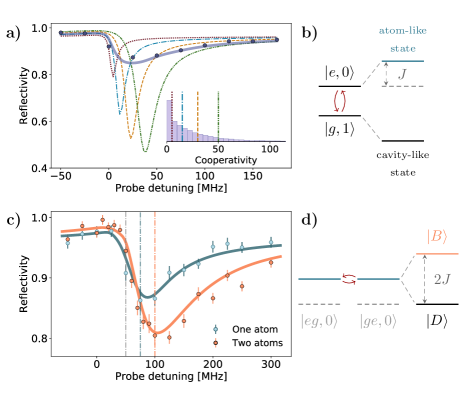
The phenomena described above, such as the Purcell effect and superradiant broadening, can also be demonstrated spectroscopically in the dispersive regime. We red-detune the cavity relative to the line by and acquire a single-atom spectrum (Fig. 3a). We observe that the atomic line becomes narrower than the resonant case and experiences a frequency shift Note (1). The shift can be interpreted as a result of the atom-cavity interaction in the dispersive regime (Fig. 3b). In this regime, the atom is dressed by the cavity coupling and experiences a frequency shift of while its Purcell-enhanced linewidth is suppressed by a factor of .
We note that similarly to the resonant case, the experimental data cannot be adequately captured by theoretical curves (Fig. 3a, dashed-dotted lines) generated with single-valued cooperativities (Fig. 3a inset, vertical lines) but is rather well described using a model involving cooperativity distribution shown in the inset of Fig. 3a. This distribution leads to varying frequency shifts, which result in additional broadening and modified lineshape. The origin of the cooperativity distribution can be understood as fluctuations in the atomic positions predominantly due to thermal motion across the spatially-varying field of the cavity si .
The collective coupling in the dispersive regime can be characterized by probing spectra at a cavity detuning, here chosen to be , with one and two atom(s) at the same resonance frequency (Fig. 3c). The single-atom shift is consistent with the expected value of based on our average cooperativity estimate. The two-atom spectrum appears as a single line that experiences a shift twice as large as the single-atom line Note (2)
The twofold enhancement of the frequency shift can be formulated in terms of level repulsion between the two atoms resonant with each other (Fig. 3d). Here, the resulting states can be represented as symmetric and antisymmetric superpositions of the two-atom states. The symmetric superposition interacts more strongly with the cavity due to constructive interference of coherent scattering into the cavity mode, thereby experiencing the frequency shift of , and forming the bright state, . The antisymmetric superposition does not interact with the cavity due to the destructive interference, acquires zero shift, and forms the dark state . The frequency difference hence results in line-splitting which can be equivalently viewed as an interaction between two atoms with coupling rate due to an off-resonant exchange of virtual cavity photons Goban et al. (2015).
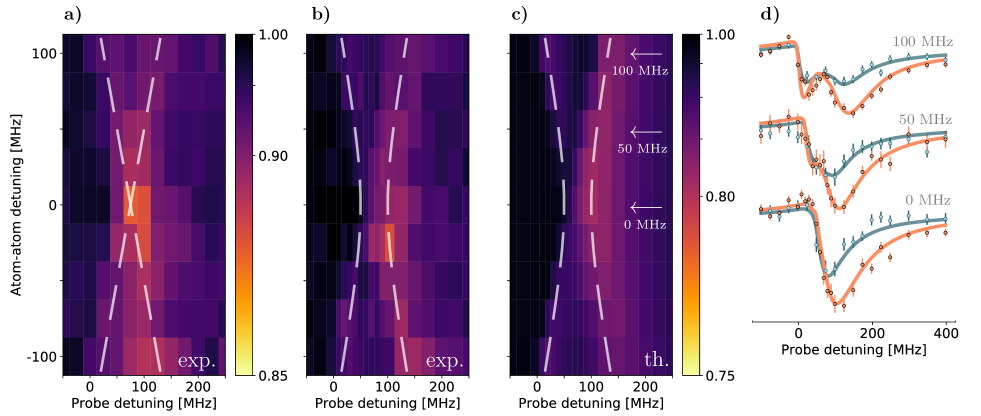
We further illustrate the dynamics of level repulsion by tuning the atoms in and out of resonance with each other. The relative atom detuning , can be tuned with the light shifts induced by the individual tweezers, in our case, within si . At large , the two atoms remain independent, and the spectrum shows two separate lines. If there were no interaction between the two atoms, the spectra would cross as we tune their resonances past each other as shown in an average of two individual atomic spectra in Fig. 4a. However, when both atoms are coupled to the cavity and are tuned closer together, the single-atom states start to hybridize into the dark and bright components that avoid crossing each other (Fig. 4b). The frequencies of the states follow with the gap that signifies the coupling strength of , in agreement with the theoretical model shown in Fig. 4c. In Fig. 4d, we show three of the cross-sections of the experimental data overlapped with our theoretical model, both for the two-atom and the averaged case.
The observations demonstrate a controllable high-cooperativity interface between atoms and photons, as well as between two atoms mediated by virtual cavity photons, namely superradiance and anti-crossing. These results can be extended along several directions.
First, the photon-mediated interactions can be combined with coherent quantum control of the internal states of the atoms to implement quantum gates for state transfer and entanglement generation Cirac et al. (1997); Duan and Kimble (2004b); Welte et al. (2017, 2018). As the errors of many of the protocols for these applications are inversely proportional to the cooperativity, further improvement in cooperativity is an essential prerequisite for scalability. This may be achieved by positioning the atoms closer to the surface to access a larger field strength Hung et al. (2013), or improvements in fabrication and design Ji et al. (2017). A cooperativity increase can be achieved with tighter localization with respect to the mode maxima by cooling the atoms in optical tweezers Kaufman et al. (2012); Thompson et al. (2013b) and near the nanostructure Meng et al. (2018). Second, this approach offers a complete toolbox for controlling quantum many-body systems. The number of atoms can be scaled up by generating tweezer arrays Kim et al. (2016); Endres et al. (2016); Kim et al. (2016); Barredo et al. (2016, 2018); Kumar et al. (2018). The established techniques for assembling atom arrays can be combined with our approach for the individual addressing and light shift control and recently developed techniques for imaging an array on a nanophotonic structure Kim et al. (2019). Combining these capabilities with the ability to engineer band dispersion may allow for the exploration of novel many-body systems with extensive tunability. Finally, the efficient high-bandwidth atom-photon interface with individual atomic control is naturally suitable for realizing quantum networks with multi-qubit nodes Kimble (2008); Khabiboulline et al. (2019); Kómár et al. (2014). The nanoscale interface also holds prospects of integration with modular architecture such as on-chip photonic circuits and fiber-optic networks for various applications ranging from quantum repeaters to distributed quantum computing Borregaard et al. (2015); Nickerson et al. (2013).
We thank Rivka Bekenstein, Robert Bettles, Johannes Borregaard, Manuel Endres, Hannes Pichler, Florentin Reiter, Sylvain Schwartz, François Swiadek, Jeff Thompson, Susanne Yelin, and Alexander Zibrov for useful discussions and experimental contributions. This work was supported by the Center for Ultracold Atoms, the National Science Foundation, AFOSR MURI, Vannevar Bush Faculty Fellowship, and ARL CDQI.
References
- DiVincenzo (2000) D. P. DiVincenzo, Fortschritte der Physik 48, 771 (2000).
- Reiserer and Rempe (2015) A. Reiserer and G. Rempe, Rev. Mod. Phys. 87, 1379 (2015).
- Lodahl et al. (2015) P. Lodahl, S. Mahmoodian, and S. Stobbe, Rev. Mod. Phys. 87, 347 (2015).
- Chang et al. (2018) D. E. Chang, J. S. Douglas, A. González-Tudela, C.-L. Hung, and H. J. Kimble, Rev. Mod. Phys. 90, 031002 (2018).
- Lodahl et al. (2004) P. Lodahl, A. Floris van Driel, I. S. Nikolaev, A. Irman, K. Overgaag, D. Vanmaekelbergh, and W. L. Vos, Nature 430, 654 (2004).
- Englund et al. (2010) D. Englund, A. Majumdar, A. Faraon, M. Toishi, N. Stoltz, P. Petroff, and J. Vučković, Phys. Rev. Lett. 104, 073904 (2010).
- Thompson et al. (2013a) J. D. Thompson, T. G. Tiecke, N. P. de Leon, J. Feist, A. V. Akimov, M. Gullans, A. S. Zibrov, V. Vuletić, and M. D. Lukin, Science 340, 1202 (2013a).
- Sipahigil et al. (2016) A. Sipahigil, R. E. Evans, D. D. Sukachev, M. J. Burek, J. Borregaard, M. K. Bhaskar, C. T. Nguyen, J. L. Pacheco, H. A. Atikian, C. Meuwly, R. M. Camacho, F. Jelezko, E. Bielejec, H. Park, M. Lončar, and M. D. Lukin, Science 354, 847 (2016).
- Miyazono et al. (2016) E. Miyazono, T. Zhong, I. Craiciu, J. M. Kindem, and A. Faraon, Applied Physics Letters 108, 011111 (2016).
- Dibos et al. (2018) A. M. Dibos, M. Raha, C. M. Phenicie, and J. D. Thompson, Phys. Rev. Lett. 120, 243601 (2018).
- Douglas et al. (2015) J. S. Douglas, H. Habibian, C. L. Hung, A. V. Gorshkov, H. J. Kimble, and D. E. Chang, Nature Photonics 9, 326 EP (2015).
- González-Tudela et al. (2015) A. González-Tudela, C. L. Hung, D. E. Chang, J. I. Cirac, and H. J. Kimble, Nature Photonics 9, 320 EP (2015).
- Duan and Kimble (2004a) L.-M. Duan and H. J. Kimble, Phys. Rev. Lett. 92, 127902 (2004a).
- Duan and Kimble (2003) L.-M. Duan and H. J. Kimble, Phys. Rev. Lett. 90, 253601 (2003).
- Briegel et al. (1998) H.-J. Briegel, W. Dür, J. I. Cirac, and P. Zoller, Phys. Rev. Lett. 81, 5932 (1998).
- Duan et al. (2001) L. M. Duan, M. D. Lukin, J. I. Cirac, and P. Zoller, Nature 414, 413 (2001).
- Kim et al. (2016) H. Kim, W. Lee, H.-g. Lee, H. Jo, Y. Song, and J. Ahn, Nature Communications 7, 13317 EP (2016).
- Endres et al. (2016) M. Endres, H. Bernien, A. Keesling, H. Levine, E. R. Anschuetz, A. Krajenbrink, C. Senko, V. Vuletic, M. Greiner, and M. D. Lukin, Science 354, 1024 (2016).
- Barredo et al. (2016) D. Barredo, S. de Léséleuc, V. Lienhard, T. Lahaye, and A. Browaeys, Science 354, 1021 (2016).
- Barredo et al. (2018) D. Barredo, V. Lienhard, S. de Léséleuc, T. Lahaye, and A. Browaeys, Nature 561, 79 (2018).
- Kumar et al. (2018) A. Kumar, T.-Y. Wu, F. Giraldo, and D. S. Weiss, Nature 561, 83 (2018).
- Goban et al. (2015) A. Goban, C.-L. Hung, J. D. Hood, S.-P. Yu, J. A. Muniz, O. Painter, and H. J. Kimble, Phys. Rev. Lett. 115, 063601 (2015).
- Kim et al. (2019) M. E. Kim, T.-H. Chang, B. M. Fields, C.-A. Chen, and C.-L. Hung, Nature Communications 10, 1647 (2019).
- Vetsch et al. (2010) E. Vetsch, D. Reitz, G. Sagué, R. Schmidt, S. T. Dawkins, and A. Rauschenbeutel, Phys. Rev. Lett. 104, 203603 (2010).
- Antezza et al. (2004) M. Antezza, L. P. Pitaevskii, and S. Stringari, Phys. Rev. A 70, 053619 (2004).
- Obrecht et al. (2007) J. M. Obrecht, R. J. Wild, and E. A. Cornell, Phys. Rev. A 75, 062903 (2007).
- Majer et al. (2007) J. Majer, J. M. Chow, J. M. Gambetta, J. Koch, B. R. Johnson, J. A. Schreier, L. Frunzio, D. I. Schuster, A. A. Houck, A. Wallraff, A. Blais, M. H. Devoret, S. M. Girvin, and R. J. Schoelkopf, Nature 449, 443 EP (2007).
- Evans et al. (2018) R. E. Evans, M. K. Bhaskar, D. D. Sukachev, C. T. Nguyen, A. Sipahigil, M. J. Burek, B. Machielse, G. H. Zhang, A. S. Zibrov, E. Bielejec, H. Park, M. Lončar, and M. D. Lukin, Science 362, 662 (2018).
- Tiecke et al. (2015) T. G. Tiecke, K. P. Nayak, J. D. Thompson, T. Peyronel, N. P. de Leon, V. Vuletić, and M. D. Lukin, Optica 2, 70 (2015).
- (30) See Supplemental Material .
- Mlynek et al. (2014) J. A. Mlynek, A. A. Abdumalikov, C. Eichler, and A. Wallraff, Nature Communications 5, 5186 EP (2014).
- Note (1) The shift from 0 MHz detuning is observed in the absence of the light shift from the tweezer.
- Note (2) The shifts are determined with respect to an offset of due to the light shift induced by the tweezer.
- Cirac et al. (1997) J. I. Cirac, P. Zoller, H. J. Kimble, and H. Mabuchi, Phys. Rev. Lett. 78, 3221 (1997).
- Duan and Kimble (2004b) L.-M. Duan and H. J. Kimble, Phys. Rev. Lett. 92, 127902 (2004b).
- Welte et al. (2017) S. Welte, B. Hacker, S. Daiss, S. Ritter, and G. Rempe, Phys. Rev. Lett. 118, 210503 (2017).
- Welte et al. (2018) S. Welte, B. Hacker, S. Daiss, S. Ritter, and G. Rempe, Phys. Rev. X 8, 011018 (2018).
- Hung et al. (2013) C.-L. Hung, S. M. Meenehan, D. E. Chang, O. Painter, and H. J. Kimble, New Journal of Physics 15, 083026 (2013).
- Ji et al. (2017) X. Ji, F. A. S. Barbosa, S. P. Roberts, A. Dutt, J. Cardenas, Y. Okawachi, A. Bryant, A. L. Gaeta, and M. Lipson, Optica 4, 619 (2017).
- Kaufman et al. (2012) A. M. Kaufman, B. J. Lester, and C. A. Regal, Phys. Rev. X 2, 041014 (2012).
- Thompson et al. (2013b) J. D. Thompson, T. G. Tiecke, A. S. Zibrov, V. Vuletić, and M. D. Lukin, Phys. Rev. Lett. 110, 133001 (2013b).
- Meng et al. (2018) Y. Meng, A. Dareau, P. Schneeweiss, and A. Rauschenbeutel, Phys. Rev. X 8, 031054 (2018).
- Kimble (2008) H. J. Kimble, Nature 453, 1023 EP (2008).
- Khabiboulline et al. (2019) E. T. Khabiboulline, J. Borregaard, K. De Greve, and M. D. Lukin, Phys. Rev. A 100, 022316 (2019).
- Kómár et al. (2014) P. Kómár, E. M. Kessler, M. Bishof, L. Jiang, A. S. Sørensen, J. Ye, and M. D. Lukin, Nature Physics 10, 582 EP (2014).
- Borregaard et al. (2015) J. Borregaard, P. Kómár, E. M. Kessler, M. D. Lukin, and A. S. Sørensen, Phys. Rev. A 92, 012307 (2015).
- Nickerson et al. (2013) N. H. Nickerson, Y. Li, and S. C. Benjamin, Nature Communications 4, 1756 EP (2013).
Supplementary information
I I. Apparatus
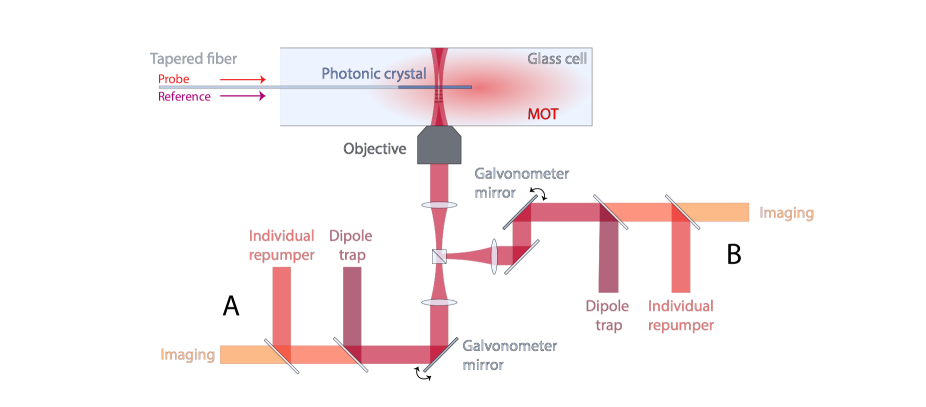
The apparatus consists of a confocal microscope that images a photonic crystal (PC) installed in the glass cell of the vacuum chamber (Fig. S1). The microscope objective [Mitutoyo G Plan Apo 50X] is used for focusing optical tweezers (beam waist 900 nm) and for fluorescence imaging of single atoms. The two tweezers are generated by combining two optical paths on a 50:50 non-polarizing beam splitter at the focus of a -microscope configuration. Each path also has two dichroic mirrors, to combine the trap light (815 nm) with individual repumping light (795 nm) and to separate the collected fluorescence light (780 nm).
The ultra-high vacuum (UHV) system consists of a glass cell mounted to a compact vacuum cube [Kimball Physics MCF450-SphSq-E2C4] and a combination of a non-evaporable getter and an ion pump [NEXTorr D300-5]. The entire system is mounted on a translation stage that can be retracted for device exchange without disturbing the optical paths around the chamber. The small and moveable vacuum system allows for speed-up of typically extensive procedures such as device replacement and pumping to UHV, which in our system can take less than one week in total. The PC is suspended at the tip of a tapered fiber tiecke_fiber , which is mounted on a rod assembly and led to the outside of the vacuum through a fiber feedthrough cornell_fiber . The probe light is sent to the cavity through a beam-sampler and coupled into the fiber, where the reflection is collected through the transmission port and onto a single-photon counter [PerkinElmer SPCM-AQR-16-FC]. The reference light for cavity stabilization is combined with the probe on a dichroic before coupling into the fiber and is monitored in reflection with a high-bandwidth avalanche photodiode [Menlo Systems APD210].
II II. Photonic crystal cavities
II.1 Design and fabrication
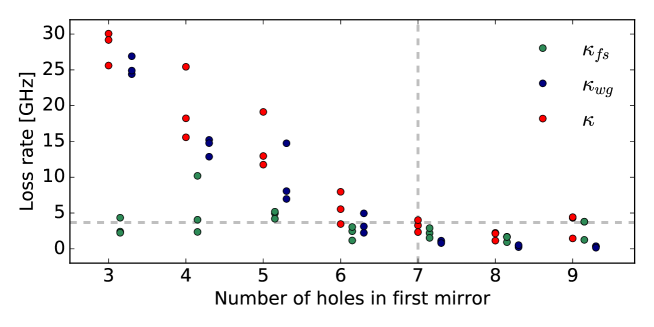
The design of the cavity follows that in painter_design ; painter_zipper . The cavity used in this work is designed to operate near the critical coupling regime () for a minimal total loss rate . Since is limited by fabrication imperfections, we decrease by controlling the loss from the first Bragg mirror with the number of holes that define it, as shown in Fig. S2. To reach the critical coupling regime, is tuned to be comparable to the loss from the cavity into free space which has typical values of several gigahertz. The device used in this work has GHz and GHz.
The fabrication process begins with a 200 nm layer of silicon nitride (bulk index of refraction = 2.02) on a silicon wafer [Silicon Valley Microelectonics, Inc.]. A pattern of 500 devices is created by exposing a layer of resist [ZEP520A] on the wafer to a scanning electron beam [Elionix F125]. The pattern is then transferred to the silicon nitride layer using reactive ion etching. The silicon underneath is removed in a wet etch process with KOH. At the end of the process, we deposit an absorptive material (amorphous silicon) onto the disk-shaped heater pad region for thermal tuning of the resonance.
II.2 Frequency stabilization of the cavity
The resonance of the fundamental mode of the nanophotonic cavity sits near the transition at 780 nm, but there exist higher-order modes at longer wavelengths as shown in Fig. S3a. For the device used in this work, the second-order mode has a resonance near 810 nm, which is off-resonant for the atoms, and has a linewidth of 17 GHz. A laser pointed at the heater pad region heats up the device and changes the index of refraction, tuning the the resonances by the same increment, as shown in Fig. S3b. The bandwidth of the feedback loop is limited by this thermal tuning process at several milliseconds.
We stabilize the cavity monitoring the second-order mode and feeding back to the tuning laser power. The error signal is generated by modulating the phase of the reference light at 810 nm continuously sent to the cavity at 1 GHz. The reflected signal from the monitoring avalanche photodiode is demodulated at the same frequency, creating a low-modulation Pound-Drever-Hall error signal (Fig. S3c) pdh_review . In the experimental sequence described in the next section, the cavity resonance must be tuned in and out of resonance during each trial for different probe pulses. We achieve this by jumping the setpoint and waiting for several milliseconds for the cavity to settle before probing. We have observed no degradation in the quality factor after inserting our current device within the vacuum system and continuously tuning and stabilizing its resonance for over one year.
III III. Experimental sequence
We load atoms into the optical tweezers from a magneto-optical trap around the PC. Operating in the collisional blockade regime blockade , we monitor the fluorescence from each of the tweezers with our detector [Excelitas SPCM-AQRH-14-FC] and distinguish between having zero and one atom in each tweezer with a fidelity of . Every repetition of the experiment begins by triggering on the successful loading of both atoms (Fig. S4), followed by a 20 ms period of polarization gradient cooling to bring the atom’s temperature down from 50 K to 15 K.
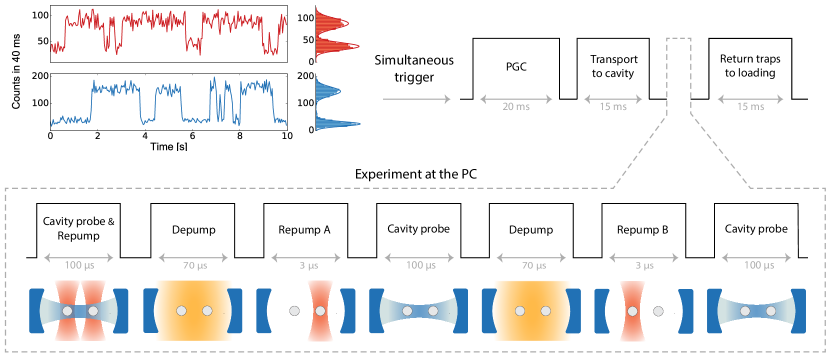
The atoms are transported to the final positions on the PC by steering the individual galvanometer mirrors. Given that our cavity mode is 500 nm wide and 4 m long, accurate positioning of the traps relative to the mode is crucial for the experiment. The position of the PC on the fiber tip can drift at a rate of 100 nm/hour relative to the microscope objective. To correct for this drift, we pause the experiment every 20 minutes and acquire confocal images of the PC at different focal planes. The images are processed to determine the new position of the PC in three dimensions. In addition, every few days, we calibrate the atomic coupling strengths versus position and reposition the atoms such that they have equal coupling strength.
To take the reflection spectra, we probe the cavity with light resonant with transition while constantly depleting the manifold with the individual repumpers. After acquiring the spectrum, we post-select the data for which an atom was loaded next to the cavity, which occurs with 70 probability and is mainly limited by the initial temperature in the traps. We first prepare both atoms in the uncoupled ground state level with a global beam resonant with the transition. Then we individually pump a single atom into the coupled ground state with a beam resonant with the transition, co-propagating with the optical tweezers. After this selective pumping, we probe the cavity on resonance to determine the atom’s presence in a single shot (Fig. 1d, main text). Repeating this procedure for the other atom allows us to select for data where one, the other, or both atoms are present. Once the experiment at the PC is finished, the tweezers are transported back to the original loading positions. The sequence is outlined in Fig. S4.
The probe experiment taking place at the cavity typically takes 500 s, much shorter than the lifetime of atoms in the trap next to the PC of ms. Compared with the lifetime of 1.5 s away from the PC, the reduced lifetime next to the PC indicates additional heating mechanism, as previously observed by heating_nano . Understanding the sources of extra heating and developing cooling techniques while next to the PC is a subject for future exploration.
IV IV. Individual tuning of the atomic resonances
The independent optical tweezer paths in our setup allow for individual manipulation of the internal atomic states. In this work, we change the relative atomic detuning through light shifts from the individual tweezers. This is done by modulating their intensities out of phase. Tuning the contrast of the modulation then shifts the atoms in and out of resonance with respect to each other. Note that we choose the modulation frequency , which is faster than the motional frequencies of the traps, thereby subjecting the two atoms to the same average trapping potential. The intensity modulation is generated using a Mach-Zehnder interferometer, with an acousto-optical modulator (AOM) driven at in each arm, where is the central frequency of the AOMs. The relative phase between the two tweezers can be tuned by sending one of the outputs of the interferometer through a delay line () and fine tuning the relative drive frequency to match the path difference. The modulated optical signal is also used to trigger the probe light sent to the cavity. Calibrating the delay of the triggered probe pulse allows us to probe the atoms at their maximum/minimum light shifts. When operating with the traps out of phase, changing the contrast of this modulation changes the individual lightshift of each atom and is used to sweep the atom-atom detuning as depicted in Fig. S5.
V V. Theoretical models
To model the reflection spectra, we study the transitions between the ground state manifold, labeled , and the relevant excited states in i.e. , labeled , where . For the on-resonance measurements (FIGs. 1 and 2 in the main text), the cavity frequency is resonant with the transition. The cavity field decay rate ( GHz) is smaller than the hyperfine splitting between the and ( GHz), so we neglect the cavity coupling to manifold. Experimentally, we confirm this by noting that when the atom is in , the cavity reflectivity is the same as if there were no atom coupled to it.
A system consisting of a cavity and a multi-level atom is described by the Hamiltonian kimble_hyperfine :
| (1) |
where and are the lowering operators for the atomic and cavity excitations respectively, is the single-photon Rabi frequency between the cavity and the excited state , and is the resonance frequency between and . Each excited state decays into free space at a rate , and cavity decays at a total rate , out of which is into the collected waveguide mode.
To model the incoherent population decays from the atomic excited states and the cavity mode, we define the Lindblad jump operators and . We use individual decay operators instead of the cumulative decay operator because MHz is much smaller than the hyperfine splittings in the excited states of MHz, so we can neglect the interference between the spontaneously emitted photons. We confirm this by numerically modelling and comparing both cases.
The system dynamics can be described with Heisenberg-Langevin equations of the form
| (2) |
where . After solving for , the reflectivity can be obtained from the input-output relation:
| (3) |
| (4) |
The resulting system of equations reads:
| (5) |
| (6) |
We are interested in the frequency response of the reflection to a weak drive of frequency . Since the steady-state population in is negligible in this weak excitation limit, we can substitute . Solving these equations, we obtain the reflectivity
| (7) |
where and . The expression has the same format as the one for multiple emitters coupled to the same cavity mode ruffin and can be extended by modifying the sum to include multiple emitters. The cooperativity associated with the -th transition is . The reflection spectra are measured as .
V.1 Atomic motion in the cavity mode
Nanophotonic structures confine photons to sub-wavelength mode volumes. The longitudinal confinement is a m long gaussian envelope, and the transverse confinement is given by the evanescent field of decay with the characteristic length of nm jeff_science . Moreover, the mode intensity is longitudinally modulated with the lattice constant of nm. Due to these spatial variations, an atom with thermal motion will be subjected to a fluctuating coupling strength.
The variation of the atomic position depends on its temperature and confinement length scale. Given the motional radial frequency measured to be kHz, we obtain the size of of the atomic wavefunction of nm in the radial direction of the tweezer at K (our temperature after polarization gradient cooling). As the atoms are transported to the cavity, the trapping potential gains additional axial confinement from the reflection of the tweezer off of the structure jeff_science . The process of potential distortion from a gaussian beam to a standing wave can introduce heating to the atom. From separate measurements of the coherence times between two magnetic sublevels in the ground state at varying tweezer depths similar to temp_est , we estimate the upper bound for our temperature at the cavity to be K, corresponding to a wavefunction size of nm in the radial direction of the tweezer.
The standing wave formed in the axial direction results in a higher axial frequency of kHz, and a spatial confinement of nm. This tight confinement is crucial for the operation since the evanescent field decays sharply in the axial direction. Fig. S6 shows the variation of the cavity mode in the x- and z- directions, overlapped with our estimates of the lower and upper bound on wavefunction size at K and K.
To account for the cavity field sampling, we model the cooperativity , which is proportional to the field intensity , to vary in the two directions as
| (8) |
where nm, nm, and is the cooperativity the atom would experience in the absence of motion at its center position . Note that we have neglected the slowly-varing envelope in the direction along the standing wave with the characteristic mode length of 4 m as well as the variation in the direction.
V.2 Cooperativity estimation
To model our experimental reflection spectrum (e.g. Fig. 1d, main text) and extract an estimate for the associated cooperativity, we combine the expression for reflectivity in Eq.(7) with the spatial dependence of the cooperativity in Eq.(8). To produce a spectrum, we sample atomic positions in the and directions (as defined in Fig. S6a) from normal distributions with standard deviations and respectively and generate a reflectivity averaged over multiple values of the resulting cooperativities. The fit parameters consist of , , and the cooperativity amplitude in Eq.(8) associated with transition to each excited state .
The best fit (Fig. S7a) for the data according to this model yields nm, nm, consistent with our temperature estimates of K. The cooperativity associated with the line of interest is in the absence of motion. The histogram of the cooperativity distribution associated with the spectrum is shown in Fig. S7b, yielding the mean of , and the standard deviation of 66(4). The uncertainties are determined by bootstrapping.
The value of extracted is consistent with our independent estimate of the field strength at the surface of the PC of which evanescently decays down to at 260 nm away from the PC. The single-photon Rabi frequency at the surface (corresponding to the maximum cooperativity of ) is calculated from the single-photon electric field of , estimated for the mode volume jeff_science . The biggest deviation from the model occurs in the height of the and lines. Some of the effects neglected in this model include decays to ground state and repumping from it (which could explain the reduced heights), the motion in the direction, heating during probing, and trap pointing uncertainty.
The two-atom spectrum (FIG 2, main text) is taken with atoms placed m away from the mode center. We now focus on the line, which is also the transition we use in the dispersive regime. The fit to the single-atom reflectivity at this position is shown in the Fig. S8. The wavefunction size nm, nm, is the same as in the Fig. S7, whereas , corresponding to the mean single-atom cooperativity of and the standard deviation of , averaged over two atoms. The reduction of the mean cooperativity is expected from the mode profile shown in Fig. 2c in the main text. The two-atom reflection spectrum is generated based on both single-atom spectra with no additional parameters.
The spectra in the dispersive regime taken with nonzero light shifts (Fig. 3b, 4, main text) are analyzed with the same model. In addition, we take into account the effect of fluctuating light shift due to atomic motion. We extract MHz at , consistent with our cooperativity estimate for the resonant regime.
References
- (1) T. G. Tiecke, K. P. Nayak, J. D. Thompson, T. Peyronel, N. P. de Leon, V. Vuletić, and M. D. Lukin, “Efficient fiber-optical interface for nanophotonic devices," Optica 2, 70-75 (2015).
- (2) E. R. I. Abraham and E. A. Cornell, “Teflon feedthrough for coupling optical fibers into ultrahigh vacuum systems," Appl. Opt. 37, 1762-1763 (1998).
- (3) S. Gröblacher, J. T. Hill, A. H. Safavi-Naeini, J. Chan, and O. Painter, “Highly efficient coupling from an optical fiber to a nanoscale silicon optomechanical cavity,” Appl. Phys. Lett. 103, 181104 (2013).
- (4) J. Chan, M. Eichenfield, R. Camacho, and O. Painter, "Optical and mechanical design of a “zipper” photonic crystal optomechanical cavity," Opt. Express 17, 3802-3817 (2009).
- (5) T. G. Tiecke, J. D. Thompson, N. P. de Leon, L. R. Liu, V. Vuletić and M. D. Lukin, “Nanophotonic quantum phase switch with a single atom," Nature 508, 241-244 (2014).
- (6) E. D. Black, “An introduction to Pound-Drever-Hall laser frequency stabilization,” Am. J. Phys. 69, 79 (2001).
- (7) N. Schlosser, G. Reymond, and P. Grangier, “Collisional Blockade in Microscopic Optical Dipole Traps,” Phys. Rev. Lett. 89, 023005 (2002).
- (8) D. Hümmer, P. Schneeweiss, A. Rauschenbeutel, and O. Romero-Isart, “Heating in Nanophotonic Traps for Cold Atoms,” (2019), arXiv:1902.02200v2.
- (9) S. Kuhr, W. Alt, D. Schrader, I. Dotsenko, Y. Miroshnychenko, A. Rauschenbeutel, and D. Meschede, “Analysis of dephasing mechanisms in a standing-wave dipole trap,” Phys. Rev. A 72, 023406 (2005).
- (10) J. D. Thompson, T. G. Tiecke, A. S. Zibrov, V. Vuletić, and M. D. Lukin, “Coherence and Raman Sideband Cooling of a Single Atom in an Optical Tweezer,” Phys. Rev. Lett. 110, 133001 (2013).
- (11) K. M. Birnbaum, A. S. Parkins, and H. J. Kimble, “Cavity QED with multiple hyperfine levels", Phys. Rev. A 74, 063802, (2006).
- (12) R. E. Evans, M. K. Bhaskar, D. D. Sukachev, C. T. Nguyen, A. Sipahigil, M. J. Burek, B. Machielse, G. H. Zhang, A. S. Zibrov, E. Bielejec, H. Park, M. Lončar, M. D. Lukin, “Photon-mediated interactions between quantum emitters in a diamond nanocavity,” Science 362, 662-665 (2018).
- (13) J. D. Thompson, T. G. Tiecke, N. P. de Leon, J. Feist, A. V. Akimov, M. Gullans, A. S. Zibrov, V. Vuletić, and M. D. Lukin, “Coupling a single trapped atom to a nanoscale optical cavity,” Science 340, 1202-1205 (2013).
- (14) Kuhr, S. and Alt, W. and Schrader, D. and Dotsenko, I. and Miroshnychenko, Y. and Rauschenbeutel, A. and Meschede, D., ”Analysis of dephasing mechanisms in a standing-wave dipole trap,” Phys. Rev. Lett. 72, 023406 (2005).