A Break in Spiral Galaxy Scaling Relations at the Upper Limit of Galaxy Mass
Abstract
Super spirals are the most massive star-forming disk galaxies in the universe (Ogle et al., 2016, 2019). We measured rotation curves for 23 massive spirals111Based on observations made with the Southern African Large Telescope (SALT) and find a wide range of fast rotation speeds (240-570 km s-1), indicating enclosed dynamical masses of . Super spirals with mass in stars break from the baryonic Tully-Fisher relation (BTFR) established for lower mass galaxies. The BTFR power-law index breaks from to above a rotation speed of km s-1. Super spirals also have very high specific angular momenta that break from the Fall (1983) relation. These results indicate that super spirals are undermassive for their dark matter halos, limited to a mass in stars of . Most giant elliptical galaxies also obey this fundamental limit, which corresponds to a critical dark halo mass of . Once a halo reaches this mass, its gas can no longer cool and collapse in a dynamical time. Super spirals survive today in halos as massive as , continuing to form stars from the cold baryons they captured before their halos reached critical mass. The observed high-mass break in the BTFR is inconsistent with the Modified Newtonian Dynamics (MOND) theory (Bekenstein & Milgrom, 1984).
1. Introduction
Super spiral galaxies are extreme by many measures, with r-band luminosities of , stellar masses of , and giant isophotal diameters of kpc (Ogle et al., 2016, 2019). They represent a very rare population of massive disk galaxies in which star formation has not quenched. As such, they provide a unique opportunity to extend studies of galaxy scaling laws into an entirely new regime.
The discovery of flat, high-velocity rotation curves firmly established the presence of dark matter in galaxies (Bosma, 1978; Rubin et al., 1978). Dark matter halos (White & Rees, 1978; Navarro et al., 1997; Gao et al., 2008) are fundamental to galaxy formation, forming the scaffolding for gas accretion and star formation. Though the composition of dark matter remains unknown, it is a crucial component of -Cold Dark Matter (CDM) cosmology, describing the expansion history of the universe. The rotational angular momenta of galaxies may be imparted by torques on their primordial dark matter halos by the surrounding irregular matter distribution prior to their collapse (Fall, 1979; Fall & Efstathiou, 1980). When the baryons cool and collapse, they spin up, retaining most of their original angular momentum. The specific angular momentum of galaxies generally increases following the Fall (1983) relation .
The high rotation speeds of galaxies have alternatively been attributed to a breakdown in Newtonian dynamics in the regime of low gravitational acceleration (Milgrom, 1983; Lelli et al., 2017). In particular, the Modified Newtonian Dynamics theory (MOND) suggests a specific form for the gravitational potential that leads to flat rotation curves and obviates the need for dark matter (Bekenstein & Milgrom, 1984).
The Tully-Fisher relation (TFR: Tully & Fisher, 1977) between galaxy optical (-band) luminosity and H I line width has played an important role in galaxy evolution studies and mapping galaxy peculiar velocities in the local universe (e.g., Willick et al., 1997; Haynes et al., 1999; Freudling et al., 1999; Springob et al., 2007; Tully et al., 2016). Substituting I-band or mid-infrared (MIR) for -band photometry reduces the scatter in the TFR because of reduced extinction and smaller scatter in mass-to-light ratio (e.g., Giovannelli et al., 1994; Tully & Curtois, 2012; Lagatutta et al., 2013; Sorce et al., 2013; Neill et al., 2014; Zaritsky et al., 2014; Lelli et al., 2016). The resultant infrared Tully-Fisher relation (ITFR) relates mass in stars to the rotation velocity and gravitational potential of the baryonic plus dark dynamical mass within radius : .
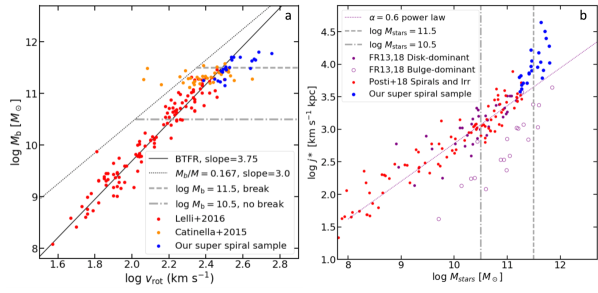
For spiral galaxies with , the ITFR has a power-law index of (Lelli et al., 2016). This is greater than the index of 3.0 that would be predicted under the assumption of constant stellar mass fraction (McGaugh et al., 2012), indicating that star-formation efficiency increases with for galaxies in this mass range. Massive spiral galaxies with may be the most efficient at converting gas into stars, with low gas fractions and high stellar mass fractions that approach the cosmic baryon fraction of 0.167 (Posti et al., 2019a, b; Komatsu et al., 2009). Adding in the neutral gas masses of spirals gives a tighter relation that removes the low-mass break in the TFR for dwarf galaxies (McGaugh et al., 2000, 2012; Lelli et al., 2016). This baryonic Tully-Fisher relation (BTFR) demonstrates a strong connection between the cold baryonic (stars cold atomic and molecular gas) and dark matter content of spiral galaxies. The slope and scatter of the BTFR depend in detail on the prescription used to estimate the mass-to-light ratio of stars and which galaxy samples are selected (McGaugh & Schombert, 2015; Sorce & Guo, 2016; Ponomareva et al., 2018). Evidence for a flatter ITFR slope is found for high-redshift galaxies (Christensen & Hjorth, 2017). However, MOND predicts a BTFR slope of exactly 4.0, and any deviation from this is at odds with that theory.
The shape of the TFR should reflect that of the stellar-mass/halo-mass (SMHM) relation, constructed by matching galaxies drawn from the observed luminosity function to simulated dark halos and subhalos (Kravtsov et al., 2004; Hopkins et al., 2010; Moster et al., 2013; Behroozi et al., 2013). The SMHM relation has a characteristic break at , corresponding to the observed break in the Schechter (1976) luminosity function at . Since the dark matter halo mass function is scale-invariant, this break in star formation efficiency must reflect the baryonic physics of galaxy formation and evolution. It is commonly attributed to a transition from stellar feedback to AGN feedback dominance (e.g., Dekel & Birnboim, 2006; Croton et al., 2006; Schaye et al., 2015; Su et al., 2019). However, the BTFR does not show a break at the same scale (Trujillo-Gomez et al., 2011; Desmond, 2012), pointing to a different SMHM relation for spirals and ellipticals (Posti et al., 2019b).
Previous studies of the BTFR have been limited to galaxies with stellar masses , because galaxies with higher masses are quite rare and because it is difficult to detect H i at . The extreme stellar masses and sizes of super spirals allow us to probe spiral disk dynamics and massive galaxy dark matter halos at radii of up to kpc. We use optical long-slit spectroscopy of the H line to measure the rotation curves of 23 massive spirals and place them on the BTFR.
We assume a CDM cosmology with km s-1 Mpc-1, and to derive all distances, linear sizes, and luminosities.
2. Sample and Observations
We selected our rotation curve sample (Table 1) from parent samples selected by -band or -band luminosity. First, we selected galaxies with inclination from the OGC sample of super spirals with and Sloan Digital Sky Survey (SDSS) -band luminosity (Ogle et al., 2019). Next, because extinction in the disk limits the number of high-inclination galaxies in the OGC, we created a new sample of IR-selected massive spirals drawn from the set of 2 Micron All-Sky Survey Extended Source Catalog (2MASX) galaxies with SDSS-measured redshifts, , -band luminosity , and -band isophotal diameter kpc. The -band luminosity and criteria were designed to yield a sample that overlaps Ogle et al. (2019) super spirals, which have and kpc.
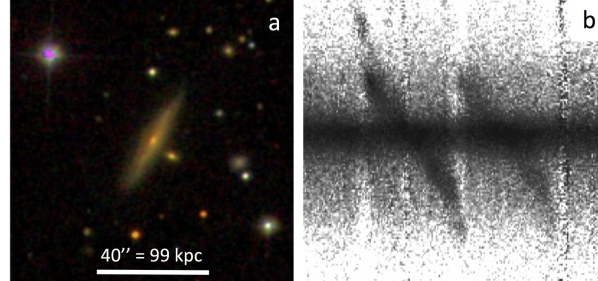
We observed 3 massive spirals with the Double Spectrograph (DBSP) on the Hale Telescope and 20 with the Robert Stobie Spectrograph (RSS: Burgh et al., 2003; Kobulnicky et al., 2003) on the Southern African Large Telescope (SALT: Buckley et al., 2006)222SALT programs 2018-2-SCI-027, 2019-1-SCI-028, PI: T. Jarrett. We placed a wide, long slit along the -band major axis of each galaxy. We used the DBSP red 1200 line mm-1 grating, yielding a dispersion of 0.300 pixel-1 and a resolving power of 6000. The spectral resolution is 50 km s-1 at H and the plate scale is pixel-1. At SALT, we used the RSS p1800 line mm-1 holographic grating together with the pc04600 order blocking filter. With 2x2 pixel on-camera binning, this grating gives a resolving power of . The spectral resolution is 71 - 57 km s-1 at H and the plate scale is pixel-1.
Exposures were median-combined to remove cosmic ray tracks, yielding exposure times of 30-70 minutes. Spectra were rectified and wavelength-calibrated using night-sky lines. We subtracted sky foreground emission using regions above and below the spectra. Galaxy continuum profiles were measured from adjacent spectral continuum regions, scaled and subtracted. The resulting 2D spectra were median-filtered with a 3x3 pixel kernel to improve S/N. We measured the rotation curve (Fig. 1) from the weighted centroid wavelength of the H emission line, up-weighting high-surface brightness regions to mitigate the effect of dilution from regions at lower projected velocity inside the slit. This diluting emission can be seen as fainter emission at lower velocity (Fig. 1b). The zero point of the rotation curve was set to minimize the asymmetry between the approaching and receding sides. The rotation curve was then sampled at intervals of , to match the seeing conditions and the maximum rotation speed measured from the sampled rotation curve. The standard deviation of the difference between the rotation curve and its spline interpolation gives the uncertainty in the rotation speed at the sampled points. The smaller linear size of the H disks compared to the H I disks of spiral galaxies does not produce any significant difference between their optical and H i velocity widths (Kannappan et al, 2002), allowing a direct comparison.
3. Rotation Speed and Dark Matter Content
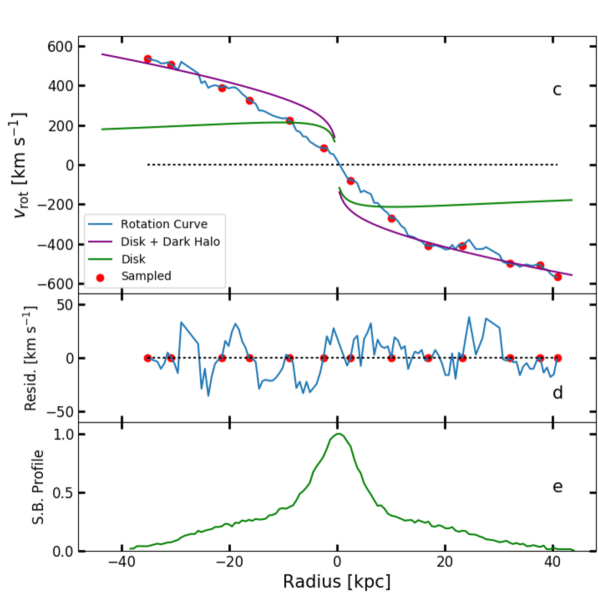
We find de-projected super spiral maximum rotation speeds of 243-568 km s-1 at radii of kpc (Table 1). The rotation curves of most super spirals follow the typical pattern of rising from the galaxy center, then flattening at large radii. In two cases (OGC 1304 and OGC 0586), deviations from regular rotation are seen, indicating that the disks may be warped at their outer edges. We conservatively discard these edge points before measuring . The rotation curves of the two largest, most massive galaxies (OGC 0139 and 2MFGC 12344) continue to rise at the outer edge. This may lead to an underestimate of the maximum circular velocity. The galaxy OGC 0139 also has a high uncertainty of 90 km s-1 in because of the large velocity dispersion in two blobs at either edge of its rotation curve.
We separately integrate the gravitational potential from stars and gas (both assumed to lie in a thin disk) and a spherical dark matter halo following a Navarro, Frenk, & White (NFW) density profile (Navarro et al., 1997) and compare the resulting model rotation curves to the observed rotation curves (Fig. 1(c)). The contribution of dark matter to the rotation curve of the fastest rotator, 2MFGC 12344, exceeds the contribution from stars at radii kpc and continues to rise out to kpc. The model over-predicts the rotation speed at kpc, indicating that there is a deficit of rotational support, with gas following non-circular orbits in this inner region of the galaxy, perhaps indicating the presence of a stellar bar (e.g., Kassin et al., 2006). We modeled the rotation curves of all galaxies in our sample using this same method to estimate the mass of dark matter () within the galaxy (Table 1). We find a large range of inside the region probed by the rotation curves, corresponding to the large range in maximum rotation speed.
4. Baryonic Mass
Estimates of total mass in stars from galaxy luminosity depend on filter bandpass and assumed mass to light ratio, which have a direct effect on the overall normalization of the TFR (McGaugh & Schombert, 2015). We use two methods to estimate and compare their scatter relative to one another and the resulting scatter in the TFR. First, we estimate from our custom WISE -band (3.4 m) photometry, assuming . Our measurements are in good agreement with estimated by Lelli et al. (2016) for their sample from Spitzer IRAC [3.6]-band luminosity and , with scatter driven by photometric uncertainties of . Next, we estimate from WISE -band luminosity and estimated from color, using the prescription of Cluver et al. (2014). This empirical relation was derived by comparing -band luminosity to stellar mass estimated via stellar-population synthesis models (Taylor et al., 2011). This estimate is systematically offset from the constant estimate, yielding lower values and a significant difference in slope for the TFR in the mass range . Because it results in lower scatter for the ITFR over the full mass range probed, we use our WISE -band estimates with constant for all galaxies in our sample and comparison samples. Based on color, only 2MFGC 10372 has significant AGN contamination of its - and -band flux measurements. This has no significant impact on our -based estimates of and , but we regard our -based SFR and estimates for this galaxy as upper limits.
Our efforts to measure the H I masses of super spirals at Arecibo and with the Green Bank Telescope (GBT) have so far been thwarted by strong radio-frequency interference (RFI) at their redshifted H I frequencies. Instead, we estimate the mass in cold gas via the Kennicutt (1998) Schmidt (KS) law, which relates the SFR and cold gas mass (H I H2) surface densities. We estimate SFR surface density from WISE -band luminosity, using the prescription of Cluver et al. (2017), and the -band isophotal diameter . This results in gas masses of (Table 1) and gas fractions of . The relatively low cold gas fractions are typical for massive spiral galaxies (Lelli et al., 2016). Using the same method for the gas-rich Catinella & Cortese (2015) sample, we find that they fall on average 0.36 dex to the right (and below) the KS relation. We adopt an uncertainty for our KS-derived values equal to the observed scatter of 0.3 dex in the KS relation (Kennicutt, 1998), which translates to an uncertainty of only 0.05 dex in .
5. Discussion and Conclusions
5.1. Baryonic Tully-Fisher and Fall Relations
The BTFR (Fig. 2(a)) relates the total baryonic mass () to the dynamical mass at the radius where the rotation curve becomes flat. It is instructive to compare the observed BTFR to the expectation for a baryon fraction equal to the cosmic mean baryon fraction of (Komatsu et al., 2009), which would yield a logarithmic slope of 3.0. Real galaxies fall short of this, with in the range 0.1-0.5, depending on galaxy mass. Dwarf galaxies with retain only 10% of their share of baryons and are the least efficient, converting only 20% of that into stars. Spiral galaxies with hold onto 50% of their cosmic share of baryons and are the most efficient, converting up to 70% of that into stars.
We find that super spirals with km s-1 deviate from the established BTFR, with relatively low for their high rotation velocities (Fig. 2(a)). Including these galaxies, the BTFR breaks at a characteristic mass scale of . Fitting the BTFR for the 10 fastest rotating super spirals gives a power-law slope of that is much flatter than the low-mass BTFR slope of found by Lelli et al. (2016). Fitting all 23 massive spirals gives a power-law slope of . The slopes for these two fits differ by and , respectively, from the low-mass BTFR slope. We emphasize that this high-mass break in the BTFR was not readily apparent before the discovery of extremely massive, fast-spinning super spirals, which are extremely rare (Ogle et al., 2016, 2019).
The large departure of super spirals from a power-law BTFR with slope 4.0 is inconsistent with MOND. The only way to reconcile our observations with MOND is a large mass of un-observed baryons inside the radii probed by our rotation curves. The fastest rotator in our sample (2MFGC 12344) would require and , factors of 5 and 50 greater than our estimates, respectively, to match the low-mass BTFR. The observed radial acceleration of m s-2 deviates significantly from the prediction of Newtonian mechanics if there is no dark matter, and is close to the characteristic acceleration scale for MOND ( m s-2, Lelli et al., 2017). Hence, super spirals are probing a regime where MOND would apply if it were correct. However, the radial accelerations observed in super spiral disks are greater than the MOND prediction, reflecting their high rotation speeds and deviation to the right of the MOND-predicted BTFR.
| Name | Alt. Name | aaRedshift from SDSS DR13. | bbIsophotal diameter (kpc) at mag arcsec-2. | ccExponential disk scale length and inclination fit from SDSS images (Simard et al., 2011). | ccExponential disk scale length and inclination fit from SDSS images (Simard et al., 2011). | ddDark halo mass () inside , estimated from our fit to the rotation curve, assuming an NFW profile. | eeMass in stars () estimated from -band luminosity, assuming =0.6. | ffGas mass () estimated from SFR and , using the Kennicutt (1998) Schmidt Law. | SFRggStar formation rate estimated from WISE 12 m band using relation of Cluver et al. (2017). | hhMaximum deprojected speed (km s-1) at radius (kpc) measured from sampled rotation curve, and standard deviation. | (kpc)hhMaximum deprojected speed (km s-1) at radius (kpc) measured from sampled rotation curve, and standard deviation. |
|---|---|---|---|---|---|---|---|---|---|---|---|
| 2MASX J093945840845033 | 0.13674 | 76 | 11.1 | 62 | 11.9 | 11.45 | 10.7 | 1.44 | 322 ( 9) | 14 | |
| SDSS J095727.02083501.7 | OGC 0441 | 0.25652 | 88 | 17.0 | 39 | 12.1 | 11.60 | 10.4 | 1.03 | 444 (15) | 31 |
| 2MASX J102226480911396 | 0.09130 | 92 | 14.5 | 76 | 11.8 | 11.42 | 10.5 | 1.22 | 311 (12) | 33 | |
| 2MASX J103042630418219 | OGC 0926 | 0.16092 | 70 | 8.7 | 48 | 11.7 | 11.66 | 10.7 | 1.53 | 342 (12) | 30 |
| 2MASX J110528430736413 | 2MFGC 08638 | 0.15229 | 144 | 47.0 | 85 | 12.5 | 11.59 | 10.8 | 1.38 | 465 (13) | 54 |
| 2MASX J112320390018029 | 0.14454 | 104 | 18.9 | 79 | 12.1 | 11.43 | 10.6 | 1.25 | 436 (11) | 45 | |
| 2MASX J114835520325268 | 0.11984 | 88 | 17.3 | 80 | 11.9 | 11.42 | 10.5 | 1.13 | 324 (12) | 31 | |
| 2MASX J115356214923562 | OGC 0586 | 0.16673 | 90 | 15.7 | 63 | 11.5 | 11.64 | 10.8 | 1.58 | 305 (11) | 19 |
| 2MASX J124225640056492 | 0.07936 | 52 | 6.8 | 54 | 11.4 | 11.24 | 10.2 | 1.01 | 279 (10) | 14 | |
| 2MASX J125926300146580 | 0.08311 | 67 | 10.4 | 61 | 11.8 | 11.23 | 10.2 | 0.91 | 318 (10) | 20 | |
| 2MASX J130330750214004 | 2MFGC 10372 | 0.08425 | 71 | 8.3 | 82 | 11.8 | 11.37 | 308 ( 8) | 23 | ||
| SDSS J143447.86020228.6 | OGC 1312 | 0.27991 | 75 | 11.6 | 63 | 11.9 | 11.60 | 10.7 | 1.55 | 344 ( 6) | 26 |
| 2MASX J151546140235564 | 2MFGC 12344 | 0.14068 | 120 | 21.9 | 81 | 12.5 | 11.74 | 10.7 | 1.35 | 568 (16) | 41 |
| 2MASX J154040570009331 | 0.07830 | 71 | 12.2 | 67 | 11.8 | 11.39 | 10.4 | 1.10 | 304 ( 8) | 30 | |
| 2MASX J160140612718161 | OGC 1304 | 0.16440 | 82 | 11.4 | 59 | 12.3 | 11.63 | 10.6 | 1.37 | 453 (25) | 29 |
| 2MASX J161840030034367 | 0.16731 | 95 | 24.6 | 77 | 12.0 | 11.67 | 10.6 | 1.28 | 384 (16) | 40 | |
| 2MASX J163945984609058 | OGC 0139 | 0.24713 | 134 | 33.0 | 76 | 12.2 | 11.74 | 10.9 | 1.65 | 483 (90) | 31 |
| 2MASX J205419570055204 | 0.21014 | 84 | 14.7 | 66 | 11.9 | 11.41 | 10.6 | 1.38 | 317 (13) | 37 | |
| 2MASX J213622060056519 | 0.10370 | 75 | 11.8 | 65 | 11.8 | 11.47 | 10.4 | 1.08 | 336 (11) | 29 | |
| 2MASX J213843110052162 | 0.08291 | 60 | 8.5 | 58 | 11.8 | 11.20 | 9.9 | 0.50 | 299 (12) | 15 | |
| 2MASX J214318820820164 | 0.06241 | 54 | 9.9 | 76 | 11.7 | 11.13 | 9.9 | 0.55 | 317 (13) | 18 | |
| 2MASX J220731220729223 | 0.06331 | 60 | 8.6 | 73 | 11.6 | 11.20 | 10.3 | 1.00 | 243 (13) | 31 | |
| 2MASX J231305130033477 | 0.11107 | 53 | 8.2 | 53 | 11.6 | 11.20 | 10.3 | 1.03 | 292 ( 8) | 19 |
The specific angular momentum of galaxies increases with , following the Fall (1983) relation (Fig. (2b)), which is related to the BTFR via the -radius relation. The power-law index of this scaling relation for spirals () and for ellipticals () differ from the theoretical index for dark matter halos (), reflecting differences in angular momentum retention for the two types of galaxy (Fall & Romanowsky, 2013; Posti et al., 2018). We estimate the specific angular momentum for our sample of super spirals as , which holds true for pure exponential disks with characteristic radius . We take from Simard et al. (2011), who fit the SDSS images with DeVaucouleurs bulges plus exponential disks. We compare our sample to the spiral and elliptical samples of Fall & Romanowsky (2013, 2018) and the spiral and dwarf sample of Posti et al. (2018), the latter drawn from the Lelli et al. (2016) BTFR sample. We find very high specific angular momenta which break from the Fall relation at , similar to the break we find in the Tully-Fisher relation. The Fall relation connects galaxy spin to halo spin, allowing us to estimate the dark halo mass of super spirals. The halo masses that are required to put super spirals on an extrapolated Fall relation range from . The most massive of these super spiral halos is similar to that of a typical galaxy group.
5.2. Galaxy Mass Limit
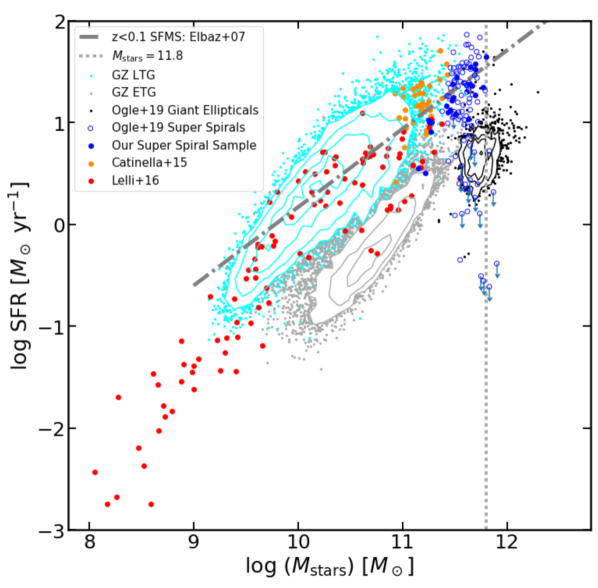
We suggest that the high-mass breaks in the BTFR and the Fall relation at are imposed by an upper limit to the cold baryonic mass in galaxies. Including our sample and the super spiral sample of Ogle et al. (2019), we find a maximum baryonic mass of () for super spiral OGC 0139, which is slightly more massive than the previous record-holder, ISOHDFS:[RFA2002] S27 (Rigopolou et al., 2002). The same mass upper limit may apply to elliptical and lenticular as well as spiral galaxies. The majority of OGC giant ellipticals and super lenticulars (Ogle et al., 2019) do have lower than the most massive super spiral (Fig. 3). We suggest that the giant ellipticals and super lenticulars that exceed the limit (by up to a factor of 2) may be the product of major mergers.
The observed upper limit to galaxy mass in stars agrees with the theoretical prediction of the maximum halo mass where gas can cool and collapse within a dynamical time (White & Rees, 1978), but only if we assume that nearly all of the baryons in super spiral and giant elliptical subhalos have been incorporated into stars at the current epoch. For an initial power-law density perturbation spectrum with amplitude and no metal enrichment, White & Rees (1978) predict a maximum galaxy halo mass of , which is close to the maximum enclosed dark mass in our super spiral sample (). For a stellar mass fraction equal to of cosmic baryon fraction, this corresponds to the observed maximum mass in stars of .
The excess specific angular momentum in super spirals can be explained if it is inherited from host halos that are up to 10 times more massive than . In general, sub-halos will have lower values than their host halos, following the Fall relation, and when they merge they will create even lower elliptical galaxies. However, a dominant central galaxy may share the specific angular momentum of its host halo if it is formed at the halo center and subsequently cools and collapses to form a high- super spiral.
The continuing star formation in massive spirals appears to buck the trend of star-formation quenching in galaxies with . This so-called ”failed feedback” problem (Posti et al., 2019b) may be resolved if these massive spiral galaxies are immune to quenching. The super spirals that have survived must be robust against the various proposed quenching agents, including mergers, AGN feedback, virial shocks, and ram-pressure stripping. If super spirals formed in dominant subhalos located at the centers of group-mass halos, they must not have suffered major mergers after the bulk of their stars were formed, and are not subject to ram-pressure stripping. The giant gas disks of super spirals must also be immune to disruption by AGN feedback from the supermassive black holes in their relatively small bulges.
References
- Behroozi et al. (2013) Behroozi, P. S., Wechsler, R. H., & Conroy, C. 2013, ApJL, 762, 31
- Bekenstein & Milgrom (1984) Bekenstein, J., & Milgrom, M. 1984, ApJ, 286, 7
- Binney (1977) Binney, J. J. 1977, ApJ, 215, 483
- Bosma (1978) Bosma, A. 1978, PhD thesis, Groningen Univ.
- Buckley et al. (2006) Buckley, D. A. H., Swart, G. P., & Meiring, J. G. 2006, SPIE, 6267, 32
- Burgh et al. (2003) Burgh, E. B., Nordsieck, K. H., Kobulnicky, H. A. et al. 2003, SPIE, 4841, 1463
- Catinella & Cortese (2015) Catinella, B. & Cortese, L. 2015 MNRAS, 446, 3526
- Christensen & Hjorth (2017) Christensen L., & Hjorth, J. 2017, MNRAS, 470, 2599
- Cluver et al. (2017) Cluver, M. E., Jarrett, T. H., Dale, D. A. et al. 2017, ApJ, 850, 68
- Cluver et al. (2014) Cluver, M. E., Jarrett, T. H., Hopkins, A. M. et al. 2014, ApJ, 782, 90
- Croton et al. (2006) Croton, D. J. , Volker, S., White, S. D. M. et al. 2006, MNRAS, 365, 11
- Dekel & Birnboim (2006) Dekel, K. & Birnboim, Y. 2006, MNRAS, 368, 2
- Desmond (2012) Desmond, H. 2012, 2018 arXiv:1204.1497
- Elbaz et al. (2007) Elbaz, D., Daddi, E., Le Borgne, D. et al. 2007
- Fall & Romanowsky (2018) Fall, S. M. & Romanowsky, A. J. 2018, AJ, 868, 133
- Fall & Romanowsky (2013) Fall, S. M. & Romanowsky, A. J. 2013, ApJL, 769, 26
- Fall (1983) Fall, S. M. 1983, in IAU Symp. 100, Internal Kinematics and Dynamics of Galaxies, ed. E. Athanassoula (Cambridge: Cambridge Univ. Press), 391
- Fall & Efstathiou (1980) Fall, S. M. & Efstathiou, G. 1980, MNRAS, 193, 189
- Fall (1979) Fall, S. M. 1979, Natur, 281, 200
- Freudling et al. (1999) Freudling, W., Zehavi, I., da Costa, L. N. et al. 1999, ApJ, 523, 1
- Gao et al. (2008) Gao, L. Navarro, J. F., Cole, S. et al. 2008, MNRAS, 387, 536
- Giovannelli et al. (1994) Giovanelli, R., Haynes, M. P., Salzer, J. J. et al. 1994, AJ, 107, 2036
- Haynes et al. (1999) Haynes, M. P., Giovanelli, R., Chamaraux, P. et al. 1999, AJ, 117, 2039
- Hopkins et al. (2010) Hopkins, P. F., Bundy, K., Croton, D. et al. 2010, ApJ, 715, 202
- Kannappan et al (2002) Kannappan, S. J., Fabricant, D. G., & Franx, M. 2002, AJ, 123, 2358
- Kassin et al. (2006) Kassin, S. A., de Jong, R. S., & Weiner, B. J. 2006, ApJ, 643, 804
- Kennicutt (1998) Kennicutt, R. 1998, ApJ, 498, 541
- Kobulnicky et al. (2003) Kobulnicky, H. A., Nordsieck, K., H., Burgh, E. B. et al. 2003, SPIE, 4841, 1634
- Komatsu et al. (2009) Komatsu, E., Dunkley, J., Nolta, M. R. et al. 2009, ApJS, 180, 330
- Kravtsov et al. (2004) Kravtsov, A. V., Gnedin, O. Y., & Klypin, A. A. 2004, ApJ, 609, 35
- Lagatutta et al. (2013) Lagatutta, D. J., Mould, J. R., Staveley-Smith, L. et al. 2013, ApJ, 771, 88
- Lelli et al. (2017) Lelli, F., McGaugh, S., S., Schombert, J. M., & Pawlowski, M. S. 2017, ApJ 836, 152
- Lelli et al. (2016) Lelli, F., McGaugh, S., S., & Schombert, J. M. 2016, ApJ 816, L14
- McGaugh & Schombert (2015) McGaugh, S. S., & Schombert, J. M. 2015, ApJ, 802, 18
- McGaugh et al. (2012) McGaugh, S. S. 2012, AJ, 143, 40
- McGaugh et al. (2000) McGaugh, S. S., Schombert, J. M., Bothun, G. D., & de Blok, W. J. G. 2000, ApJL, 533, 99
- Milgrom (1983) Milgrom, M. 1983, ApJ, 270, 371
- Moster et al. (2013) Moster, B. P., Naab, T., & White, S. D. M.
- Navarro et al. (1997) Navarro, J. F., Frenk, C. S., & White, S. D. M. 1997, ApJ, 490, 493
- Neill et al. (2014) Neill, J. D., Seibert, M., Tully, R. B. et al. 2014, ApJ, 792, 129
- Ogle et al. (2019) Ogle, P., Lanz, L, Appleton, P. N., Helou, G., & Mazzarella, J. 2019, ApJS, 243, 14
- Ogle et al. (2016) Ogle, P. M., Lanz, L., Nader, C., & Helou, G. 2016, ApJ, 817, 109
- Ponomareva et al. (2018) Ponomareva, A. A., Verheijen, M. A., Papastergis, E., Bosma, A., & Peletier, R. F. 2018, MNRAS, 474, 4366
- Posti et al. (2019b) Posti, L., Marasco, A., Fraternali, F., & Famaey, B. 2019, arXiv1909.01344
- Posti et al. (2019a) Posti, L., Fraternali, F., & Marasco, A. 2019, A&A, 626, 56
- Posti et al. (2018) Posti, L., Fraternali, F., DeTeodoro, E. M., & Pezzulli, G. 2018, A&A, 612, L6
- Rees & Ostriker (1977) Rees, M. J. & Ostriker, J. P. 1977, MNRAS, 179, 541
- Rigopolou et al. (2002) Rigopolou, D., Franceschini, A., Aussel, H. et al. 2002, ApJ, 580, 789
- Rubin et al. (1978) Rubin, V. C., Ford, W. K. & Thonnard, N. 1978, ApJL, 225, 107
- Schaye et al. (2015) Schaye, J. Crain, R. A., Bower, R. G. et al. 2015, MNRAS, 446, 521
- Schechter (1976) Schechter, P. 1976, ApJ, 203, 297
- Silk (1977) Silk, J. I. 1977, ApJ, 211, 638
- Simard et al. (2011) Simard, L., Mendel, J. T., Patton, D., R., Ellison, S. L., & McConnachie, A. W. 2011, ApJS, 196, 11
- Sorce et al. (2013) Sorce, J. G., Courtois, H. M., Tully, R. B. et al. 2013, ApJ, 765, 94
- Sorce & Guo (2016) Sorce, J. G & Guo, Q. 2016, MNRAS, 458, 2667
- Su et al. (2019) Su, K.-Y., Hopkins, P. F., Hayward, C. C. et al. 2019, MNRAS, 487, 4393
- Springob et al. (2007) Springob, C. M., Masters, K. L., Haynes, M. P., Giovanelli, R., & Marinoni, C. 2007, ApJS, 172, 599
- Taylor et al. (2011) Taylor, E. N., Hopkins, A. M., Baldry, I. K. et al. 2011, MNRAS 418, 1587
- Tully & Curtois (2012) Tully, R. B., & Curtois, H. M. 2012, ApJ, 749, 78
- Tully et al. (2016) Tully, R. B., Courtois, H. M., & Sorce, J. G. 2016, AJ, 152, 50
- Tully & Fisher (1977) Tully, R. B. & Fisher, J. R. 1977, A&A, 54, 661
- Trujillo-Gomez et al. (2011) Trujillo-Gomez, S., Klypin, A., Primack, J., & Romanowsky, A. J. 2011, ApJ, 742, 16
- White & Rees (1978) White, S. D. M., & Rees, M. J. 1978, MNRAS, 183, 341
- Willick et al. (1997) Willick, J. A., Courteau, S., Faber, S. M. et al. 1997, ApJS, 109, 333
- Zaritsky et al. (2014) Zaritsky, D. Curtois, H., Munoz-Mateos, J.-C. et al. 2014, AJ, 147, 134