Ultimate Photo-Thermo-Acoustic Efficiency of Graphene Aerogels
The ability to generate, amplify, mix, and modulate sound with no harmonic distortion in a passive opto-acoustic device would revolutionize the field of acoustics. The photo-thermo-acoustic (PTA) effect allows to transduce light into sound without any bulk electro-mechanically moving parts and electrical connections, as for conventional loudspeakers. Also, PTA devices can be integrated with standard silicon complementary metal-oxide semiconductor (CMOS) fabrication techniques. Here, we demonstrate that the ultimate PTA efficiency of graphene aerogels, depending on their particular thermal and optical properties, can be experimentally achieved by reducing their mass density. Furthermore, we illustrate that the aerogels behave as an omnidirectional point-source throughout the audible range with no harmonic distortion. This research represents a breakthrough for audio-visual consumer technologies and it could pave the way to novel opto-acoustic sensing devices.
Introduction
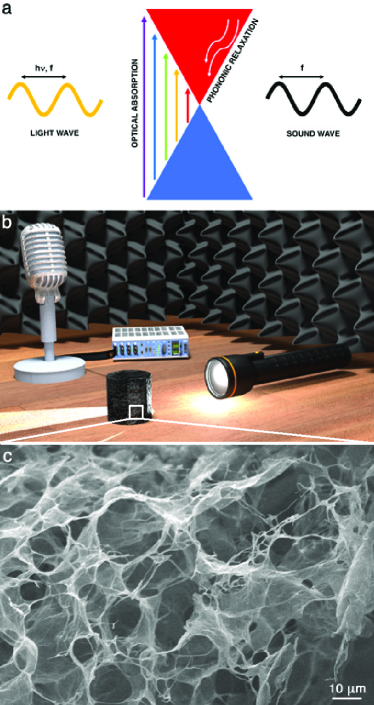
The photo-thermo-acoustic (PTA) effect Tian2015 ; Giorgianni2018 ; Rosencwaig1976 is a two-stage process: a photo-thermal effect followed by a thermo-acoustic effect Vesterinen2010 ; Hu2010 ; Arnold1917 . From a microscopic perspective, when light with photon energy modulated in intensity at a frequency shines on a material, the absorbed photons excite the electrons by intraband or interband transitions. Such excited states relax to the ground state by emitting optical and acoustic phonons. It has been well-established that the energy relaxation of energetic charge carriers is mediated by electron-phonon interactions, leading to a hot lattice temperature and then to an efficient photo-thermal process occurring on the order of picoseconds Ashcroft1976 ; Bonaccorso2010 . Then, the material adiabatically heats the ambient air molecules at the frequency . Such a temperature oscillation produces a density oscillation in the gas by thermal contraction and expansion of a thin layer of air, which accordingly varies its pressure above and below the ambient atmospheric pressure, leading to a coherent generation of longitudinal sound waves. This second stage is the thermo-acoustic process. In Figure 1a, the PTA effect is sketched for graphene, for example.
The root-mean-square sound pressure amplitude of a PTA wave can be derived by a general analytical solution of the PTA model (see Supplementary Information 1), as follows
| (1) |
with the frequency of sound, the amplitude of the power of the light with wavelength absorbed by the material, the far-field distance from the sound source, the thermal effusivity of the material and the medium , with the thermal conductivity, the mass density, and the specific heat capacity at constant pressure, the medium (air) temperature, a frequency-dependent factor, and the far-field directivity. From the above equation is evident that efficient thermo-acoustic sound generation can be achieved by meeting a single condition: heat should flow efficiently to the surrounding medium (i.e., the material effusivity should match air effusivity ). The condition can be satisfied by employing a very thin material with low heat capacity per unit area (HCPUA) , where is the material thickness, therefore high thermal conductivity , for instance graphene Tian2011 ; Tian2012 ; Suk2012 ; Xu2013 ; Tian2014 ; Tian2015 ; Kim2016a ; Tao2017 ; Heath2017 ; or a porous material with high HCPUA and low , for example aerogels Giorgianni2018 ; Kim2016 ; Fei2015 ; Aliev2015 . However, in the former case heat conduction to air is typically hindered by heat loss in the material supporting substrate. Furthermore, ultrablack DeNicola2017 materials with quasi-blackbody absorptivity represent the best choice for PTA sound generation. This should rule out the use of two-dimensional materials, due to their low absorptivity. For instance, single-layer graphene has a constant low absorptivity from the infrared to the visible range Bonaccorso2010 . Moreover, conductors over semiconductors and insulators are preferred, owing to the their gapless optical spectrum.
Here, we demonstrate that a graphene aerogel having can emit omnidirectional sound with no harmonic distortion by PTA effect. In particular, we experimentally achieved the ultimate PTA efficiency of such aerogels by tuning their mass density.
Results and Discussion
The scheme of the experimental setup is reported in Figure 1b (see Methods). Graphene aerogels were synthesized by a solvothermal process of reduced graphene oxide Wu2015 . The samples have a transversal size cm and a thickness cm, with a mass mg. From the scanning electron microscopy (SEM) micrographs in Figure 1c, it is possible to observe the fractal random network of graphene flakes that constitute the aerogels. Such a porous system cannot be treated as an homogeneous solid, therefore the effective medium approximation must be considered in order to estimate its mass density. By contact angle measurements (see Supplementary Information 2), we carefully estimated an aerogel porous fraction , leading to an effective mass density down to kg/m3 (see Supplementary Information 2). Furthermore, all the samples exhibit a reflectivity from the infrared to the ultraviolet range, hence an absorptivity (see Supplementary Information 3). The aerogel average heat capacity is J/K, while their average thermal conductivity and diffusivity are W/mK and m2/s, respectively (see Supplementary Information 4). Therefore, the minimum effusivity obtained for the samples is Ws1/2/m2K, which matches well the value for air Ws1/2/m2K Callen1985 .
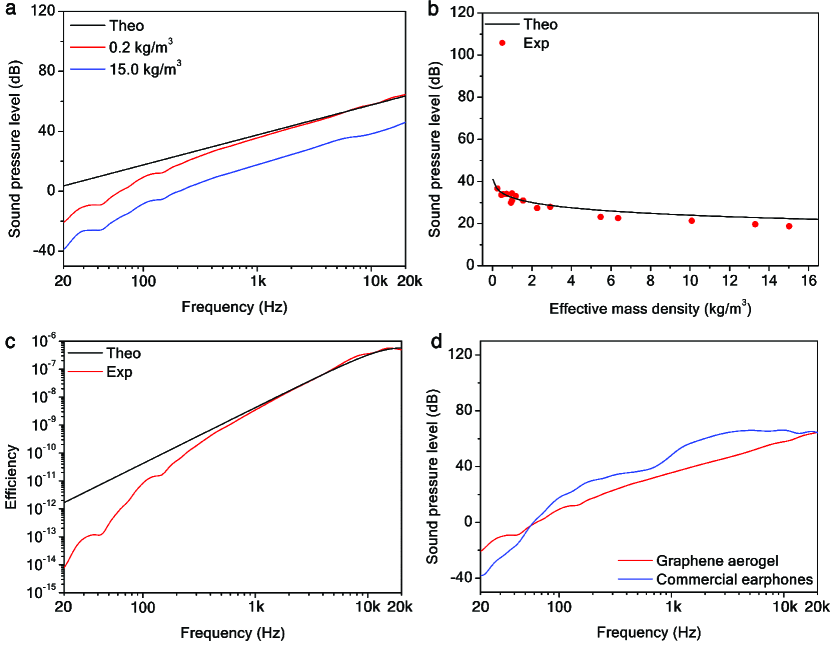
In Figure 2a, the sound frequency response at the input power of 1 W and recorded at 1 m distance from the source, according to the Audio Engineering Society standard for acoustic measurements (AES02-1984-r2003), for two graphene aerogels with different mass density is shown. It can be observed that the ultimate theoretical sound pressure level Everest2001 (SPL) , with Pa the root-mean-square pressure of the minimum audible threshold, is achieved for the lower density. Experimental data departs from the PTA analytical model (see Supplementary Information 1) with no free parameters below 200 Hz, where the modal resonances due to the finite size of the sound-proof room decrease the signal-to-noise ratio. Moreover, by fitting the curve with the PTA model, leaving the sample effusivity as the only free parameter, the fit returns Ws1/2/m2K, which is in great agreement with the value obtained by the thermal characterization of the samples. In Figure 2b, the SPL dependence on the sample density at 1 W/1 m/1 kHz is illustrated along with the PTA model with no free parameters. The relation between SPL and density sets an asymptotic density kg/m3 for which the material effusivity matches that of the medium.
The PTA efficiency (i.e., the ratio between the output acoustic power and input light power) at 1 W/1 m for the graphene aerogel with lower density along the limiting theoretical curve (see Supplementary Information 1) are reported in Figure 2c. For instance, we achieved an ultimate efficiency at 1 W/1 m/1 kHz. On the other hand, the thermodynamic efficiency of the PTA process is given by a Carnot cycle Vesterinen2010 ; Aliev2015 between two heat reservoirs of temperature K and K. Since graphene aerogels behave as a quasi-blackbody, evidently 61% of the radiative heat provided is emitted in the environment without generation of sound. However, the relevant figure of merit for loudspeakers is not the efficiency but the sensitivity Everest2001 (i.e., the SPL relative to the maximum audible threshold of 120 dB). Despite the PTA efficiency is rather low for the aerogels, their sensitivity is -80 dB that is well above the minimum audible threshold (-120 dB) Everest2001 and it is the highest reported for thermo-acoustic devices (Supplementary Information 5). By comparison, commercial earphones have an electro-acoustic efficiency about and a sensitivity of -72 dB at 1 W/1 m/1 kHz (Figure 2d), which is close to the value for graphene aerogels due to their similar surface area. Therefore, graphene aerogels could be successfully used as PTA earphones. The sensitivity of graphene aerogels could be further increased in order to exploit them as loudspeakers, for instance by increasing their surface area so that the sound emitted by every point on the illuminated surface coherently adds up to increase the SPL.
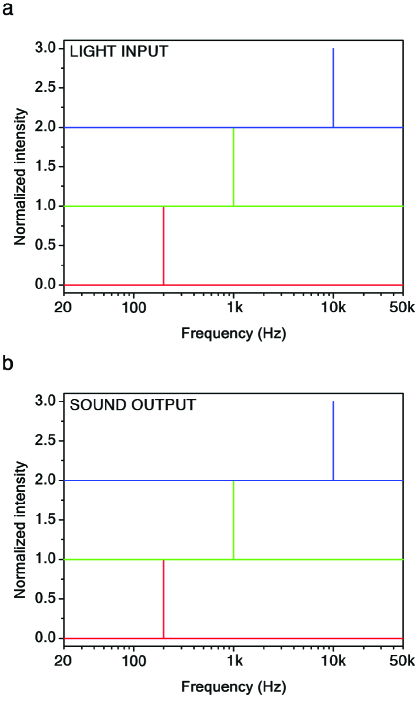
In Figure 3 (a, b), the frequency response of the input (light) and output (sound) signals are respectively depicted in the bass (200 Hz), mid (1 kHz), and treble (10 kHz) range in order to estimate the total harmonic distortion Everest2001 (THD) of the sound generated from the graphene aerogel with the lowest density. We observed no THD in graphene aerogels over the whole audible range. In particular, no harmonic distortion is present in the treble range, where the human voice frequencies are typically louder Everest2001 . It is worth noting that the PTA effect does not provide any second harmonic generation, likewise the thermo-acoustic effect does due to Joule heating Heath2017 . This is because the sample heating is radiative (see Supplementary Information 4). By comparison, commercial hi-fi loudspeakers and earphones typically have a THD about 1% (see Supplementary Information 5).
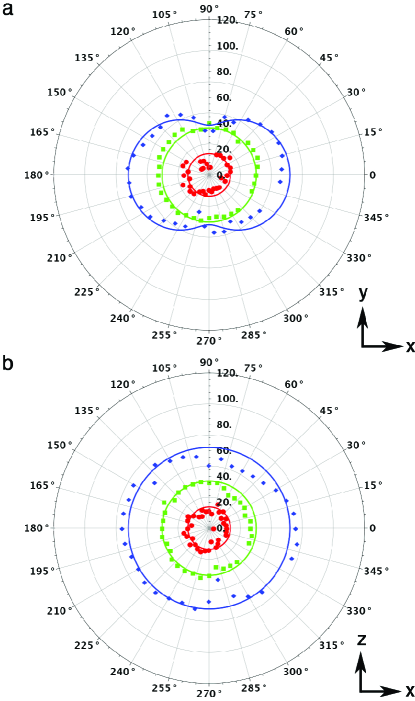
In Figure 4 (a, b), the theoretical and experimental directivity Beranek1993 of the sound emitted at 1 W/1 m from the graphene aerogel with lowest density is reported for the bass (200 Hz), mid (1 kHz), and treble (10 kHz) ranges in the azimuthal and polar planes, respectively. The samples behave as an omnidirectional point source up to 20 kHz, beyond which they present a dipolar pattern. Since there are no electro-mechanically moving parts, the sound is equally generated with no destructive interference from both the sides of the illuminated spot of the aerogel, which acts as a diaphragm of thermal thickness m-1 mm (see Supplementary Information 1), depending on the sound frequency. Therefore, no bass reflex technique Beranek1993 is needed in PTA loudspeakers.
In conclusion, graphene aerogels can be employed as PTA loudspeakers with omnidirectional emission and no harmonic distortion in the audible range. We demonstrated that the theoretical limiting efficiency of such loudspeakers can be achieved simply by tailoring their mass density. Therefore, graphene aerogel loudspeakers may offer a valid alternative to commercial electro-mechanical earphones and in general hi-fi loudspeakers, provided that the illuminated spot is sufficiently large. Moreover, we believe that PTA loudspeakers could pave the way to novel opto-acoustic sensing devices and metrology applications.
Methods
The experimental setup was placed in a sound-proof room ( m) in order to acoustically insulate the experimental apparatus from environmental noise and to reduce internal sound reflections. The audio signal flow was calibrated in an anechoic chamber at the National Institute for Insurance against Accidents at Work (INAIL). Light was generated by a panchromatic LED source (Thorlabs) controlled by a custom LED driver connected to a PC by RME Fireface UFX sound card. Light was modulated in intensity by a sine wave generated by Room EQ Wizard (REW) software. The emitted light was focused on the graphene aerogel and the generated sound was acquired by a calibrated microphone (Earthworks M50) connected to the sound card and placed in front of the sample at a fixed distance of cm for near-field measurements and m for far-field measurements. Gated measurements Everest2001 were carried out in order to record the sample sound frequency response without any sound reflections, as in anechoic chamber. The sample dynamic range acquired as a function of the sound frequency, was divided by the background noise of the room and smoothed at 1/3 per octave. Therefore, here the SPL corresponds to the signal-to-noise ratio. Directivity patterns were measured by a goniometric stage with the sample fixed in the center, the microphone rotating around the sample, and the LED placed outside the stage. The commercial earphones (Apple earpods) and the commercial (Soundvision) loudspeakers were driven by a sine wave generated by REW software.
References
- (1) Tian, Y. et al. Coherent generation of photo-thermo-acoustic wave from graphene sheets. Sci. Rep. 5, 105821–105828 (2015).
- (2) Giorgianni, F. et al. High-efficiency and low distortion photoacoustic effect in 3D graphene sponge. Adv. Funct. Mater. 28, 17026521–17026528 (2018).
- (3) Rosencwaig, A. & Gersho, A. Theory of the photoacoustic effect with solids. J. Appl. Phys. 47, 64–69 (1976).
- (4) Vesterinen, V., Niskanen, A. O., Hassel, J. & Helistö, P. Fundamental efficiency of nanothermophones: Modeling and experiments. Nano Lett. 10, 5020–5024 (2010).
- (5) Hu, H., Zhu, T. & Xu, J. Model for thermoacoustic emission from solids. Appl. Phys. Lett. 96, 2141011–2141013 (2010).
- (6) Arnold, H. D. & Crandall, I. B. The thermophone as a precision source of sound. Phys. Rev. 10, 22–38 (1917).
- (7) Ashcroft, N. W. & Mermin, D. N. Solid State Physics (Holt, Rinehart and Winston, Austin, 1976).
- (8) Bonaccorso, F., Sun, Z., Hasan, T. & Ferrari, A. C. Graphene photonics and optoelectronics. Nat. Photonics 4, 611–622 (2010).
- (9) Tian, H. et al. Graphene-on-paper sound source devices. ACS Nano 5, 4878–4885 (2011).
- (10) Tian, H. et al. Single-layer graphene sound-emitting devices: experiments and modeling. Nanoscale 4, 2272–2277 (2012).
- (11) Suk, J. W., Kirk, K., Hao, Y., Hall, N. A. & Ruoff, R. S. Thermoacoustic sound generation from monolayer graphene for transparent and flexible sound sources. Adv. Mater. 24, 6342–6347 (2012).
- (12) Xu, S. C. et al. Flexible and transparent graphene-based loudspeakers. Appl. Phys. Lett. 102, 1519021–1519024 (2013).
- (13) Tian, H. et al. Wafer-scale integration of graphene-based electronic, optoelectronic and electroacoustic devices. Sci. Rep. 4, 35981–35989 (2014).
- (14) Kim, C. S. et al. Free-standing graphene thermophone on a polymer-mesh substrate. Small 12, 185–189 (2016).
- (15) Tao, L.-Q. et al. An intelligent artificial throat with sound-sensing ability based on laser induced graphene. Nat. Commun. 8, 145791–145798 (2017).
- (16) Heath, M. S. & Horsell, D. W. Multi-frequency sound production and mixing in graphene. Sci. Rep. 7, 13631–13639 (2017).
- (17) Kim, C. S. et al. Application of n-doped three-dimensional reduced graphene oxide aerogel to thin film loudspeaker. ACS Appl. Mater. Interfaces 8, 22295−22300 (2016).
- (18) Fei, W., Zhou, J. & Guo, W. Low-voltage driven graphene foam thermoacoustic speaker. Small 11, 2252–2256 (2015).
- (19) Aliev, A. E. et al. Alternative nanostructures for thermophones. ACS Nano 9, 4743–4756 (2015).
- (20) De Nicola, F., Hines, P., De Crescenzi, M. & Motta, N. Thin randomly aligned hierarchical carbon nanotube arrays as ultrablack metamaterials. Phys. Rev. B 96, 0454091–0454096 (2017).
- (21) Wu, Y. et al. Three-dimensionally bonded spongy graphene material with super compressive elasticity and near-zero poisson’s ratio. Nat. Commun. 6, 61411–61419 (2015).
- (22) Callen, H. B. Thermodynamics and an Introduction to Thermostatistics (John Wiley & Sons, New York, 1985).
- (23) Everest, F. A. Master Handbook of Acoustics (McGraw-Hill, New York, 2001).
- (24) Beranek, L. L. Acoustics (American Institute of Physics, Cambridge, MA, 1993).
Acknowledgements.
The authors acknowledge that this project has received funding from the European Union’s Horizon 2020 research and innovation programme under grant agreement No. 785219 - GrapheneCore2. The authors also acknowledge that this project has received the financial support of the Bilateral Cooperation Agreement between Italy and China of the Italian Ministry of Foreign Affairs and of the International Cooperation (MAECI) and the National Natural Science Foundation of China (NSFC), in the framework of the project of major relevance 3-Dimensional Graphene: Applications in Catalysis, Photoacoustics and Plasmonics. The authors also acknowledge D. Annesi for the audio signal flow calibration in anechoic chamber at the National Institute for Insurance against Accidents at Work (INAIL).Author contribution
F.D.N., L.D.T., I.V., R.J.Z., H.W.Z., A.M., and S.L. conceived the experiments. F.D.N. and L.D.T. performed the acoustic, thermal, electrical, and density characterization of the samples and data analysis. F.D.N. and I.V. carried out the contact angle measurements. F.D.N. computed the photo-thermo-acoustic simulations. R.J.Z. and H.W.Z. prepared the graphene samples. F.D.N. and S. L. wrote the paper with the contribution of all the authors.
The authors declare no competing interests.