Astrometric and photometric study of NGC 6067, NGC 2506 and IC 4651 open clusters based on wide-field ground and Gaia DR2 data
Abstract
We present an analysis of three southern open star clusters NGC 6067, NGC 2506 and IC 4651 using wide-field photometric and Gaia DR2 astrometric data. They are poorly studied clusters. We took advantage of the synergy between Gaia DR2 high precision astrometric measurements and ground based wide-field photometry to isolate cluster members and further study these clusters. We identify the cluster members using proper motions, parallax and colour-magnitude diagrams. Mean proper motion of the clusters in and is estimated as and mas yr-1 for NGC 6067, and mas yr-1 for NGC 2506 and and mas yr-1 for IC 4651. Distances are estimated as , and kpc for the clusters NGC 6067, NGC 2506 and IC 4651 respectively using parallaxes taken from Gaia DR2 catalogue. Galactic orbits are determined for these clusters using Galactic potential models. We find that these clusters have circular orbits. Cluster radii are determined as 10′ for NGC 6067, 12′ for NGC 2506 and 11′ for IC 4651. Ages of the clusters estimated by isochrones fitting are Myr, Gyr and Gyr for NGC 6067, NGC 2506 and IC 4651 respectively. Mass function slope for the entire region of cluster NGC 2506 is found to be comparable with the Salpeter value in the mass range 0.77 - 1.54 . The mass function analysis shows that the slope becomes flat when one goes from halo to core region in all the three clusters. A comparison of dynamical age with cluster’s age indicates that NGC 2506 and IC 4651 are dynamically relaxed clusters.
keywords:
Galaxy: kinematics and dynamics - open clusters and associations: general - open clusters and associations: individual (NGC 6067, NGC 2506, IC 4651)1 Introduction


Open star clusters are found in the plane of the Galaxy and span a large range in age and distance. It is easier to calculate parameters of stars in a cluster than field stars. All stars in a cluster are formed by the same molecular cloud and because of this they are dynamically associated with each other and have nearly same distance from us. This makes them an ideal object to study the evolution and dynamics of the Galactic disc. For such studies, it is very important to know their true members and basic parameters such as age, distance, metallicity, and reddening.
Since open clusters are usually projected against the Galactic disc stars, it is very difficult to isolate cluster members from field stars in the absence of radial velocity and proper motion data. Accurate proper motion data are required to eliminate field stars. The proper motion data provided by Gaia mission are very valuable to separate the cluster members from field stars. It is also expected that the Gaia mission will completely transform our knowledge of the structure and dynamics of the Galaxy (Gaia Collaboration et al., 2016a). The 2nd data release (DR2) of the Gaia mission contains 1.7 billion sources and was made public on 24th April 2018 (Gaia Collaboration et al., 2016a, b; Salgado et al., 2017; Jordi et al., 2010). The Gaia DR2 catalogue provides five-dimensional astrometric data (position, parallax, and proper motion), three-dimensional photometric data and spectroscopic data (Gaia Collaboration et al., 2018b). The data of Gaia DR2 are based on observations taken for 22 months (Lindegren et al., 2018).
Since open clusters orbit near the Galactic plane, they are constantly disturbed by tidal forces originating from Galactic disc and the molecular clouds present there. Due to this disturbance and dynamical evolution of the clusters, the structure of open clusters get changed (Lee et al., 2013). Orbits of open clusters are helpful to understand the effect of tides and also formation and evolution processes of clusters. The proper motion and radial velocity data provided by Gaia DR2 catalogue can be very helpful to study the kinematics of open clusters.
In this paper, we present wide-field optical photometry of three open star clusters namely NGC 6067, NGC 2506 and IC 4651. The main goal of this article is to investigate the parameters of clusters using the member stars selected from proper motion and parallax data. Apart from this, we also studied the galactic orbits and dynamical evolution of the clusters considering their member stars.
In section 2, we present a literature survey for the clusters under study. Section 3 describes observational data, methods of data reduction and calibration. The kinematical data are described in section 4. In section 5, orbits of the clusters are calculated. The basic parameters of the clusters are discussed in section 6. Luminosity, mass functions, and mass segregation are described in section 7. Results and conclusions are presented in section 8. The basic parameters of the clusters taken from WEBDA database are listed in Table 1.
| Cluster | (deg) | (deg) | (pc) | (dex) | ||||
|---|---|---|---|---|---|---|---|---|
| NGC 6067 | 16:13:11 | -54:13:06 | 329.74 | -2.20 | 1417 | 0.38 | 8.08 | +0.13 |
| NGC 2506 | 08:00:01 | -10:46:12 | 230.56 | 9.93 | 3460 | 0.08 | 9.04 | -0.37 |
| IC 4651 | 17:24:49 | -49:56:00 | 340.09 | -7.91 | 888 | 0.11 | 9.06 | +0.1 |
2 Previous studies
NGC 6067: NGC 6067 is a young open cluster of age years, superimposed on the Norma star cloud. Thackeray et al. (1962) studied this cluster first time and provided radial velocities and parallaxes for few stars. Engver (1966) determined cluster distance as 2100 pc using photographic data. Walker (1985) estimated distance modulus and reddening as and 0.35 mag respectively using CCD photometric data.
NGC 2506: NGC 2506 is an intermediate age open star cluster of age years. This was first studied by McClure et al. (1981) using photoelectric and photographic photometry and derived the age as years. Chiu & van Altena (1981) identified four blue stragglers stars in this cluster. Marconi et al. (1997) conducted CCD photometry and determined the cluster parameters as mag, age Gyr and mag. Lee et al. (2012) investigated this cluster using CCD data and calculated mag, age Gyr, dex and the mass function slope as in units of log(mass).
IC 4651: This is an intermediate age open star cluster of age years. Eggen (1971) estimated reddening mag using photographic data. Meibom (2000) have done CCD photometric study and estimated distance modulus as mag. Anthony-Twarog & Twarog (2000) studied this cluster using CCD photometry and derived the colour excess , [Fe/H] and mag. Biazzo et al. (2007) performed spectroscopic study of the cluster IC 4651 and calculated as and age as Gyr.
3 Observational data and reduction
3.1 Optical data
A large area of the cluster is necessary to study the complete census of the cluster. The Wide Field Imager (WFI) mounted on ESO/MPI telescope 2.2m at La Silla (Chile) is an ideal instrument to observe a large area of the clusters. WFI is a mosaic camera consisting of 42 i.e. 8 CCD chips. Since each CCD has an array of 20484096 pixels, WFI ultimately produces an image with a 3433 arcmin2 field of view. Knowing the capabilities of WFI, we searched CCD photometric data in ESO archive 111http://archive.eso.org/eso/eso_archive_main.html for the three clusters NGC 6067, NGC 2506 and IC 4651. A log of data of the observations is provided in Table 2. In total, 48 images for the cluster NGC 6067 in and band, 10 images for the cluster NGC 2506 in , and band and 8 images for the cluster IC 4651 in , and band are found suitable for our analysis. Along with science images, many bias and flat images are also taken to pre-reduct the science images.
3.2 Data reduction and calibration
For the photometric reductions, we followed the procedures outlined in Anderson et al. (2006). To pre-reduct the science images we adopted the standard procedure of bias subtraction and flat-fielding using package under . An empirical point-spread-function (PSF) for each image was constructed to find out the position and flux of stars. An array of 15 PSFs for each 20484096 chip was made. This is because of PSF changes with the position in the chip (Anderson et al., 2006). In this way, 120 PSFs were considered for the entire field of view (81928192 pixels) and saved in a look-up table on a very fine grid. To construct the PSF, we selected bright and isolated stars with an automatic code. To determine the positions and magnitude of the stars, an iterative procedure is designed to work from brightest to the faintest stars. Instrumental magnitudes were determined by applying exposure time and extinction coefficient (taken from La Silla site) correction for each filter.

| Band | Exposure Time | Date |
| (in seconds) | ||
| NGC 6067 | ||
| 10 8 | May 1999 | |
| 60 6 | " | |
| 300 6 | " | |
| 360 1 | " | |
| 10 6 | " | |
| 60 6 | " | |
| 300 8 | " | |
| 360 7 | " | |
| NGC 2506 | ||
| 30 1 | Nov 2000 | |
| 240 2 | " | |
| 30 1 | " | |
| 60 1 | Dec 2012 | |
| 240 1 | Nov 2000 | |
| 30 2 | " | |
| 240 2 | " | |
| IC 4651 | ||
| 20 1 | June 2000 | |
| 240 2 | " | |
| 240 2 | " | |
| 240 3 | " |
| Cluster | ||||||
|---|---|---|---|---|---|---|
| NGC 6067 | - | - | ||||
| NGC 2506 | ||||||
| IC 4651 |


To transform the instrumental magnitudes into Johnson and
Kron-Cousin standard magnitudes, we used the photometric data available in
the WEBDA database. For NGC 6067, photoelectric data by
Thackeray et al. (1962) was used. CCD photometric data from
Marconi et al. (1997) and data from Kim
et al. (2001) was considered for NGC 2506 calibration. For IC 4651,
CCD data from Kjeldsen &
Frandsen (1991) and data from Piatti
et al. (1998)
were used.
The transformation equations used for calibration are as follows
+
+
+
where , , and , , are the standards and instrumental magnitudes while , , and are the colour coefficients for , , and filters respectively. , and are the zero-points for respective filters. The colour coefficients and zero-points obtained during transformation for each cluster are listed in Table 3. We converted and position of stars into the right ascension (RA) and declination (DEC) of using and tasks in IRAF. The standard error in transformation is 75 mas in each coordinate. The identification map for the clusters under study are shown in Figures 1 and 2. Inner and outer circles show the core and cluster radius derived in the present study.
The rms of the residuals around the mean magnitude as a function of magnitude for each filter is shown in Fig. 3 for IC 4651. The photometric standard deviations are computed using multiple observations and then reduced to a common reference frame. Stars with mag have higher dispersion because of saturation. The average internal errors in our photometry in each filter are listed in Table 4. On average, photometric errors are lower than 0.01 mag for stars with mag.
| V | NGC 6067 | NGC 2506 | IC 4651 | |||||
|---|---|---|---|---|---|---|---|---|
| (mag) | ||||||||
| 12 - 14 | 0.024 | 0.032 | 0.015 | 0.008 | 0.031 | 0.006 | 0.017 | 0.014 |
| 14 - 16 | 0.014 | 0.018 | 0.010 | 0.005 | 0.019 | 0.006 | 0.017 | 0.014 |
| 16 - 18 | 0.010 | 0.012 | 0.006 | 0.006 | 0.010 | 0.006 | 0.014 | 0.009 |
| 18 - 20 | 0.011 | 0.012 | 0.006 | 0.008 | 0.010 | 0.008 | 0.015 | 0.012 |
4 Kinematical data and mean proper motion of clusters
Proper motion data are very valuable to distinguish cluster members from field stars and also to study the kinematics of open star clusters. The availability of such kind of data in Gaia DR2 catalogue has become very useful. Therefore, we retrieved kinematical data from the Gaia DR2 database (Gaia Collaboration et al., 2018a) for the clusters under study. We extracted all the Gaia DR2 sources within a radius of 15′ from the cluster centre of each cluster to get as complete as possible sample of cluster stars. The limiting magnitude for Gaia DR2 data is mag. Errors in trigonometric parallax are mas for sources having mag, mas for mag and mas for mag (Lindegren et al., 2018; Luri et al., 2018). Proper motion uncertainty is 0.2 mas for stars brighter than mag (Lindegren et al., 2018). The average errors of proper motions in different magnitude bins for the three clusters are listed in Table 5. The average errors are 0.07 mas in and 0.05 mas in .
| G | NGC 6067 | NGC 2506 | IC 4651 | |||
|---|---|---|---|---|---|---|
| (mag) | ||||||
| 10 - 12 | 0.067 | 0.057 | 0.066 | 0.046 | 0.091 | 0.085 |
| 12 - 14 | 0.072 | 0.061 | 0.065 | 0.047 | 0.082 | 0.077 |
| 14 - 16 | 0.054 | 0.046 | 0.049 | 0.035 | 0.062 | 0.059 |
| 16 - 18 | 0.064 | 0.054 | 0.056 | 0.040 | 0.072 | 0.069 |
| 18 - 20 | 0.069 | 0.066 | 0.053 | 0.051 | 0.073 | 0.071 |
4.1 Selection of cluster members and mean proper motion
To derive the reliable parameters of a cluster, it is very important to use genuine cluster members. The stars of a cluster share the same kinematical properties in the sky and have the same heliocentric distance. Because of this, proper motion and parallax are among the most reliable parameter to differentiate cluster members from the field stars. We used Gaia DR2 proper motion data and parallax data to select members and determine their mean proper motion. For this purpose, we matched our photometric catalogue with Gaia data and made a catalogue of common stars.
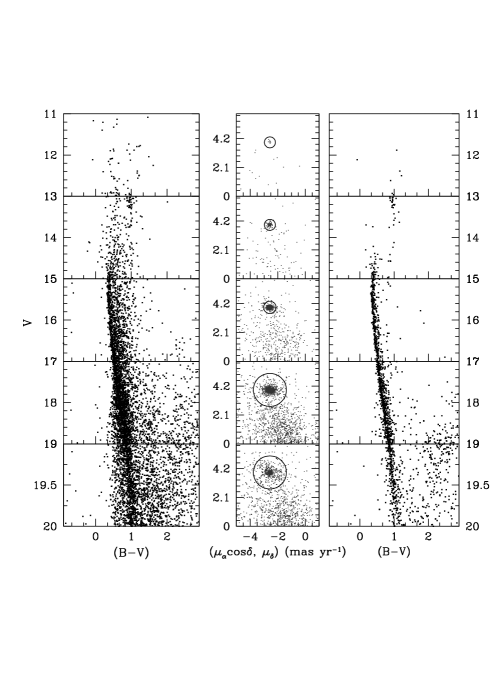
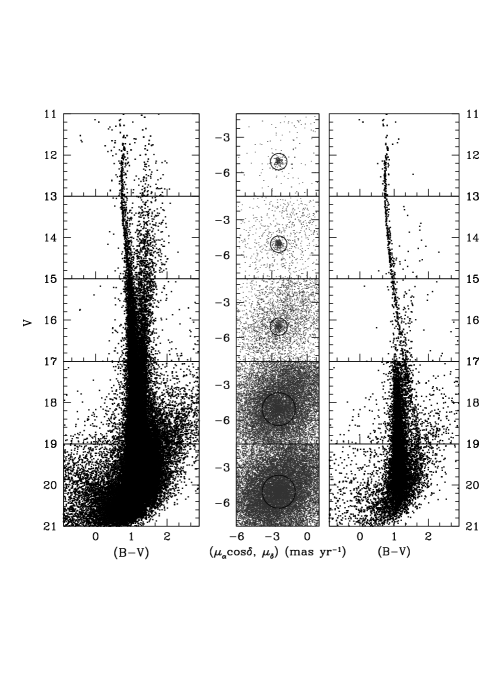
To see the distribution of cluster and field stars, we plotted vector point diagrams (VPD) in and . The vector point diagrams for the clusters NGC 6067, NGC 2506 and IC 4651 are shown in the middle panels of Fig. 4, 5 and 6 respectively along with versus colour-magnitude diagrams (CMD) in the left and right panels. The left panels display a complete sample of stars while right panels show the stars that based on their proper motion, have a high probability to be a cluster member. Vector point diagrams of the clusters show two distinct populations for each cluster. Clusters population are tightly distributed while field populations are scattered.
By visual inspection, we define the centre and radius of the cluster members’ proper motion distribution in VPD as shown in 4, 5 and 6. This selection was performed in a way to minimize the field contamination and to save as much as possible faint cluster members. The chosen circle radii are 0.5, 0.4 and 0.7 mas for NGC 6067, NGC 2506 and IC 4651 respectively. As expected, the fainter stars have larger measurement errors, therefore we selected stars with different circle radius in different magnitude bins as shown in the Figs. 4, 5 and 6. The new circle radius is chosen as , where is the eye estimated radius and is the proper motion error in the corresponding magnitude bin taken from Gaia Collaboration et al. (2018a).
In the right panels, the colour-magnitude diagrams of the stars located within the circles are plotted. These colour-magnitude diagrams show a clear sequence for all the three open star clusters under study. It is the first time when the main sequence of IC 4651 is resolved up to mag. However, some field stars are still visible in the lower part of the colour-magnitude diagram of IC 4651. This is because the distribution of these field stars is the same as cluster stars in the vector point diagram.
After selecting stars with vector point diagrams, we again selected members using mean parallax of the cluster. Parallax angles of stars in the clusters are available in Gaia DR2 catalogue. We calculated the arithmetic mean of the parallaxes for the stars inside the circle of vector point diagram having mag brighter than 17.0 mag. A star is considered as a most probable cluster member if it lies inside the circle in vector point diagram and has a parallax angle within from the mean cluster parallax. In this way, we obtained a total 2894, 1773 and 1947 number of most probable cluster members for the clusters NGC 6067, NGC 2506 and IC 4651 respectively. The colour-magnitude diagrams for most probable cluster members are shown in Fig. 11,12 and 13. A clean main sequence is visible in all the clusters under study. However, few field stars are still present in the colour-magnitude diagrams. Only the most probable cluster members obtained here are used for further investigations.
To calculate mean proper motions in and , we plotted the histograms which are shown in Fig. 7 for the clusters under study. The histograms are made by using stars brighter than 17 mag. A Gaussian function is fitted on the histograms to estimate the mean and standard deviation in and . In this way, the mean proper motions of the clusters are estimated as and mas for NGC 6067; and mas for NGC 2506 and , and mas for IC 4651.

4.2 The distance of the clusters using parallax angle
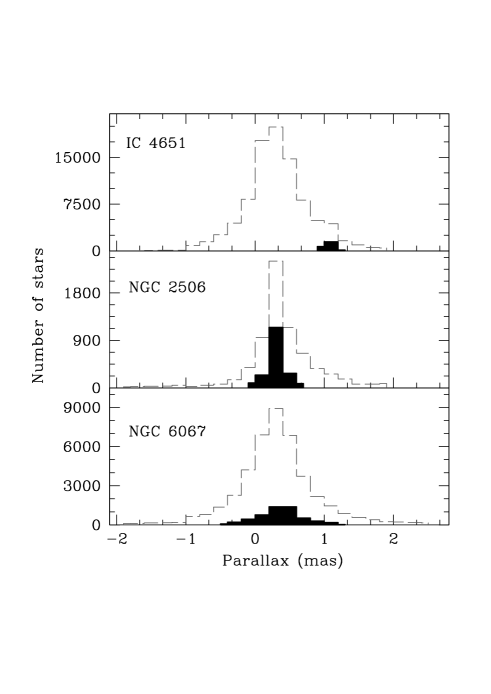
According to Luri et al. (2018) the correct approach to determine the average distance of a cluster is to average the parallaxes of cluster stars first and then obtain distance from the average parallax value. The parallax data in Gaia DR2 have their associated errors, so we determined the weighted mean of the parallaxes for most probable cluster members. After correcting for Gaia DR2 parallax zero-point (-0.046 mas) offset as suggested by Riess et al. (2018), the mean parallax angles are found to be , and mas for the clusters NGC 6067, NGC 2506 and IC 4651 respectively. In Fig. 8, we present parallax distributions of total stars in the cluster region and most probable cluster members, which are represented by the dashed gray line and filled boxes respectively. Histograms show that member stars for the clusters NGC 6067 and IC 4651 are more in comparison to NGC 2506.
Bailer-Jones (2015) have shown that the distance estimated by inverting the parallax is not reliable and give incorrect error estimates. The correct approach to determine distance and their uncertainties from the parallax are through a probabilistic analysis as described in Bailer-Jones (2015). By adopting the method described in Bailer-Jones et al. (2018), the distances are determined as , and kpc for the cluster NGC 6067, NGC 2506 and IC 4651 respectively. Mean parallax angles and corresponding heliocentric distances of the clusters are also listed in Table 6. An offset of 0.61 mas between the mean parallax of most probable members and all the stars in the field of IC 4651 is observed. We estimated the distance of non-probable cluster members of IC 4651 using the parallax distribution of field stars and found to be kpc. A comparison of this distance with the cluster’s distance implies that non-members are located behind the cluster IC 4651.


5 Orbits of the clusters
| Cluster | Parallax | Age | ||||||
|---|---|---|---|---|---|---|---|---|
| (deg) | (deg) | (mas) | (kpc) | (Myr) | (km/sec) | (mas/yr) | (mas/yr) | |
| NGC 6067 | 16:13:08.92 | -54:11:59 | 66 | |||||
| NGC 2506 | 08:00:07.87 | -10:46:33 | 2090 | |||||
| IC 4651 | 17:24:48.44 | -49:56:07 | 1590 |
| Cluster | ||||||
|---|---|---|---|---|---|---|
| (kpc) | (kpc) | (km/sec) | (km/sec) | (km/sec) | (radians) | |
| NGC 6067 | 5.61 | -0.09 | 0.27 | |||
| NGC 2506 | 10.84 | 0.69 | 0.28 | |||
| IC 4651 | 7.03 | -0.12 | 0.05 |
5.1 Initial conditions and Galactic model
We derive orbits and orbital parameters of the clusters under study, using Galactic potential models given by Miyamoto & Nagai (1975) and Wilkinson & Evans (1999). Input parameters used to calculate orbits are listed in Table 6. Central coordinates and of the clusters are taken from section 6.1. Mean proper motion (, ) and heliocentric distance () for the clusters are taken from section 4. The age of the clusters is considered as derived in section 6.2.
Since clusters are orbiting around the Galactic centre, we cannot use position and velocity vectors in the equatorial system. Therefore, we converted them into Galacto-centric cylindrical coordinate system using the transformation matrix given in Johnson & Soderblom (1987). In this system denotes the position of an object in Galaxy, where is a distance from Galactic centre, is angle relative to Sun’s position in Galactic plane and is the distance from Galactic plane.
We adopted the right-hand coordinate system to transform equatorial velocity components into Galactic-space velocity components (), where , and are radial, tangential and vertical velocities respectively. In this system, is taken positive towards Galactic-centre, is along the direction of Galactic rotation and is towards Galactic north pole. The Galactic centre is taken at () and North-Galactic pole is at () (Reid & Brunthaler, 2004). The velocity components of clusters for Local Standard of Rest (LSR) are calculated using space-velocity components of Sun given by Mihalas & Routly (1968) as () km/s. After that velocity are corrected for Galactic standard of rest (GSR) using position coordinates of Sun as () and velocity of LSR as 220 km/s. Transformed parameters in Galacto-centric coordinate system are listed in Table 7.
Radial velocity data for the clusters NGC 6067, NGC 2506 and IC 4651 are available for 26, 37 and 67 cluster members respectively in Gaia DR2 catalogue. Average radial velocities of the clusters are calculated by taking the mean for all stars and are found as , and km/s for the clusters NGC 6067, NGC 2506 and IC 4651 respectively.
For Galactic potentials, we adopted an approach
given by Allen &
Santillan (1991). According to their model, the mass of Galaxy is
described by three components: spherical central bulge,
massive spherical halo and disc. In the present model, we used
axis-symmetrical, time-independent and analytic potential models
for all three components. Also, all potentials and their spatial derivatives are
continuous everywhere.
We used Miyamoto &
Nagai (1975) potentials for bulge and disc regions,
and Wilkinson &
Evans (1999) potential
for halo region.
These potentials are given as
5.2 Orbits calculation
Using the initial conditions and Galactic potential model described in section 5.1, we calculated the orbits of the clusters under study. In orbit determination, we estimated the radial and vertical components of gravitational force, by differentiating total gravitational potentials with respect to and . The second-order derivatives of the gravitational force describe the motion of the clusters. The second-order derivatives are integrated backwards in time, which is equal to the age of clusters. NGC 6067 is a young cluster and has not yet completed one revolution around the Galactic centre. To calculate the eccentricity of its orbit, we integrate orbit up-to a time interval of 160 Myr. Since potentials used are axis-symmetric, energy and component of angular momentum are conserved throughout the orbits.
Fig. 9 shows orbits of the clusters NGC 6067, NGC 2506 and IC 4651. In left panels, the motion of clusters is described in terms of distance from Galactic centre and Galactic plane, which shows a two-dimensional side view of the orbits. In right panels, cluster motion is described in terms of and components of Galactocentric distance, which shows the top view of orbits.
We also calculated the orbital parameters for the clusters and are listed in Table 8. Here is the eccentricity, is apogalactic distance, is perigalactic distance, is maximum distance travelled by cluster from Galactic disc, is the average energy of orbits, is component of angular momentum and is the time period of the clusters in the orbits.
| Cluster | |||||||
|---|---|---|---|---|---|---|---|
| (kpc) | (kpc) | (kpc) | (100 kpc km/s) | (Myr) | |||
| NGC 6067 | |||||||
| NGC 2506 | |||||||
| IC 4651 |
The orbits of all three clusters under study follow a boxy pattern. The eccentricity of all the clusters is nearly zero. Hence they trace a circular path around the Galactic centre. From these orbits we determine, the birth and present-day position of clusters in the Galaxy and are denoted by the filled triangle and the filled circle in Fig. 9.
NGC 6067 being a young cluster has not yet completed even one revolution around the Galactic center as seen in Fig. 9. The motion of this cluster is confined inside the solar circle within a box of kpc and is oscillating near the Galactic plane. Similar behaviour of the orbit is also seen in Fig. 9 for the cluster IC 4651. This cluster is also orbiting inside the solar circle within a box of kpc and not very far from Galactic plane (=0.15 kpc).
NGC 2506 is the oldest (2.09 Gyr) cluster in our study. The eccentricity of the orbit of this cluster is which indicates a circular orbit around the Galactic centre. Orbit is confined in a box of kpc and therefore this cluster is not interacting with the inner region of the Galaxy. The similar results are also shown by Carraro & Chiosi (1994) for the cluster NGC 188. Webb et al. (2014) studied the effect of eccentricity on the evolution of clusters and concluded that clusters having eccentric orbits evolve faster than the clusters having circular orbits. So present analysis of the cluster NGC 2506 indicates that this cluster is evolving slowly. Being at a larger distance from Galactic centre, the effect of Galactic tidal forces on NGC 2506 will be less as compared to IC 4651. Because of this, in spite of having similar ages, NGC 2506 is more bound and compact than IC 4651.
Orbital parameters determined in the present analysis are very much similar to the parameters found by Wu et al. (2009), except that their orbits are more eccentric than what we found in the present analysis. According to Momany et al. (2006) the Galactic disk is warped and flared after kpc. NGC 2506 traces the Galaxy up-to a maximum distance of 13 kpc so it is orbiting near the warped and flared disk but its present-day position ( kpc) is slightly distant from the warped and flared disk.
6 Basic Parameters of the Clusters
6.1 Cluster centre and radius
Though open clusters are very sparse and loosely bound systems but at centre, maximum stellar density (number of stars per unit area) is observed. One can roughly estimate cluster centre by simply looking at the cluster. To determine cluster centre precisely, we calculated an average and positions of stars iteratively within 2000 pixels from eye estimated centre, until they converge to a constant value. We expect an error of a few tens of pixels in locating the cluster centre. In this way the central coordinates obtained are (3994, 4406), (4342,4246) and (4070, 4019) pixels for NGC 6067, NGC 2506 and IC 4651 respectively. The corresponding central coordinates of the clusters in the equatorial coordinate system are listed in Table 6. Present estimated values are similar to the values listed in Table 1 which are taken from the WEBDA database.
The wide-field images studied here for clusters under study
cover a large area which is sufficient enough
to derive the true cluster extent and radial surface density profile (RDP) of the
clusters.
We divided the entire cluster region into several concentric
rings of thickness around
the cluster center.
The stellar density
of each ring is calculated by dividing the number of stars
by area of that ring.
Stellar densities as a function
of cluster radius
are shown in Fig. 10 for all three clusters.
We fitted King (1962)
profile on the radial density profiles which is
shown by continuous curve in Fig. 10.
The King profile is given by:
where is the central density, is core radius and is the background density. Core radius is the distance from the cluster center at which the stellar density becomes half of the central density. The fitting gives different parameters of clusters which are listed in Table 9. The radius of clusters are determined as , and for the clusters NGC 6067, NGC 2506 and IC 4651 respectively. The stellar central densities show that NGC 2506 is a dense cluster in comparison to NGC 6067 and IC 4651 clusters.

| Cluster | Radius | |||
|---|---|---|---|---|
| NGC 6067 | 10 | |||
| NGC 2506 | 12 | |||
| IC 4651 | 11 |
6.2 Age and Distance of the clusters using isochrone fitting
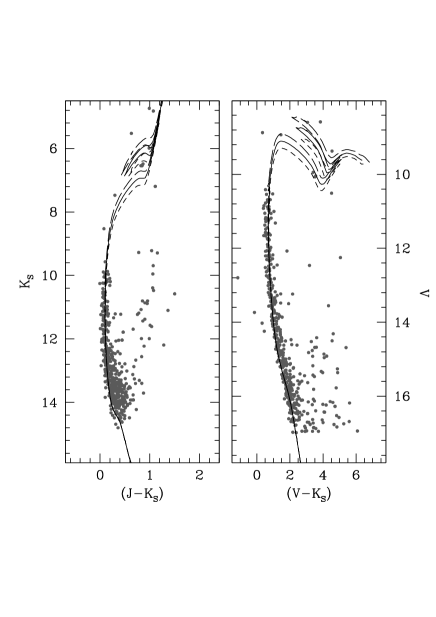
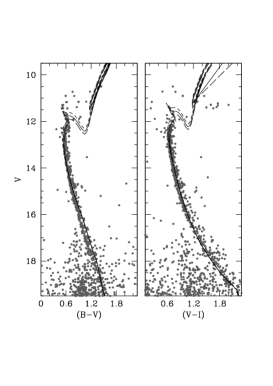
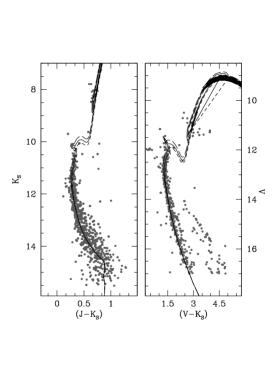
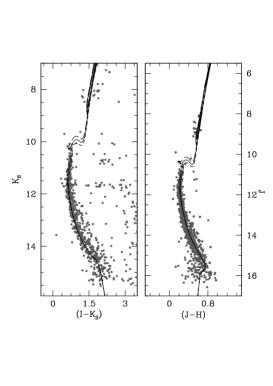
To determine age, metallicity and reddening of clusters, we used theoretical evolutionary isochrones given by Marigo et al. (2017) which are derived from the stellar evolutionary tracks computed with PARSEC (Bressan et al., 2012) and COLIBRI (Marigo et al., 2013) codes. They include thermally pulsating asymptotic giant branch phase for solar metallicity and (Caffau et al., 2011) with mixing length and [Fe] taken as 1.74 and zero respectively. For colour-magnitude diagrams, we considered only those stars which have a high probability to be cluster members based on the selection done in section 4.1. 2MASS data for cluster member stars are used to revisit the cluster parameters. The uncertainties in the age and distance reflect the range in these parameters that allows a reasonable fit to the cluster colour-magnitude diagram. The fitting of isochrones for the three clusters under study are discussed as follows;
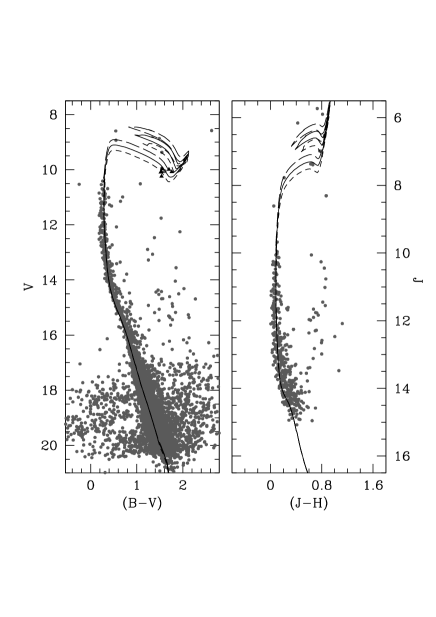
NGC 6067: We plotted colour-magnitude diagrams for the cluster in , , and planes as shown in Fig. 11. We performed several iterations by taking isochrones of different metallicity and age. The isochrones of and age ( ) Myr is satisfactorily fitted. The distance modulus is derived as mag, which gives heliocentric distance as kpc. This distance is comparable to the distance calculated by the parallax angle. Distance modulus derived by Alanso-Santiago et al. (2017) is much different than the present estimate. Alanso-Santiago et al. (2017) used photographic data for distance modulus estimation. The present estimate of distance modulus in more reliable because it is based on parallax as well as CCD optical and near-IR data. Isochrone fitting also gives the values of colour excess , , and as 0.45, 0.15, 0.22 and 1.2 mag. Using these colour excess values we derived the colour excess ratios as , and . These values are in good agreement with the relations given by Dutra et al. (2002); Dias et al. (2012).
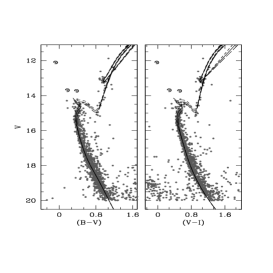
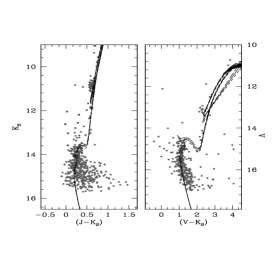
NGC 2506: We plotted six colour-magnitude diagrams (, ), , , and as shown in Fig. 12. The best-fitted isochrone in all colour-magnitude diagrams is found to be of and age Gyr. The distance modulus for the cluster is calculated as mag. The derived heliocentric distance is kpc. The distance derived from isochrone fitting is in good agreement with that of the parallax angle method discussed in section 4.2. Values of colour-excess , , , , and are estimated as 0.06, 0.07, 0.28, 0.02, 0.03 and 0.08 mag.
Three blue straggler stars are also identified in the present analysis. These are shown with the open circles in optical colour-magnitude diagrams of the Fig. 12. Motions of the three blue straggler stars have consistency with the cluster motion and have the same distances as the other cluster members, hence they are a member of this cluster. Their spatial location in the cluster shows that they are centrally concentrated.
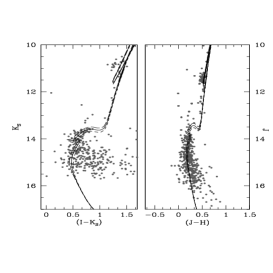
IC 4651: Fig. 13 shows , , , , and colour-magnitude diagrams using the stars selected in section 4.1. The best-fitted isochrone for all the colour-magnitude diagrams is found to be of and age Gyr. Distance modulus for the cluster is derived as mag and corresponding heliocentric distance is as kpc. The value of , , , , and are determined as 0.16, 0.2, 0.44, 0.04, 0.08 and 0.19 mag. In this cluster the stars brighter than mag are saturated in our photometry in all filters. In colour-magnitude diagram of the cluster a binary sequence is also visible parallel to the main-sequence.
A comparison of parameters obtained in our analysis with the values available in the literature is presented in Table 10. This table shows that presently determined parameters are in good agreement with previous studies. Green et al. (2018) derived a three-dimensional interstellar dust reddening map covering sky north of using photometry of 800 million stars from Pan-STARRS 1 and 2MASS. For NGC 2506, their estimated value of is which is in good agreement with our determined value. NGC 6067 and IC 4651 do not lie in the region covered by the reddening map.
| Author | Radius | Age | DM | |
| (arcmin) | (Myr) | (mag) | (mag) | |
| NGC 6067 | ||||
| Thackeray et al. (1962) | - | 75 to 150 | 12.5 | 0.33 |
| Walker (1985) | - | - | 0.35 | |
| Alonso-Santiago et al. (2017) | ||||
| Present study | 10 | 0.45 | ||
| NGC 2506 | ||||
| McClure et al. (1981) | - | 3400 | 12.2 | - |
| Marconi et al. (1997) | - | 1500 to 2200 | 12.5 | - |
| Lee et al. (2012) | - | |||
| Anthony-Twarog et al. (2016) | - | |||
| Present study | 12 | 0.06 | ||
| IC 4651 | ||||
| Anthony-Twarog & Twarog (2000) | - | 10.15 | - | |
| Meibom (2000) | - | - | - | |
| Biazzo et al. (2007) | - | - | ||
| Present study | 11 | 0.16 |
7 Luminosity and mass function of the clusters
7.1 Determination of photometric completeness
To calculate the completeness level in our photometry, we conducted artificial star (AS) test. For completeness determination in NGC 6067, and images are used whereas for NGC 2506 and IC 4651 and images are used. For AS test we added total artificial stars in each image. These stars must have the same geometric position and different magnitudes in the two filters.
The AS test routine added stars one by one from the artificial star list. After addition of a star, AS routine perform photometry on the image, with the same method which was used for the real stars. The same procedure was performed for another star and so on. To recover the stars in AS test, we considered the conditions explained in Milone et al. (2012). According to the conditions, an artificial star can be considered as recovered when the input and the output fluxes differ by mag and their positions by pixel.
The completeness factor (CF) is calculated as the ratio of total recovered stars to the total number of added stars in a magnitude bin in both the filters. We considered only those stars which are recovered in both the filters. In Table 11, we listed the CF in different magnitude bins for the clusters under study. This table shows that stars brighter than 14 mag has CF 99.99 for all clusters.
| NGC 6067 | NGC 2506 | IC 4651 | |
|---|---|---|---|
| (Mag) | |||
| 12 - 13 | 99.99 | 99.99 | 99.99 |
| 13 - 14 | 99.99 | 99.99 | 99.99 |
| 14 - 15 | 97.18 | 98.49 | 91.79 |
| 15 - 16 | 89.40 | 98.19 | 90.38 |
| 16 - 17 | 86.49 | 97.87 | 89.89 |
| 17 - 18 | 89.56 | 96.92 | 88.00 |
| 18 - 19 | 87.09 | 94.66 | 82.43 |
| 19 - 20 | 81.26 | 93.33 | 70.70 |
| 20 - 21 | 74.11 | 85.80 | 53.28 |
7.2 Luminosity function
The number of stars in a unit magnitude range is called luminosity function. To derive luminosity function, we need true cluster members, so it is important to apply the corrections of non-members and the completeness. For this analysis, we selected cluster members using proper motion data as discussed in section 4.1. In spite of selecting members using proper motions and parallax angle, some field stars are also seen in cluster colour-magnitude diagrams shown in Fig. 11, 12 and 13. To overcome this problem, we applied photometric criteria to select the cluster members as discussed in Yadav et al. (2008). In this method we make a blue and red envelope around the cluster main-sequence. The stars inside this envelope are considered as true cluster members. In this way 3334, 943 and 499 member stars are found in NGC 6067, NGC 2506 and IC 4651 respectively.
To construct luminosity function we first converted the apparent magnitude into absolute one, using the distance and reddening calculated in section 4.2 and 6.2 respectively. Now we calculated the number of stars in each magnitude bin. After correcting the data for incompleteness we plotted luminosity function for the clusters NGC 6067, NGC 2506 and IC 4651 which are shown in Fig.14.
Fig. 14 shows that the luminosity function of NGC 6067 increases towards the fainter magnitude. But after mag, we observed a dip in the luminosity function of the cluster. This cluster is young and hence faint stars are still bound with the cluster. The luminosity function of NGC 2506 seems very flat except one prominent peak observed at 4.5 mag. The flatness signature may occur due to the dynamical evolution of the cluster, which causes the evaporation of the low mass stars from the cluster. Similar results were also reported by Lee et al. (2012) for the clusters NGC 1245 and NGC 2506. The luminosity function of IC 4651 decreases towards the fainter magnitude. From the histogram, we can conclude that most of the low mass stars have evaporated from the cluster due to the dynamical evolution.

7.3 Mass function
The mass function (MF) denotes the relative number of stars in a unit mass range.
The luminosity function of a cluster can be converted into mass-function using
theoretical evolutionary tracks.
For this conversion, we used theoretical models given by Marigo
et al. (2017).
The slope of mass function
is calculated, using the relation
Where is the number of stars in mass bin and is the central mass of the bin. From this equation, we can determine the value of mass function slope . In Fig. 15, 16 and 17 the mass distribution is shown for the clusters NGC 6067, NGC 2506 and IC 4651 respectively. The mass function is calculated for three regions i.e, core, halo and the entire region. The radius of the cluster derived in section 6.1 is taken for entire region while core and halo region are considered as core radius and beyond the core region respectively. The mass function slopes derived by least-square fitting for all regions are listed in Table 12 for all the clusters.


| Cluster | Mass | Mass function slope () | ||
|---|---|---|---|---|
| range | Core | Halo | Entire region | |
| NGC 6067 | 1.00 - 5.99 | |||
| NGC 2506 | 0.77 - 1.54 | |||
| IC 4651 | 0.62 - 1.83 | |||
For NGC 6067 the mass-function slope of the entire cluster and halo region is greater than Salpeter value (Salpeter, 1955). Mass function slope for core region of NGC 6067 and entire cluster region of NGC 2506 are found comparable with the Salpeter value. A flatter mass-function slope is observed for IC 4651 in all regions. Table 12 also shows that mass-function slope becomes flat when one goes from halo to core regions in all the clusters. This may be due to the mass segregation in the clusters. A similar spatial variation in mass function slope was also observed by Pandey et al. (1992) for nine clusters and Durgapal & Pandey (2001) for the clusters king 7 and Be 20.
7.4 Mass segregation
To study the signature of mass segregation in the clusters under study, we divided the stars into three mass range as shown in Fig. 18. Cumulative radial stellar distributions for different regions are shown in Fig. 18.
Fig. 18 shows that for the clusters NGC 6067 and IC 4651, high mass stars are located towards the cluster centre while low mass stars are distributed in the outer region of the cluster. This indicates a clear mass segregation effect in these clusters. On the other hand, NGC 2506 shows less mass segregation in comparison to NGC 6067 and IC 4651. To check whether these curves belong to the same distribution or not, we performed the Kolmogorov-Smirnov (K-S) test for different mass range. From K-S test, we found 99, 90 and 70 confidence level for the clusters NGC 6067, NGC 2506 and IC 4651 respectively.

In open star clusters, dynamical evolution may be a possible reason for
the presence of mass-segregation.
In the very beginning, a cluster may possess a random spatial stellar mass distribution
and due to the dynamical evolution, this mass distribution gets modified.
The dynamical evolution takes place in a time scale over which
individual cluster member exchange energy and their velocity distribution
approach a Maxwellian equilibrium.
It is also possible that
mass segregation may be present from the time of the birth of the cluster.
To check these two possibilities for the presence of mass-segregation,
we calculated
the dynamical evolution time for clusters using
the relation
where is the number of cluster members, is the radius containing half of the cluster members. For this analysis, we used half of the cluster radius as , is mean cluster mass (Spitzer & Hart, 1971). We used most probable cluster members which are selected using both vector point diagrams and photometric criteria.
The dynamical evolution time is determined as 396, 429 and 294 Myr for the clusters NGC 6067, NGC 2506 and IC 4651 respectively. On comparing these values with the cluster age, we find that NGC 6067 does not show relaxation whereas NGC 2506 and IC 4651 achieved the Maxwellian equilibrium. It concludes that mass-segregation observed in NGC 6067 may be due to the imprint of star formation and in NGC 2506 and IC 4651 it may be due to the dynamical evolution or imprint of cluster formation or both.
8 Conclusions
In this article, a combination of high precision Gaia DR2 proper motion data
and ground-based wide-field photometric data are used to probe the dynamical status
and orbits of three open star clusters NGC 6067, NGC 2506 and IC 4651. The present
analysis is based on the cluster members selected by using proper motion data
and parallax data.
The main results of the present analysis are the following:
-
1.
We used Gaia DR2 proper motion and parallax data to separate cluster members from field stars and also calculated mean proper motions for the clusters. These are found as and mas, and mas, and mas in RA and DEC directions for the clusters NGC 6067, NGC 2506 and IC 4651 respectively.
-
2.
We determined average parallax and corresponding heliocentric distances as kpc, kpc and kpc for the clusters NGC 6067, NGC 2506 and IC 4651 respectively.
-
3.
Galactic orbits and orbital parameters are determined for the clusters, using Galactic potential models. We found that all three clusters are orbiting in a boxy orbit. NGC 6067 and IC 4651 have small perigalactic and apogalactic distances as compared to NGC 2506.
-
4.
From radial density profiles of clusters, radii are found as , and for the clusters NGC 6067, NGC 2506 and IC 4651 respectively. The corresponding linear sizes are 6.81, 12.43 and 3.03 pc.
-
5.
Ages of the clusters are found as Myr, Gyr and Gyr for the clusters NGC 6067, NGC 2506 and IC 4651 respectively.
-
6.
The luminosity function of NGC 6067 increases upto and decreases towards the fainter end. This implies that fainter stars are still bound in NGC 6067. A flat luminosity function is observed for NGC 2506 while a decreasing luminosity function is found for IC 4651. Due to dynamical evolution, fainter stars of NGC 2506 and IC 4651 may get evaporated from the cluster region.
-
7.
Mass function slope for core region of NGC 6067 and entire cluster region of NGC 2506 is found comparable with the Salpeter (1955) value whereas for IC 4651 it is flatter. We have also found that for all the clusters under study, the slope becomes flattered towards the core of the clusters. We found a hint of mass-segregation in all the three cluster in our sample.
Acknowledgements
We are thankful to the anonymous referee for careful reading and constructive suggestions that improved the overall quality of the paper. This research is based on data obtained from ESO Science Archive Facility. This work has made use of data from the European Space Agency (ESA) mission Gaia (https://www.cosmos.esa.int/gaia), processed by the Gaia Data Processing and Analysis Consortium (DPAC, https://www.cosmos.esa.int/web/gaia/dpac/consortium). Funding for the DPAC has been provided by national institutions, in particular the institutions participating in the Gaia Multilateral Agreement. This study also made use of WEBDA database. This work is partially supported by the Natural Science Foundation of China (NSFC-11590782, NSFC-11421303).
References
- Allen & Santillan (1991) Allen C., Santillan A., 1991, Rev. Mexicana Astron. Astrofis., 22, 255
- Alonso-Santiago et al. (2017) Alonso-Santiago J., Negueruela I., Marco A., Tabernero H. M., González-Fernández C., Castro N., 2017, MNRAS, 469, 1330
- An et al. (2007) An D., Terndrup D. M., Pinsonneault M. H., 2007, ApJ, 671, 1640
- Anderson et al. (2006) Anderson J., Bedin L. R., Piotto G., Yadav R. S., Bellini A., 2006, A&A, 454, 1029
- Anthony-Twarog & Twarog (2000) Anthony-Twarog B. J., Twarog B. A., 2000, AJ, 119, 2282
- Anthony-Twarog et al. (2016) Anthony-Twarog B. J., Deliyannis C. P., Twarog B. A., 2016, AJ, 152, 192
- Bailer-Jones (2015) Bailer-Jones C. A. L., 2015, PASP, 127, 994
- Bailer-Jones et al. (2018) Bailer-Jones C. A. L., Rybizki J., Fouesneau M., Mantelet G., Andrae R., 2018, AJ, 156, 58
- Biazzo et al. (2007) Biazzo K., et al., 2007, A&A, 475, 981
- Bressan et al. (2012) Bressan A., Marigo P., Girardi L., Salasnich B., Dal Cero C., Rubele S., Nanni A., 2012, MNRAS, 427, 127
- Caffau et al. (2011) Caffau E., Ludwig H. G., Steffen M., Freytag B., Bonifacio P., 2011, Sol. Phys., 268, 255
- Carraro & Chiosi (1994) Carraro G., Chiosi C., 1994, A&A, 288, 751
- Chiu & van Altena (1981) Chiu L.-T. G., van Altena W. F., 1981, ApJ, 243, 827
- Dias et al. (2012) Dias W. S., Monteiro H., Caetano T. C., Oliveira A. F., 2012, A&A, 539, A125
- Durgapal & Pandey (2001) Durgapal A. K., Pandey A. K., 2001, A&A, 375, 840
- Dutra et al. (2002) Dutra C. M., Santiago B. X., Bica E., 2002, A&A, 381, 219
- Eggen (1971) Eggen O. J., 1971, ApJ, 166, 87
- Engver (1966) Engver N., 1966, Arkiv for Astronomi, 4, 53
- Gaia Collaboration et al. (2016a) Gaia Collaboration et al., 2016a, A&A, 595, A1
- Gaia Collaboration et al. (2016b) Gaia Collaboration et al., 2016b, A&A, 595, A2
- Gaia Collaboration et al. (2018a) Gaia Collaboration et al., 2018a, A&A, 616, A1
- Gaia Collaboration et al. (2018b) Gaia Collaboration et al., 2018b, A&A, 616, A11
- Green et al. (2018) Green G. M., et al., 2018, MNRAS, 478, 651
- Johnson & Soderblom (1987) Johnson D. R. H., Soderblom D. R., 1987, AJ, 93, 864
- Jordi et al. (2010) Jordi C., et al., 2010, A&A, 523, A48
- Kim et al. (2001) Kim S.-L., et al., 2001, Acta Astron., 51, 49
- King (1962) King I., 1962, AJ, 67, 471
- Kjeldsen & Frandsen (1991) Kjeldsen H., Frandsen S., 1991, A&AS, 87, 119
- Lee et al. (2012) Lee S. H., Kang Y.-W., Ann H. B., 2012, MNRAS, 425, 1567
- Lee et al. (2013) Lee S. H., Kang Y.-W., Ann H. B., 2013, MNRAS, 432, 1672
- Lindegren et al. (2018) Lindegren L., et al., 2018, A&A, 616, A2
- Luri et al. (2018) Luri X., et al., 2018, A&A, 616, A9
- Marconi et al. (1997) Marconi G., Hamilton D., Tosi M., Bragaglia A., 1997, MNRAS, 291, 763
- Marigo et al. (2013) Marigo P., Bressan A., Nanni A., Girardi L., Pumo M. L., 2013, MNRAS, 434, 488
- Marigo et al. (2017) Marigo P., et al., 2017, ApJ, 835, 77
- McClure et al. (1981) McClure R. D., Twarog B. A., Forrester W. T., 1981, ApJ, 243, 841
- Meibom (2000) Meibom S., 2000, A&A, 361, 929
- Mihalas & Routly (1968) Mihalas D., Routly P. M., 1968, Galactic astronomy
- Milone et al. (2012) Milone A. P., et al., 2012, ApJ, 754, L34
- Miyamoto & Nagai (1975) Miyamoto M., Nagai R., 1975, PASJ, 27, 533
- Momany et al. (2006) Momany Y., Zaggia S., Gilmore G., Piotto G., Carraro G., Bedin L. R., de Angeli F., 2006, A&A, 451, 515
- Pandey et al. (1992) Pandey A. K., Mahra H. S., Sagar R., 1992, Bulletin of the Astronomical Society of India, 20, 287
- Piatti et al. (1998) Piatti A. E., Claria J. J., Bica E., 1998, VizieR Online Data Catalog, 211
- Reid & Brunthaler (2004) Reid M. J., Brunthaler A., 2004, ApJ, 616, 872
- Riess et al. (2018) Riess A. G., et al., 2018, ApJ, 861, 126
- Salgado et al. (2017) Salgado J., González-Núñez J., Gutiérrez-Sánchez R., Segovia J. C., Durán J., Hernández J. L., Arviset C., 2017, Astronomy and Computing, 21, 22
- Salpeter (1955) Salpeter E. E., 1955, ApJ, 121, 161
- Spitzer & Hart (1971) Spitzer Jr. L., Hart M. H., 1971, ApJ, 164, 399
- Thackeray et al. (1962) Thackeray A. D., Wesselink A. J., Harding G. A., 1962, MNRAS, 124, 445
- Walker (1985) Walker A. R., 1985, MNRAS, 214, 45
- Webb et al. (2014) Webb J. J., Sills A., Harris W. E., Hurley J. R., 2014, MNRAS, 445, 1048
- Wilkinson & Evans (1999) Wilkinson M. I., Evans N. W., 1999, MNRAS, 310, 645
- Wu et al. (2009) Wu Z.-Y., Zhou X., Ma J., Du C.-H., 2009, MNRAS, 399, 2146
- Yadav et al. (2008) Yadav R. K. S., Kumar B., Subramaniam A., Sagar R., Mathew B., 2008, MNRAS, 390, 985