The Nearby, Young, 1 Fornacis Cluster: Membership, Age, and an Extraordinary Ensemble of Dusty Debris Disks
Abstract
Only four star clusters are known within 100 pc of Earth. Of these, the 1 For cluster has barely been studied. We use the Gaia DR2 catalog and other published data to establish the cluster membership, structure, and age. The age of and distance to the cluster are 40 Myr and 104 pc, respectively. A remarkable, unprecedented, aspect of the cluster is the large percentage of M-type stars with warm excess infrared emission due to orbiting dust grains these stars lie in an annulus that straddles the tidal radius of the cluster. The 1 For cluster appears to be closely related to two extensive, previously known, groups of comoving, coeval stars (the Tucana-Horologium and Columba Associations) that are spread over much of the southern sky. While Tuc-Hor and 1 For are comoving and coeval, the difference in the frequency of their warm dusty debris disks at M-type stars could hardly be more dramatic.
1 Introduction
Star clusters have been recognized since antiquity the Pleiades and the Hyades can be seen with the naked eye and have been carefully studied by astronomers since the invention of the telescope. Both open and globular clusters have played an essential role in our understanding of stellar evolution. Measurements by the Gaia satellite of the European Space Agency have enabled major advances in recognition and characterization of Galactic star clusters (e.g., Cantat-Gaudin et al 2018; Lodieu et al 2019). To date, Gaia findings have been reported mostly as general overviews of cluster existence and of some cluster properties rather than as detailed investigations of specific clusters. In the present paper, we use Gaia along with additional information to call attention to the significance of a nearby, but previously little studied open cluster initially named Alessi 13 (Dias et al 2002).
G. Cutispoto and colleagues, in a series of papers in the decade of the 1990s, focused on stellar activity, including X-rays and lithium abundances, to identify some young stars near Earth. But kinematic moving groups were not clearly recognized and the papers were poorly cited. de la Reza et al (1989) and Gregorio-Hetem et al (1992) identified a few late-type stars near the infrared bright star TW Hya that also exhibited spectral signatures of youth, i.e., strong Li absorption, H-alpha emission, and/or IR excess. The arguably first paper to provide some order to this new field involved this group of 10 Myr old stars the TW Hya Association located about 60 pc from Earth (Kastner et al 1997). Since then perhaps as many as 10 other associations of stars with ages 200 Myr or less and within 100 pc of Earth have been identified (e.g., Zuckerman & Song 2004; Torres et al 2008; Mamajek 2016; Gagné et al 2018). Akin to star clusters, members of a given nearby, young stellar association or moving group have similar ages and space motions through the Milky Way (they are coeval and comoving). But unlike star clusters, when considered in their entirety, stars in the various nearby young associations are distributed over much of the sky. Studies of these associations are enabling astronomers to better understand the evolution of stars as they age from 10 to 200 Myr. In addition, and perhaps most important, these youthful stars have provided numerous targets for direct infrared imaging discovery of extrasolar planets.
Following Dias et al (2002), Yen et al (2018) used TGAS (Gaia DR1) to analyze 24 nearby open clusters including Alessi 13. Yen et al identified nine stars in TGAS as cluster members. Using Gaia DR2, Cantat-Gaudin et al. (2018) analyzed 1229 open clusters and reported 48 candidate members of Alessi 13 contained in a volume of radius 15 pc. In the present paper we use Gaia DR2 to greatly expand on the known population and properties of Alessi 13. In particular, by choosing a less restrictive range of cluster kinematic properties we have identified 108 candidate members within a similar volume of radius 15 pc. Our list includes 47 of the 48 stars listed in Cantat-Gaudin et al.
We demonstrate that the Alessi 13 cluster and two of the most prominent of the nearby youthful stellar associations Tucana-Horologium and Columba are coeval and comoving with age 40 Myr. Taken together, they constitute a major constituent of the solar neighborhood. For reasons given in Section 4, henceforth we call Alessi 13 the 1 For cluster. 1 For is the second youngest of only four star clusters known within 100 pc of Earth (the other three are mentioned in Section 4).
A substantial fraction of stars of solar mass and above are known to be orbited by dusty debris disks, most of which are more akin to the Sun’s Kuiper Belt than to its asteroid belt. However, very few low-mass stars are known that harbor debris disks especially when considered as a tiny fraction of the population of the numerous known M-type stars. As we describe in Section 4, a (currently) unique aspect of the 1 For cluster is its abundance of M-type stars that are orbited by dust particles. Perhaps as noteworthy is the large percentage of these debris disks that contain warm dust with temperatures characteristic of the asteroid belt or of the habitable zone, in contrast to the cold dust of the Kuiper Belt. This warm dust may be associated with copious rocky planet formation at a characteristic age of 40 Myr (Melis et al 2010).
2 Sample selection
Our path to the 1 For cluster began with our study of stars in the Columba Association (Lee & Song 2019). Our study includes investigation of binary members of this association and we were surprised to discover that one of the Lee-Song stars is apparently surrounded by numerous “companions”. One thing led to another, including our discovery of the Dias et al (2002), Yen et al (2018), and Cantat-Gaudin et al. (2018) papers, as the existence of the cluster became apparent to us. We used these papers as initial guidelines to develop our own set of search constraints, as described below.
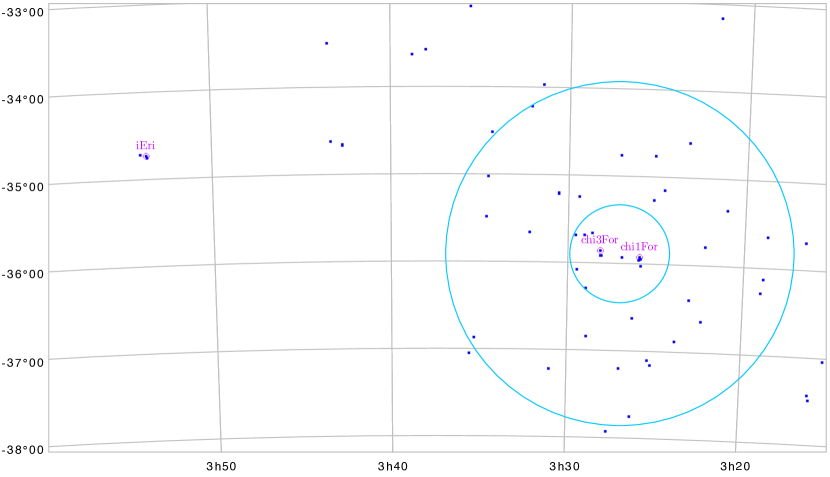
Based on the clustering of massive stars, and the fact that previous papers had identified the cluster center in this vicinity, we took the average of the Gaia positions of 1 and 3 For as defining the center of the cluster at R.A. = 51.766 deg, decl. = -35.887 deg. We note that this is in good agreement with the Cantat-Gaudin et al (2018) average of 48 stars at 51.762, -35.821 (found by starting their search at the Dias et al 2002 listed center of 50.425, -35.700, about 1.3 deg West of the new cluster center). In the current paper, from our broad search (described below) we find the average position of the cluster core stars to be 51.758, -35.922, close to the average position of the two A1 stars 1 and 3 For (Figure 1).
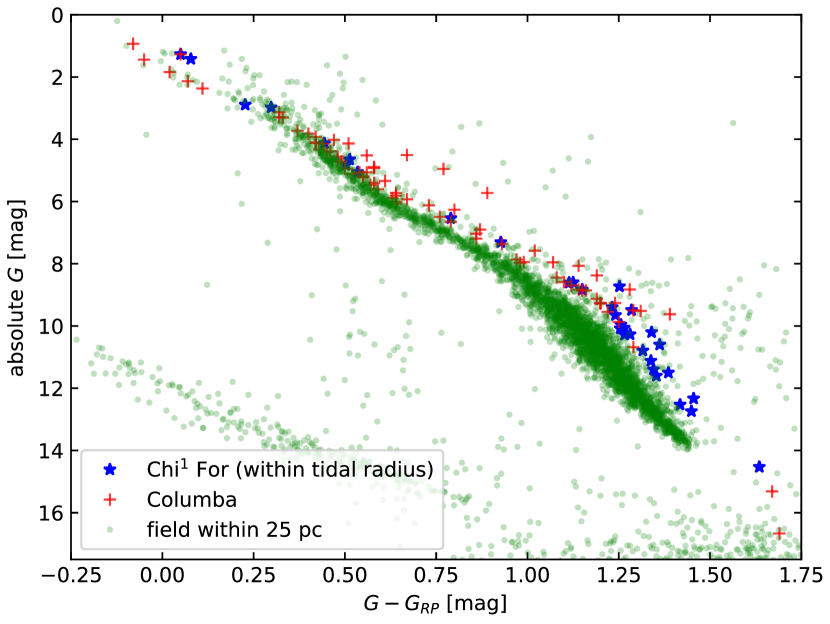
We use the Gaia DR2 catalog (Gaia Collaboration 2018; Lindegren et al 2018) to identify members of the 1 For cluster (Tables 1 & 2). Stars in the tables are deemed to be cluster members based on their proper motions, parallax, and location on a color-magnitude diagram (CMD, Figure 2). Based on the radial extent of cluster members identified by Cantat-Gaudin et al, and our concern that extending our search too far from the cluster center would cause inclusion of or confusion with Columba and Tuc-Hor stars, we searched for stars that have R.A. and decl. positions within a 15 pc (8.24 degree angular) radius of our adopted cluster center at the mean position of the stars 1 and 3 For. We selected stars that satisfied constraints in parallax and proper motion consistent with being a comoving group in a volume of space of 15 pc radial extent. That is, for a 15 pc search radius in the R.A.-decl. plane of the sky, we included a range in parallax that corresponds to a 15 pc line-of-sight distance range, centered on the mean distance of 1 and 3 For from the Sun (104 pc), and then we widened that range to allow for parallax uncertainties up to 0.4 mas.
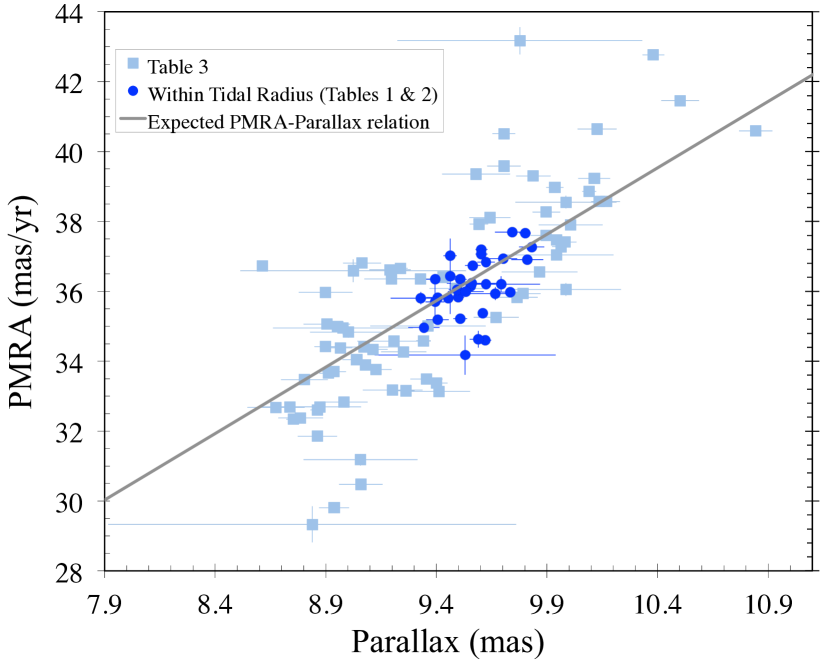
Next we estimated the corresponding range in expected proper motion values such that it includes the anticipated differences in proper motion due to projection effects at different distances from the Sun (Figure 3). Note that in the case of the 1 For cluster, this effect is mainly present in only the R.A. proper motion (pmra) direction which dominates the overall proper motion vector, as the decl. proper motion (pmdec) values are close to zero. Not surprisingly, stars within the tidal radius (dark-blue/round points) define a compact central region in pmra-parallax space. Some of the light-blue/square points (from Table 3) that plot far from the gray/slanted line may be members of the Tuc-Hor or Columba associations and not of the cluster.
Thus, the search values for pmra were calculated as centered on the average of the pmra values of the core stars 1 and 3 For (36.5 mas/yr) and scaled to the limits of the parallax constraints, resulting in a 7.6/6.0 mas/yr range. Again, we widened that range to allow for pmra uncertainties up to 1 mas/yr. Since pmdec is close to zero, parallax scaling results in too small of a search space, so for pmdec we adopt a similar range of parallax scaling as found for pmra i.e., 7 mas/yr relative to the average of the pmdec values of the core stars 1 and 3 For (-4.2 mas/yr).
With the above considerations we adopted the following Gaia search constraints:
8.0 mas parallax 11.6 mas
29 mas/yr pmra 45 mas/yr
-11 mas/yr pmdec 3 mas/yr
In a few cases we had to modify values of some Gaia DR2 entries. For example, Gaia often has trouble accurately measuring parallax and/or proper motions of stars in (moderately) close binaries. If the binary members are of substantially unequal brightness, then the errors listed in the catalog for these quantities for the companion are usually substantially larger than those for the primary. Then, typically, we adopt the parameters of the primary for both stars. If the binary members are of more nearly equal brightness, then, for both stars, we adopt an error-weighted average of the relevant parameters.
Also, there are occasional errors in Gaia DR2 for reasons that are not easy to discern. One representative example is the proper motion of the star CD-36 1289 which is an obvious member of the core of the 1 For cluster (see Table 1). The Gaia R.A. proper motion of CD-36 1289 is given as 25 mas/yr. If this were to be correct, then CD-36 1289 could not be a member of the cluster because it would have the wrong Galactic space motions UVW (see Section 4). However, if one instead uses the well-measured proper motion of 34.6 mas/yr from the UCAC4 catalog, then the UVW of CD-36 1289 agrees well with that of other cluster core members. The UCAC4 proper motion agrees well with the independent measurements from SPM4, UCAC5, and PPMXL, and thus is obviously correct. (All these catalog values can be found in Vizier.111http://vizier.u-strasbg.fr/viz-bin/VizieR)
Our Gaia catalog search using the above parameters returns 142 sources, plus we add CD-36 1289, as explained above. Of that list of 143 stars (and with the corrections described two paragraphs above), we exclude 31 stars that have calculated 3D radial distances 15 pc from the cluster center. By plotting the remaining stars on a CMD we identify four interlopers that lie below the cluster sequence and one white dwarf. The white dwarf has 10,200 K and log 8.18 (Gentile Fusillo et al. 2019) which corresponds to a cooling age of 750 Myr (Dufour et al 2017), and therefore it cannot be a member of this 40 Myr old cluster (see third paragraph in Section 3). That leaves 107 Gaia sources, and with the recognition that the binary HD 21434 (Mason et al 2015) is unresolved by Gaia (see Table 1), we present 108 cluster members and candidates (Tables 13) in a spherical volume of radius 15 pc. The ranges in Gaia parameters for this resulting set are:
8.6 mas parallax 10.8 mas
29.3 mas/yr pmra 43.2 mas/yr
-9.7 mas/yr pmdec 0.9 mas/yr
Repeating the original search over a smaller region of R.A.-decl. angular distance = 4.4 degrees (8 pc), yields about 3/4 of the stars of the 15 pc search. In this inner 8 pc search region, relaxing the parallax or proper motion constraint boundaries adds very few (less than a handful) additional stars, and a similar exercise within the even more compact region of the tidal radius (3.5 pc, see Section 4) finds just one or two additional foreground sources. This suggests a significant overabundance of stars within the range of the adopted constraints, as expected for a true cluster.
Outside the 8 pc region, relaxing the search constraint boundaries can pick up a considerable number of additional stars (especially with a widened parallax range). However, only a handful would actually make it to the 1 For cluster candidate list, as the vast majority of those extra stars do not pass our criteria of, (1) having 3D radial distance 15 pc from the cluster center, and (2) needing to be aligned with the cluster sequence on the CMD. Thus, we consider our chosen Gaia search range to be an appropriate set of limits for finding bona fide 1 For members and candidates.
| ChiFor | 2MASS | SIMBAD | Spectral | Parallax | Mass | Comments | ||
|---|---|---|---|---|---|---|---|---|
| # | (J2000) | Name | (pc)aa is the distance of a star from the cluster center which is taken to be the average position of the A1-type stars 1 For and 3 For. Based on four stars with published radial velocities (1 For itself, 3 For, CD-36 1289, and ChiFor 3), the UVW of the core is -12.320.45, -21.460.67, -4.641.39 km s-1 (see Section 4). | TypebbSpectral types given in Tables 1-3 are usually from SIMBAD when available (see Section 3), otherwise from photometric colors as, for example, those given in Table 4. | (mas) | (mag) | ()ccStellar masses are an average of those given in Table 15.8 of the 4th edition of Allen’s Astrophysical Quantities and http://www.pas.rochester.edu/emamajek/EEM_dwarf_UBVIJHK_colors_Teff.txt. | |
| 1 | 03255188-3556254 | CD-36 1289 | 0.23 | G4 | 9.621 (0.028) | 4.65 | 1.00 | |
| 2A | 03280743-3554434 | CD-36 1309 | 0.40 | F8 | 9.604 (0.027) | 4.13 | 1.20 | BinaryeeSee Note added in proof for radial velocity and other data for ChiFor 2A. |
| 2B | 03280941-3554365 | 0.41 | M5 | 9.604 (0.027) | 11.50 | 0.20 | Binary | |
| 3 | 03265760-3555314 | 0.49 | K8 | 9.556 (0.024) | 7.31 | 0.60 | ||
| 4A | 03281103-3551148 | 3 For | 0.50 | A1 | 9.625 (0.039) | 1.42 | 2.40 | Binary |
| 4B | 03281151-3551123 | 3 For B | 0.50 | G0 | 9.625 (0.039) | 5.06 | 1.10 | Binary |
| 5 | 03255583-3555151 | 1 For | 0.57 | A1 | 9.564 (0.035) | 1.27 | 2.40 | |
| 6 | 03255277-3601161 | 0.91 | M3.5 | 9.530 (0.409) | 9.49 | 0.30 | ||
| 7 (A+B) | 03255897-3557299 | HD 21434 | 0.97 | A9 | 9.59 ddHD 21434 is an equal mass (each star is 1.7 ) 0.2” separation binary (Mason et al 2015). Its Gaia DR2 parallax value of 9.080.17 mas is very likely corrupted by the binarity (note the relatively large quoted error for such a bright star). We assume a parallax for the binary equal to the mean parallax of the other core members, i.e. 9.590.04 mas. Then the of each component of the HD 21434 binary is 2.89 mag. (0.04 ddHD 21434 is an equal mass (each star is 1.7 ) 0.2” separation binary (Mason et al 2015). Its Gaia DR2 parallax value of 9.080.17 mas is very likely corrupted by the binarity (note the relatively large quoted error for such a bright star). We assume a parallax for the binary equal to the mean parallax of the other core members, i.e. 9.590.04 mas. Then the of each component of the HD 21434 binary is 2.89 mag.) | ddHD 21434 is an equal mass (each star is 1.7 ) 0.2” separation binary (Mason et al 2015). Its Gaia DR2 parallax value of 9.080.17 mas is very likely corrupted by the binarity (note the relatively large quoted error for such a bright star). We assume a parallax for the binary equal to the mean parallax of the other core members, i.e. 9.590.04 mas. Then the of each component of the HD 21434 binary is 2.89 mag. | 3.4 ddHD 21434 is an equal mass (each star is 1.7 ) 0.2” separation binary (Mason et al 2015). Its Gaia DR2 parallax value of 9.080.17 mas is very likely corrupted by the binarity (note the relatively large quoted error for such a bright star). We assume a parallax for the binary equal to the mean parallax of the other core members, i.e. 9.590.04 mas. Then the of each component of the HD 21434 binary is 2.89 mag. | Binary |
| ChiFor | 2MASS | SIMBAD | Spectral | parallax | Mass | Comments | ||
|---|---|---|---|---|---|---|---|---|
| # | (J2000) | Name | (pc) | Type | (mas) | (mag) | () | |
| 8 | 03283738-3539286 | 1.22 | M4 | 9.692 (0.176) | 10.60 | 0.20 | ||
| 9 | 03290633-3541070 | 1.39 | M2 | 9.499 (0.027) | 8.60 | 0.40 | ||
| 10 | 03261876-3637064 | 1.54 | M5.5 | 9.667 (0.132) | 12.53 | 0.15 | ||
| 11 | 03321206-3539433 | 1.99 | M6 | 9.560 (0.113) | 12.33 | 0.15 | ||
| 12 | 03251321-3515552 | 2.02 | M4.5 | 9.743 (0.078) | 11.60 | 0.20 | ||
| 13 | 03285448-3650168 | 2.16 | M4 | 9.702 (0.063) | 10.79 | 0.20 | ||
| 14 | 03270606-3445494 | 2.36 | M3 | 9.493 (0.037) | 9.40 | 0.35 | IR excess | |
| 15A | 03251011-3445277 | 2.39 | M2 | 9.508 (0.029) | 8.61 | 0.40 | Binary; See table notes | |
| 15B | 03251033-3445206 | 2.40 | M2 | 9.508 (0.031) | 8.83 | 0.40 | Binary; IR excess | |
| 16 | 03292421-3514293 | 2.68 | M5 | 9.812 (0.072) | 11.40 | 0.20 | IR excess | |
| 17A | 03303532-3512133 | 2.81 | M3.5 | 9.405 (0.051) | 10.06 | 0.30 | Binary | |
| 17B | 03303488-3512335 | 2.81 | M3.5 | 9.405 (0.051) | 10.08 | 0.30 | Binary | |
| 18 | 03343867-3529039 | 2.90 | K5 | 9.611 (0.022) | 6.54 | 0.70 | UV variable | |
| 19 | 03243659-3508586 | 2.93 | M4 | 9.831 (0.057) | 10.28 | 0.20 | ||
| 20 | 03285610-3617125 | 3.03 | M4.5 | 9.344 (0.071) | 11.12 | 0.20 | ||
| 21 | 03221999-3638138 | CD-37 1263 | 3.07 | G5 | 9.801 (0.026) | 4.82 | 1.00 | RV=14.312.57 |
| 22 | 03293515-3540429 | 3.17 | M5.5 | 9.330 (0.136) | 12.74 | 0.15 | ||
| 23 | 03310150-3713188 | 3.26 | M4 | 9.453 (0.058) | 10.27 | 0.20 | ||
| 24 | 03343163-3501033 | 3.27 | M2 | 9.532 (0.081) | 8.73 | 0.40 | IR excess | |
| 25A | 03185295-3607375 | HD 20707 | 3.39 | F3 | 9.463 (0.030) | 2.98 | 1.50 | Binary; IR excess |
| 25B | 03185312-3607489 | HD 20707B | 3.39 | M4 | 9.463 (0.030) | 10.20 | 0.20 | Binary; IR excess |
| 26A | 03231580-3435524 | 3.56 | M3 | 9.394 (0.043) | 9.65 | 0.35 | Binary | |
| 26B | 03231705-3435472 | 3.56 | M8 | 9.394 (0.043) | 14.53 | 0.10 | Binary | |
| 27 | 03351859-3652183 | 3.80 | M3.5 | 9.735 (0.055) | 9.96 | 0.30 |
3 Results
Stars considered as potential members of the 1 For cluster appear in Tables 1-3 and in Figures 1-4. For stars with SIMBAD resolvable names, the listed spectral types are usually from SIMBAD, but there are a few exceptions. For example, SIMBAD does not give a spectral type for 3 For B. For the other late-F and G-type stars (other than the close binary HD 21955) we checked the SIMBAD spectral types versus , from Tycho, and . We then estimated photometric spectral types with the aid of the colors given at the http: URL in footnote “c” of Table 1. Then, for CD-36 1309, CD-37 1263, and CD-37 1224 we adopted the SIMBAD spectral type. But for CD-36 1289 we adopt G4 (rather than F8) and for HD 24121 we adopt G3 (rather than F8/G0).
The listed spectral types of M- and K-type stars were deduced by comparison with stars in the 40 Myr old Tuc-Hor (Kraus et al 2014) Association. Specifically, we constructed Table 4 from stars in Table 2 of Kraus et al (2014) and used a combination of , , , and to estimate the M-star spectral types listed in Tables 1-3. But for stars with excess infrared emission, was not used. Thus, the “spectral types” given in Tables 1-3 for K- and M-type stars are based on photometry, not spectroscopy, and are probably good to 1/2 subclass.
Figure 2 includes field stars within 25 pc of Earth; at a given color these stars plot below the 1 For cluster stars and Columba Association stars. Stars in 1 For and in Columba are thus younger than the field stars. Figure 2 shows that the stars plotted in Figures 1 and 2 have ages that are similar to Columba stars, that is, 40 Myr (Mamajek 2016; Lee & Song 2019). Stars that lie just above (within 0.75 mag of) the main locus are most likely binaries unresolved by Gaia; taken together out to the tidal radius (see Section 4), the companion stars likely add about one solar mass of material to the cluster. Although not shown here, stars in Tuc-Hor (Kraus et al. 2014; Lee & Song 2019) would also plot along the same locus. An age for the 1 For cluster between 500 and 600 Myr is given in papers by Pöhnl & Paunzen (2010), Kharchenko et al. (2016), and Yen et al. (2018), but Figure 2 demonstrates that the cluster is of the order of 10 times younger. We note that Mamajek (2016) suggested a cluster age of 30 Myr based on a few previously identified cluster stars with saturated X-ray emission; the number of stars in that sample was much less than the number of cluster candidates we consider here that were detected in X-rays (see the last paragraph of Section 3).
Radial velocities are available for only a few stars in Tables 1-3; see note “a” in Table 1 and the comments column in Tables 2 & 3. Section 4 below includes a discussion of the cluster membership likelihood of each star with a currently known radial velocity. Lacking a known radial velocity, likely members are chosen based on parallax, proper motion, and location on a Gaia CMD (Figure 2). For potential members with known radial velocities, UVW can be calculated and compared with the space motions of members of the Columba and Tuc-Hor associations; the agreement is usually excellent (see Section 4).
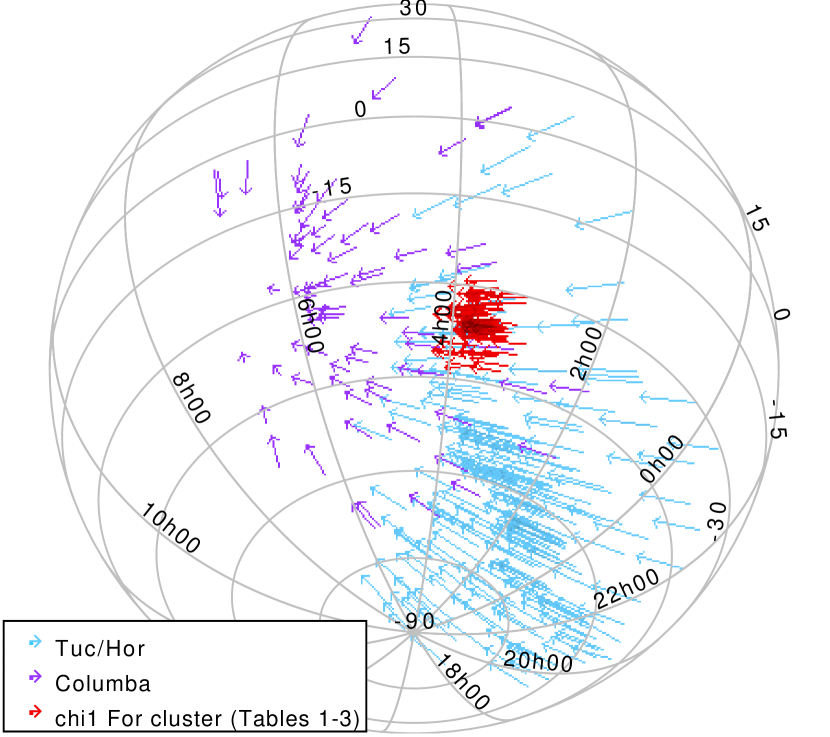
Table 3 presents stars that lie outside of the tidal radius (see Section 4) of the 1 For cluster. Each of these stars could be an escaped member of the cluster or a member of either the Columba or Tuc-Hor Associations (Lee & Song 2019). Based on the relative frequency of dusty debris disks at 1 For cluster stars relative to members of Tuc-Hor (see discussion in Section 4), many Table 3 stars beyond 8 pc from the cluster center probably are associated with Columba or Tuc-Hor rather than with 1 For. As has been realized for a decade (Torres et al 2008), Columba stars are similar to stars in Tuc-Hor (Zuckerman et al 2001), both in age and space motions through the Milky Way. However, published studies of these associations (Kraus et al 2014; Lee & Song 2019) are based on catalogs and spectral measurements that are largely insensitive to stars as far away as the 1 For cluster. Clarification of whether or not Columba and Tuc-Hor members are to be found 100 pc from Earth, and even beyond, remains as a task for the future. Together, the Columba and Tuc-Hor Associations and the 1 For cluster constitute a comoving and coeval stellar cohort that spans about half of the southern sky between R.A. 20h and 8h and south of decl. -15 deg (Figure 4).
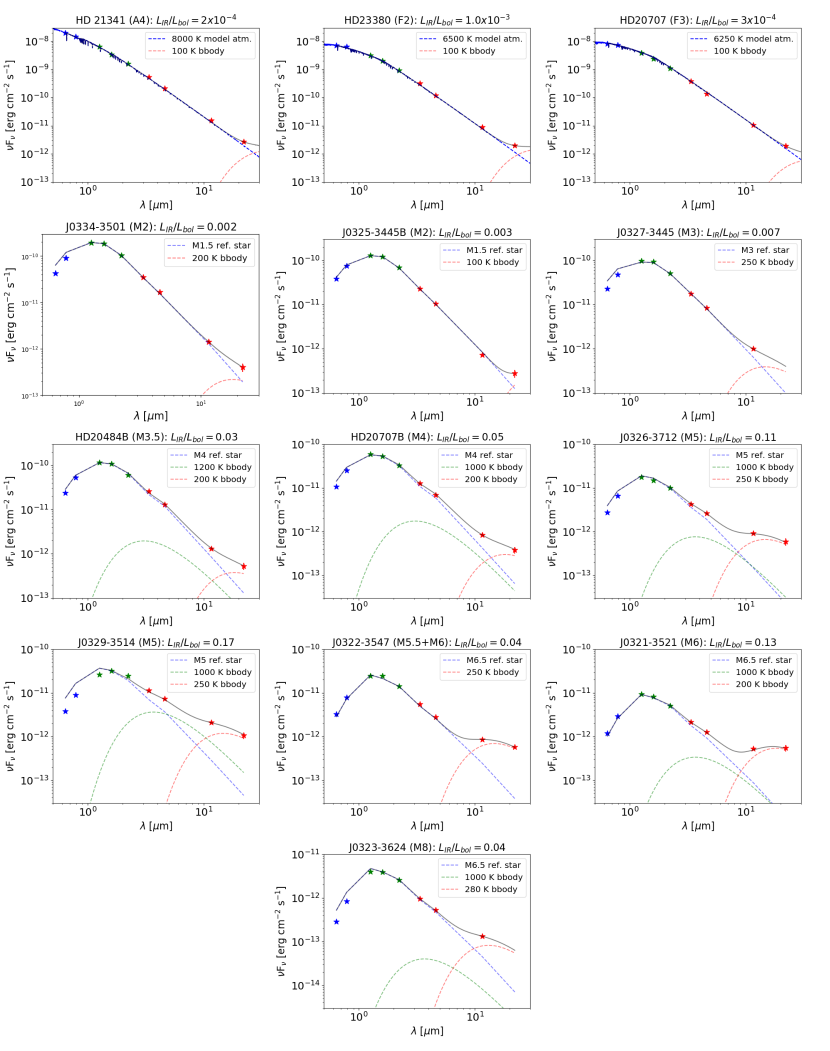
Figure 5 presents the spectral energy distributions (SEDs) of the 13 stars listed in Tables 1-3 for which we find evidence in the WISE catalog (Wright et al 2010) of infrared emission in excess of that from the stellar photosphere, overlaid with models consisting of photosphere plus a one- or two-component blackbody. The spectral type of a given star was used to select appropriate photospheric reference stars, where these reference stars were drawn from Table 3 in Pecaut & Mamajek (2013), as well as from our list of 1 For cluster candidates showing no evidence of IR excess. All of the reference stars have colors (from Gaia-G through WISE-4 bands) that agree, within 0.1 mag, with the spectral type-dependent colors listed in Table 5 of Pecaut & Mamajek. For the A4, F3, and F2 stars (HD 21341, HD 20707, and HD 23380 respectively), the stellar photospheres are represented by model atmospheres with appropriate effective temperatures for these spectral types. To establish the IR excess for each star, the reference star (or model atmosphere) SEDs have been rescaled to match a star’s photospheric emission at the or band. For each star we obtained, by eye, a suitable match of one- or two-component blackbody emission (plus underlying photosphere) to the star’s 1 through 4 fluxes. The resulting blackbody “fits” to the long-wavelength portions of the SEDs in Figure 5 should not be regarded as unique; rather, they provide estimates of the fractional infrared luminosities of these stars, as well as rough approximations of the circumstellar dust temperatures.
For most stars, the one- or two-component blackbody models provide good matches to the observed SEDs. For a few M-type stars, the match to reference star photospheric (especially and band) fluxes is not optimal. Some of these stars may be affected by reddening due to interstellar or circumstellar dust. In these cases we opted for the coolest reference star that matched the near-IR fluxes, to obtain the most conservative estimates of IR excess.
Two stars deserve special mention. The SED of the star ChiFor 15B listed in Table 2 and shown in Figure 5 indicates excess emission in only the WISE 4 band. But if the Gaia, 2MASS and WISE magnitudes are taken at face value, then an SED plot would indicate excess emission in all four WISE bands. ChiFor 15A and B appear as separate stars in the Gaia and 2MASS catalogs and should also appear in WISE as two separate stars. But only one star appears. Evidently, the separation of the two stars (7”) is such that there was confusion in separately assigning WISE Point Source Catalog fluxes to the components of the ChiFor 15AB binary system. Therefore, to prepare the SED of ChiFor 15B in the panel shown in Figure 5, we have added 0.75 magnitudes to the magnitudes listed at all four WISE bands.
The Table 3 star J0338-3334 has apparent excess emission in the 3 and 4 bands. But there is a “dwarf galaxy” 8” away from the star. It is thus not possible, based on existing information, to decide if the apparent excess is from dust associated with the star or from contamination by the background galaxy, or both.
| 2MASS | SIMBAD | Spectral | parallax | Mass | Comments | ||
|---|---|---|---|---|---|---|---|
| (J2000) | Name | (pc) | Type | (mas) | (mag) | () | |
| 03163272-3541282 | HD 20484 | 4.05 | A3 | 9.705 (0.036) | 1.94 | 2.20 | Binary |
| 03163154-3541337 | HD 20484B | 4.06 | M3.5 | 9.705 (0.036) | 9.39 | 0.30 | Binary; IR excess |
| 03353527-3702540 | 4.28 | M3.5 | 9.792 (0.050) | 9.88 | 0.30 | ||
| 03190162-3617152 | 4.30 | M5.5 | 9.328 (0.111) | 12.18 | 0.15 | ||
| 03251281-3709096 | HD 21341 | 4.33 | A4 | 9.944 (0.029) | 2.13 | 2.00 | Binary; IR excess |
| HD 21341B | 4.33 | M3.5 | 9.944 (0.029) | 9.85 | 0.30 | Binary | |
| 03221529-3547192 | 4.40 | M5.5 | 9.985 (0.181) | 12.18 | 0.15 | Binary; IR excess | |
| B | 4.40 | M6 | 9.986 (0.182) | 12.62 | 0.15 | Binary; see table notes | |
| 03292874-3604552 | 4.53 | M5.5 | 9.208 (0.106) | 12.29 | 0.15 | ||
| 03210190-3521218 | 4.88 | M6 | 10.007 (0.109) | 12.72 | 0.15 | IR excess | |
| 03265980-3712176 | 5.16 | M5 | 9.197 (0.089) | 11.64 | 0.20 | IR excess | |
| 03261930-3744352 | 5.22 | M3 | 9.981 (0.037) | 9.32 | 0.35 | ||
| 03184285-3538356 | 5.58 | M4 | 9.191 (0.076) | 11.07 | 0.20 | ||
| 03132905-3609026 | 5.61 | M3.5 | 9.839 (0.057) | 9.78 | 0.30 | ||
| 03151711-3702301 | HD 20379 | 5.94 | F5 | 9.935 (0.026) | 3.52 | 1.40 | RV=17.590.97 |
| 03121329-3706151 | 6.15 | M1.5 | 9.778 (0.390) | 8.49 | 0.45 | ||
| 03214475-3309494 | 6.19 | M3 | 9.897 (0.051) | 9.66 | 0.35 | Binary | |
| B | 6.19 | M3.5 | 9.897 (0.051) | 9.93 | 0.30 | Binary | |
| 03252401-3706057 | 6.26 | M3.5 | 10.169 (0.046) | 9.83 | 0.30 | ||
| 03380114-3334215 | 6.44 | M5.5 | 9.362 (0.174) | 12.26 | 0.15 | See table notes | |
| 03243582-3221528 | 6.58 | M3 | 9.490 (0.091) | 9.31 | 0.35 | ||
| 03320810-3413201 | 6.60 | M3.5 | 9.114 (0.048) | 9.71 | 0.30 | ||
| 03353519-3304505 | 6.67 | K7 | 9.342 (0.026) | 7.62 | 0.60 | RV=20.002.04 | |
| 03230624-3624131 | 6.87 | M8 | 9.024 (0.331) | 14.04 | 0.10 | IR excess | |
| 03274299-3214077 | 6.90 | K6 | 9.430 (0.027) | 7.08 | 0.70 | RV=18.812.23 | |
| 03160305-3725222 | CD-37 1224 | 7.05 | G8 | 10.091 (0.023) | 4.83 | 0.90 | See table notes |
| 03273888-3755432 | 7.10 | M6 | 9.074 (0.134) | 12.89 | 0.15 | ||
| 03410202-3251005 | 7.65 | M4 | 9.671 (0.072) | 10.82 | 0.20 | ||
| 03432786-3330081 | HD 23380 | 7.82 | F2 | 9.401 (0.033) | 3.15 | 1.50 | IR excess |
| 03384658-3337289 | 8.08 | M4 | 9.126 (0.053) | 10.09 | 0.20 | ||
| 03262402-4008431 | 8.24 | M6 | 9.867 (0.106) | 12.76 | 0.15 | ||
| 03231537-3247371 | 9.02 | M6 | 9.003 (0.160) | 12.87 | 0.15 | ||
| 03234843-3652388 | 9.20 | M4 | 10.502 (0.061) | 10.20 | 0.20 | ||
| 03364806-3239493 | 9.45 | M3.5 | 9.040 (0.045) | 9.95 | 0.30 | ||
| 03160047-3729058 | 9.52 | M4 | 8.905 (0.083) | 10.87 | 0.20 | ||
| 03465367-3916341 | 9.82 | M3 | 9.355 (0.042) | 9.59 | 0.35 | ||
| 03341952-3431171 | 10.11 | M4 | 8.803 (0.081) | 11.01 | 0.20 | ||
| 02592723-3713404 | 10.37 | M5.5 | 9.580 (0.113) | 12.24 | 0.15 | ||
| 03310546-3039084 | 10.40 | M4 | 9.253 (0.078) | 10.58 | 0.20 | ||
| 03424074-3439560 | 10.66 | M0 | 8.863 (0.022) | 8.07 | 0.55 | Binary | |
| 03424123-3439413 | 10.66 | M4 | 8.863 (0.022) | 10.34 | 0.20 | Binary | |
| 03313001-3358142 | 10.78 | K5 | 8.754 (0.024) | 6.41 | 0.70 | RV=22.00.5 | |
| 03412520-3258427 | 11.38 | M6 | 8.874 (0.135) | 12.57 | 0.15 | ||
| 03304324-3034477 | 11.43 | M3 | 9.079 (0.047) | 9.39 | 0.35 | ||
| 03142554-3007004 | 11.54 | M2.5 | 9.592 (0.036) | 8.93 | 0.40 | RV=9.68.8 | |
| 03200945-4017402 | HD 20854 | 11.62 | F3 | 8.912 (0.026) | 3.70 | 1.50 | RV=11.90.5 |
| 03041564-3919129 | 11.65 | M4.5 | 10.127 (0.060) | 11.17 | 0.20 | ||
| 03055457-3111275 | 11.71 | M5 | 9.642 (0.086) | 11.25 | 0.20 | ||
| 03240056-3055429 | 11.80 | K9 | 8.953 (0.031) | 7.73 | 0.55 | RV=16.693.24 | |
| 03533894-3443562 | i Eri | 11.86 | B6.5 | 9.057 (0.164) | -0.16 | 5.00 | See table notes |
| 03535952-3442463 | 11.96 | M4.5 | 9.059 (0.070) | 11.35 | 0.20 | See table notes | |
| 03432006-3437384 | 12.15 | M5 | 8.737 (0.099) | 11.68 | 0.20 | ||
| 03312080-3030588 | HD 21955 | 12.21 | G7 | 8.983 (0.102) | 4.51 | 1.60 | Binary; see table notes |
| 03473987-4114014 | 12.34 | M5 | 9.412 (0.081) | 11.52 | 0.20 | ||
| 03390055-3928559 | 12.41 | M4 | 8.787 (0.061) | 10.26 | 0.20 | ||
| 03212391-4033418 | 12.52 | M8 | 8.839 (0.518) | 14.77 | 0.10 | ||
| 03243747-3041230 | 12.54 | M2 | 8.899 (0.038) | 8.34 | 0.40 | Binary | |
| 03243702-3041213 | 12.55 | M4.5 | 8.899 (0.038) | 10.75 | 0.20 | Binary | |
| 03533447-3445140 | 12.67 | M3.5 | 8.937 (0.044) | 9.89 | 0.30 | See table notes | |
| 03303548-3020058 | HD 21881 | 12.78 | F3 | 8.937 (0.038) | 2.90 | 1.50 | RV=30.486.22 |
| 03485139-4038356 | HD 24121 | 12.86 | G3 | 10.136 (0.020) | 4.65 | 1.00 | RV=21.060.53 |
| 03355621-4245510 | 13.01 | M3.5 | 9.766 (0.059) | 10.03 | 0.30 | ||
| 03105227-4139227 | 13.07 | M3 | 10.114 (0.039) | 9.52 | 0.35 | ||
| 03363743-4231544 | 13.19 | K7 | 9.238 (0.021) | 7.43 | 0.60 | RV=30.681.84 | |
| 03503915-4056499 | 13.24 | M5 | 9.203 (0.078) | 11.64 | 0.20 | ||
| 03290832-2947065 | 13.34 | M3 | 8.966 (0.041) | 9.34 | 0.35 | ||
| 03103637-3502240 | 13.46 | M0 | 8.615 (0.015) | 8.00 | 0.55 | RV=18.12.0 | |
| 03443839-2929157 | 13.96 | M2 | 9.263 (0.029) | 8.59 | 0.40 | ||
| 03311122-2832184 | 13.98 | M0 | 9.963 (0.038) | 8.02 | 0.55 | RV=23.051.33 | |
| 03060195-3018206 | 14.31 | M4.5 | 9.064 (0.082) | 11.41 | 0.20 | ||
| 02551799-3344443 | 14.73 | M3.5 | 10.381 (0.044) | 9.73 | 0.30 | ||
| 03245822-4039380 | 14.79 | M3.5 | 10.844 (0.050) | 9.90 | 0.30 | ||
| 03150651-4237352 | 14.83 | M4 | 8.978 (0.187) | 10.67 | 0.20 | ||
| 03370343-3042318 | 15.05 | M5.5 | 8.675 (0.090) | 11.65 | 0.15 | RV=11.93.5 |
Note. — 2MASSJ03221529-3547192 is a close binary, unresolved by 2MASS and WISE. We designate the secondary with the letter B. Thus it is not possible to tell if the excess emission in the WISE 3 and 4 bands is from one or both of the stars. HD 21955 is a close G7 + K5 binary. J0338-3334 may have excess infrared emission (see discussion in Section 3). J0353-3445 and J0353-3442 may be distant (10,000 AU and 29,000 AU separation) companions of i Eri. RV is radial velocity in km s-1. See Note added in proof for radial velocity and other data for CD-37 1224.
| Spec | |||||
|---|---|---|---|---|---|
| TypeaaEach entry in the table is based on three stars in Table 2 of Kraus et al (2014) except M5.5 (two stars). P&M refers to colors given in Pecaut & Mamajek (2013). | (mag) | (mag) | (mag) | (mag) | (P&M) |
| M2 | 8.78 | 5.25 | 3.53 | 0.22 | 0.22 |
| M3 | 9.39 | 5.64 | 3.75 | 0.26 | 0.28 |
| M3.5 | 9.76 | 5.92 | 3.84 | 0.33 | . |
| M4 | 10.69 | 6.67 | 4.02 | 0.37 | 0.35 |
| M4.5 | 11.61 | 7.39 | 4.22 | 0.41 | |
| M5 | 11.77 | 7.44 | 4.33 | 0.42 | 0.41 |
| M5.5 | 12.24 | 7.73 | 4.51 | 0.46 |
| ChiFor | Designation | NUV | NUV-G | (source) | log(/) | |
|---|---|---|---|---|---|---|
| # | (mag) | (mag) | (mag) | (10-12 erg/cm2/s) | ||
| 1 | CD-36 1289 | 9.73 | … | … | 5.0 (XMM) | -2.86 |
| 1.1 (ROSAT) | -3.53 | |||||
| 2A | CD-36 1309aaThese stars are components of visual binaries whose separations are smaller than the ROSAT PSF. The ROSAT source flux is attributed to the primary or secondary based on the inferred values of log(/). | 9.22 | … | … | 1.7aaThese stars are components of visual binaries whose separations are smaller than the ROSAT PSF. The ROSAT source flux is attributed to the primary or secondary based on the inferred values of log(/). (ROSAT) | -3.54aaThese stars are components of visual binaries whose separations are smaller than the ROSAT PSF. The ROSAT source flux is attributed to the primary or secondary based on the inferred values of log(/). |
| 14 | 03270606-3445494 | 14.51 | 21.73 (0.26) | 7.22 | … | … |
| 15A | 03251011-3445277bbGALEX UV source is roughly equidistant from components A and B of these binaries; listed NUV-G colors assume both components contribute equally to the UV flux. | 13.72 | 20.70bbGALEX UV source is roughly equidistant from components A and B of these binaries; listed NUV-G colors assume both components contribute equally to the UV flux. (0.17) | 7.73bbGALEX UV source is roughly equidistant from components A and B of these binaries; listed NUV-G colors assume both components contribute equally to the UV flux. | … | … |
| 15B | 03251033-3445206bbGALEX UV source is roughly equidistant from components A and B of these binaries; listed NUV-G colors assume both components contribute equally to the UV flux. | 13.94 | 20.70bbGALEX UV source is roughly equidistant from components A and B of these binaries; listed NUV-G colors assume both components contribute equally to the UV flux. (0.17) | 7.51bbGALEX UV source is roughly equidistant from components A and B of these binaries; listed NUV-G colors assume both components contribute equally to the UV flux. | … | … |
| 17A | 03303532-3512133 | 15.19 | 23.17 (0.43) | 7.98 | … | … |
| 18 | 03343867-3529039 | 11.63 | 19.66 (0.10) | 8.03 | 0.29 (ROSAT) | -3.6 |
| 21 | CD-37 1263 | 9.87 | 15.23 (0.01) | 5.36 | 2.7 (XMM) | -3.12 |
| 24 | 03343163-3501033 | 13.83 | 20.80 (0.21) | 6.97 | … | … |
| 25A | HD 20707 | 8.10 | 12.397 (0.002) | 4.30 | … | … |
| 26A | 03231580-3435524 | 14.79 | 22.03 (0.39) | 7.24 | … | … |
| … | HD 20484 | 7.01 | 11.738 (0.002) | 4.74 | … | … |
| … | HD 20484BaaThese stars are components of visual binaries whose separations are smaller than the ROSAT PSF. The ROSAT source flux is attributed to the primary or secondary based on the inferred values of log(/). | 14.45 | … | … | 0.44aaThese stars are components of visual binaries whose separations are smaller than the ROSAT PSF. The ROSAT source flux is attributed to the primary or secondary based on the inferred values of log(/). (ROSAT) | -3.16aaThese stars are components of visual binaries whose separations are smaller than the ROSAT PSF. The ROSAT source flux is attributed to the primary or secondary based on the inferred values of log(/). |
| … | 03353527-3702540 | 14.93 | 21.74 (0.29) | 6.81 | … | … |
| … | HD 21341BaaThese stars are components of visual binaries whose separations are smaller than the ROSAT PSF. The ROSAT source flux is attributed to the primary or secondary based on the inferred values of log(/). | 14.86 | … | … | 0.06aaThese stars are components of visual binaries whose separations are smaller than the ROSAT PSF. The ROSAT source flux is attributed to the primary or secondary based on the inferred values of log(/). (ROSAT) | -3.99aaThese stars are components of visual binaries whose separations are smaller than the ROSAT PSF. The ROSAT source flux is attributed to the primary or secondary based on the inferred values of log(/). |
| … | 03265980-3712176 | 16.82 | 22.30 (0.38) | 5.48 | … | … |
| … | 03261930-3744352 | 14.33 | 21.25 (0.20) | 6.92 | … | … |
| … | HD 20379 | 8.53 | 13.29 (0.01) | 4.75 | … | … |
| … | 03214475-3309494bbGALEX UV source is roughly equidistant from components A and B of these binaries; listed NUV-G colors assume both components contribute equally to the UV flux. | 14.68 | 21.52bbGALEX UV source is roughly equidistant from components A and B of these binaries; listed NUV-G colors assume both components contribute equally to the UV flux. (0.22) | 7.59bbGALEX UV source is roughly equidistant from components A and B of these binaries; listed NUV-G colors assume both components contribute equally to the UV flux. | … | … |
| … | 03214475-3309494BbbGALEX UV source is roughly equidistant from components A and B of these binaries; listed NUV-G colors assume both components contribute equally to the UV flux. | 14.95 | 21.52bbGALEX UV source is roughly equidistant from components A and B of these binaries; listed NUV-G colors assume both components contribute equally to the UV flux. (0.22) | 7.27bbGALEX UV source is roughly equidistant from components A and B of these binaries; listed NUV-G colors assume both components contribute equally to the UV flux. | … | … |
| … | 03252401-3706057 | 14.79 | 20.95 (0.17) | 6.16 | … | … |
| … | 03243582-3221528 | 14.42 | 21.48 (0.21) | 7.05 | … | … |
| … | 03320810-3413201 | 14.91 | 22.01 (0.35) | 7.10 | … | … |
| … | 03353519-3304505 | 12.77 | 20.33 (0.08) | 7.56 | … | … |
| … | 03274299-3214077 | 12.21 | 20.35 (0.11) | 8.14 | … | … |
| … | CD-37 1224 | 9.81 | 15.47 (0.01) | 5.66 | 0.88 (ROSAT) | -3.54 |
| … | 03465367-3916341 | 14.73 | 21.83 (0.48) | 7.09 | … | … |
| … | 03424074-3439560aaThese stars are components of visual binaries whose separations are smaller than the ROSAT PSF. The ROSAT source flux is attributed to the primary or secondary based on the inferred values of log(/). | 13.33 | 21.14 (0.28) | 7.80 | 0.57aaThese stars are components of visual binaries whose separations are smaller than the ROSAT PSF. The ROSAT source flux is attributed to the primary or secondary based on the inferred values of log(/). (ROSAT) | -2.89aaThese stars are components of visual binaries whose separations are smaller than the ROSAT PSF. The ROSAT source flux is attributed to the primary or secondary based on the inferred values of log(/). |
| … | 03313001-3358142 | 11.70 | 19.47 (0.06) | 7.78 | … | … |
| … | 03304324-3034477 | 14.60 | 21.72 (0.26) | 7.12 | … | … |
| … | HD 20854 | 8.95 | 13.27 (0.01) | 4.32 | … | … |
| … | 03240056-3055429 | 12.97 | 20.65 0.15 | 7.68 | … | … |
| … | HD 21955 | 9.74 | 14.75 (0.01) | 5.01 | 1.6 (ROSAT) | -3.39 |
| … | 03390055-3928559 | 15.54 | 22.28 (0.25) | 6.74 | … | … |
| … | 03243747-3041230 | 13.59 | 21.12 (0.19) | 7.52 | … | … |
| … | HD 21881 | 8.14 | 12.43 (0.01) | 4.29 | … | … |
| … | HD 24121 | 9.62 | 14.97 (0.01) | 5.35 | … | … |
| … | 03355621-4245510 | 15.08 | 21.74 (0.36) | 6.66 | … | … |
| … | 03105227-4139227 | 14.50 | 22.14 (0.43) | 7.64 | 0.16 (ROSAT) | -3.12 |
| … | 03363743-4231544 | 12.60 | 22.27 (0.45) | 9.67 | … | … |
| … | 03290832-2947065 | 14.58 | 21.93 (0.27) | 7.36 | … | … |
| … | 03103637-3502240 | 13.32 | 21.50 (0.23) | 8.18 | … | … |
| … | 03311122-2832184 | 13.03 | 22.31 (0.38) | 9.28 | … | … |
| … | 03245822-4039380 | 14.72 | 22.46 (0.42) | 7.74 | … | … |
Table 5 lists all UV photometry (from GALEX; Bianchi et al. 2017) and X-ray data (from the ROSAT All-Sky Survey and XMM-Newton Serendipitous Source Catalog (SSC)) available in the NASA/HEASARC archives222https://heasarc.gsfc.nasa.gov/cgi-bin/W3Browse/w3browse.pl for the cluster candidate members listed in Tables 13. Search radii of 3”, 30”, and 5” were used to identify GALEX, ROSAT, and XMM counterparts to cluster candidates. For ROSAT sources, the X-ray fluxes were obtained by applying a standard (count rate to flux) conversion factor (e.g., Kastner et al 2017); for XMM sources, the fluxes are those listed in the SSC. Bolometric fluxes used to estimate log(/) were obtained from a star’s magnitude and spectral-type-dependent bolometric correction (Pecaut & Mamajek 2013). The resulting NUV-G colors and log(/) values for the stars listed in Table 5 are within the ranges expected for stars of age 100 Myr (i.e., roughly -8 to -5 and -3.5 to -3.0, respectively; e.g., Kastner et al 2017). The lack of UV or X-ray counterparts to 2/3 of the stars in Tables 1 and 2 is readily explained as being due to the limited sensitivities of the ROSAT and GALEX all-sky surveys and the limited sky coverage of pointed XMM-Newton observations.
4 Discussion
At the outset, the primary goal of the present paper was to clarify the membership, structure, and age of the 1 For cluster. But, as is often the case in astronomy, arguably the most interesting finding of this research is a serendipitous discovery a remarkable concentration of M-type stars that possess excess mid-infrared emission (for details see later in this Section). To the best of our knowledge, such a concentration is unprecedented in astronomy.
Following the procedure laid out in King (1962), we characterize the 1 For cluster by a core radius and a limiting tidal radius even though neither of these concepts is quite appropriate for this cluster. King’s core radius is calculated from a polynomial fit to stellar number counts vs. radial offset from the center of a richly populated (globular) cluster. Because the 1 For cluster is far too sparse to apply this method, we simply denote the region in Figure 1 with the largest stellar density, and a size of the order of a parsec, to be the core (Table 1). This radius (1 pc) encompasses more than half of the mass of the cluster within the tidal radius. This core region is far more densely packed, especially with stars of type A, F, and G, than is the rest of the cluster (see discussion below).
King argues that outer boundaries of old clusters are typically delineated by Galactic tides. But he recognized that the timescales for such tides to operate can be quite long, so King’s analysis does not include young open clusters (such as 1 For). Nonetheless, we calculate the tidal radius of the 1 For cluster and consider all stars that have appropriate kinematic and photometric characteristics and that fall within this radius to be likely members of the cluster. The tidal radius is equal to (/3)1/3 (King 1962), where , the distance between Earth and the Galactic Center, is equal to 8200 pc (Gravity Collaboration 2019), and and are, respectively, the total mass (23 ) listed in Tables 1 and 2, and the mass of the Galaxy interior to the Sun. For a solar circular rotation velocity of 240 km s-1, 1011 . Then the tidal radius is 3.5 pc, the corresponding volume is 180 pc3, and mass density is 0.1 pc-3. This is comparable to the local disk density (Mamajek 2016).
Figure 2 is a Gaia-based CMD that includes likely 1 For cluster members out to the tidal radius. For an age of 40 Myr, the dividing line between stars and brown dwarfs lies near the absolute magnitude = 12.4 (Baraffe et al., 2015). Objects in Figure 2 and Tables 2 & 3 near = 14 are brown dwarfs, while various other cluster members lie near the dividing line between stars and brown dwarfs.
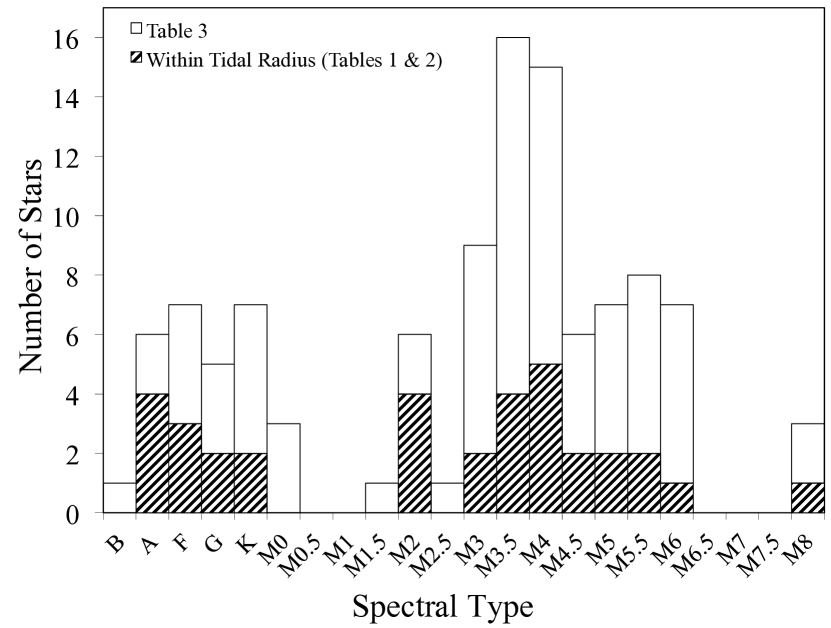
Figure 6 is a histogram of the number of cluster objects listed in Tables 1-3 as a function of spectral type. It is apparent that the 1 For cluster is dominated by mid-M type stars, as is typical of stars of various ages in the solar vicinity. One may compare Figure 6 with the histograms for Tuc-Hor and Columba presented in Figure 9 of Lee & Song (2019). These histograms were constructed from studies before publication of the Gaia DR2 catalog, and thus should be relatively lacking in mid-to-late M-star members. We can anticipate, after the Gaia catalog has been exploited, that the Tuc-Hor and Columba histograms will look more like the one shown in Figure 6.
The mass segregation that is characteristic of clusters more massive stars preferentially near the cluster center is apparent in Tables 1 & 2. Of the 10 stars in the core of the 1 For cluster (Table 1), seven are of spectral types AFG, while of the 24 stars between the core and tidal radii (Table 2), only two are of types AFG.
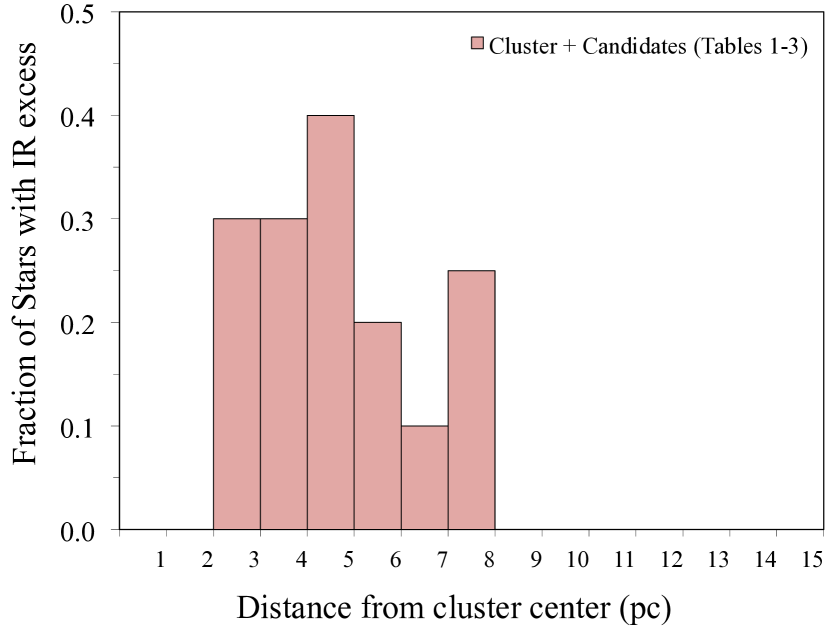
Dusty M-type stars are stunningly abundant in an annulus that surrounds the core of the 1 For cluster (see Figure 7). Tables 1 & 2 indicate 23 M-type stars within the tidal radius of the cluster. Of these, 5 (or 22%) display infrared excess emission in the WISE catalog (Figure 5). Alternatively, Tables 2 & 3 contain a total of 37 M-type stars in a three-dimensional annulus with inner and outer radii of 2 and 7 pc, respectively, centered on the mean position of the stars 1 For and 3 For. Of these 37 stars, 10 (27%) have excess IR emission. And of the 10, most appear to include emission from dust with temperatures of at least a few 100 K. These percentages are far higher than those obtained in all of the numerous searches that have been carried out for dust at M-type stars aged 40 Myr or older (see, e.g. Kraus et al. 2014; Binks & Jeffries 2017; Flaherty et al. 2019, and references therein).
In contrast to the 27% of dusty M-type stars between 2 and 7 pc from cluster center, between 7 and 15 pc there are 39 M-type stars of which none are dusty. Put differently, between 0 and 7 pc there are 10 dusty M-type stars, while in a volume that is 9 times larger between 7 and 15 pc there are none.
M-type stars in the coeval Tuc-Hor Association lack warm dusty debris disks. In a sample of 100 stars with spectral types between M0 and M6, Kraus et al (2014) found none that have excess emission in the WISE3 (11 m) band this to be compared with the 8 in the annulus of dusty stars that surrounds 1 For and 3 For that possess excess W3 emission.
In Tables 2 & 3, the occurrence of IR excesses at five stars that are members of wide binary systems (out of a total of 13 dusty stars) is consistent with the conclusion in Zuckerman (2015) and Silverberg et al (2018) that warm orbiting dust is more likely to be found at a young star that is a member of a wide binary system than at a single star. In addition to these wide binaries, one or both members of the relatively close (60 AU) 0.6” binary J0322-3547 is also dusty. A plausible cause of the overabundance of dusty debris around members of binary stars is the eccentric Kozai-Lidov effect (Naoz 2016). Given an appropriate system age, the K-L effect can generate dynamical instabilities in planetary systems where the orbital plane of the system possesses a substantial inclination with respect to the orbital plane of a distant companion star.
The association of the 1 For cluster with the Columba and Tuc-Hor Associations is based on similar UVW and similar locations on color-magnitude diagrams. Calculation of UVW requires knowledge of parallax, proper motion, and radial velocity. All stars in Tables 1-3 have parallax and proper motion consistent with cluster membership. Of the core stars in Table 1 only four (1 For itself, 3 For, CD-36 1289, and ChiFor 3) have measured radial velocities that we were able to find in the literature (however, see Note added in proof). We used these four stars to calculate the UVW given in the Notes for Table 1. These UVW (-12.3, -21.5, -4.6 km s-1) may be compared with the UVW of Columba (-12.2, -21.3, -5.6 km s-1) and Tuc-Hor (-10.6, -21.0, -2.1 km s-1) given in Mamajek (2016). The UVW of the massive B6 star i Eri (HD 24626) that is located outside of the tidal radius (see Figure 1 and below) is -13.3, -21.5, -5.1 km s-1.
The stars in Tables 2 & 3 with listed radial velocities can be divided into three groups. The first is stars with UVW clearly consistent with the UVW of the 1 For cluster given in the previous paragraph. A second group consists of stars for which the listed radial velocities, if correct, would likely mean that the star does not have the UVW of the cluster and thus is not a member. However, given the (large) size of the error bar of its radial velocity, the star could have the same UVW as the cluster. The third group is composed of stars that are not cluster members if the size of the radial velocity error bar is accurate. Among the stars in Tables 2 & 3, only HD 20854 and J0336-4231, and perhaps J0331-3358, are included in the third group.
Three well-studied clusters are located within 100 pc of Earth, two of which (the Hyades and Coma Berenices) are hundreds of millions of years old, while the age of the third ( Cha) is 10 Myr (Mamajek 2016). Thus, at 40 Myr, the 1 For cluster is well positioned among the other nearby clusters for tracing the evolution of stars and substellar objects. The mass densities of the older clusters fall in the range 0.3-3.0 pc-3, while the Cha core (containing 18 stars) is substantially denser at 30 pc-3 (Mamajek 2016). As may be seen from Table 1, the core of the 1 For cluster contains 10 stars (HD 21434 is an 0.2” binary) within a sphere of radius 1 pc at an average distance from Earth of 104 pc. The mass density of the cluster core is about 3.0 pc-3. This can be compared with the local disk density of 0.1 pc-3 (Mamajek 2016). When, instead, the volume of the 1 For cluster out to its tidal radius of about 3.5 pc is considered, then the cluster mass density is only 0.1 pc-3, i.e. comparable to the local disk density.
The two brightest and most massive core stars (1 For and 3 For) would be just barely visible to a person with excellent eyesight in a dark sky site. A comoving, brighter, more massive, star i Eri is found outside of the cluster tidal radius (Figure 1). We have scrutinized the Gaia DR2 catalog for comoving stars located near i Eri. Only two are present; these may be distant bound companions of i Eri (see notes to Table 3). This relatively massive, obviously comoving, star has not been identified previously as a member of either the Columba or Tuc-Hor Associations; only one star ( Pav) more massive than i Eri has ever been suggested (Zuckerman & Song 2004; Torres et al 2008) to be a member of these associations.
All young nearby stellar associations have been named after a constellation or an important stellar member of an association (Torres et al 2008; Mamajek 2016), or, in the case of naked eye star clusters, after Greek mythology. Given this precedent and the fact that there is only modest overlap between the few stars attributed to Alessi 13 (named after a person) in Dias et al (2002) and the stars listed in the tables in the present paper, we believe that 1 For is a much more descriptive and appropriate name for this cluster. We hope the name 1 For will be adopted in future work.
5 Conclusions
We have investigated the sparse, nearby, southern hemisphere open cluster 1 For. At a distance of 104 pc this cluster is sufficiently youthful and close to Earth that its entire main sequence and even the upper mass end of its brown dwarf sequence are accessible in the Gaia DR2 survey. By comparison (in a Gaia-based CMD; Fig. 2) with the comoving and coeval Columba and Tucana-Horologium Associations, the age of the 1 For cluster is seen to be 40 Myr. The most massive stars within the core of the cluster are the A1-type stars 1 For and 3 For. Perhaps surprisingly, a more massive star i Eri, spectral type B6 that may be associated with this cluster, is located outside of the cluster tidal radius.
But perhaps the most notable finding of our study of the 1 For cluster when compared to all previous studies of stars of age 40 Myr and older and located anywhere in the solar vicinity is an unprecedented abundance of M-type stars that possess excess mid-infrared emission above that due to the stellar photosphere. Based on their investigation of strong mid-IR emission, Melis et al (2010) deduced a characteristic age of 30-100 Myr for the epoch of final catastrophic mass accretion onto terrestrial planets around Sun-like stars. The 40 Myr age of the 1 For cluster and SEDs of many of its M-type members now suggest a similar rocky planet formation time scale around (the less massive) M-type stars. Consistent with past findings for dusty, field, M-type stars (Zuckerman 2015), wide binary systems are overrepresented in the entire 1 For cluster infrared excess sample. This involvement of a second massive body suggests a possible role to be played by the eccentric Kozai-Lidov effect (e.g., Naoz 2016), in dynamically stirring up planetesimal belts. The location of IR excess stars within a well-defined annular region around the cluster core also hints at the influence of stellar neighbors on the stability of planetary systems.
Based on its location in the plane of the sky, its age, and its Galactic space motions UVW, the 1 For cluster is plausibly intimately associated with one or both of the Columba and Tucana-Horologium Associations. But all existing studies of these two spatially dispersed moving groups are limited to stars with typical distances from Earth of well less than 100 pc. Future Gaia-based studies should reveal whether or not these two associations physically surround the 1 For cluster.
Note added in proof
As this paper was going to press, A. Moor (private communication) provided RV and lithium (Li) equivalent width (EW) measurements for a core 1 For member (CD-36 1309) and a candidate member (CD-37 1224) that confirm their status as members of the cluster (see Table 6).
| Star | RV | U,V,W | EW (Li) |
|---|---|---|---|
| (km/s) | (km/s) | (mÅ) | |
| CD-36 1309 | 20.22.0 | -13.1,-23.2,-6.3 | 17015 |
| CD-37 1224 | 17.42.2 | -12.2,-21.7,-5.0 | 22510 |
Acknowledgements
We thank the referee for a timely report and suggestions that helped to improve the paper. This research was supported in part by grants to UCLA from NASA. J.H.K.’s research on young stars near Earth is supported by NASA Astrophysics Data Analysis Program grant NNX12AH37G and NASA Exoplanets Research Program grants NNX16AB43G and 80NSSC19K0292 to RIT.
References
- Baraffe et al. (2015) Baraffe, I., Homeier, D., Allard, F., et al. 2015, A&A, 577, A42
- Bianchi et al. (2017) Bianchi, L., Shiao, B., & Thilker, D. 2017, ApJS, 230, 24B
- Binks, & Jeffries (2017) Binks, A. S., & Jeffries, R. D. 2017, MNRAS, 469, 579
- Cantat-Gaudin et al. (2018) Cantat-Gaudin, T., Jordi, C., Vallenari, A., et al. 2018, A&A, 618, A93
- de la Reza et al. (1989) de la Reza, R., Torres, C. A. O., Quast, G., et al. 1989,ApJ, 343, L61
- Dias et al. (2002) Dias, W. S., Alessi, B. S., Moitinho, A., et al. 2002, A&A, 389, 871
- Dufour et al. (2017) Dufour, P., Blouin, S., Coutu, S., et al. 2017, The Montreal White Dwarf Database, 20th European White Dwarf Workshop, (San Francisco, CA, Astr. Soc. of the Pacific), p. 3
- Flaherty et al. (2019) Flaherty, K., Hughes, A. M., Mamajek, E. E., et al. 2019, ApJ, 872, 92
- Gagné et al. (2018) Gagné, J., Faherty, J. K., & Mamajek, E. E. 2018, ApJ, 865, 136
- Gaia Collaboration et al. (2018) Gaia Collaboration, Brown, A. G. A., Vallenari, A., et al. 2018, A&A, 616, A1
- Gentile Fusillo et al. (2019) Gentile Fusillo, N. P., Tremblay, P.-E., Gaensicke, B. T., et al. 2019, MNRAS, 482, 4570
- Gravity Collaboration et al. (2019) Gravity Collaboration, Abuter, R., Amorim, A., et al. 2019, A&A, 625, L10
- Gregorio-Hetem et al. (1992) Gregorio-Hetem, J., Lepine, J. R. D., Quast, G. et al. 1992 AJ, 103, 549
- Kastner et al. (2017) Kastner, J. H., Sacco, G., Rodriguez, D., et al. 2017, ApJ, 841, 73
- Kastner et al. (1997) Kastner, J. H., Zuckerman, B., Weintraub, D. A., et al. 1997, Science, 277, 67
- Kharchenko et al. (2016) Kharchenko, N. V., Piskunov, A. E., Schilbach, E., et al. 2016, A&A, 585, A101
- King (1962) King, I. 1962, AJ, 67, 471
- Kraus et al. (2014) Kraus, A. L., Shkolnik, E. L., Allers, K. N., et al. 2014, AJ, 147, 146
- Lee, & Song (2019) Lee, J., & Song, I. 2019, MNRAS, 486, 3434
- Lindegren et al. (2018) Lindegren, L., Hernández, J., Bombrun, A., et al. 2018, A&A, 616, A2
- Lodieu et al. (2019) Lodieu, N., Perez-Garrido, A., Smart, R. L., et al. 2019, A&A, 628, A66
- Mamajek (2016) Mamajek, E. E. 2016, in Proceedings of IAU Symp. 314, Young Stars & Planets Near the Sun, eds. J. H. Kastner et al. (Cambridge: Cambridge Univ. Press) 21
- Mason et al. (2015) Mason, B. D., Wycoff, G. L., Hartkopf, W. I., et al. 2015, VizieR Online Data Catalog, B/wds
- Melis et al. (2010) Melis, C., Zuckerman, B., Rhee, J. H., et al. 2010, ApJ, 717, L57
- Naoz (2016) Naoz, S. 2016, ARA&A, 54, 441
- Pecaut, & Mamajek (2013) Pecaut, M. J., & Mamajek, E. E. 2013, ApJS, 208, 9
- Pöhnl & Paunzen (2010) Pöhnl, H. & Paunzen, E. 2010, A&A, 514A, 81P
- Silverberg et al. (2018) Silverberg, S. M., Kuchner, M. J., Wisniewski, J. P., et al. 2018, ApJ, 868, 43
- Torres et al. (2008) Torres, C. A. O., Quast, G. R., Melo, C. H. F., et al. 2008, Handbook of Star Forming Regions, Volume 2, (San Francisco, CA, Astr. Soc. of the Pacific), p. 757
- Wright et al. (2010) Wright, E. L., Eisenhardt, P. R. M., Mainzer, A. K., et al. 2010, AJ, 140, 1868
- Yen et al. (2018) Yen, S. X., Reffert, S., Schilbach, E., et al. 2018, A&A, 615, A12
- Zuckerman (2015) Zuckerman, B. 2015, ApJ, 798, 86
- Zuckerman, & Song (2004) Zuckerman, B., & Song, I. 2004, ARA&A, 42, 685
- Zuckerman et al. (2001) Zuckerman, B., Song, I., & Webb, R. A. 2001, ApJ, 559, 388