The role of cluster mass in the multiple populations of Galactic and extragalactic globular clusters
Abstract
Studies based on Hubble Space Telescope (HST) photometry in F275W, F336W, and F438W have shown that the incidence and complexity of multiple populations (MPs) in Globular Clusters (GCs) depend on cluster mass. This result, however, is based on nearby, low-reddening Galactic GCs, for which we can obtain accurate F275W photometry.
In this work we exploit HST photometry in F336W, F438W, and F814W to characterize MPs in 68 Galactic and extragalactic GCs by using the pseudo-color , which is more efficient in terms of observation time than the pseudo-color adopted in previous works.
We first analyzed the Galactic GCs alone and find that the RGB color width strongly correlates with [Fe/H]. After removing the dependence from metallicity, we obtain a strong correlation with cluster mass, thus confirming previous findings.
We then exploited the RGB width to compare MPs in Galactic and extragalactic GCs. Similarly to Galactic GCs, the RGB width of Magellanic Cloud GCs correlates with clusters mass, after removing the dependence from metallicity. This fact demonstrates that cluster mass is the main factor affecting the properties of MPs.
Magellanic Cloud clusters exhibit, on average, narrower RGBs than Galactic GCs with similar mass and metallicity. We suggest that this difference is a signature of stellar mass loss in Galactic GCs. As an alternative, the mass-RGB-width relation would depend on the host galaxy.
Finally, we used ground-based photometry to investigate Terzan 7 through the pseudo-color, ground-based analogous of , and find that this cluster is consistent with a simple population.
1 Introduction
Growing evidence of the unique properties of globular clusters (GCs) has accumulated in the last two decades. The discovery of different groups of stars, with well-defined abundance patterns of specific chemical elements, namely C, N, O, Na, and in some cases also Mg and Al, known as ‘multiple populations’ (MPs), turned out to be a peculiar characteristic of almost all GCs in our Galaxy (e.g. Kraft, 1994; Gratton et al., 2012; Marino et al., 2019, and references therein).
A general feature of GCs is the presence of two main stellar populations, one with chemical composition typical of halo stars of the same metallicity, usually referred to as primordial population or ‘1G’ stars, and another with abundance of N and Na higher than that of 1G stars, referred to as enriched population or ‘2G’ stars. Furthermore, 2G stars are typically also enriched in helium (e.g. Lagioia et al., 2018; Milone et al., 2018). Both 2G and, to a lesser extent, 1G stars contain, however, a varying number of subgroups of stars, each one with different chemical content (e.g. Milone et al., 2015a, b; Marino et al., 2019), while the ratio of 1G to 2G stars is not constant in all GCs but ranges from about 10% to 60% (Milone et al., 2017). The composite phenomenology of MPs suggests that peculiar processes of star formation, chemical evolution and dynamical interactions are at work in the internal environment of star clusters (e.g. Decressin et al., 2007; D’Antona et al., 2016; Gieles et al., 2018).
A comprehensive framework for the interpretation of the multifaceted characteristics of MPs requires a common metrics that has the potential of quantifying the extension of chemical spread in a given cluster. To this purpose, an effective solution is provided by the color extension, or width, of the red giant branch (RGB) in color-magnitude diagrams (CMDs) obtained with proper combinations of ultraviolet (UV) and optical bands.
A systematic measurement of the RGB width in the color and in the pseudo-color has been recently performed by Milone et al. (2017) for the 57 GCs observed for the Hubble Space Telescope (HST) UV Legacy Survey of Galactic GCs (see Piotto et al., 2015, and references therein). An important result of this work concerns the statistical analysis of the correlation between the global parameters of GCs and the RGB width. It revealed that, after taking into account the contribution of the metallicity to the observed spread, the RGB width appears to be strongly correlated with the cluster mass, thus suggesting a major role for this parameter in the determination of the observed MP properties.
The sample of clusters studied by Milone and collaborators comprises only Galactic GCs older than Gyr (e.g. Dotter et al., 2010). It is challenging, therefore, to infer strong constraints on the effect of cluster age and on the role of the host galaxy on the onset of MPs from their sample only. The recent discovery of the presence of MPs in Magellanic Clouds (MCs) (e.g. Lagioia et al., 2019; Martocchia et al., 2018; Niederhofer et al., 2017a) and Fornax GCs (e.g. Larsen et al., 2014, 2012) indicates that the MP phenomenon is not limited to our Galaxy but rather a common characteristic of GCs. In this regard, the comparison of the observational features of Galactic and extragalactic GCs presents us the opportunity to test the role played by the external environment in the determination of the MP properties.
As seen above, the results obtained by Milone et al. (2017) rely on F275W band data, which are sensitive to the oxygen abundance through the spectral absorption of the OH molecule. This benefit, however, is counterbalanced by the difficulty to obtain F275W images with sufficiently high S/N for the most absorbed or the most distant clusters.
The pseudo-color (Monelli et al., 2013) offers a valuable alternative to investigate MPs in GCs. As demonstrated by Marino et al. (2008) the broad-band filters and are ideal to photometrically disentangle carbon and nitrogen variations in RGB stars, while the large baseline offered by the optical color , makes the also sensitive to the helium content of stars through the effective temperature (; Milone et al., 2012a). For this reason, the spread of the RGB sequence in this pseudo-color is proportional to the variation of chemical content among the underlying MPs.
With the aim of comparing the MP properties of a sample of 68 Galactic and extragalactic GCs, we exploit the RGB width in the pseudo-color to investigate the relationships between MPs and a series of morphological, structural and physical GC parameters. The choice of the three HST bands F336W, F438W and F814W, which are analogous to the Johnson-Cousins U, B and I bands, is justified by three empirical reasons: i) the aforementioned sensitivity of these bands to the C, N, O and He content of GC RGB stars; ii) the availability of a large number of archival observations in these three bands, in the archives of both HST and ground-based telescopes; iii) the foreclosure of far-UV observations in the post-HST era. Moreover, for a fixed signal-to-noise ratio, observations in F336W, F438W, and F814W require much shorted HST time than F275W, F336W and F438W. As a consequence, this filters make it possible to investigate the MP phenomenon in distant clusters. In addition, we exploit ground-based photometry to investigate the GC Terzan 7.
This paper is organized as follows: in Section 2 we describe the dataset and the techniques for the analysis of the photometric data; in Section 3 we define the RGB width and describe the methodology to measure this quantity and the corresponding error for all the GCs in our database; in Section 4 we perform a statistical analysis to test the correlation between the RGB width and a set of GC global parameters; in Section 5, we perform a similar analysis after removing the effect of metallicity on the RGB width; in Section 6, by means of synthetic spectra analysis, we study the behavior of the theoretical RGB width, obtained from appropriate theoretical models, as a function of metallicity and age; this allows us to properly compare, in Section 7, the RGB width properties of the Galactic and extragalactic GCs in our database; in Section 8 we analyze in detail the relation between the RGB width and the age of the clusters. Finally, Section 9 provides a summary of the main results.
2 Observations and data reduction
The cluster database analyzed in this work is composed of Galactic and extragalactic GCs. The Galactic sample includes the 57 GCs present in Milone et al. (2017) plus the GC IC 4499 (Milone et al., 2018), and has been complemented with the Galactic GCs NGC 2419 (Zennaro et al., 2019) and Ruprecht 106 (Rup 106; Dotter et al., 2018). The extragalactic database includes: six Small Magellanic Cloud (SMC) clusters, namely NGC 121, NGC 339, NGC 416, Lindsay 1, Lindsay 38, and Lindsay 113; the Large Magellanic Cloud (LMC) NGC 1978; the cluster Terzan 7 associated to the Sagittarius Dwarf spheroidal (Sbordone et al., 2005). Details about photometric reduction, differential reddening correction and cluster membership selection can be found in Milone et al. (2017) and Milone et al. (2018) for the 58 Galactic GCs, in Zennaro et al. (2019) for NGC 2419 and Dotter et al. (2018) for Rup 106, and in Lagioia et al. (2019) for the SMC clusters NGC 121, NGC 339, NGC 416, and Lindsay 1. Archival images of the remaining GCs, namely Lindsay 38, Lindsay 113, NGC 1978, collected through the Wide Field Channel of the Advanced Camera for Surveys (WFC/ACS) and the Ultraviolet and Visual Channel of the Wide Field Camera 3 (WFC3/UVIS) onboard HST, and archival images of Terzan 7 collected through Focal Reducer/low dispersion Spectrograph 2 (FORS2) at the Very Large Telescope (VLT), have been specifically processed for this work, according to the procedures described in the following section. Observation details about these four clusters are reported in Table 1.
| Cluster | Date | Camera | Filter | Nexposure time (s) | Program ID |
|---|---|---|---|---|---|
| Lindsay 38 | Jun 03 2004 – 18 Aug 2005 | WFC/ACS | F555W | 9891,10396 | |
| Jun 03 2004 – 18 Aug 2005 | ” | F814W | ” | ||
| Oct 21 2017 | WFC3/UVIS | F336W | 15062 | ||
| Oct 21 2017 | ” | F343N | ” | ||
| Oct 21 2017 | ” | F438W | ” | ||
| Lindsay 113 | Jun 03 2004 | WFC/ACS | F555W | 9891 | |
| Jun 03 2004 | ” | F814W | ” | ||
| Sep 05 2018 | WFC3/UVIS | F336W | 15062 | ||
| Sep 05 2018 | ” | F343N | ” | ||
| Sep 05 2018 | ” | F438W | ” | ||
| NGC 1978 | Oct 07 2003 | WFC/ACS | F555W | 9891 | |
| Oct 07 2003 | ” | F814W | ” | ||
| Aug 15 2011 – Sep 25 2016 | WFC3/UVIS | F336W | 12257, 14069 | ||
| Aug 15 2011 | ” | F555W | 12257 | ||
| Sep 25 2016 | ” | F343N | 14069 | ||
| Sep 25 2016 | ” | F438W | ” | ||
| Terzan 7 | Apr 14 2004 | FORS2@VLT | 073.D-0273 | ||
| Mar 18 2006 | ” | 077.D-0775 | |||
| Mar 18 – 22 2011 | ” | 087.D-0290 |
2.1 Lindsay 38, Lindsay 113 and NGC 1978
The images of the clusters Lindsay 38, Lindsay 113 and NGC 1978, available at the HST MAST archive111http://archive.stsci.edu/hst/, have been reduced following the procedure described in Anderson et al. (2008) and used by Lagioia et al. (2019) for the analysis of the aforementioned four SMC GCs. Shortly, the data reduction was performed on the flt images after applying the correction for poor Charge Transfer Efficiency Anderson & Bedin (2010). For each scientific frame, an array of Point Spread Functions (PSFs) has been computed, starting from library empirical PSFs and adding to each PSF a spatial variation correction computed from isolated, unsaturated bright stars. The HST image reduction software img2xym (Anderson et al., 2006) was used to detect bright stars and accurately determine their position and flux. This program takes also into account the amount of star’s flux bled into adjacent pixels (Anderson et al., 2008; Gilliland, 2004; Gilliland et al., 2010). The position and flux of faint stars was obtained with a different program (KS2; J. Anderson et al., in preparation), which combines the information of position and flux of each star in all the frames in which a star’s image in present. Details about this algorithm can be found in Sabbi et al. (2016) and Bellini et al. (2017). The instrumental magnitudes have been calibrated to the VEGAMAG system according to Bedin et al. (2005). The encircled energy distribution corrections and Zero Points of the UVIS detector of the WFC3 camera have been taken from the STScI website222http://www.stsci.edu/hst/wfc3/analysis/uvis_zpts/,/ http://www.stsci.edu/hst/acs/analysis/zeropoints. Stellar positions have been corrected for geometric distortion by using the solution provided by Bellini et al. (2011). As a final step, for our analysis we selected the best-measured stars by employing the photometric quality indexes provided by the software (see Milone et al., 2009).
Finally, we found that, by applying the method of Milone et al. (2012b), the effect of differential reddening on the photometry of Lindsay 38 and NGC 1978 is negligible, being below the typical photometric errors. No correction for differential reddening has been applied, therefore, to these two clusters. On the other hand, with the same method, we estimated the reddening variation in the field of view (FoV) of Lindsay 113 and found ranging within mag, with 68.27% of stars having mag. We applied this correction to the magnitudes of Lindsay 113 using the following relations for the total-to-differential absorption: , , and Dotter (2016, private communication).
2.2 Terzan 7
For this cluster we used and band images available at the ESO archive 333archive.eso.org/cms.html. The observation dataset of Terzan 7 includes 41 exposures, of which 35 in the band, three in the band, and three in the band. All the exposures were collected with the High-Resolution collimator, resulting in a reduced total FoV of arcmin and a pixel scale of arcsec/pixel. Additional details concerning the specific observations are provided in Table 1.
Every FORS2 frame is composed of two images, one for each of the two chips making up the FORS2 detector. The exposures have been collected following a dithering pattern which includes the cluster core radius (0.77 arcmin; Harris, 1996, 2010 update) in the upper part of the detector or ‘chip 1’. Pre-reduction of science data, consisting in bias subtraction and subsequent flat-field correction, was performed with the pipeline EsoReflex (Freudling et al., 2013). The reduction workflow of this program automatically selects, for each science frame, the correct calibration frames listed in the association (.xml) files retrieved from the archive together with science FITS files. Finally, every pre-reduced frame has been split into two portions, corresponding to the ‘chip 1’ and ‘chip 2’ (lower chip) images. Each image has been then analyzed separately.
Point-spread function (PSF) photometry has been performed with DAOPHOT and ALLSTAR (Stetson, 1987, 1994). For each image, the computation of the best PSF model has been carried out by selecting 40 to 50 high S/N stars, subtracting the contribution of the neighbor stars to the their luminosity profile and computing the resulting PSF model. The procedure was repeated by increasing, at every step, the degrees of freedom of the spatial variation of the PSF across the frame, starting from a pure analytical model and ending with a quadratically varying PSF. By matching all the single star lists with appropriate geometric transformation we obtained a master list containing all the stars measured at least once in the various images. The geometric transformation solution has been found with DAOMATCH and DAOMASTER (Stetson, 1990). Then, by running ALLFRAME (Stetson, 1994), every star in the master list that was present, according to the geometric transformation, in each single frame, has been measured again and, for each image a new list of improved position and magnitudes obtained.
For each filter, the new star lists have then been matched, obtaining three catalogs of instrumental position and magnitude in U, B and I, respectively. Finally the position of the B-band and I-band catalogs have been transformed to the reference system of the U-band one.
Unfortunately no standard-star fields in U band have been observed for both the U-band observing runs, namely on 18 and 22 March 2011. Furthermore, to our knowledge no catalogs including secondary photometric standard stars in this passband are available for the FoV covered by the observation dataset. Since, as a consequence, it was not possible to calibrate the images in U band, we performed the following analysis using instrumental magnitudes. We notice, however, that our analysis is based on the measurement of the cluster RGB width which is a relative quantity and, as such, it is negligibly affected by the use of calibrated magnitudes.
For our analysis, we selected the best measured stars by using the photometry quality parameters provided by the software, namely and (Stetson, 1987). In particular we rejected stars with and .
Finally, since the effect of differential reddening on the photometry of this cluster is negligible, no correction has been applied.
2.3 Cluster membership
For the Galactic GCs in our database, the cluster membership of stars has been assessed on the basis of their proper motions, as described in Milone et al. (2017, 2018), to which we refer the interested reader. For all the other clusters, we adopted the same procedure used in the analysis of Lagioia et al. (2019), based on the star’s position in the observed FoV: we empirically determined the center of each cluster by eye and then selected all the stars within 0.67 arcmin from the cluster center. Only in the case of Terzan 7, we flagged as cluster members all the stars within the cluster half-light radius (0.77 arcmin; Harris, 1996, 2010 update), which are all located in the ‘chip 1’. In this case, the radial selection, about a factor of times larger than the previous one, compensates for the lower number of detections in the central cluster region, due to the fact that crowding in the cluster core is critical for ground-based observations. We notice that the adopted radial selection includes the central region of every cluster, thus resulting in a marginal field star contamination.
In the following we refer our analysis only to the cluster member stars. For each GC, we tagged as RGB only those stars lying along the observed RGB sequence in all the different UV and optical color combinations, in order to exclude possible contamination from Asymptotic Giant Branch (AGB) and Horizontal Branch (HB) stars.
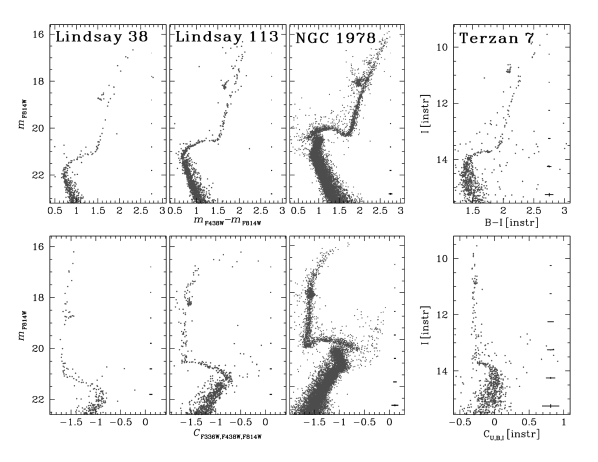
The final CMDs of Lindsay 38, Lindsay 113, NGC 1978 and Terzan 7 have been plotted in Figure 1 which displays the vs. CMDs and vs. pseudo-CMDs of the cluster members, respectively in the top and bottom panels. In the case of Terzan 7 the instrumental vs. CMD and vs. pseudo-CMD are displayed. A glance at the CMDs reveals that the total number of RGB stars considerably changes from one cluster to another, with Lindsay 38 and NGC 1978 being, respectively, the least and most populated cluster. The error bars plotted on the right side of each panel indicate the typical photometric errors along the entire magnitude extension of the CMD.
2.4 Global cluster parameters
This work includes the study of the monotonic relationship between the RGB width of the Galactic GCs and a set of global GC parameters (see Sect. 4) composed by 45 observational, morphological and dynamical quantities. In particular, we obtained: from Harris (1996, 2010 update): metallicity ([Fe/H]), reddening (), absolute visual magnitude (), central surface brightness (SB0), central luminosity density (), projected ellipticity of isophotes (epsilon), and concentration (c); from Baumgardt & Hilker (2018, and references therein) total cluster mass (Mass), mass-to-light ratio in V band (M/L), cluster core radius (rc), projected half-light radius (rhl), half-mass radius (rhm), tidal radius (rt), core density () half-mass radius density (), half-mass relaxation time (), slope of mass function (MF slope), mass fraction of remnants (), central velocity dispersion (), central escape velocity (), mass segregation parameter for stars within 0.5 and 0.8 inside the core () and inside the half-mass radius (); from Baumgardt et al. (2019, and references therein): mean heliocentric radial velocity (), X, Y, Z component of the cluster position and the corresponding velocity component U, V, W, distance from the center of the Galaxy (), perigalacticon (), apogalacticon (); from Marín-Franch et al. (2009): relative age () based on Dotter et al. (2007) models in the Carretta & Gratton (1997) scale; absolute ages both from Dotter et al. (2010, 2011) and (Milone et al., 2014) () and VandenBerg et al. (2013) (); from Milone et al. (2018): mean and maximum internal helium variation (, ); from Milone et al. (2017): width of the RGB measured in the pseudo-color ((M17)), ratio of 1G stars to total number of stars (); from the 2003 edition of the Harris catalog of GCs (Harris, 1996): specific frequency of RR Lyræ (S(RR Lyr)); from Milone et al. (2012b): fraction of binaries in the cluster core (), between the cluster core and the half-mass radius (), and beyond the half-mass radius (); from Mackey & van den Bergh (2005): horizontal branch ratio (HBR); from Milone et al. (2014): extension of () color of the HB (L2).
Masses and structural parameters by Baumgardt & Hilker (2018) have been obtained from N-body simulations based on velocity dispersion and surface density profiles deriving from archival radial velocities from ESO/VLT and Keck. The orbital parameters by Baumgardt et al. (2019) have been obtained by cross-matching the aforementioned radial velocities and GAIA Data Release 2 proper motions (Gaia Collaboration, 2018).
3 Measurement of the intrinsic RGB width
In this section we describe the procedure to measure the RGB width in the pseudo-color , for each GC in our database, using the SMC cluster NGC 416 as a template to illustrate the methodology.
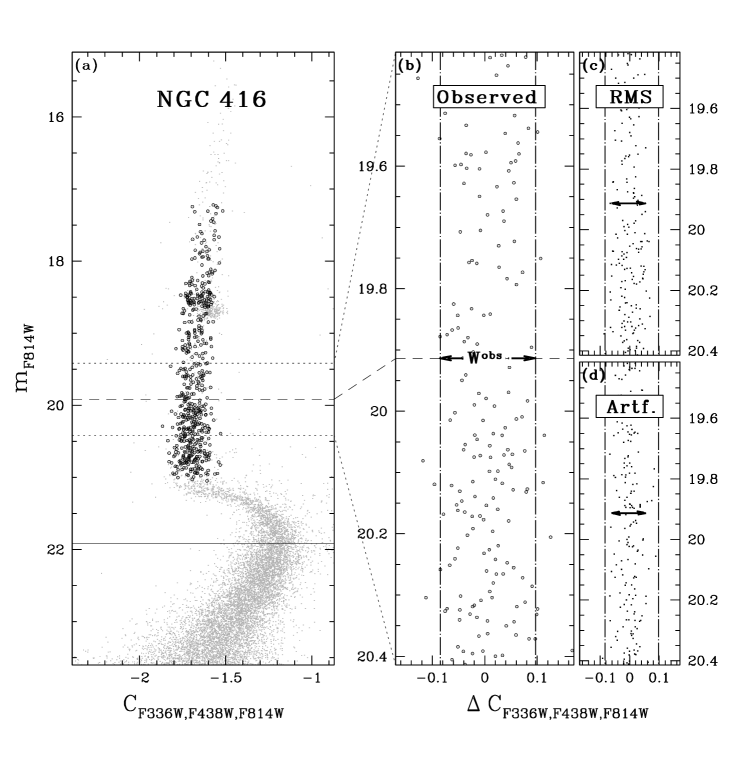
Panel (a) of Figure 2 displays the vs CMD of NGC 416, with the cluster stars represented as gray dots. The first step consisted in the measurement of the main sequence turn-off (MSTO) luminosity, , represented as a solid black line in the plot. The quantity has been determined by using the naive estimator of Silverman (1986), which consists in: i) the subdivision of the analyzed magnitude range in a given number of magnitude bins and the calculation of the median color and magnitude of the stars included in each bin; ii) the implementation of the previous algorithm for different bin series, obtained by shifting the starting point defining the first bin, of a quantity equal to a fraction of the predefined bin width. The magnitude and color of the resulting median points has been smoothed by boxcar averaging three adjacent points, and the bluest color of the linear function interpolating the resulting smooth function has been taken as the estimate. The following step was the definition of a luminosity interval of 1 mag centered around the reference luminosity defined as (see Milone et al., 2017) and indicated as a dashed line. The two dotted lines in the plot delimit the selected magnitude interval. At this point, we computed the RGB fiducial line of the RGB stars, by using the method described above, and measured the pseudo-color difference between each RGB stars and the fiducial line at the same F814W magnitude (). Panel (b) in Fig. 2 shows against . The observed RGB width, , corresponds to the difference between the and percentile (vertical lines in the plot) of the distribution, and is equal, in the case of NGC 416, to 0.180 mag.
The error on the estimate of the observed width was obtained by carrying out 10,000 bootstrapping tests on random sampling with replacement of the observed RGB stars in the selected magnitude interval. Each test consists in the generation of an artificial sample containing 1,000 sequential copies of the observed stellar colors and the subsequent random extraction of a subsample composed of a number of colors equal to the observed one. For each extraction we then computed the corresponding RGB width. The percentile of the resulting distribution of the 10,000 bootstrapping measurements was taken as the standard error of , equal to 0.013 mag for NGC 416.
, however, does not correspond to the intrinsic width of the cluster RGB, because the photometric errors concur to the observed broadening of the RGB. In order to quantify such spurious contribution, we took advantage of the magnitude r.m.s. of the stars in the selected magnitude interval. For each cluster, we simulated a series of 10,000 artificial CMDs, with a random color spread based on the observed color errors. To do this we assigned to each observed star in the selected magnitude interval, an artificial error, in each of the three bands F336W, F438W and F814W. The artificial error was obtained by extracting a random value from a simulated Gaussian error distribution with a standard deviation equal to the observed star’s magnitude standard error, derived from the reduction software. We then measured the resulting artificial RGB width and subtracted it in quadrature from the observed RGB width, obtaining an estimate of the intrinsic width. We repeated this procedure 10,000 times and took the mean value resulting from the whole set of simulations as the intrinsic width of the cluster. We obtained for NGC 416 mag. As an example, in panel (c), we plotted the vs. diagram, for one simulation, and indicated the corresponding RGB width with the double arrow. For a quick comparison, we plotted again the observed and percentile vertical lines in this panel.
Artificial stars (ASs) provide an independent estimate of the contribution of the photometric error. To obtain this estimate, we applied the same procedure described above but using a randomly extracted sub-sample of ASs composed of the same number of observed stars and derived the corresponding value, as shown in panel (d) of Figure 2. The latter value represents the difference between the input and output pseudo-color, obtained from the ASs test (see Lagioia et al., 2019, and references therein). We obtained mag, the same value within 0.001 mag as that obtained by using the star’s r.m.s.
We applied the above procedure to compute the intrinsic RGB width of all the 68 clusters analyzed in this work. Since AS catalogs are, at the present time, only available for the MC GCs in our database, for these clusters only we used the ASs for the calculation of the photometric error contribution. Moreover, since Lindsay 113 shows a sparsely populated RGB, for this GC we repeated the procedure for the estimate of the intrinsic RGB width by excluding first the bluest and then also the reddest RGB stars in the selected magnitude interval. The average of the two RGB width estimates was taken as the final RGB width, while the half interval between them as the associated error. The intrinsic RGB values of all the analyzed clusters have been reported in Table 2. We see that the estimates range from a minimum value of 0.034 mag (Lindsay 38) to a maximum value of 0.332 mag (NGC 6441) and that the majority of GCs are distributed in the interval 0.1 – 0.2.
| ID | ID | |||||||
|---|---|---|---|---|---|---|---|---|
| (mag) | (mag) | (mag) | (mag) | |||||
| IC 4499 | 0.118 | 0.018 | -0\@alignment@align.012 | NGC 6205 | 0.154 | 0.005 | 0.024 | |
| LINDSAY 1 | 0.135 | 0.009 | -0\@alignment@align.023 | NGC 6218 | 0.156 | 0.008 | 0.014 | |
| LINDSAY 38 | 0.034 | 0.014 | -0\@alignment@align.098 | NGC 6254 | 0.151 | 0.008 | 0.023 | |
| LINDSAY 113 | 0.108 | 0.037 | -0\@alignment@align.031 | NGC 6304 | 0.222 | 0.010 | 0.016 | |
| NGC 104 | 0.205 | 0.006 | 0\@alignment@align.018 | NGC 6341 | 0.115 | 0.006 | 0.040 | |
| NGC 121 | 0.157 | 0.008 | 0\@alignment@align.011 | NGC 6352 | 0.198 | 0.012 | 0.005 | |
| NGC 288 | 0.148 | 0.028 | 0\@alignment@align.003 | NGC 6362 | 0.174 | 0.011 | 0.006 | |
| NGC 339 | 0.075 | 0.004 | -0\@alignment@align.084 | NGC 6366 | 0.173 | 0.022 | -0.023 | |
| NGC 362 | 0.155 | 0.005 | 0\@alignment@align.006 | NGC 6388 | 0.303 | 0.007 | 0.104 | |
| NGC 416 | 0.151 | 0.013 | -0\@alignment@align.019 | NGC 6397 | 0.103 | 0.031 | 0.007 | |
| NGC 1261 | 0.145 | 0.006 | 0\@alignment@align.002 | NGC 6441 | 0.332 | 0.011 | 0.126 | |
| NGC 1851 | 0.173 | 0.010 | 0\@alignment@align.027 | NGC 6496 | 0.173 | 0.019 | -0.033 | |
| NGC 1978 | 0.129 | 0.009 | -0\@alignment@align.084 | NGC 6535 | 0.085 | 0.031 | -0.027 | |
| NGC 2298 | 0.116 | 0.018 | 0\@alignment@align.013 | NGC 6541 | 0.142 | 0.006 | 0.031 | |
| NGC 2419 | 0.205 | 0.009 | 0\@alignment@align.118 | NGC 6584 | 0.153 | 0.005 | 0.021 | |
| NGC 2808 | 0.199 | 0.004 | 0\@alignment@align.041 | NGC 6624 | 0.234 | 0.008 | 0.027 | |
| NGC 3201 | 0.153 | 0.014 | 0\@alignment@align.027 | NGC 6637 | 0.197 | 0.007 | 0.004 | |
| NGC 4590 | 0.104 | 0.017 | 0\@alignment@align.023 | NGC 6652 | 0.174 | 0.008 | -0.007 | |
| NGC 4833 | 0.126 | 0.007 | 0\@alignment@align.018 | NGC 6656 | 0.148 | 0.012 | 0.064 | |
| NGC 5024 | 0.117 | 0.005 | 0\@alignment@align.027 | NGC 6681 | 0.147 | 0.008 | 0.023 | |
| NGC 5053 | 0.087 | 0.020 | 0\@alignment@align.009 | NGC 6715 | 0.189 | 0.013 | 0.085 | |
| NGC 5139 | 0.184 | 0.006 | 0\@alignment@align.131 | NGC 6717 | 0.154 | 0.022 | 0.005 | |
| NGC 5272 | 0.131 | 0.005 | -0\@alignment@align.001 | NGC 6723 | 0.210 | 0.007 | 0.049 | |
| NGC 5286 | 0.207 | 0.012 | 0\@alignment@align.102 | NGC 6752 | 0.162 | 0.011 | 0.032 | |
| NGC 5466 | 0.078 | 0.006 | -0\@alignment@align.021 | NGC 6779 | 0.137 | 0.009 | 0.038 | |
| NGC 5897 | 0.117 | 0.031 | 0\@alignment@align.013 | NGC 6809 | 0.106 | 0.012 | 0.005 | |
| NGC 5904 | 0.192 | 0.015 | 0\@alignment@align.045 | NGC 6838 | 0.167 | 0.011 | -0.016 | |
| NGC 5927 | 0.245 | 0.013 | 0\@alignment@align.042 | NGC 6934 | 0.185 | 0.011 | 0.045 | |
| NGC 5986 | 0.180 | 0.009 | 0\@alignment@align.054 | NGC 6981 | 0.131 | 0.005 | -0.007 | |
| NGC 6093 | 0.147 | 0.008 | 0\@alignment@align.032 | NGC 7078 | 0.109 | 0.004 | 0.038 | |
| NGC 6101 | 0.092 | 0.016 | -0\@alignment@align.007 | NGC 7089 | 0.152 | 0.007 | 0.032 | |
| NGC 6121 | 0.123 | 0.006 | -0\@alignment@align.033 | NGC 7099 | 0.098 | 0.015 | 0.020 | |
| NGC 6144 | 0.114 | 0.010 | 0\@alignment@align.000 | RUPRECHT 106 | 0.061 | 0.009 | -0.059 | |
| NGC 6171 | 0.175 | 0.013 | 0\@alignment@align.009 | TERZAN 7 | 0.043 | 0.009 | -0.172 | |
4 Bivariate analysis of the RGB width
We performed an extensive statistical analysis to test the monotonic relationship between the cluster intrinsic RGB width and several GC parameters, using as indicator the Spearman’s rank correlation coefficient, RS. The following run of statistical tests has been done by taking into account a sub-sample of clusters in our database, that includes the 58 Galactic GCs used by Milone et al. (2018).
The results are shown as a correlation map in Figure 3. Each cell in the figure represents the test scores for a single parameter, and is labeled with three rows. The top row reports the parameter against which the Spearman’s correlation test has been performed, the middle row reports the result of the test, namely the value of RS, followed by a number in parentheses equal to the degrees of freedom of the system, calculated as the pairwise cases used for the test minus two. The bottom row reports the significance of the RS measurement, indicated as the p-value or the probability to find a RS value equal or larger than the actual one. Strong evidence against no correlation is usually given by p-values , while p-values smaller than 0.01 mark highly significant correlations and have been reported as an upper limit value, namely ‘’. The coefficients RS have been mapped into colors, assigned to the relative cells, on a scale reported in the top-left corner of the figure, where the red corresponds to a perfect negative correlation (R) while the blue to a perfect positive correlation (R). Moderate to weak correlations ( R) are represented by yellowish colors. Finally no color has been assigned to cells whose test scores are not significant, namely with p-value , because no conclusions can be drawn from the measured correlations.
The map shows that 21 out of 45 analyzed parameters have a significant correlation with the RGB width. The kernel density distribution of the significant measurements, overplot to the color-key scale, shows that almost all the RS lie in the interval , except for (M17) (R, p ) and for [Fe/H] (R, p ).
The first result is of remarkable importance since the almost perfect monotonic correlation between the indexes and , means that both are equally sensitive to variations of light elements (C and N) in MPs. This finding also demonstrate of the advantage of the first index over the second in MPs studies, given its high effectiveness/cost ratio.
The second result, similar to that obtained in Milone et al. (2017), indicates that metallicity is the most important physical parameter impacting on the extension of the RGB width. It is therefore necessary to take into account the effect of the variance of metallicity on the rest of parameters to verify if their correlation with the RGB width still holds.
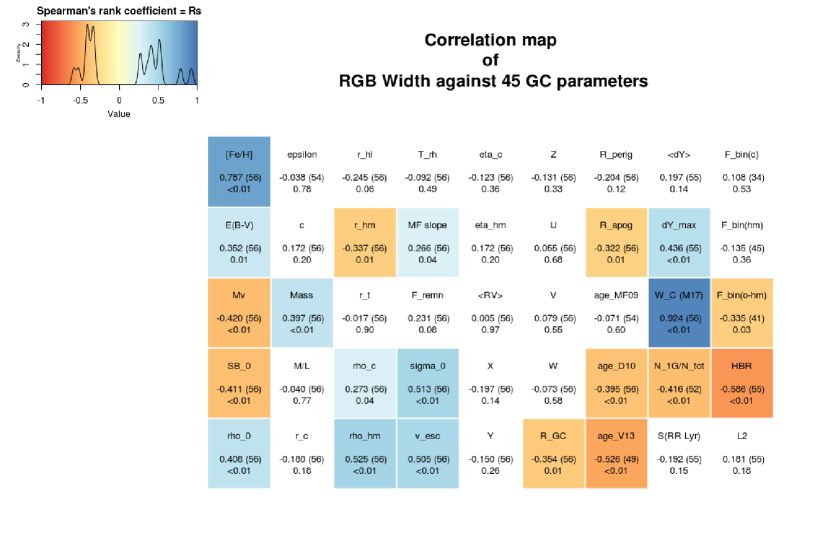
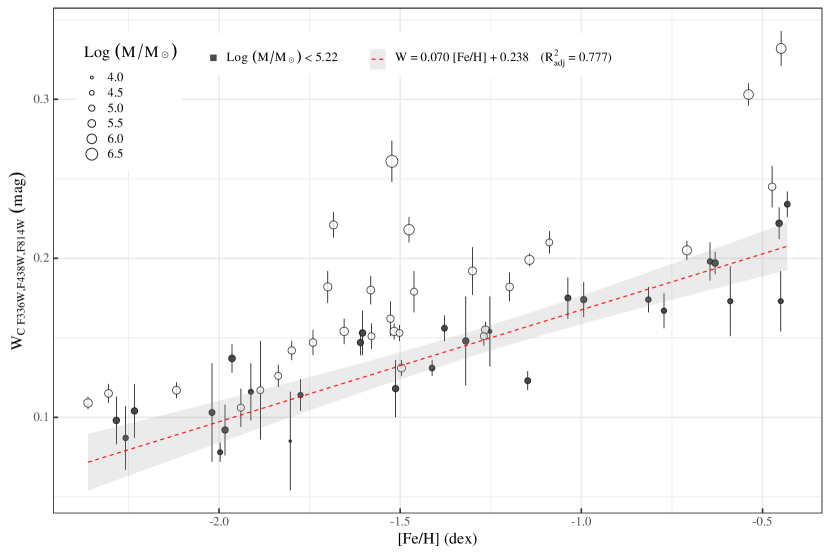
Figure 4 shows the scatter plot of vs. [Fe/H]. The vertical error bar of each point represents the error of the RGB width measurement (see table 2). For the sake of clarity, in order to avoid overlap with points and error bars, we added to the metallicity values of the plotted points a small ( dex) random jitter. As it follows from the previous result, an evident monotonic progress of the points is visible, with the RGB width increasing with metallicity. The overall trend also suggests a moderate degree of linearity between the two represented quantities, with a significant scatter in the metallicity interval and at . To further analyze the possible cause of the deviation from linearity, we decided to add a third dimension to the plot, by assigning to the plotted points a dimension proportional to the mass of the corresponding clusters. By doing this, we clearly observe that the scatter increases with the mass of the cluster.
An empirical way to tackle this issue is to select a sub-sample of clusters for which an adequate linearity between RGB width and metallicity takes place. A robust choice is represented by the less massive clusters, which occupy the bottom region of the observed trend. In particular, we selected all the clusters with mass smaller than the median mass of the selected sub-sample of GCs, namely Log (M/M. The selected clusters 444We highlight the fact that our sample of low-mass GCs does not include any cluster with known metallicity spread (Marino et al., 2019, 2015). have been marked as black-filled points in the plot. Then, we computed the weighted least-square linear relation fitting the selected points, represented by the red dashed line in the plot, whose expression has also been reported in the legend. The gray shaded area surrounding the regression line represents the 95% confidence interval, that is the region having the 95% probability to include the true regression line. In order to verify the goodness-of-fit of the fit function, we computed the adjusted determination coefficient R, which is a measurement of the ratio of variance between the residuals of the independent variable and that of the dependent variable with respect to the regression line. R2 values range from 0, when the fit model fails to predict the data, to 1, indicating a perfect fit. In our case, as reported in the legend, R, thus indicating that the variance of the metallicity of the selected sub-sample of clusters accounts for the of that of their RGB width.
The linear fit thus allows us to remove the effect of metallicity from the RGB width of all the clusters in our database, by subtracting from their , the residual with respect to the regression line. We will refer to this new quantity as or ‘normalized’ RGB width. We reported the corresponding values for each cluster in Table 2. Since the regression line has been determined empirically, we did not take into account the error introduced by the linear fit relation.
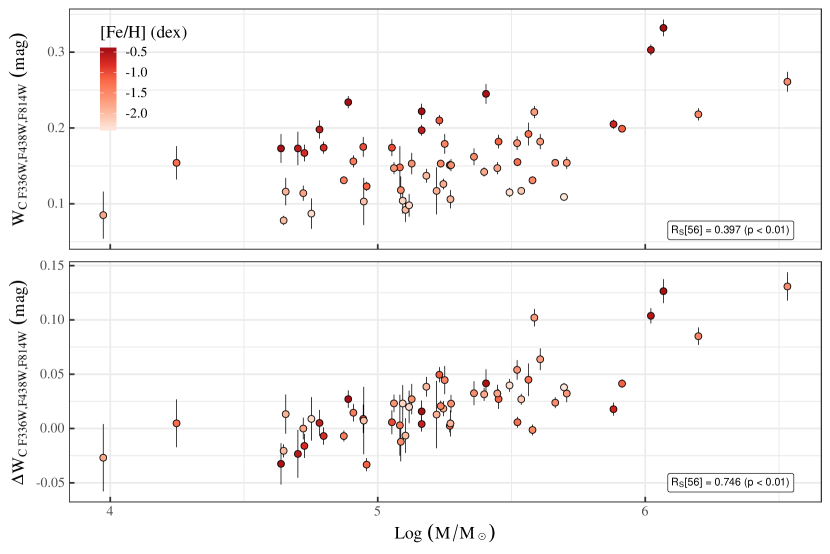
The effect of the inclusion of the metallicity variance in the RGB width is clearly illustrated in the two panels of Figure 5. In the top panel, we plot vs. Log (M/M⊙) and assigned to each point a color corresponding to the metallicity of the cluster, according to the color scale shown in the legend. The result of the Spearman’s correlation test (R, p ), has also been indicated in the bottom right corner. The points appear aligned along almost parallel directions, with the most metal-rich and the most metal-poor clusters attaining, respectively, the highest and lowest values of the RGB width, and the metal intermediate sitting between them, along the entire outlined metallicity range. This plot shows, in a way reversed with respect to Fig. 4, that the mass alone cannot explain the variance of the RGB width but also that the metallicity has a clear predominant effect on the observed trend characteristics. As shown in the bottom panel, once we subtract the contribution of the metallicity given by the linear relation defined above, we obtain a new trend, with all the points lined up along a single, well-defined direction. This new, monotonically increasing correlation, which also appears linear over the entire metallicity range, suggests a strong dependence from the mass of the properties of MPs, parameterized by the index .
5 Cluster mass and RGB width variation
In this section we use the Spearman’s rank test to study the correlation between the index and all the cluster parameters, except of course metallicity. Since also Milone et al. (2017) computed a ‘normalized’ RGB width in the pseudo-color , we replaced, in this statistical batch, the formerly adopted index (M17) with their ‘normalized’ index (M17).
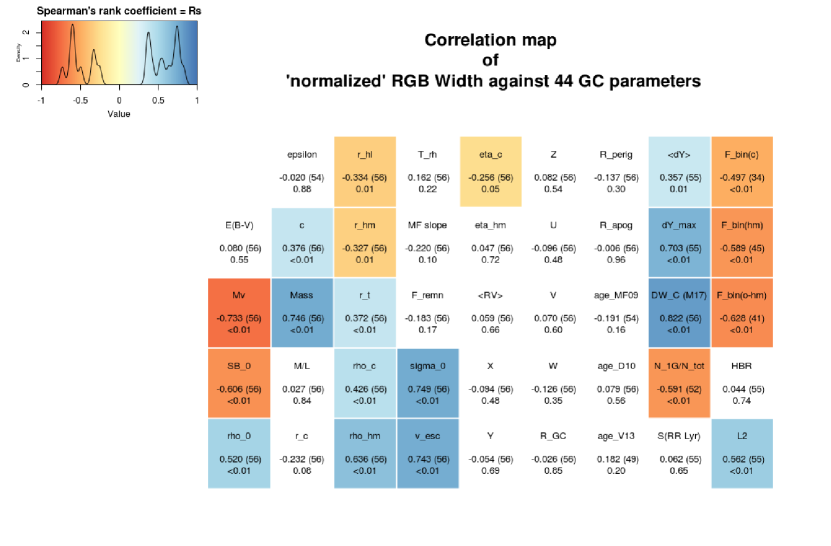
As in the previous section, we show, in Figure 6, the correlation map of the results of the statistical test of the ‘normalized’ RGB width against the 44 GC parameters.
We observe now that a slightly larger fraction (21 out of 44) of parameters score significant correlations. Moreover the kernel distribution shows that, at odds with the previous case, the majority of them also have strong monotonic correlations. The highest coefficient are found for (M17) (R, p ) and Mass (R, p ). Similarly to what found in the previous section, the first result confirms the equal sensitivity of the ‘normalized’ RGB index introduced here with the corresponding quantity defined in Milone et al. (2017).
The second highest correlation value, relative to the cluster mass, is also corroborated by the highly significant, negative correlation existing with the total cluster magnitude (R, p ), being the luminosity of a cluster a proxy of its total mass. Moreover, also other structural parameters, directly linked to cluster mass content score high RS values, like (R, p ) and (R, p ). In this context, we also notice the moderate/high correlations with the parameters describing the fraction of binaries in different regions of the cluster as well as with the ratio of 1G to the total number of stars .
Interestingly enough, some significant correlations present in the previous statistical run disappeared, with some remarkable examples like the orbital parameters RGC and Rapog, or and . Among the new strong correlations we highlight that with (R, p ). Directly related to the latter is the moderate correlation found for the color extension of L2, which is on first approximation dependent on the internal helium spread of a cluster (e.g. D’Antona et al., 2002; Marino et al., 2011, 2014; Milone et al., 2018; Tailo et al., 2019a, b).
In conclusion, we observe that the RGB width is a sensitive indicator of the total internal chemical variations in Galactic GCs, hence of their MP content. The variance observed in is mostly correlated with the cluster metallicity. After removing this dependence, the ‘normalized’ RGB width shows a significant, strong correlation with the mass and the dynamic parameters linked to that, as well as to maximum internal helium variations.
6 General properties of the RGB width
Any given chemical variation for stars at the base of the RGB, would result in a different UV-optical color spread, for clusters with different metallicity and age. Theoretical predictions of the variation of the index are, therefore, of primary importance in our analysis, in order to properly compare the observations. Indeed, the whole sample of GCs in our database spans a wide interval of metallicities ( [Fe/H]) and ages ( – 14 Gyr). To this aim, we decided to analyze the effect of metallicity and age variations on the index , by using appropriate theoretical models, as explained in the following section.
6.1 Trends from synthetic spectra analysis
The RGB width is strongly correlated to the internal variation of helium and light elements, mostly through the CN, NH molecular bands which in turn affect the ultraviolet and blue portion of the stellar spectrum (e.g. Marino et al., 2008; Sbordone et al., 2011; Milone et al., 2013; Monelli et al., 2013). Since the absorption depth of a molecular band depends on the effective temperature and gravity, we expect that for fixed variation of [C/Fe], [N/Fe], [O/Fe], and helium mass content Y, stars with different atmospheric parameters would show different values of .
To investigate the effect of varying atmospheric parameters on the RGB width, we took advantage of synthetic spectra to compute, across a grid of ages and metallicities, the difference in the pseudo-color corresponding to a given variation of C, N, O and helium. The metallicity grid-values are [Fe/H] dex, while the age values are 2, 8, 14 Gyr. For each grid-point, we fetched two isochrones, from the Dartmouth Stellar Evolution Database 555http://stellar.dartmouth.edu/models/ (DSEP; Dotter et al., 2007), with the same [Fe/H] and age but different helium content: one with canonical helium abundance (Y) and the other with helium enhanced by with respect to the canonical value. The latter corresponds to the average internal helium variation derived in the analysis of the maximum helium variation in 58 Galactic GCs, by Milone et al. (2018). For each metallicity/age value, we estimated the and log g of the point 2.0 mag brighter than the MSTO in F814W band, along both the canonical and enhanced helium isochrone. Then, for each point we generated, with ATLAS12 and SYNTHE codes (Castelli, 2005; Kurucz, 2005; Sbordone et al., 2007), a synthetic spectrum with a characteristic chemical abundance. For the point with the canonical helium we simulated a spectrum with solar [C/Fe] and [N/Fe], and [O/Fe] = 0.3 dex, corresponding to the typical mixture of a 1G stars; for the point with enhanced helium we simulated a spectrum depleted in carbon and oxygen by 0.5 dex and enhanced in nitrogen by 1.21 dex, with respect to the previous one. This abundance is indicative of the mixture of a 2G star. We integrated each spectrum over the transmission curves of the WFC3/UVIS, ACS/WFC, , , filters used in this paper, to derive the synthetic and pseudo-colors. The absolute value of the difference between the 2G and 1G pseudo-colors provides the theoretical measurement of the RGB width.
The trend of the theoretical as a function of [Fe/H], for the three different grid values of age, is shown in Figure 7. It reveals that all the models exhibit comparable trends, with the RGB width almost linearly increasing from at [Fe/H] up to at [Fe/H], and decreasing first with a shallow slope at [Fe/H], and then abruptly at solar [Fe/H], where all the models reach their minimum value. We also notice the that all the models attain similar values across the whole metallicity range, with lower for younger ages. The profile is inverted at [Fe/H], where starts to be higher for younger ages. Finally we observe the largest scatter at solar metallicity with a difference between the models of mag. We can conclude that we can safely perform a direct comparison among the observed RGB width of young-, intermediate- and old-age clusters.
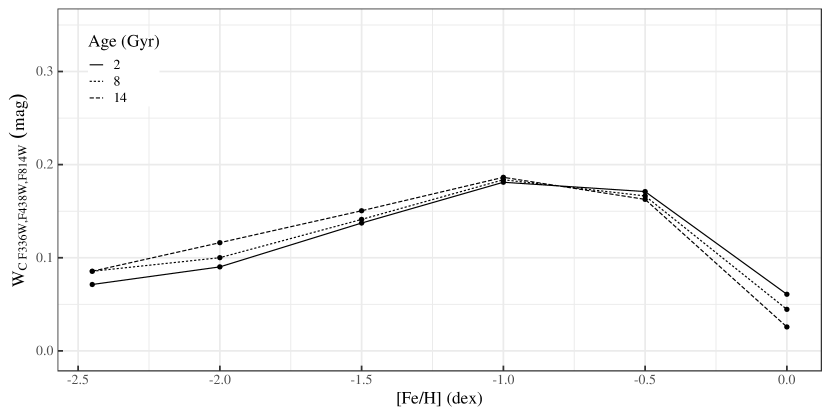
As a final remark, we notice that the values of and are almost the same within 0.02 mag, with the , and , used in this paper for Terzan 7, providing wider RGB spread. This fact demonstrates that we can directly compare Terzan 7, for which only ground-based photometry is available, with the other clusters.
7 Comparison between Galactic and extragalactic clusters
So far, we analyzed the properties of the RGB width of the Galactic GCs included in our database. Thanks to the availability of homogeneous measurement for a large dataset of parameters, this selection constitutes the best reference system for the comparison of the observed properties of stellar systems presenting peculiar characteristics. In this respect, the GCs NGC 2419 and Rup 106 are remarkable examples. Indeed, the first is the most external cluster of the Milky Way (R kpc; Baumgardt et al., 2019), while the second belongs to a peculiar class of clusters not hosting MPs. Moreover, the recent discovery of MPs in MC clusters, makes them the ideal target for a comparative study of the MP properties in stellar systems belonging to different galaxies.
We decided, therefore, to reproduce the plot of Fig. 4 by including these new objects. The new plot is shown in Figure 8, where each point has been labeled with the name of the corresponding cluster, and colored according to its parent galaxy. As already mentioned in Sect. 4, since NGC 6715 is the core of the Sagittarius dwarf, it has been colored azure like Terzan 7, while Milky Way and Magellanic Cloud GCs have been represented as light yellow and red points, respectively. We see in the plot that, among the Milky Way GCs, NGC 2419 represents a remarkable outlier. This cluster, indeed, which has been found to host at least four different stellar populations with extreme helium abundances, as recently reported in Zennaro et al. (2019) and Larsen et al. (2019), displays a RGB width almost a factor of two higher than that typical of MW GCs at low metallicity regime. On the other side, Rup 106 has an unusually small RGB width for its metallicity. The location of Rup 106 in the plot reflects the unusual property of this globular which is one of the few MW clusters hosting a single stellar population, as reported in Villanova et al. (2013) and confirmed by Dotter et al. (2018).
Another interesting feature visible in this plot is the location of the extragalactic clusters, which have, on average, RGB width values lower that of MW GCs with comparable mass and metallicity. In particular, only three MC clusters seem to follow the general trend observed for the MW GCs, namely NGC 121, NGC 416 and Lindsay 1, while NGC 1978, Lindsay 113, NGC 339, Terzan 7, and Lindsay 38, attain values lower than those typical of GCs. We also notice that the RGB width of Lindsay 38 and Terzan 7 is smaller than that of Rup 106, thus suggesting that both the clusters are likely consistent with a single stellar population. This represent a new finding for Terzan 7 while it is consistent with that obtained by Martocchia et al. (2019) and Li et al. (2019) for Lindsay 38 and Lindsay 113, respectively.
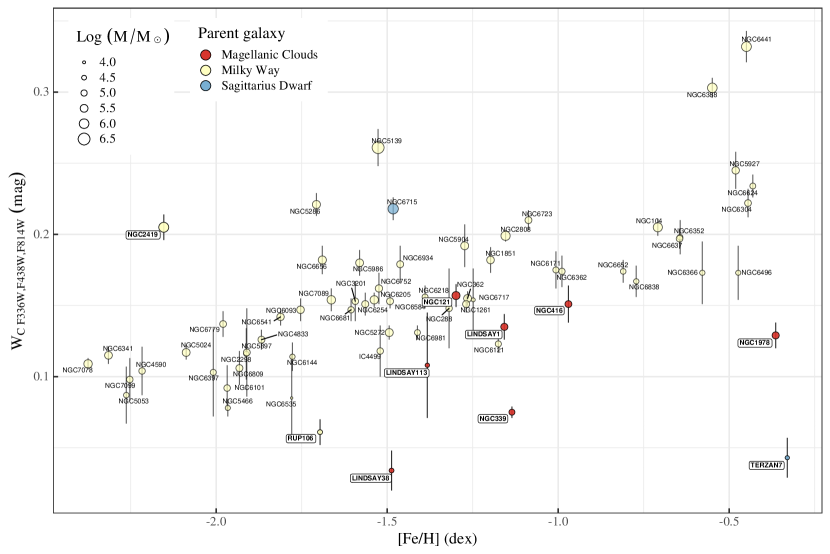
Despite the typical lower RGB width values, the overall trend of the extragalactic GCs seems consistent with that of the Galactic GCs, with RGB width values typically higher for the most metal-rich clusters and at a given metallicity, higher for the most massive clusters. As a consequence, we applied to the new sample, the procedure to remove from the observed RGB width the effect of the metallicity.
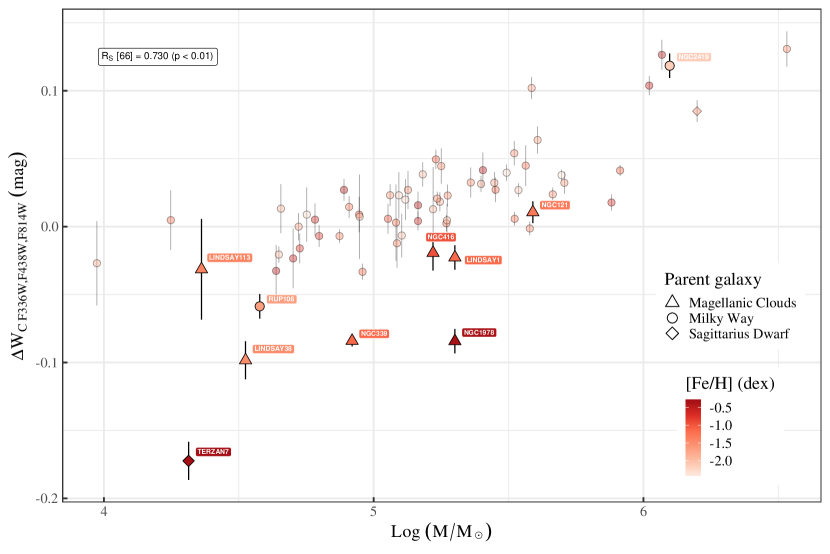
The new plot is shown Figure 9, where similarly to Fig. 5, we used a color scale to map the metallicity of the clusters. In this case, in order to distinguish the parent galaxy of each globular, we used a different shape for the plotted points. The result of the Spearman’s correlation rank test (R, p ) indicates a significant, strong monotonic relation between the ‘normalized’ RGB width and the mass of the clusters, similarly to what found for the Galactic GC subsample. The plot, however, also reveals that the extragalactic clusters systematically deviate from the general behavior of the MW GCs. We observe, indeed, that while NGC 2419 and Rup 106 follow the general trend of the other Galactic GCs, all the extragalactic GCs are located on the faint side of the bulk of MW clusters, with the exception of Lindsay 113, although no firm conclusion is possible for this cluster given its large error bar. As expected, with the exception of NGC 121, NGC 416 and Lindsay 1, all the other extragalactic GCs show a significant scatter with respect to the main trend, with Terzan 7 attaining the lowest value.
We conclude that the lower intrinsic color spread of the RGB width, observed for the MC clusters as well as for Terzan 7 seems to be an inherent properties of these clusters. These results seem consistent with a scenario where MPs in both Galactic and MC GCs follow the same relation with the mass of the host cluster, but the ancient Galactic GCs have lost a significant amount of their mass. Moreover, this is consistent with the result of Zennaro et al. (2019), who found that GCs with large perigalacticon host, on average, larger fractions of 1G stars than the remaining Galactic GCs, thus indicating that the interaction with the Milky Way affects the properties of MPs in GCs. As an alternative, the properties of MPs in the ancient GCs, formed in the Milky Way at high redshifts, and in the extragalactic clusters could eventually depend on the different environment at the epoch of formation.
8 RGB width and cluster age
The discovery, confirmed by both spectroscopic and photometric analyses, of internal N and He variations in MC globulars older than Gyr, obtained in the past few years (e.g. Chantereau et al., 2019; Lagioia et al., 2019; Hollyhead et al., 2017; Martocchia et al., 2018; Niederhofer et al., 2017b, a), together with the lack of detectable spread in younger clusters, raised new questions on the possible effect of the age as a driver for the appearance of the MPs in GCs (see Martocchia et al., 2019). We decided to investigate the relation between RGB width and age by taking into account the whole sample of clusters in our database, which spans an age range of about 11 Gyr. The top panel of Figure 10 displays as a function of the cluster age. We used the age values from Dotter et al. (2010, 2011) and (Milone et al., 2014) for the Galactic GCs and Terzan 7, while for NGC 121, NGC 339, NGC 416 and Lindsay 1 we considered the values provided in Lagioia et al. (2019, and references therein). The ages of Lindsay 38, Lindsay 113 have been taken from Martocchia et al. (2019), while that of NGC 1978 from Mucciarelli et al. (2007). We observe that the extragalactic clusters, that are, with the exception of NGC 121 (age 10.5 Gyr), all younger than the MW GCs, have RGB width values similar to those of the oldest Galactic GCs. The recent conclusion by Martocchia et al. (2019), that the nitrogen content in GCs is mostly correlated with the cluster age, seems to be not consistent with the present result. We notice, however, that these authors based their analysis on the standard deviation of the color distribution of the RGB stars in a different color combination, namely , which is similar to but exploits the narrow band F343N filter instead of F336W, and , which is given by the sum of the colors and . For this reason they have a much smaller Galactic GC sample, composed by the three clusters NGC 104 (47 Tuc) NGC 2419 and NGC 7078 (M 15).
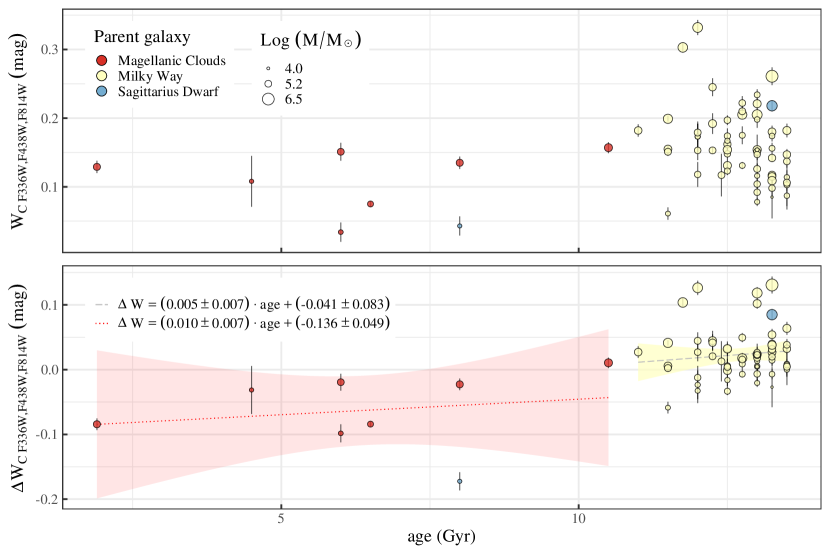
As demonstrated in Sect. 4 and 6, a fixed variation of [C/Fe], [N/Fe], [O/Fe] and Y in clusters with different metallicities results in different RGB widths (see also Lagioia et al., 2018; Milone et al., 2018). As a consequence, for a proper comparison between the nitrogen abundance variation and any other GC parameter, we must take into account the effect of the metallicity. The bottom panel of Figure 10 displays as a function of the cluster age. In this plot we see that the location of the extragalactic clusters along the vertical axis is somewhat lower than that of the Galactic GCs, although several old Galactic GCs share similar values as intermediate-age MC clusters. We also notice that there is a dependence of the RGB width from the cluster mass, with the most massive GCs, attaining higher values. Unfortunately, the possibility to include the mass variance into the index is hampered by the lack of precise knowledge of the initial mass of the clusters. In fact, the values of the initial mass, available only for the Galactic GCs (H. Baumgardt, private communication), have been computed under the hypothesis of constant Galactic potential and unperturbed orbits. Dynamical evolution in the galactic potential, though, dramatically changes the pristine mass of a GC.
As a matter of fact, the heterogeneous physical conditions of the MW and its satellites might have significantly altered the evolutionary paths of their respective globulars. This scenario is also complicated by the fact that a substantial portion of the GCs in the MCs, for instance, was formed at different redshifts and as such, evolved with different boundary conditions. We can speculate whether in our case a different dependence of the index from the cluster age in the two subsystems, namely the MW and the MC GCs, can provide some hints about the role of the environment on the general properties of the MPs in GCs. On this purpose we computed the weighted least-square linear relations fitting the two different GC groups, with the Galactic group including the Sagittarius Dwarf cluster NGC 6715 for internal consistency with our analysis. The dashed gray and dotted red lines in the plot represent the two regression lines, for which we also reported the corresponding equations in the legend, and the yellow and red shaded areas the respective 95% confidence intervals.
The errors indicate that the slope and the intercept of the two regression lines are consistent within 1 . In order to estimate the significance of the difference between the two fitting relations we run the analysis-of-variance (ANOVA) test (Chambers & Hastie, 1992). The first part of the test is based on the assumption of interaction between the predictor variable “age” and the categorical variable “parent galaxy”; the second relies on the assumption of no interaction between the same two variables. In the first case we found that “age” has a significant effect (p ) on the response variable “”, while the effect of “parent galaxy” is not significant (p = 0.152). Also, the interaction between “age” and “parent galaxy” is insignificant (p = 0.559). In the second test, we obtained the same outcome for the significance of the effect of the predictor (p-value ) and categorical (p-value = 0.150) variable. We conclude that if any relation exists between age and ‘normalized’ RGB width it seems to be independent of the galaxy under consideration.
9 Summary
The evidence of internal light-element variations in several GCs of the Magellanic Clouds and Fornax (e.g. Lagioia et al., 2019; Martocchia et al., 2018; Niederhofer et al., 2017a; Larsen et al., 2014) indicates that MPs are common features of extragalactic GCs.
The wealth of observations of MPs in GCs demands a common metrics to directly compare the various clusters and to constrain the physical parameters that determine the MP phenomenon. To this aim, we undertook an extensive study of the MPs in 68 Galactic and extragalactic GCs, by measuring the color extension of the stars at the base of the RGB, in the UV-optical pseudo-color , which is sensitive to the stellar content of C, N, O and helium (Marino et al., 2008), and is available for a large number of archival observations. Images through these three filters can be collected from ground-based facilities also in the post-HST era, thus allowing the extension of the present analysis to distant GCs.
The analysis of the monotonic trend, performed with a series of Spearman’s rank correlation tests, of the RGB width, , of 58 Galactic GCs observed in F275W (Milone et al., 2017), against 45 different GC observational, structural and morphological GC parameters, shows that the RGB width is mostly dependent on the cluster metallicity (see Fig. 3). We also find an almost perfect monotonic correlation between the and the similar quantity by Milone et al. (2017). This result demonstrates the high effectiveness/cost ratio of the filter choice adopted in this work for the measurement of the extension of the MPs. Indeed, observations in F275W are very expensive in terms of telescope time and can be done by HST alone. By empirically removing the dependence of from [Fe/H], we defined a metallicity-free RGB width, , that we dubbed ‘normalized’ RGB width, which shows a significant monotonic correlation with the cluster total mass (see Fig. 5). The Spearman’s rank correlation test between and the global GC parameters reveals the highest degree of monotonic correlation with the cluster mass, thus indicating the prominent role of this parameter in determining the complexity of the MP phenomenon in the Galactic GCs. The ‘normalized’ RGB width also shows highly significant correlation coefficients with the core velocity dispersion, and the escape velocity, . A mild correlation with the fraction of 1G stars is also present. Our findings are compatible with the high correlation found by Baumgardt et al. (2019) between and for the sample of Galactic GCs studied in Milone et al. (2017).
We compared the properties of the bulk of MW GCs and a set of Galactic and extragalactic GC, including the distant MW globular NGC 2419 and Rup 106, which is one of the few MW GCs found to host a single stellar population (see Villanova et al., 2013; Dotter et al., 2018), and seven MC clusters plus Terzan 7, associated with the stream of the Sagittarius Dwarf (Sbordone et al., 2005). The location of the new clusters in the vs. [Fe/H] diagram shows that they are evident outliers, with the remarkable cases of the young- and intermediate-age MC clusters and Terzan 7, which attain systematically lower RGB width values with respect to the MW GCs. Furthermore, for the latter cluster we observe a RGB width smaller than that of Rup 106, which is a Galactic GC with a single stellar population. We therefore conclude that Terzan 7 likely is a single population cluster.
The comparison between the ‘normalized’ RGB width of the MW and extragalactic GCs as a function of the cluster mass demonstrates that the extragalactic GCs systematically deviates from the bulk trend of the Galactic globulars, with the extragalactic systems attaining lower values of . This fact suggests that the Magellanic Cloud GCs exhibit smaller internal light-element variations than Galactic GCs with similar present-day masses.
Arguably, the observed difference depends on the different physical conditions in Galactic and extragalactic proto-GCs at the epoch of formation. As an alternative, we speculate that the MPs in MW and extragalactic GCs follow a unique trend with the initial cluster mass, but ancient Galactic GCs lost a significant amount of their mass.
In a recent paper, Martocchia et al. (2019) measured the standard deviation of the RGB of eight Magellanic Cloud clusters with ages between 2 and 11 Gyr and that of the massive Galactic GCs M 15, 47 Tuc and NGC 2419,, that are - 13 Gyr old. They used two pseudo-colors that are mostly sensitive to nitrogen abundance, namely the index and .
Based on the correlation between the standard deviation of the RGB and the cluster age, they conclude that the internal abundance variation strongly depends on the cluster age. We find no evidence for correlation between the RGB width in and the cluster age, although Magellanic Cloud clusters with ages between and 11 Gyr exhibit, on average, lower values of and than for the Galactic GCs. However, the evidence that the RGB width mostly depends on cluster metallicity and mass, together with the fact that it is not possible to directly compare present day masses of Galactic and extragalactic clusters with different ages, prevents us from any conclusion on the possibility that the cluster age affects the RGB width through internal nitrogen variation.
References
- Anderson & Bedin (2010) Anderson, J., & Bedin, L. R. 2010, Publications of the Astronomical Society of the Pacific, 122, 1035, doi: 10.1086/656399
- Anderson et al. (2006) Anderson, J., Bedin, L. R., Piotto, G., Yadav, R. S., & Bellini, A. 2006, Astronomy and Astrophysics, 454, 1029, doi: 10.1051/0004-6361:20065004
- Anderson et al. (2008) Anderson, J., Sarajedini, A., Bedin, L. R., et al. 2008, The Astronomical Journal, 135, 2055, doi: 10.1088/0004-6256/135/6/2055
- Baumgardt & Hilker (2018) Baumgardt, H., & Hilker, M. 2018, Monthly Notices of the Royal Astronomical Society, 478, 1520, doi: 10.1093/mnras/sty1057
- Baumgardt et al. (2019) Baumgardt, H., Hilker, M., Sollima, A., & Bellini, A. 2019, Monthly Notices of the Royal Astronomical Society, 482, 5138, doi: 10.1093/mnras/sty2997
- Bedin et al. (2005) Bedin, L. R., Cassisi, S., Castelli, F., et al. 2005, Monthly Notices of the Royal Astronomical Society, 357, 1038, doi: 10.1111/j.1365-2966.2005.08735.x
- Bellini et al. (2011) Bellini, A., Anderson, J., & Bedin, L. R. 2011, Publications of the Astronomical Society of the Pacific, 123, 622, doi: 10.1086/659878
- Bellini et al. (2017) Bellini, A., Anderson, J., Bedin, L. R., et al. 2017, The Astrophysical Journal, 842, 6, doi: 10.3847/1538-4357/aa7059
- Carretta & Gratton (1997) Carretta, E., & Gratton, R. G. 1997, Astronomy and Astrophysics Supplement Series, 121, 95, doi: 10.1051/aas:1997116
- Castelli (2005) Castelli, F. 2005, Memorie della Societa Astronomica Italiana Supplementi, 8, 25
- Chambers & Hastie (1992) Chambers, J. M., & Hastie, T. J. 1992, Pacific Grove
- Chantereau et al. (2019) Chantereau, W., Salaris, M., Bastian, N., & Martocchia, S. 2019, Monthly Notices of the Royal Astronomical Society, 484, 5236, doi: 10.1093/mnras/stz378
- D’Antona et al. (2002) D’Antona, F., Caloi, V., Montalbán, J., Ventura, P., & Gratton, R. 2002, Astronomy and Astrophysics, 395, 69, doi: 10.1051/0004-6361:20021220
- D’Antona et al. (2016) D’Antona, F., Vesperini, E., D’Ercole, A., et al. 2016, Monthly Notices of the Royal Astronomical Society, 458, 2122, doi: 10.1093/mnras/stw387
- Decressin et al. (2007) Decressin, T., Meynet, G., Charbonnel, C., Prantzos, N., & Ekström, S. 2007, Astronomy and Astrophysics, 464, 1029, doi: 10.1051/0004-6361:20066013
- Dotter (2016) Dotter, A. 2016, The Astrophysical Journal Supplement Series, 222, 8, doi: 10.3847/0067-0049/222/1/8
- Dotter et al. (2007) Dotter, A., Chaboyer, B., Jevremović, D., et al. 2007, The Astronomical Journal, 134, 376, doi: 10.1086/517915
- Dotter et al. (2018) Dotter, A., Milone, A. P., Conroy, C., Marino, A. F., & Sarajedini, A. 2018, The Astrophysical Journal, 865, L10, doi: 10.3847/2041-8213/aae08f
- Dotter et al. (2011) Dotter, A., Sarajedini, A., & Anderson, J. 2011, The Astrophysical Journal, 738, 74, doi: 10.1088/0004-637X/738/1/74
- Dotter et al. (2010) Dotter, A., Sarajedini, A., Anderson, J., et al. 2010, The Astrophysical Journal, 708, 698, doi: 10.1088/0004-637X/708/1/698
- Freudling et al. (2013) Freudling, W., Romaniello, M., Bramich, D. M., et al. 2013, Astronomy and Astrophysics, 559, A96, doi: 10.1051/0004-6361/201322494
- Gaia Collaboration (2018) Gaia Collaboration. 2018, Astronomy and Astrophysics, 616, A1, doi: 10.1051/0004-6361/201833051
- Gieles et al. (2018) Gieles, M., Charbonnel, C., Krause, M. G. H., et al. 2018, Monthly Notices of the Royal Astronomical Society, 478, 2461, doi: 10.1093/mnras/sty1059
- Gilliland (2004) Gilliland, R. L. 2004, Instrument Science Report ACS 2004-01, 17
- Gilliland et al. (2010) Gilliland, R. L., Rajan, A., & Deustua, S. 2010, Space Telescope WFC Instrument Science Report, 10
- Gratton et al. (2012) Gratton, R. G., Carretta, E., & Bragaglia, A. 2012, Astronomy and Astrophysics Review, 20, 50, doi: 10.1007/s00159-012-0050-3
- Harris (1996) Harris, W. E. 1996, The Astronomical Journal, 112, 1487, doi: 10.1086/118116
- Hollyhead et al. (2017) Hollyhead, K., Kacharov, N., Lardo, C., et al. 2017, Monthly Notices of the Royal Astronomical Society, 465, L39, doi: 10.1093/mnrasl/slw179
- Kraft (1994) Kraft, R. P. 1994, Publications of the Astronomical Society of the Pacific, 106, 553, doi: 10.1086/133416
- Kurucz (2005) Kurucz, R. L. 2005, Memorie della Societa Astronomica Italiana Supplementi, 8, 14
- Lagioia et al. (2019) Lagioia, E. P., Milone, A. P., Marino, A. F., & Dotter, A. 2019, The Astrophysical Journal, 871, 140, doi: 10.3847/1538-4357/aaf729
- Lagioia et al. (2018) Lagioia, E. P., Milone, A. P., Marino, A. F., et al. 2018, Monthly Notices of the Royal Astronomical Society, 475, 4088, doi: 10.1093/mnras/sty083
- Larsen et al. (2019) Larsen, S. S., Baumgardt, H., Bastian, N., Hernandez, S., & Brodie, J. 2019, Astronomy and Astrophysics, 624, A25, doi: 10.1051/0004-6361/201834494
- Larsen et al. (2014) Larsen, S. S., Brodie, J. P., Grundahl, F., & Strader, J. 2014, The Astrophysical Journal, 797, 15, doi: 10.1088/0004-637X/797/1/15
- Larsen et al. (2012) Larsen, S. S., Brodie, J. P., & Strader, J. 2012, Astronomy and Astrophysics, 546, A53, doi: 10.1051/0004-6361/201219895
- Li et al. (2019) Li, C., Wang, Y., & Milone, A. P. 2019, arXiv e-prints, arXiv:1908.07200
- Mackey & van den Bergh (2005) Mackey, A. D., & van den Bergh, S. 2005, Monthly Notices of the Royal Astronomical Society, 360, 631, doi: 10.1111/j.1365-2966.2005.09080.x
- Marín-Franch et al. (2009) Marín-Franch, A., Aparicio, A., Piotto, G., et al. 2009, The Astrophysical Journal, 694, 1498, doi: 10.1088/0004-637X/694/2/1498
- Marino et al. (2011) Marino, A. F., Villanova, S., Milone, A. P., et al. 2011, The Astrophysical Journal, 730, L16, doi: 10.1088/2041-8205/730/2/L16
- Marino et al. (2008) Marino, A. F., Villanova, S., Piotto, G., et al. 2008, Astronomy and Astrophysics, 490, 625, doi: 10.1051/0004-6361:200810389
- Marino et al. (2014) Marino, A. F., Milone, A. P., Przybilla, N., et al. 2014, Monthly Notices of the Royal Astronomical Society, 437, 1609, doi: 10.1093/mnras/stt1993
- Marino et al. (2015) Marino, A. F., Milone, A. P., Karakas, A. I., et al. 2015, Monthly Notices of the Royal Astronomical Society, 450, 815, doi: 10.1093/mnras/stv420
- Marino et al. (2019) Marino, A. F., Milone, A. P., Renzini, A., et al. 2019, Monthly Notices of the Royal Astronomical Society, 487, 3815, doi: 10.1093/mnras/stz1415
- Martocchia et al. (2018) Martocchia, S., Niederhofer, F., Dalessandro, E., et al. 2018, Monthly Notices of the Royal Astronomical Society, 477, 4696, doi: 10.1093/mnras/sty916
- Martocchia et al. (2019) Martocchia, S., Dalessandro, E., Lardo, C., et al. 2019, Monthly Notices of the Royal Astronomical Society, 1528, doi: 10.1093/mnras/stz1596
- Milone et al. (2009) Milone, A. P., Stetson, P. B., Piotto, G., et al. 2009, Astronomy and Astrophysics, 503, 755, doi: 10.1051/0004-6361/200912256
- Milone et al. (2012a) Milone, A. P., Piotto, G., Bedin, L. R., et al. 2012a, The Astrophysical Journal, 744, 58, doi: 10.1088/0004-637X/744/1/58
- Milone et al. (2012b) —. 2012b, Astronomy and Astrophysics, 540, A16, doi: 10.1051/0004-6361/201016384
- Milone et al. (2013) Milone, A. P., Marino, A. F., Piotto, G., et al. 2013, The Astrophysical Journal, 767, 120, doi: 10.1088/0004-637X/767/2/120
- Milone et al. (2014) Milone, A. P., Marino, A. F., Dotter, A., et al. 2014, The Astrophysical Journal, 785, 21, doi: 10.1088/0004-637X/785/1/21
- Milone et al. (2015a) Milone, A. P., Marino, A. F., Piotto, G., et al. 2015a, Monthly Notices of the Royal Astronomical Society, 447, 927, doi: 10.1093/mnras/stu2446
- Milone et al. (2015b) Milone, A. P., Bedin, L. R., Piotto, G., et al. 2015b, Monthly Notices of the Royal Astronomical Society, 450, 3750, doi: 10.1093/mnras/stv829
- Milone et al. (2017) Milone, A. P., Piotto, G., Renzini, A., et al. 2017, Monthly Notices of the Royal Astronomical Society, 464, 3636, doi: 10.1093/mnras/stw2531
- Milone et al. (2018) Milone, A. P., Marino, A. F., Renzini, A., et al. 2018, Monthly Notices of the Royal Astronomical Society, 481, 5098, doi: 10.1093/mnras/sty2573
- Monelli et al. (2013) Monelli, M., Milone, A. P., Stetson, P. B., et al. 2013, Monthly Notices of the Royal Astronomical Society, 431, 2126, doi: 10.1093/mnras/stt273
- Mucciarelli et al. (2007) Mucciarelli, A., Ferraro, F. R., Origlia, L., & Fusi Pecci, F. 2007, The Astronomical Journal, 133, 2053, doi: 10.1086/513076
- Niederhofer et al. (2017a) Niederhofer, F., Bastian, N., Kozhurina-Platais, V., et al. 2017a, Monthly Notices of the Royal Astronomical Society, 464, 94, doi: 10.1093/mnras/stw2269
- Niederhofer et al. (2017b) —. 2017b, Monthly Notices of the Royal Astronomical Society, 465, 4159, doi: 10.1093/mnras/stw3084
- Piotto et al. (2015) Piotto, G., Milone, A. P., Bedin, L. R., et al. 2015, The Astronomical Journal, 149, 91, doi: 10.1088/0004-6256/149/3/91
- Sabbi et al. (2016) Sabbi, E., Lennon, D. J., Anderson, J., et al. 2016, The Astrophysical Journal Supplement Series, 222, 11, doi: 10.3847/0067-0049/222/1/11
- Sbordone et al. (2007) Sbordone, L., Bonifacio, P., Buonanno, R., et al. 2007, Astronomy and Astrophysics, 465, 815, doi: 10.1051/0004-6361:20066385
- Sbordone et al. (2005) Sbordone, L., Bonifacio, P., Marconi, G., Buonanno, R., & Zaggia, S. 2005, Astronomy and Astrophysics, 437, 905, doi: 10.1051/0004-6361:20042315
- Sbordone et al. (2011) Sbordone, L., Salaris, M., Weiss, A., & Cassisi, S. 2011, Astronomy and Astrophysics, 534, A9, doi: 10.1051/0004-6361/201116714
- Silverman (1986) Silverman, B. W. 1986, Monographs on Statistics and Applied Probability
- Stetson (1987) Stetson, P. B. 1987, Publications of the Astronomical Society of the Pacific, 99, 191, doi: 10.1086/131977
- Stetson (1990) —. 1990, Publications of the Astronomical Society of the Pacific, 102, 932, doi: 10.1086/132719
- Stetson (1994) —. 1994, Publications of the Astronomical Society of the Pacific, 106, 250, doi: 10.1086/133378
- Tailo et al. (2019a) Tailo, M., D’Antona, F., Caloi, V., et al. 2019a, Monthly Notices of the Royal Astronomical Society, 486, 5895, doi: 10.1093/mnras/stz1273
- Tailo et al. (2019b) Tailo, M., Milone, A. P., Marino, A. F., et al. 2019b, The Astrophysical Journal, 873, 123, doi: 10.3847/1538-4357/ab05cc
- VandenBerg et al. (2013) VandenBerg, D. A., Brogaard, K., Leaman, R., & Casagrande, L. 2013, The Astrophysical Journal, 775, 134, doi: 10.1088/0004-637X/775/2/134
- Villanova et al. (2013) Villanova, S., Geisler, D., Carraro, G., Moni Bidin, C., & Muñoz, C. 2013, The Astrophysical Journal, 778, 186, doi: 10.1088/0004-637X/778/2/186
- Zennaro et al. (2019) Zennaro, M., Milone, A. P., Marino, A. F., et al. 2019, Monthly Notices of the Royal Astronomical Society, 487, 3239, doi: 10.1093/mnras/stz1477