Ferromagnetic resonance with magnetic phase selectivity by means of resonant elastic x-ray scattering on a chiral magnet
Abstract
Cubic chiral magnets, such as Cu2OSeO3, exhibit a variety of non-collinear spin textures, including a trigonal lattice of spin whirls, so-called skyrmions. Using magnetic resonant elastic x-ray scattering (REXS) on a crystalline Bragg peak and its magnetic satellites while exciting the sample with magnetic fields at GHz frequencies, we probe the ferromagnetic resonance modes of these spin textures by means of the scattered intensity. Most notably, the three eigenmodes of the skyrmion lattice are detected with large sensitivity. As this novel technique, which we label REXS-FMR, is carried out at distinct positions in reciprocal space, it allows to distinguish contributions originating from different magnetic states, providing information on the precise character, weight and mode mixing as a prerequisite of tailored excitations for applications.
Ferromagnetic resonance (FMR) measurements represent a well-established technique for the study of systems with collinear magnetization Kittel (1948), allowing to extract information on the magnetic energy landscape and material-specific parameters such as the effective magnetization, the Landé factor, or the magnetic damping constant . In systems with non-collinear spin textures, measurements of resonant microwave excitations exhibit very complex spectra, where the identification of specific modes proves to be prohibitively difficult. However, in view of new technological developments such as antiferromagnetic spintronics or use of quantum magnetism, the precise identification of specific modes will be of great importance Kimura et al. (2006).
The cubic chiral magnets MnSi, Fe1-xCoxSi, and Cu2OSeO3 represent excellent showcases for the inherent complexity of materials with technological potential. These materials host long-wavelength helimagnetic order including a trigonal lattice of topologically non-trivial spin whirls, the so-called skyrmion lattice Mühlbauer et al. (2009); Yu et al. (2010, 2011); Seki et al. (2012a); Nagaosa and Tokura (2013). Their microwave excitations have been studied by means of coplanar waveguides and cavities Date et al. (1977); Kobets et al. (2010); Koralek et al. (2012); Onose et al. (2012); Schwarze et al. (2015). In the helimagnetic states, two collective spin-precessional modes, denoted and , are observed. In the skyrmion lattice state three eigenmodes exist, namely a clockwise and a counter-clockwise gyration mode as well as a breathing mode Mochizuki (2012). The remarkably detailed understanding of the cubic chiral magnet allows to assign these modes in the experimental spectra by comparing their resonance frequency and spectral weight, as well as the evolution of the latter as a function of temperature and field, to results of analytic calculations and micromagnetic simulations solving the Landau–Lifshitz–Gilbert equation taking into account dipolar interactions Schwarze et al. (2015). Such an in-depth understanding, however, may not be available when investigating novel materials Kézsmárki et al. (2015); Nayak et al. (2017); Kurumaji et al. (2017) or when phenomena such as metastable states, glassy textures, phase coexistence, topological transitions, or pronounced history dependencies play a role Münzer et al. (2010); Bauer and Pfleiderer (2012); Oike et al. (2016); Okamura et al. (2016); Karube et al. (2016, 2017); Bauer et al. (2018); Yu et al. (2018); Chacon et al. (2018).
In this work we present a novel technique, called REXS-FMR, which combines the excitation of collective modes by means of a coplanar waveguide with the detection by means of the scattered intensity in magnetic resonant elastic X-ray scattering (REXS). The intensity of a crystalline Bragg peak or magnetic satellites may be studied, permitting to clearly identify the hosting magnetic state of a given excitation via the scattering pattern in reciprocal space. As a point of reference, we demonstrate the potential of REXS-FMR using the insulating cubic chiral magnet Cu2OSeO3, which was studied previously both by means of REXS Langner et al. (2014); Zhang et al. (2016a, b, c, 2017a, 2018a) and standard microwave spectroscopy Onose et al. (2012); Okamura et al. (2013); Schwarze et al. (2015); Ogawa et al. (2015); Seki et al. (2016); Stasinopoulos et al. (2017a); Weiler et al. (2017).
Our present study was carried out on the beamline PM2 at BESSY II with the VEKMAG end station Noll and Radu (2017). The sample was a single-crystal cuboid of Cu2OSeO3, cut from an ingot grown by means of chemical vapor transport, with dimensions of and edges oriented parallel to , , and . One of the surfaces normal to was mechanically polished. The latter facing top, the sample was placed into the gap of a coplanar waveguide with a gap width of 1 mm. The sample slightly protrudes the top surface of the waveguide resulting in microwave excitation that comprises both in-plane and out-of-plane components. Typical excitation fields are of the order of 3 T to 10 T, depending on the excitation frequency. For the REXS measurements, the energy of the circularly polarized photons is tuned to the Cu L3 edge (931 eV). Note that the element specific character of REXS is also inherited to REXS-FMR. Further note that only in resonant X-ray scattering the crystallographically forbidden Bragg peak at is observed Templeton and Templeton (1994); Dmitrienko and Chizhikov (2012); Zhang et al. (2016a, b).
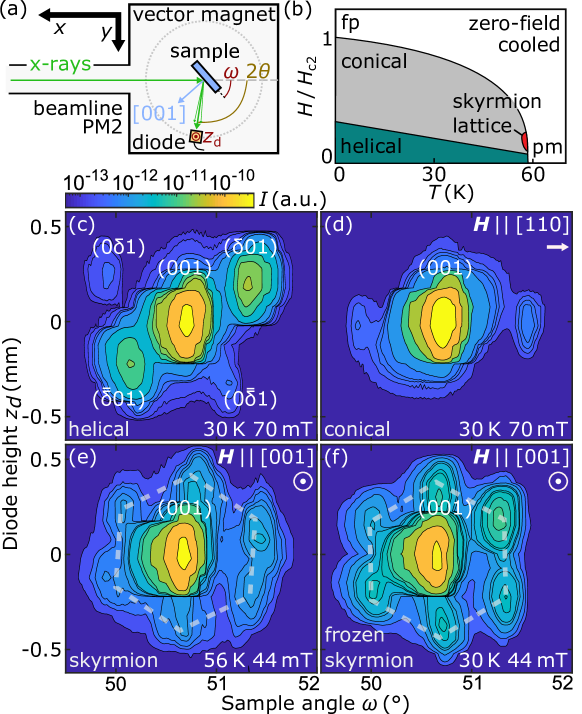
The geometry of the experiment is illustrated in Fig. 1(a). The sample surface is illuminated by a X-ray spot of diameter. The scattered intensity of the structural Bragg peak and its magnetic satellites is captured using a photo diode. Initially the diode angle is adjusted such that the intensity of the Bragg peak is maximized. Subsequently, remains fixed and the reciprocal space around the Bragg peak is mapped by varying the sample angle and the vertical diode position . The diode is located behind a pinhole with a diameter of 300 m that convolutes the measured signal, leading to an elongation of the peaks in linearly scanned direction. Despite the rather small sample–detector distance of 20 mm, the Bragg peak and its magnetic satellites may be separated clearly. Using the superconducting vector magnet at VEKMAG, the magnetic field is applied either parallel to the axis, the axis, or the incoming X-ray beam.
The magnetic phase diagram of Cu2OSeO3 is schematically depicted in Fig. 1(b) Seki et al. (2012a); Bauer and Pfleiderer (2016). Starting in the paramagnetic (pm) state at high temperatures and low fields, long-wavelength helimagnetic order (wavelength Å) is observed below the transition temperature K. In the helical state, macroscopic domains of helices propagate along one of the easy axes. In the corresponding reciprocal space map, shown in Fig. 1(c), the structural Bragg peak is surrounded by four magnetic satellite peaks , , , and . Although after zero-field cooling the equivalent domains are expected to be populated equally across a bulk sample, the present experiment only maps few domains due to the small X-ray spot size, rendering asymmetric intensity distributions possible.
Under applied magnetic field, the propagation directions of the helices re-orient into the field direction and finite net magnetization emerges as the magnetic moments increasingly tilt towards the field direction. In REXS, this conical state is associated with magnetic satellites along the field direction that are observed when the field is applied perpendicular to the direction, as shown in Fig. 1(d). Further increasing the magnetic field to the critical field results in a field-polarized state in which the moments are aligned along the field and no long-wavelength modulation is observed (not shown).
At intermediate magnetic field just below , a pocket of skyrmion lattice state is observed. The trigonal order of the spin whirls in the plane perpendicular to the field translates to the characteristic sixfold pattern of magnetic satellites in both small-angle neutron scattering Adams et al. (2012); Seki et al. (2012b); White et al. (2014); Bannenberg et al. (2017); Makino et al. (2017) and REXS Langner et al. (2014); Zhang et al. (2016a, b, c, 2017a, 2018a), as shown in Fig. 1(e). Under field cooling, the skyrmion lattice may be frozen-in to lower temperatures as a metastable state Münzer et al. (2010); Okamura et al. (2016); Seki et al. (2017); Bauer et al. (2018). As depicted in Fig. 1(f), the intensity of the magnetic satellites increases by an order of magnitude due to the increase of the magnetic moment with decreasing temperature.
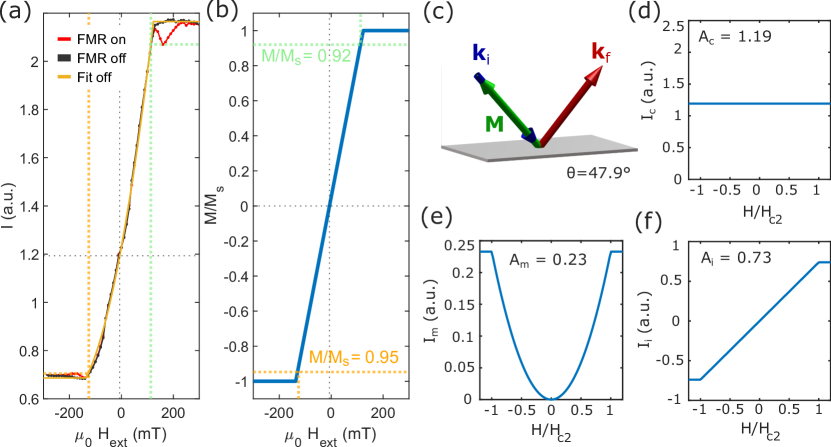
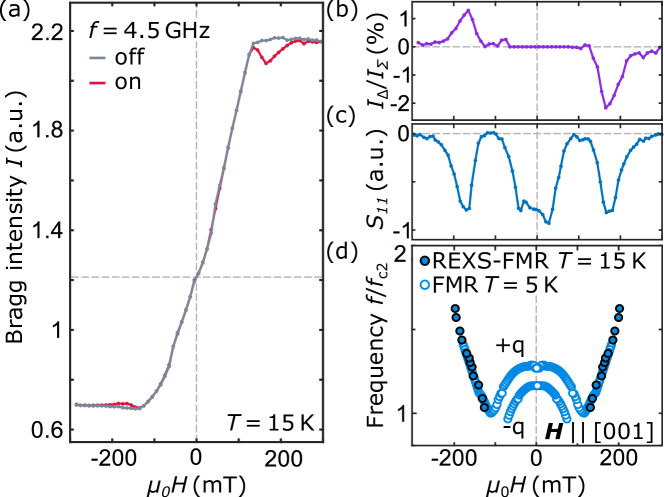
Typical REXS-FMR data are shown in Fig. 2 for the field-polarized state at K, when a field larger than mT is applied parallel to the beam direction 111Note that critical field values slightly vary with the applied field direction in a bar-shaped sample due to demagnetization effects.. Due to the lack of a long-wavelength modulation there are no magnetic satellites around the structural Bragg peak. This peak, however, comprises a magnetic contribution that depends on the magnitude and orientation of the magnetization with respect to the incident and scattered X-ray wave vector. In turn, the field dependence of the magnetization may be inferred by tracking the intensity of the Bragg peak, shown in Fig. 2(a). Clear kinks at and saturated behavior at larger fields are observed, when the microwave excitation is switched off (gray curve). Subtle changes in the curve’s slope indicate phase transitions which are discussed in more detail in Refs. Adams et al. (2012); Versteeg et al. (2016); Halder et al. (2018). As the magnetic contribution includes terms linear and quadratic in , the intensity curve is not symmetric with respect to zero field. We refer to the Supplementary Material and Refs. van der Laan (2008); Zhang et al. (2017b) for information on the determination of the absolute magnetization values.
Resonant excitation is studied by repeatedly switching on and off the microwave excitation while stepping the magnetic field, starting in high positive fields. At each field point, the REXS intensity under excitation is integrated for 3 s before the excitation is switched off and the intensity is integrated again for 3 s. For an excitation frequency of 4.5 GHz (red curve), a minimum of the magnetic intensity contribution emerges in the field-polarized state above . As shown in Fig. 2(b), the normalized signal difference, , at this minimum is of the order of 2%, which translates to a reduction of the magnetization by about 6.5%. Note that the way how the excitation is applied means that the magnetization reproducibly switches from its reduced to its regular value at each field step. When assuming that precessional motion of the moments causes the reduction, a precession angle of is required. This value is large but plausible considering the rather low effective damping of observed in the insulator Cu2OSeO3 Stasinopoulos et al. (2017b); Bauer et al. (2015). In contrast, a change of the moment of 6.5% by heating effects requires an increase/decrease of the sample temperature by K after switching the excitation on/off in less than the time frame of 1 s resolvable in the present REXS experiment. Such drastic heating effects, however, would interfere when studying the skyrmion lattice state with its rather narrow temperature width of K close to , see below, and can be excluded.
Simultaneously to the REXS measurements, the reflected microwave power of the coplanar waveguide was recorded using a Schottky diode detector. As shown in Fig. 2(c), minima in the field-polarized state above are observed at the same field values as in REXS. An additional broad signature around zero field is attributed to resonant excitations in the helimagnetic state, notably of the q modes. The absence of these resonances in the REXS data highlights the potential of REXS-FMR to selectively study individual magnetic phases and determine the origin of specific excitations. Figure 2(d) shows that with increasing excitation frequency the resonance field in REXS data increases linearly, consistent with Kittel behavior in the field-polarized state. The resonance field values in the field-polarized state are also in excellent agreement with resonance frequencies inferred from conventional microwave spectroscopy using a vector network analyzer (spectra not shown).
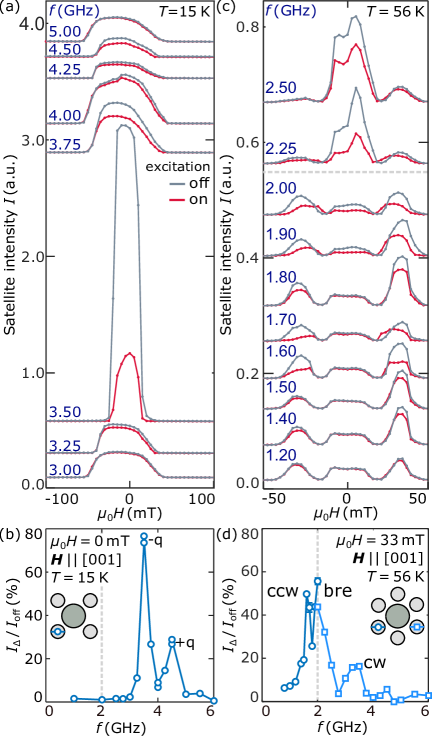
As one of its decisive advantages, REXS-FMR may be carried out not only on structural Bragg peaks but also on magnetic satellites, allowing to unambiguously make the connection between the underlying magnetic phase and the resonant mode. In Fig. 3(a), the intensity at a helical satellite position is shown as a function of field for different excitation frequencies at K. Similar as before, data are recorded with microwave excitation switched on and off at each magnetic field step. The integration time was increased to 10 s. Finite intensity arises only around zero field, where the helical state is observed in the magnetic phase diagram after zero-field cooling, cf. Fig. 1(b). Note, however, that the field is applied along , i.e., an easy axis for the helices in Cu2OSeO3, and the measurement starts in the field-polarized state. Therefore, when decreasing the field to zero through the conical state, the helices may be expected to remain in the helical domain oriented along the field direction even in zero field Bauer et al. (2017), resulting in the absence of magnetic satellites in the present scattering geometry at temperatures well below .
This putative contradiction connects to the recent discovery that Cu2OSeO3 not only hosts a skyrmion lattice at high temperatures, common to all cubic chiral magnets, but also an independent second skyrmion phase at low temperatures Chacon et al. (2018); Halder et al. (2018). In contrast to the high-temperature phase, the low-temperature phase stabilized by magneto-crystalline anisotropies and exists only for field values around applied along . Due to the topological protection inherent to skyrmions and the rather low temperature, the energy barrier of the low-temperature skyrmion phase is comparatively high. As a result, the skyrmion state exhibits a rather glassy texture without well-defined long-range order. When this state decays at lower fields by means of coalescence of neighboring skyrmions, a texture resembling poorly ordered helices with propagation perpendicular to the field forms Milde et al. (2013); Wild et al. (2017). The weak magnetic satellites associated with such a helical state are detected in our REXS experiment. Perhaps most strikingly, the glassy texture is highly susceptible to changes induced by resonant microwave excitation, as explained in the following.
At low and high frequencies, i.e., when the excitation is off-resonance, data with microwave switched on and off agree with each other, corroborating that heating effects are negligible. In resonance, the excitation distinctly reduces the satellite intensity. Consistent with the behavior in the field-polarized state, the intensity reproducibly switches between its low and high value at each field step and the reduction is attributed to a precessional motion of the magnetic moments. Note, however, that data without excitation (gray curves) are expected to track each other as long as the same magnetic texture is probed, which is clearly not the case.
The discrepancy becomes especially pronounced for an excitation frequency of 3.5 GHz, for which the satellite intensity increases by an order of magnitude while the field range shrinks by a factor of two. This finding suggests that the microwave excitation interacts with the glassy magnetic texture described above, improving its long-range order. In resonance this pumping effect is particularly effective and the corresponding magnetic satellite in reciprocal space not only increases in intensity but also decisively sharpens.
When also taking into account a small misalignment between sample plane and field direction, as a result the scattering condition is only fulfilled in a reduced field interval around zero field. In Fig. 3(b), the relative reduction of the helical satellite intensity in zero field is shown as a function of the excitation frequency. Two sharp maxima are observed that are unambiguously attributed to the -q and +q collective modes of the helical state. Both frequency values and heights of the maxima are in excellent agreement with the literature Onose et al. (2012); Schwarze et al. (2015).
Finally, REXS-FMR on the high-temperature skyrmion lattice is presented in Fig. 3(c) showing the intensity at a skyrmion satellite position as a function of field at K for different excitation frequencies. Starting the description in off-resonance at low excitation frequency (bottom), measurements with and without microwave excitation track each other. The intensity maxima in finite fields around mT are attributed to the skyrmion lattice state. In addition, finite intensity emerges around zero field as the tail of the broad helical satellite close-by in reciprocal space reaches the position of the skyrmion satellite. At higher frequencies, a distinct reduction of the skyrmion satellite intensity is observed under microwave excitation, again attributed to a precessional motion of the magnetic moments. At frequencies above 1.9 GHz, resonance effects associated with the helical state are observed around zero field.
In order to further analyze the skyrmion resonances, the relative reduction of the satellite intensity at 35 mT, i.e., in the skyrmion lattice state, is depicted in Fig. 3(d) as a function of the excitation frequency. Three distinct maxima are observed and associated with the counter-clockwise (ccw) gyration, breathing (bre), and clockwise (cw) gyration mode, in excellent agreement with literature Onose et al. (2012); Schwarze et al. (2015). The relative heights of the maxima are also perfectly consistent with calculated spectral weight distributions, as the coplanar waveguide combines in-plane excitation, driving the two gyration modes, and out-of-plane excitation, driving the breathing mode Stasinopoulos et al. (2017a). Due to a photon penetration depth of about 30 nm, the REXS-FMR measurements probe the recently discovered surface states of the skyrmion lattice in Cu2OSeO3 Zhang et al. (2018b); Legrand et al. (2018). Although roughly 25 % of the probed volume are expected to contain such surfaces states, no contributions distinguishable from the bulk resonance modes are observed, indicating that the resonance frequencies of bulk and surface states are very similar or equal. Note that above and below 2 GHz different circulators are used, leading to a small offset in the applied microwave power. Furthermore, the diode position was changed, as indicated in the sketch in Fig. 3(d), resulting in quantitative discrepancies in the measured intensity profiles at that frequency.
In summary, we established a novel X-ray scattering technique, referred to as REXS-FMR, that combines microwave excitation by means of a coplanar waveguide with detection in reciprocal space by means of magnetic REXS. In the cubic chiral magnet Cu2OSeO3, we identified the resonant modes in the field-polarized, helimagnetic, and skyrmion lattice state by tracking the intensity of the structural Bragg peak and its magnetic satellites under microwave excitation. The surface sensitive measurement indicates equal magnetic resonance frequencies for skyrmionic surface and bulk states. REXS-FMR also allows for stroboscopic measurements in order to determine the character of eigenmodes microscopically, e.g., to distinguish between gyration and breathing modes. Also note that the selectivity to certain magnetic phases may prove particularly useful in complex magnetic environments for which the clear identification of eigenmodes in conventional microwave spectroscopy is challenging, such as for multi-domain skyrmion states in lacunar spinels Kézsmárki et al. (2015); Ehlers et al. (2016); Okamura et al. (2019), glassy skyrmionic textures in Co-Mn-Zn compounds Tokunaga et al. (2015); Takagi et al. (2017); Karube et al. (2018), or the low-temperature skyrmion state in Cu2OSeO3 with its concomitant tilted conical state Chacon et al. (2018); Halder et al. (2018); Qian et al. (2018).
We wish to thank W. Simeth for fruitful discussions and assistance with the experiments. C.B. G.W. and F.R. acknowledge funding by the BMBF via the VEKMAG project. S.P. G.W. and C.B. acknowledge funding by the German Research Foundation via SPP2137. This project has received funding from the EMPIR programme co-financed by the Participating States and from the European Union’s Horizon 2020 research and innovation programme. A.B. and C.P. acknowledge financial support through DFG TRR80 (project F7), DFG SPP2137, as well as ERC Advanced Grants 291079 (TOPFIT) and 788031 (ExQuiSid). This work has been funded by the Deutsche Forschungsgemeinschaft (DFG, German Research Foundation) under Germany’s Excellence Strategy – EXC-2111 – 390814868.
References
- Kittel (1948) C. Kittel, Phys. Rev. 73, 155 (1948).
- Kimura et al. (2006) S. Kimura, M. Hagiwara, H. Ueda, Y. Narumi, K. Kindo, H. Yashiro, T. Kashiwagi, and H. Takagi, Phys. Rev. Lett. 97, 257202 (2006).
- Mühlbauer et al. (2009) S. Mühlbauer, B. Binz, F. Jonietz, C. Pfleiderer, A. Rosch, A. Neubauer, R. Georgii, and P. Böni, Science 323, 915 (2009).
- Yu et al. (2010) X. Z. Yu, Y. Onose, N. Kanazawa, J. H. Park, J. H. Han, Y. Matsui, N. Nagaosa, and Y. Tokura, Nature 465, 901 (2010).
- Yu et al. (2011) X. Z. Yu, N. Kanazawa, Y. Onose, K. Kimoto, W. Z. Zhang, S. Ishiwata, Y. Matsui, and Y. Tokura, Nat. Mater. 10, 106 (2011).
- Seki et al. (2012a) S. Seki, X. Z. Yu, S. Ishiwata, and Y. Tokura, Science 336, 198 (2012a).
- Nagaosa and Tokura (2013) N. Nagaosa and Y. Tokura, Nat. Nanotechnol. 8, 899 (2013).
- Date et al. (1977) M. Date, K. Okuda, and K. Kadowaki, J. Phys. Soc. Jpn. 42, 1555 (1977).
- Kobets et al. (2010) M. I. Kobets, K. G. Dergachev, E. N. Khatsko, A. I. Rykova, P. Lemmens, D. Wulferding, and H. Berger, Low Temp. Phys. 36, 176 (2010).
- Koralek et al. (2012) J. D. Koralek, D. Meier, J. P. Hinton, A. Bauer, S. A. Parameswaran, A. Vishwanath, R. Ramesh, R. W. Schoenlein, C. Pfleiderer, and J. Orenstein, Phys. Rev. Lett. 109, 247204 (2012).
- Onose et al. (2012) Y. Onose, Y. Okamura, S. Seki, S. Ishiwata, and Y. Tokura, Phys. Rev. Lett. 109, 037603 (2012).
- Schwarze et al. (2015) T. Schwarze, J. Waizner, M. Garst, A. Bauer, I. Stasinopoulos, H. Berger, C. Pfleiderer, and D. Grundler, Nat. Mater. 14, 478 (2015).
- Mochizuki (2012) M. Mochizuki, Phys. Rev. Lett. 108, 017601 (2012).
- Kézsmárki et al. (2015) I. Kézsmárki, S. Bordács, P. Milde, E. Neuber, L. M. Eng, J. S. White, H. M. Rønnow, C. D. Dewhurst, M. Mochizuki, K. Yanai, H. Nakamura, D. Ehlers, V. Tsurkan, and A. Loidl, Nat. Mater. 14, 1116 (2015).
- Nayak et al. (2017) A. K. Nayak, V. Kumar, T. Ma, P. Werner, E. Pippel, R. Sahoo, F. Damay, U. K. Rößler, C. Felser, and S. S. P. Parkin, Nature 548, 561 (2017).
- Kurumaji et al. (2017) T. Kurumaji, T. Nakajima, V. Ukleev, A. Feoktystov, T. Arima, K. Kakurai, and Y. Tokura, Phys. Rev. Lett. 119, 237201 (2017).
- Münzer et al. (2010) W. Münzer, A. Neubauer, T. Adams, S. Mühlbauer, C. Franz, F. Jonietz, R. Georgii, P. Böni, B. Pedersen, M. Schmidt, A. Rosch, and C. Pfleiderer, Phys. Rev. B 81, 041203 (2010).
- Bauer and Pfleiderer (2012) A. Bauer and C. Pfleiderer, Phys. Rev. B 85, 214418 (2012).
- Oike et al. (2016) H. Oike, A. Kikkawa, N. Kanazawa, Y. Taguchi, M. Kawasaki, Y. Tokura, and F. Kagawa, Nat. Phys. 12, 62 (2016).
- Okamura et al. (2016) Y. Okamura, F. Kagawa, S. Seki, and Y. Tokura, Nat. Commun. 7, 12669 (2016).
- Karube et al. (2016) K. Karube, J. S. White, N. Reynolds, J. L. Gavilano, H. Oike, A. Kikkawa, F. Kagawa, Y. Tokunaga, H. M. Rønnow, Y. Tokura, and Y. Taguchi, Nat. Mater. 15, 1237 (2016).
- Karube et al. (2017) K. Karube, J. S. White, D. Morikawa, M. Bartkowiak, A. Kikkawa, Y. Tokunaga, T. Arima, H. M. Rønnow, Y. Tokura, and Y. Taguchi, Phys. Rev. Mater. 1, 074405 (2017).
- Bauer et al. (2018) A. Bauer, A. Chacon, M. Halder, and C. Pfleiderer, in Topology in Magnetism, edited by J. Zang, V. Cros, and A. Hoffmann (Springer, 2018) p. 151.
- Yu et al. (2018) X. Z. Yu, W. Koshibae, Y. Tokunaga, K. Shibata, Y. Taguchi, N. Nagaosa, and Y. Tokura, Nature 564, 95 (2018).
- Chacon et al. (2018) A. Chacon, L. Heinen, M. Halder, A. Bauer, W. Simeth, S. Mühlbauer, H. Berger, M. Garst, A. Rosch, and C. Pfleiderer, Nat. Phys. 14, 936 (2018).
- Langner et al. (2014) M. C. Langner, S. Roy, S. K. Mishra, J. C. T. Lee, X. W. Shi, M. A. Hossain, Y.-D. Chuang, S. Seki, Y. Tokura, S. D. Kevan, and R. W. Schoenlein, Phys. Rev. Lett. 112, 167202 (2014).
- Zhang et al. (2016a) S. L. Zhang, A. Bauer, H. Berger, C. Pfleiderer, G. van der Laan, and T. Hesjedal, Phys. Rev. B 93, 214420 (2016a).
- Zhang et al. (2016b) S. L. Zhang, A. Bauer, D. M. Burn, P. Milde, E. Neuber, L. M. Eng, H. Berger, C. Pfleiderer, G. van der Laan, and T. Hesjedal, Nano Lett. 16, 3285 (2016b).
- Zhang et al. (2016c) S. L. Zhang, A. Bauer, H. Berger, C. Pfleiderer, G. van der Laan, and T. Hesjedal, Appl. Phys. Lett. 109, 192406 (2016c).
- Zhang et al. (2017a) S. L. Zhang, G. van der Laan, and T. Hesjedal, Nat. Commun. 8, 14619 (2017a).
- Zhang et al. (2018a) S. Zhang, G. van der Laan, J. Müller, L. Heinen, M. Garst, A. Bauer, H. Berger, C. Pfleiderer, and T. Hesjedal, Proc. Natl. Acad. Sci. USA 115, 6386 (2018a).
- Okamura et al. (2013) Y. Okamura, F. Kagawa, M. Mochizuki, M. Kubota, S. Seki, S. Ishiwata, M. Kawasaki, Y. Onose, and Y. Tokura, Nat. Commun. 4, 2391 (2013).
- Ogawa et al. (2015) N. Ogawa, S. Seki, and Y. Tokura, Sci. Rep. 5, 9552 (2015).
- Seki et al. (2016) S. Seki, Y. Okamura, K. Kondou, K. Shibata, M. Kubota, R. Takagi, F. Kagawa, M. Kawasaki, G. Tatara, Y. Otani, and Y. Tokura, Phys. Rev. B 93, 235131 (2016).
- Stasinopoulos et al. (2017a) I. Stasinopoulos, S. Weichselbaumer, A. Bauer, J. Waizner, H. Berger, M. Garst, C. Pfleiderer, and D. Grundler, Sci. Rep. 7, 7037 (2017a).
- Weiler et al. (2017) M. Weiler, A. Aqeel, M. Mostovoy, A. Leonov, S. Geprägs, R. Gross, H. Huebl, T. T. M. Palstra, and S. T. B. Goennenwein, Phys. Rev. Lett. 119, 237204 (2017).
- Noll and Radu (2017) T. Noll and F. Radu, in Proc. MEDSI2016, Barcelona, Spain, September 11-16, 2016, 9 (JACoW, Geneva, Switzerland, 2017) pp. 370–373.
- Templeton and Templeton (1994) D. H. Templeton and L. K. Templeton, Phys. Rev. B 49, 14850 (1994).
- Dmitrienko and Chizhikov (2012) V. E. Dmitrienko and V. A. Chizhikov, Phys. Rev. Lett. 108, 187203 (2012).
- Bauer and Pfleiderer (2016) A. Bauer and C. Pfleiderer, Topological Structures in Ferroic Materials: Domain Walls, Vortices and Skyrmions, edited by J. Seidel (Springer, 2016) p. 1.
- Adams et al. (2012) T. Adams, A. Chacon, M. Wagner, A. Bauer, G. Brandl, B. Pedersen, H. Berger, P. Lemmens, and C. Pfleiderer, Phys. Rev. Lett. 108, 237204 (2012).
- Seki et al. (2012b) S. Seki, J.-H. Kim, D. S. Inosov, R. Georgii, B. Keimer, S. Ishiwata, and Y. Tokura, Phys. Rev. B 85, 220406 (2012b).
- White et al. (2014) J. S. White, K. Prša, P. Huang, A. A. Omrani, I. Živković, M. Bartkowiak, H. Berger, A. Magrez, J. L. Gavilano, G. Nagy, J. Zang, and H. M. Rønnow, Phys. Rev. Lett. 113, 107203 (2014).
- Bannenberg et al. (2017) L. J. Bannenberg, F. Qian, R. M. Dalgliesh, N. Martin, G. Chaboussant, M. Schmidt, D. L. Schlagel, T. A. Lograsso, H. Wilhelm, and C. Pappas, Phys. Rev. B 96, 184416 (2017).
- Makino et al. (2017) K. Makino, J. D. Reim, D. Higashi, D. Okuyama, T. J. Sato, Y. Nambu, E. P. Gilbert, N. Booth, S. Seki, and Y. Tokura, Phys. Rev. B 95, 134412 (2017).
- Seki et al. (2017) S. Seki, Y. Okamura, K. Shibata, R. Takagi, N. D. Khanh, F. Kagawa, T. Arima, and Y. Tokura, Phys. Rev. B 96, 220404 (2017).
- Note (1) Note that critical field values slightly vary with the applied field direction in a bar-shaped sample due to demagnetization effects.
- Versteeg et al. (2016) R. B. Versteeg, I. Vergara, S. D. Schäfer, D. Bischoff, A. Aqeel, T. T. M. Palstra, M. Grüninger, and P. H. M. van Loosdrecht, Phys. Rev. B 94, 094409 (2016).
- Halder et al. (2018) M. Halder, A. Chacon, A. Bauer, W. Simeth, S. Mühlbauer, H. Berger, L. Heinen, M. Garst, A. Rosch, and C. Pfleiderer, Phys. Rev. B 98, 144429 (2018).
- van der Laan (2008) G. van der Laan, C. R. Phys. 9, 570 (2008).
- Zhang et al. (2017b) S. L. Zhang, G. van der Laan, and T. Hesjedal, Phys. Rev. B 96, 094401 (2017b).
- Stasinopoulos et al. (2017b) I. Stasinopoulos, S. Weichselbaumer, A. Bauer, J. Waizner, H. Berger, S. Maendl, M. Garst, C. Pfleiderer, and D. Grundler, Appl. Phys. Lett. 111, 032408 (2017b).
- Bauer et al. (2015) H. G. Bauer, P. Majchrak, T. Kachel, C. H. Back, and G. Woltersdorf, Nat. Commun. 6, 8274 (2015).
- Bauer et al. (2017) A. Bauer, A. Chacon, M. Wagner, M. Halder, R. Georgii, A. Rosch, C. Pfleiderer, and M. Garst, Phys. Rev. B 95, 024429 (2017).
- Milde et al. (2013) P. Milde, D. Köhler, J. Seidel, L. M. Eng, A. Bauer, A. Chacon, J. Kindervater, S. Mühlbauer, C. Pfleiderer, S. Buhrandt, C. Schütte, and A. Rosch, Science 340, 1076 (2013).
- Wild et al. (2017) J. Wild, T. N. G. Meier, S. Pöllath, M. Kronseder, A. Bauer, A. Chacon, M. Halder, M. Schowalter, A. Rosenauer, J. Zweck, J. Müller, A. Rosch, C. Pfleiderer, and C. H. Back, Sci. Adv. 3, e1701704 (2017).
- Zhang et al. (2018b) S. L. Zhang, G. van der Laan, W. W. Wang, A. A. Haghighirad, and T. Hesjedal, Phys. Rev. Lett. 120, 227202 (2018b).
- Legrand et al. (2018) W. Legrand, J.-Y. Chauleau, D. Maccariello, N. Reyren, S. Collin, K. Bouzehouane, N. Jaouen, V. Cros, and A. Fert, Sci Adv 4, eaat0415 (2018).
- Ehlers et al. (2016) D. Ehlers, I. Stasinopoulos, V. Tsurkan, H.-A. Krug von Nidda, T. Fehér, A. Leonov, I. Kézsmárki, D. Grundler, and A. Loidl, Phys. Rev. B 94, 014406 (2016).
- Okamura et al. (2019) Y. Okamura, S. Seki, S. Bordács, A. Butykai, V. Tsurkan, I. Kézsmárki, and Y. Tokura, Phys. Rev. Lett. 122, 057202 (2019).
- Tokunaga et al. (2015) Y. Tokunaga, X. Z. Yu, J. S. White, H. M. Rønnow, D. Morikawa, Y. Taguchi, and Y. Tokura, Nat. Commun. 6, 7638 (2015).
- Takagi et al. (2017) R. Takagi, D. Morikawa, K. Karube, N. Kanazawa, K. Shibata, G. Tatara, Y. Tokunaga, T. Arima, Y. Taguchi, Y. Tokura, and S. Seki, Phys. Rev. B 95, 220406 (2017).
- Karube et al. (2018) K. Karube, J. S. White, D. Morikawa, C. D. Dewhurst, R. Cubitt, A. Kikkawa, X. Yu, Y. Tokunaga, T. Arima, H. M. Rønnow, Y. Tokura, and Y. Taguchi, Sci. Adv. 4, eaar7043 (2018).
- Qian et al. (2018) F. Qian, L. J. Bannenberg, H. Wilhelm, G. Chaboussant, L. M. Debeer-Schmitt, M. P. Schmidt, A. Aqeel, T. T. M. Palstra, E. Brück, A. J. E. Lefering, C. Pappas, M. Mostovoy, and A. O. Leonov, Sci. Adv. 4, eaat7323 (2018).
The citations in this appended supplement refer to the ones in the main text given above.
Ferromagnetic resonance with magnetic phase selectivity by means of resonant elastic x-ray scattering on a chiral magnet - supplementary material
When the Bragg-peak intensity is recorded as a function of externally applied magnetic field a magnetization trace is observed. The observed intensity change is however not directly proportional to the change of magnetization due to higher order terms. To extract the actual magnetization trace the theory of van der Laan et al. is applied in the following van der Laan (2008).
The scattering cross section is given by (van der Laan (2008) Equation (15))
| (1) |
with the scattering vector , the incident and final photon wave vector and (and their unit vectors and ). The contribution of charge scattering is given by (van der Laan (2008) Equation (16))
| (2) |
with the Fourier transformation of the charge density and the monopole contribution of the energy dependent resonance amplitude . Further is and with the Poincaré vector . For circularly polarized light which is assumed for the following considerations. Equation 2 is independent of the magnetization (and its Fourier transformation ) of the sample.
The contribution of pure magnetic scattering for inside the scattering plane is given by (van der Laan (2008) Equation (19))
| (3) |
with the Fourier transformation of the magnetic dipolar contribution to the energy dependent resonance amplitude . Finally, the interference term between charge and magnetic scattering for circular polarization with inside the scattering plane is given by (van der Laan (2008) Equation (21))
| (4) | |||
For the case shown in Fig. 2(a) of the main text, the magnetization is collinear to the incident beam. The photon wave vectors and are fixed to the (001)-Bragg condition (). As a function of the charge scattering is constant. is assumed for circularly polarized light, meaning , and .
Equation 1 can then be written as
| (5) |
with the constants and . The net magnetization along is assumed to have the following form
| (6) |
with the second critical field and the saturation magnetization . For this is obviously not true in case of the non-collinear ferromagnet that is investigated, the net magnetization along the field however is well-described by this behaviour as can be seen e.g. from Adams et al. (2012). The experimental data in Fig. 2(a) of the main text can now be fitted to equation 5 using the parameters , , and . Fig. 4(a) shows again the data from Fig. 2(a) of the main text and the resulting fit for the excitation off data. The fit gives a ratio of pure magnetic scattering to the interference term of . From the fit parameter the magnetization trace can be plotted using equation 6. Getting from the plot where the intensity of the rf off data (in the non-saturated part) is equal to the reduced intensity of the rf on data, one can use Fig. 4(b) to estimate the reduction of in resonance. A mean value of is obtained. The scattering geometry is shown in Fig. 4(c). The contributions of charge scattering, pure magnetic and interference scattering obtained from the fit is shown in Fig. 4(d-f).