Chandra Survey of Nearby Highly Inclined Disk Galaxies - V: Emission Structure and Origin of Galactic Coronae
Abstract
The origin of the extended soft X-ray emission around nearby highly inclined disk galaxies (often called as X-ray corona) remains uncertain. The emission could arise from volume-filling hot gas and/or its interaction with cool gas. Morphological properties of the X-ray emission can provide additional information to distinguish these different origins. We define model-independent parameters , , and — vertical scales that enclose 50%, 75%, and 95% of the total flux of the emission, respectively. We study the correlation of these parameters with galaxy properties inferred from infrared observations of a sample of nearby highly inclined disk galaxies with high quality Chandra data. We find weak correlations between or and the surface star formation rate (), and no correlation for . However, we detect strong, correlations of the vertical concentration of the emission, defined as or , with . Our findings suggest that the X-ray emission around disk galaxies is likely comprised of two components: the extended, weak emission, characterized by , is influenced by the outflowing hot gas entrained in star formation driven winds, whereas the strong emission close to the disk which is often rich in cool gas characterized by or , is largely impacted by cool-hot gas interaction.
Subject headings:
evolution–galaxies: halos–intergalactic medium–galaxies: spiral–galaxies: statistics.1. Introduction
The galactic corona represents the hot, ionized, and rarefied gas with in the halo of the Milky way (MW) or other galaxies. Such a corona, traced by diffuse soft X-ray emission, serves as a reservoir of baryons that are either accreted from the intergalactic medium (IGM), or ejected from galaxies (e.g. White & Rees 1978; White & Frenk 1991; Fukugita & Peebles 2006; Bregman et al. 2018). In the latter case, the metal-rich gas is ejected from galaxies by energetic feedback from stellar sources or active galactic nuclei (AGN; e.g. Bower et al. 2012; Hopkins et al. 2014; Agertz & Kravtsov 2015; Keller et al. 2015; Mitra et al. 2015). The X-ray luminosity and morphology of the corona are largely determined by the feedback. Conversely, X-ray observations of galactic coronae provide a potentially powerful tool to probe various poorly understood processes involved in the feedback.
The diffuse soft X-ray emission of the hot corona has been detected by modern X-ray telescopes, such as Chandra , XMM-Newton , and Suzaku around nearby galaxies (e.g., Wang et al. 2001; Strickland et al. 2004; Tüllmann et al. 2006; Li et al. 2008; Wang 2010; Li & Wang 2013a, b; Yamasaki et al. 2009). There are tight correlations between the coronal X-ray luminosity () and the global properties of the galaxies (e.g., , SFR, etc. Tüllmann et al. 2006; Li et al. 2008; Li & Wang 2013b). For active star forming (SF) galaxies, the coronal luminosity is linearly correlated with the star formation rate (SFR; e.g. Strickland et al. 2004; Grimes et al. 2005) and the metallicity of the coronal gas shows the same patterns as being enriched by young stellar populations such as massive stars or core collapsed SNe (e.g., Martin et al. 2002; Yamasaki et al. 2009; Konami et al. 2011). For SF-quiescent elliptical galaxies, in contrast, the X-ray luminosity is tightly correlated with the stellar mass (), and the slope of the correlation is far larger than unity, especially for massive galaxies (Forman et al. 1985; Canizares et al. 1987; Helsdon et al. 2001; Mathews & Brighenti 2003; O’Sullivan et al. 2003; Kim & Fabbiano 2013; Forbes et al. 2016). This strong correlation suggests that gravity plays an important role in heating and/or confining the hot gas. The above correlations could be largely affected by the global scaling relations between various parameters of the galaxies and the overall size of the galaxy. In the previous work, Wang et al. (2016) revealed a clearly sublinear correlation between the specific X-ray luminosity , where is the K-band luminosity, and the SF intensity (). The well known linear correlation between and SFR is thus largely due to the global scaling of both parameters with the galaxy size. The anti-correlation between and further suggests that the bulk of the mechanical energy from stellar feedback is most likely dissipated far away from the galaxy disc with reduced global X-ray emission rate as the SF intensity increases.
Despite the progress, the exact origin of the extraplanar soft X-ray emission remains unclear. In addition to the optically thin volume filling thermal plasma, the charge exchange X-ray emission (CXE), generated at the interface between the cool and hot gas, may also make non-negligible contribution (e.g., Liu et al. 2011, 2012; Zhang et al. 2014; Henley & Shelton 2015). The CXE tends to dominate only in a few special emission lines which are hardly separated from emission lines primarily produced in thermal plasma in low resolution CCD spectra. In many cases, the cool gas traced by emission spatially coincides with the X-ray emission, indicating significant contributions of the CXE (Lallement 2004). Moreover, a high-temperature () thermal component, which has low density and hence low emissivity, has been suggested based on the detection of the highly ionized Fe K lines in the nuclear region of M82 (Strickland & Heckman 2009). Such a high-temperature gas, if exists, may produce strong soft X-ray emission via interacting with the pre-existing cool gas in and around the galaxies (Strickland & Stevens 2000; Strickland et al. 2000). Statistical analysis of the extraplanar emission morphology may help to separate these different soft X-ray emission components (thermal plasma versus cool-hot gas interaction), as they are expected to have different spatial distributions.
Infrared is an ideal band to explore the stellar mass distribution and the obscured star formation history, particular for the highly inclined galaxies which are heavily affected by the interstellar dust extinction. The Wide field Infrared Survey Explorer (WISE) mapped the full sky at mid-infrared four bands 3.4 µm (W1), 4.6 µm (W2), 12 µm (W3), and 22 µm (W4) with angular resolutions of 6.1″, 6.4″, 6.5″, and 12.0″, respectively (Wright et al. 2010). The sensitivity of the WISE is much higher than the previous mission, the Infrared Astronomical Satellite (IRAS). W1 and W2 of WISE, trace the stellar mass constant, and the other two bands, W3 and W4, are sensitive to the star formation. In this paper, we compare the mid-infrared galaxy properties obtained from WISE to the soft X-ray morphology of the extraplanar emission characterized with different parameters. We describe our sample and present the data analysis in Section 2. The result and discussion are presented in Section 3 and 4, respectively. Finally, we give our summary in Section 5.
2. Sample and Data
2.1. Sample
Our sample consists of 51 nearby, highly inclined disc galaxies that were initially compiled by Li & Wang (2013a). They selected their sample based on morphological classification (optical morphological type codes of ), inclination angle (), distance ( Mpc), extinction (neutral hydrogen column density ), as well as Chandra data availability (See Table 1 in Li & Wang 2013a for details).
We remove two galaxies, M82 and NGC 4342, from the original sample, because the fluxes in the central region of M82 are saturated in WISE W3 and W4 bands, and the corona of NGC 4342 are largely affected by its intracluster medium (ICM, Bogdán et al. 2012).
Following Li & Wang (2013a), we define subsamples based on the morphological type and environment of the galaxies: late or early type; field or cluster environment. We further label 12 galaxies with reported AGNs activities, IC 2560, NGC 660, NGC 1386, NGC 3079, NGC 4388, NGC 4501, NGC 4565, NGC 4569, NGC 4594, NGC 5866, NGC 6764, and NGC 7582 (Véron-Cetty & Véron 2006; Croston et al. 2008).
2.2. WISE data
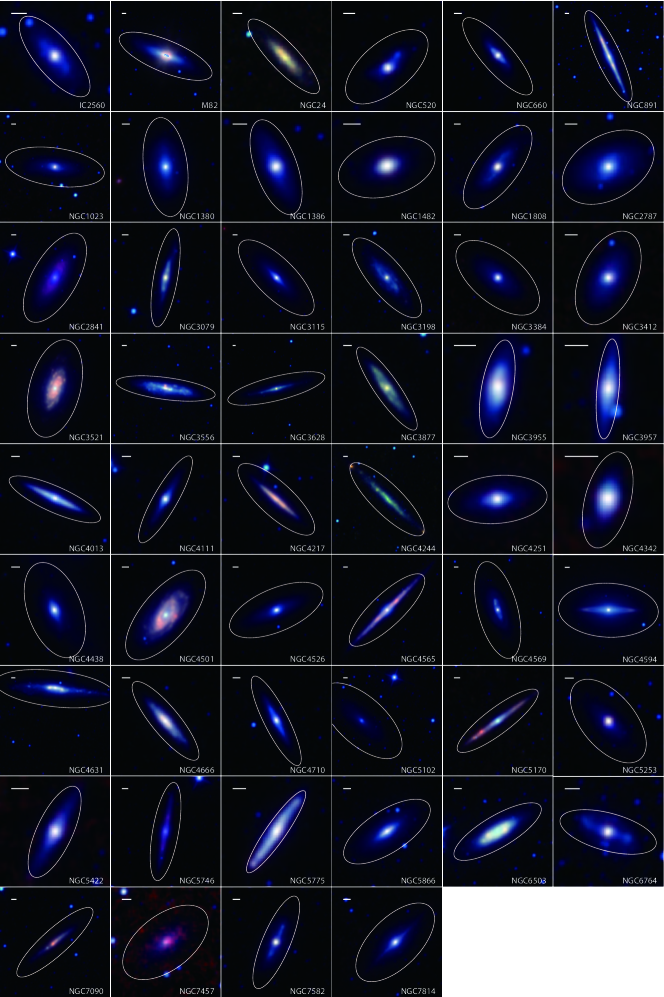
In this section, we analyze the WISE data and derive a few physical parameters of each sample galaxy. The WISE four-band images of our sample galaxies have been retrieved from ALLWISE Release Atlas Images in the WISE archive111http://irsa.ipac.caltech.edu/applications/wise. Figure 1 shows the tri-color image of each galaxy in the RGB (red, green, blue) color space. We first perform aperture photometry and fit the morphology of the sample galaxies. We then estimate quantities such as stellar mass and star formation rate, and compare our results with previous findings.
2.2.1 Apeture photometry
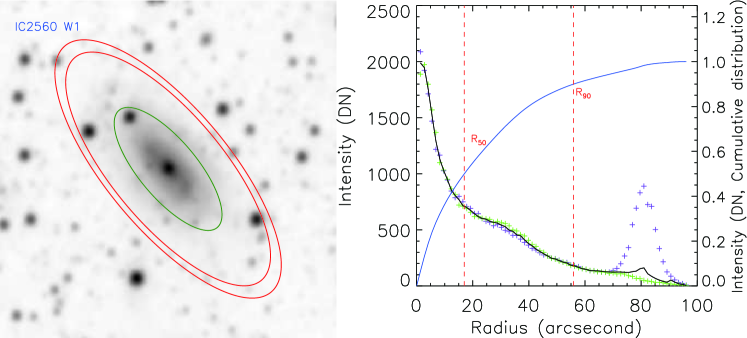
We first define an ellipse for each galaxy as the area (or boundary) of measuring the IR emission profile (see the white ellipse in Figure 1). The major and minor axes of the ellipse are adopted from the 2MASS band measurements444http://ned.ipac.caltech.edu/. Except for NGC5102, we reduce the aperture by 50% in the W3 and W4 bands because of the weak emission or the low intensity respect to the background fluctuation in these two bands. To extract the background, we define a concentric elliptical annulus for which the inner and outer major axes equal to 1.9 and 2.1 times of the band major axes, respectively. The background is defined as the median intensity within that annulus. In the left panel of Figure 3, the green line marks the 2MASS boundary of the galaxy, while the background subtraction region is labeled with the red lines.
We also adopt a simplified method to calculate the IR emission profile. Specially, we define as the distance along the major axis to the center, and the total IR intensity is measured within an rectangle region from to . The vertical boundary of this rectangle region is the ellipse that encompass the entire IR emission (the white ellipse in Figure 1). Then we obtain the 1D intensity distribution along the positive and negative directions of the major axes of the galaxy. Assuming a symmetric distribution of the intrinsic flux of the galaxy, we take a median average the intensity profiles at both directions to obtain an average distribution (, where the smooth width is 6″). Most of the contributions from point like sources (e.g., the bright source at the top-left corner of the ellipse) have been removed in this median-averaged process. We then obtain the total intensity of the galaxy from the . The blue line shows the cumulative distribution of the intensity. We have also calculated the and (labeled in red-dashed lines), defined as 50% and 90% cumulative intensities, respectively. In Table 1, we list both and for all the four WISE bands.
Three kinds of corrections, aperture correction, color correction, and calibration correction for W4, were applied for the WISE co-added images. We refer the readers to Section 3.5 of Jarrett et al. (2013) for details. We have also taken into account the foreground Galactic extinction when deriving the integrated flux. The extinctions for the four WISE bands in the Milky Way are , , , , respectively (Jarrett et al. 2013), where was obtained from the IRAS database 555http://irsa.ipac.caltech.edu/applications/DUST/. All magnitudes in this paper have been defined in the Vega System. The measured fluxes in the four WISE bands are listed in column 1–4 of Table 2.
2.2.2 Stellar mass
We follow Jarrett et al. (2013) to estimate the stellar mass of the sample galaxies. By correlating the stellar mass estimated with 2MASS band magnitude and the WISE () as well as () colors, Jarrett et al. (2013) found the following empirical relations to estimate the mass-to-light ratio:
| (1) | |||
| (2) |
Here is the W1 luminosity.
We list the stellar mass calculated with these two empirical formula in columns 6 and 7 of Table 2. In the right panel of Figure 3, we compare the stellar mass estimated with 2MASS band magnitude with those estimated with the WISE data. The stellar mass measured based on the color has a much tighter correlation with the band magnitude with less scatter (, ).
2.2.3 Star formation Rate
Jarrett et al. (2013) suggested that fluxes measured in WISE W3 and W4 bands strongly correlate with those measured with Spitzer 24 fluxes of 17 nearby galaxies. In this work, we focus on the global SFR calculated in W3 and W4 bands, adopting the two equations from Jarrett et al. (2013):
| (3) | |||
| (4) |
Here the spectral luminosity is normalized by .
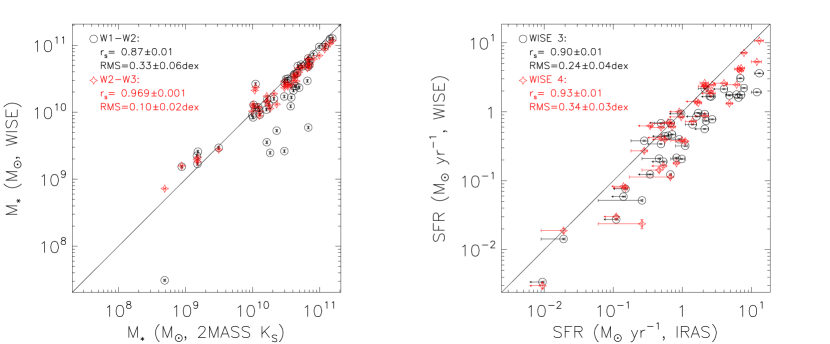
We compare our measurements of the SFR with those measured with IRAS for overlapped sample galaxies. The fluxes of part of our galaxies in IRAS were obtained from Fullmer & Londsdale 1989. The total IR luminosity is defined as (Rice et al. 1988): LIR=5.67105 , where is the distance, and are the IRAS fluxes measured at 12, 25, 60, and 100 , respectively. Using the relation of Kennicutt 1998, the IRAS SFRs of our galaxies have been estimated from the . In the right panel of Figure 3 we show the comparison of the SFRs measured with the WISE and IRAS data. The SFR estimated with the W4 band luminosity (, ) is better consistent with the IRAS SFR than the W3 SFR (, ). The large deviation from the best-fit relations is that due to the poorer sensitivity and resolution of IRAS that sometimes only an upper limit on the flux is obtained (see Li & Wang 2013a Table 4).
2.2.4 Inclination angle
To accurately describe the morphology of each galaxy, we use the image fitting code, IMFIT, to fit the 2D galaxy image (Erwin 2015). Using this code, the morphology of each galaxy can be decomposed into two components. The first component is a srsic profile (Sersic 1968) describing the surface brightness of the bulge:
| (5) |
Here is the half-light radius, is the surface brightness at the radius , and is a dimensionless constant to ensure half of the total luminosity is enclosed within (Erwin 2015). The second component is an exponential profile for the disc:
| (6) |
Here and are the central surface brightness and the exponential scale length, respectively.
To fit the morphology of each galaxy, we use the IDL code MEANCLIP (Landsman 1993) to obtain the sky background and the corresponding 1 fluctuation. We also set the initial values of the position angle and ellipticity to those obtained from the 2MASS catalogue. We made use of the uncertainty map of each galaxy retrieved from the WISE archive as the weight map.
We calculated the inclination angle of the galaxies from the fitted disk ellipticity () using W1 and W2 images. We adopt the average value of the measurements in these two bands as the final inclination angle of the galaxies (see Column 8 in Table 1).
2.3. X-ray data
The X-ray data analysis is detailed in Li & Wang (2013a). We only present a brief summary here. After standard data calibration, the point source removed, exposure corrected Chandra images were used to calculate the coronal X-ray luminosity and to extract the vertical (perpendicular to the disk plane) and horizontal (along with the disk plane) X-ray surface brightness profile.
The vertical profiles are extracted in a region where . Here is the radial distance along the galactic disk from the nucleus of the galaxy and is optical diameter. In this procedure, we exclude a significant valley (only occurring on the near side of the disk) of profile along the galactic disc (Figure 5 in Li & Wang 2013a). Then the total luminosity of the extraplanar emission is corrected for the loss of the filtered-out “disc” range (Section 5.1 in Li & Wang 2013a). By doing this, we have excluded the effect of the ISM absorption from the calculation of scale heights. Using this profile, we define several vertical heights of the extraplanar emission, , , and , enclosing 50%, 75%, and 95% of the total flux, respectively. The vertical scales are calculated by averaging the positive and negative sides of galaxies after removing the obscured disk (Table 3). All the vertical heights in this paper are corrected by the inclination angles–dividing , where is the inclination angle. To test the dependence of inclination, we generate a random number ranged from 60 to 90 for each galaxy as the inclination angle. Then we corrected the scale heights by the random inclination angle, and redo the relations in Section 3. We find the inclination correction hardly affect correlations of all the relations, and the uncertainty is well within the statistical and systematic errors.
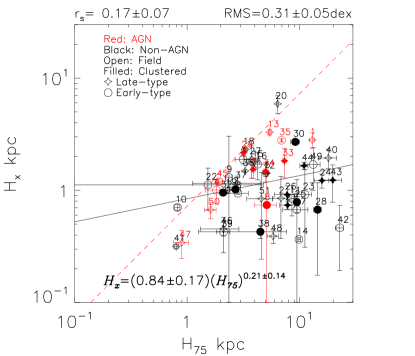
In addition to the morphological parameters , and , we also obtain the exponential scale height of the galaxies in the vertical direction () from Li & Wang 2013a. is calculated on both sides, above and below the galactic disk, and the averaged values are used for the statistical analysis below. We compare and in Figure 4. Assuming an exponential soft X-ray vertical intensity profile, is equivalent to /ln4, which is shown as the red dotted line in the figure. Clearly for some galaxies is far less than . In many of these galaxies, there is a strong X-ray emitting close to the disk dominating the extraplanar emission, so a single exponential model may not well describe the vertical distribution of the soft X-ray emission. We will, therefore, adopt the model-independent “scale heights” directly obtained from observations ( and ) in the following statistical analysis.
3. Analysis and Result
We use Spearman’s rank order coefficient (; ranging from -1 to 1) to evaluate the goodness of all the correlations in this work. A correlation coefficient of , , or is considered as no, weak, or strong correlation, respectively. We describe the correlation as a linear relation in logarithmic scale and calculate the root mean square (RMS) of the data points around the best-fit relation. The 1 errors quoted in the following analysis are estimated by bootstrap-with-replacement data (1000 times). We adopt the stellar mass calculated with Equation 2 and SFR calculated with Equation 4. We also define a specific parameter of the galaxies: the SF intensity , where are in W4 band.
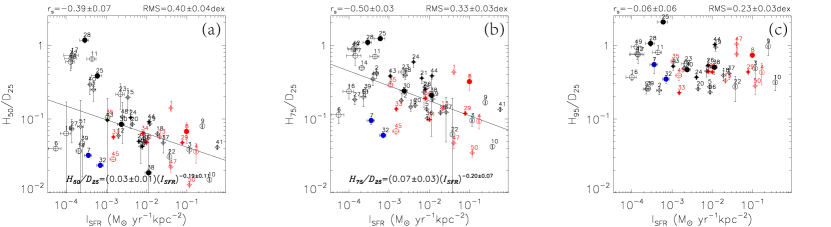
We first compare the vertical extension of the diffuse soft X-ray emission to the SF intensity (). To remove the uncertainty of galaxy distance, we normalize the extension by the (, , and ) which derive from the third-party observations. Figure 5 shows different trends on the or and relations. The former, relation for example, shows a moderate negative correlation with and , while the latter shows no correlation with and . For the relation, the correlation with field galaxies becomes tighter (, ). There is no significant difference on the tightness of correlation among the other sub-samples.
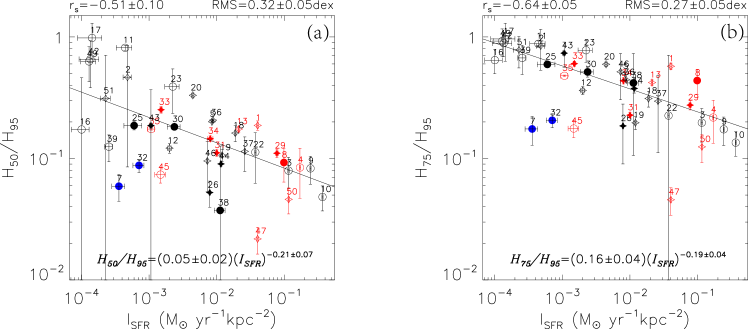
To further quantify the spatial extent of the diffuse X-ray emission, we define X-ray concentration parameters and along the vertical direction (Figure 6). Since the of six galaxies (NGC 24, NGC 3556, NGC 4217, NGC 4526, NGC 5102, and NGC 5422) is only accessible in one side, the related concentration for example, is calculated by or instead of . We obtain a tighter anti-correlation of with (, ) than the . The anti-correlation for field galaxies (, ) is also much stronger.
Furthermore, we notice that the values of two galaxies, NGC 1380 and NGC 4526 (No. 7 and 32) are overestimated because the X-ray emission of each is contaminated by another diffuse X-ray source perpendicular to the galaxy disc (see Figure 4 in Li & Wang 2013a). The anti-concentration becomes even tighter with and after removing these two outlier galaxies.
4. Discussion
Compared with previous statistical studies of the X-ray luminosity-related relations (e.g. Li & Wang 2013b; Strickland et al. 2004; Tüllmann et al. 2006; Wang et al. 2016), the vertical heights not only provide additional spatial information, but also help distinguish the contribution of different components. As the outermost soft X-ray vertical extension of the extraplanar emission observed in our sample () is much smaller than the typical cooling radius of galaxies (Bregman et al. 2018), it is likely is affected more by stellar feedback than accretion from the IGM, we therefore focus on stellar feedback in the following discussion.
We suggest that the two clearly different trends in the or versus (Figure 5a,b) and versus plots (Figure 5c) are caused by the contributions of the two significantly different soft X-ray emitting components. One component is the optically thin thermal emission from the hot plasma itself. The other is the emission generated at its interface with cool gas. Interface processes such as CXE, cooling/condensation and/or turbulent mixing of different gas phases, can enhance the soft X-ray emission (e.g. Liu et al. 2011; Li et al. 2011). The thermal plasma emission should be extended and radiatively inefficient due to the low density of the gas (Strickland & Heckman 2007, 2009). On the other hand, the cool-hot gas interaction is largely affected by the spatial distribution of the cool gas, which often appears to be much more confined than the hot gas around nearby galaxies. Therefore, it is likely that (or ) and trace the cool-hot interaction and the extended diffuse hot gas, respectively.
Although the total X-ray emission of a galaxy seems positively dependent on the SF activity (characterized with the total SFR, Strickland et al. 2004; Grimes et al. 2005; Tüllmann et al. 2006; Li et al. 2008; Li & Wang 2013b), the efficiency converting the stellar feedback energy to X-ray emission is actually negatively dependent on the SF intensity (Li & Wang 2013b; Wang et al. 2016). A larger fraction of stellar feedback energy is carried out by the galactic wind when the SF intensity increases. This component has low density thus inefficient in radiating X-ray. On the other hand, most of the enhanced X-ray emission could be attributed to the cool-hot gas interaction. It is natural to assume that the strength of cool-hot gas interaction depend on the amount of cool gas and how well it mixes with the hot gas. Jo et al. (2018) reports the positive correlations between the SF intensity and the scale height of extraplanar H and UV with 38 nearby edge-on, late-type galaxies. They suggested that the extraplanar dust and cool gas traced by UV and H, respectively, become thicker with the higher SF intensity. This projected envelope of cool gas most likely represents an inter-mixing with the extended hot corona and enhances X-ray emission via cool-hot gas interaction.
The vertical extension of cool gas (, McCormick et al. 2013; Jo et al. 2018) is typically much smaller than of the hot gas in our sample. Therefore, with increasing SF intensity, the vertical distribution of X-ray emission, strongly enhanced by cool-hot gas interaction close to the disk, becomes significantly steeper, resulting in smaller and (Figure 5a,b), as well as lower and ratios (Figure 6a,b). On the other hand, shows clearly different dependence on from and , with no significant correlation (Figure 5c). This difference apparently indicates that traces another X-ray emitting component which is extended but not directly related to cool-hot gas interaction. We speculate that this component is the extended thermal plasma which is likely blew out by the large scale galactic outflow. The outflow could be very tenuous and extended (up to , e.g. Strickland & Stevens 2000; Tang et al. 2009; Tripp et al. 2011) so the measured size of it in is determined by the sensitivity of the observations, instead of its intrinsic properties.
The diffuse X-ray morphology of galaxies may be further affected by the presence of AGN and the ICM. The presence of AGN may further increase the scatter of the relations. We mark all the galaxies with identified AGN with red-color symbols to show such scatters. The X-ray morphology of clustered galaxies may be highly affected by the presence of the dense ICM. The anti-correlations of field galaxies shown in Figure 5 and Figure 6 appear to be much tighter than those of the clustered ones (see Section 3 for details), which confirms that the relations between the X-ray morphology of the extraplanar emission and the SF intensity found in this paper is indeed due to internal instead of environmental processes.
5. summary
X-ray emission of the hot galactic corona provides rich information on processes that impact galaxy formation and evolution. In this work, we study a sample of 51 nearby, edge-on, disk galaxies. Specifically, we focus on the correlations between the diffuse soft X-ray morphology obtained from Chandra , and the SF intensity obtained from WISE. Our main results are summarized as follows:
(1) We calculate the SFR and the of sample galaxies from WISE galaxy images and obtain the characteristic radius and of galaxies in WISE four bands. We also calculate the inclination angle of each galaxy by fitting the ellipticity of its stellar disk. We further characterize the vertical extension of the extraplanar emission with a few parameters (, , and ) defined with the X-ray intensity profile of each galaxy.
(2) We find that the single exponential model brings in significant bias in describing the vertical distribution of the X-ray emission of our sample galaxy. The vertical extension of the extraplanar emission characterized with or and the vertical concentration characterized with or are both tightly anti-correlated with the SF intensity. However, we do not find any correlation between and the SF intensity.
(3) We also find tighter correlations of and relations for field galaxies, and no significant difference in the tightness of correlation among the other sub-samples.
Our findings suggest that there are likely two components for a typical corona: the concentrated corona mainly produced by cool/hot gas interaction, and a more extended corona which should contain a significant fraction of energy and mass but disproportionally low X-ray emission.
Acknowledgements
This work is supported by the National Key R&D Program of China No. 2017YFA0402600, the Fundamental Research Funds for the Central Universities at Xiamen University under grant No. 20720190115, and NSFC grants No. 11525312, 11333004, 11443009, U1531130, and 11333004. T.F. is also supported by the Specialized Research Fund for the Doctoral Program of Higher Education (SRFDP; No. 20130121110009).
This publication makes use of data products from the Wide-field Infrared Survey Explorer, which is a joint project of the University of California, Los Angeles, and the Jet Propulsion Laboratory/California Institute of Technology, funded by the National Aeronautics and Space Administration.
| Number | Name | ||||||||
|---|---|---|---|---|---|---|---|---|---|
| (arcsec) | (arcsec) | (arcsec) | (arcsec) | (arcsec) | (arcsec) | (arcsec) | (arcsec) | ||
| (1) | (2) | (3) | (4) | (5) | (6) | (7) | (8) | (9) | |
| 1 | IC2560 | ||||||||
| 2 | NGC24 | ||||||||
| 3 | NGC520 | ||||||||
| 4 | NGC660 | ||||||||
| 5 | NGC891 | ||||||||
| 6 | NGC1023 | ||||||||
| 7 | NGC1380 | ||||||||
| 8 | NGC1386 | ||||||||
| 9 | NGC1482 | ||||||||
| 10 | NGC1808 | ||||||||
| 11 | NGC2787 | ||||||||
| 12 | NGC2841 | ||||||||
| 13 | NGC3079 | ||||||||
| 14 | NGC3115 | ||||||||
| 15 | NGC3198 | ||||||||
| 16 | NGC3384 | ||||||||
| 17 | NGC3412 | ||||||||
| 18 | NGC3521 | ||||||||
| 19 | NGC3556 | ||||||||
| 20 | NGC3628 | ||||||||
| 21 | NGC3877 | ||||||||
| 22 | NGC3955 | ||||||||
| 23 | NGC3957 | ||||||||
| 24 | NGC4013 | ||||||||
| 25 | NGC4111 | ||||||||
| 26 | NGC4217 | ||||||||
| 27 | NGC4244 | ||||||||
| 28 | NGC4251 | ||||||||
| 29 | NGC4388 | ||||||||
| 30 | NGC4438 | ||||||||
| 31 | NGC4501 | ||||||||
| 32 | NGC4526 | ||||||||
| 33 | NGC4565 | ||||||||
| 34 | NGC4569 | ||||||||
| 35 | NGC4594 | ||||||||
| 36 | NGC4631 | ||||||||
| 37 | NGC4666 | ||||||||
| 38 | NGC4710 | ||||||||
| 39 | NGC5102 | ||||||||
| 40 | NGC5170 | ||||||||
| 41 | NGC5253 | ||||||||
| 42 | NGC5422 | ||||||||
| 43 | NGC5746 | ||||||||
| 44 | NGC5775 | ||||||||
| 45 | NGC5866 | ||||||||
| 46 | NGC6503 | ||||||||
| 47 | NGC6764 | ||||||||
| 48 | NGC7090 | ||||||||
| 49 | NGC7457 | ||||||||
| 50 | NGC7582 | ||||||||
| 51 | NGC7814 |
Note. — 1–8: The radii enclosed 50% and 90% of the total luminosity for WISE each band. 9: The inclination angle obtained from the disk fitting (1 error is 0.01)
| Name | ||||||||
|---|---|---|---|---|---|---|---|---|
| (Jy) | (Jy) | (Jy) | (Jy) | () | () | |||
| (1) | (2) | (3) | (4) | (5) | (6) | (7) | (8) | |
| IC2560 | ||||||||
| NGC24 | ||||||||
| NGC520 | ||||||||
| NGC660 | ||||||||
| NGC891 | ||||||||
| NGC1023 | ||||||||
| NGC1380 | ||||||||
| NGC1386 | ||||||||
| NGC1482 | ||||||||
| NGC1808 | ||||||||
| NGC2787 | ||||||||
| NGC2841 | ||||||||
| NGC3079 | ||||||||
| NGC3115 | ||||||||
| NGC3198 | ||||||||
| NGC3384 | ||||||||
| NGC3412 | ||||||||
| NGC3521 | ||||||||
| NGC3556 | ||||||||
| NGC3628 | ||||||||
| NGC3877 | ||||||||
| NGC3955 | ||||||||
| NGC3957 | ||||||||
| NGC4013 | ||||||||
| NGC4111 | ||||||||
| NGC4217 | ||||||||
| NGC4244 | ||||||||
| NGC4251 | ||||||||
| NGC4388 | ||||||||
| NGC4438 | ||||||||
| NGC4501 | ||||||||
| NGC4526 | ||||||||
| NGC4565 | ||||||||
| NGC4569 | ||||||||
| NGC4594 | ||||||||
| NGC4631 | ||||||||
| NGC4666 | ||||||||
| NGC4710 | ||||||||
| NGC5102a | ||||||||
| NGC5170 | ||||||||
| NGC5253 | ||||||||
| NGC5422 | ||||||||
| NGC5746 | ||||||||
| NGC5775 | ||||||||
| NGC5866 | ||||||||
| NGC6503 | ||||||||
| NGC6764 | ||||||||
| NGC7090 | ||||||||
| NGC7457 | ||||||||
| NGC7582 | ||||||||
| NGC7814 |
| Name | i | |||||||
|---|---|---|---|---|---|---|---|---|
| (kpc) | (kpc) | (kpc) | (kpc) | (kpc) | (kpc) | (degree) | ||
| (1) | (2) | (3) | (4) | (5) | (6) | (7) | (8) | |
| IC2560 | 62.89 | |||||||
| NGC0024 | — | |||||||
| NGC0520 | 59.01 | |||||||
| NGC0660 | 69.51 | |||||||
| NGC0891 | 85.75 | |||||||
| NGC1023 | — | — | 68.78 | |||||
| NGC1380 | 57.73 | |||||||
| NGC1386 | 64.47 | |||||||
| NGC1482 | 51.75 | |||||||
| NGC1808 | 66.18 | |||||||
| NGC2787 | 49.38 | |||||||
| NGC2841 | 64.14 | |||||||
| NGC3079 | 77.67 | |||||||
| NGC3115 | — | — | 76.14 | |||||
| NGC3198 | — | — | 68.89 | |||||
| NGC3384 | 58.41 | |||||||
| NGC3412 | 55.18 | |||||||
| NGC3521 | 63.45 | |||||||
| NGC3556 | — | 77.69 | ||||||
| NGC3628 | 81.46 | |||||||
| NGC3877 | — | — | 76.52 | |||||
| NGC3955 | 69.45 | |||||||
| NGC3957 | 73.29 | |||||||
| NGC4013 | — | 81.27 | ||||||
| NGC4111 | 76.35 | |||||||
| NGC4217 | — | 82.05 | ||||||
| NGC4244 | — | — | 81.82 | |||||
| NGC4251 | — | — | 62.84 | |||||
| NGC4388 | 71.86 | |||||||
| NGC4438 | 61.05 | |||||||
| NGC4501 | 61.21 | |||||||
| NGC4526 | — | 70.51 | ||||||
| NGC4565 | 84.95 | |||||||
| NGC4569 | 67.98 | |||||||
| NGC4594 | 80.76 | |||||||
| NGC4631 | 79.27 | |||||||
| NGC4666 | 75.66 | |||||||
| NGC4710 | 76.37 | |||||||
| NGC5102 | — | 67.35 | ||||||
| NGC5170 | — | — | 83.85 | |||||
| NGC5253 | — | — | 57.43 | |||||
| NGC5422 | — | 75.97 | ||||||
| NGC5746 | 82.46 | |||||||
| NGC5775 | 80.13 | |||||||
| NGC5866 | 65.92 | |||||||
| NGC6503 | 71.05 | |||||||
| NGC6764 | 63.18 | |||||||
| NGC7090 | — | — | 79.42 | |||||
| NGC7457 | 56.66 | |||||||
| NGC7582 | 71.49 | |||||||
| NGC7814 | 65.14 |
Note. — X-ray corona parameters: (1) The total luminosity of corona retrieve from Li & Wang 2013b (27) show the vertical radiuses enclosed 50%, 75% and 95% 0.51.5 keV luminosity along positive and negative sides (“+” and “-”) of galactic disk. (8) show the inclination angle of sample galaxies
References
- Agertz & Kravtsov (2015) Agertz, O., & Kravtsov, A. V. 2015, ApJ, 804, 18
- Bogdán et al. (2012) Bogdán, Á., Forman, W. R., Kraft, R. P., et al. 2012, The Astrophysical Journal, 755, 25
- Bower et al. (2012) Bower, R. G., Benson, A. J., & Crain, R. A. 2012, MNRAS, 422, 2816
- Branch & Tammann (1992) Branch, D., & Tammann, G. A. 1992, ARA&A, 30, 359
- Bregman et al. (2018) Bregman, J. N., Anderson, M. E., Miller, M. J., et al. 2018, The Astrophysical Journal, 862, 3
- Canizares et al. (1987) Canizares, C. R., Fabbiano, G., & Trinchieri, G. 1987, The Astrophysical Journal, 312, 503
- Cen et al. (1994) Cen, R., Miralda-Escudé, J., Ostriker, J. P., & Rauch, M. 1994, ApJ, 437, L9
- Croston et al. (2008) Croston, J., Hardcastle, M., Kharb, P., Kraft, R., & Hota, A. 2008, The Astrophysical Journal, 688, 190
- Davé (2008) Davé, R. 2008, Monthly Notices of the Royal Astronomical Society, 385, 147
- Davé et al. (2011) Davé, R., Finlator, K., & Oppenheimer, B. D. 2011, Monthly Notices of the Royal Astronomical Society, 416, 1354
- Dickey & Lockman (1990) Dickey, J. M., & Lockman, F. J. 1990, ARA&A, 28, 215
- Erwin (2015) Erwin, P. 2015, ApJ, 799, 226
- Fabian (2012) Fabian, A. 2012, Annual Review of Astronomy and Astrophysics, 50, 455
- Fang et al. (2015) Fang, T., Buote, D., Bullock, J., & Ma, R. 2015, ApJS, 217, 21
- Fang et al. (2002) Fang, T., Marshall, H. L., Lee, J. C., Davis, D. S., & Canizares, C. R. 2002, ApJ, 572, L127
- Forbes et al. (2016) Forbes, D. A., Alabi, A., Romanowsky, A. J., et al. 2016, Monthly Notices of the Royal Astronomical Society: Letters, 464, L26
- Forman et al. (1985) Forman, W., Jones, C., & Tucker, W. 1985, The Astrophysical Journal, 293, 102
- Freedman et al. (2001) Freedman, W. L., Madore, B. F., Gibson, B. K., et al. 2001, ApJ, 553, 47
- Fukazawa et al. (2006) Fukazawa, Y., Botoya-Nonesa, J. G., Pu, J., Ohto, A., & Kawano, N. 2006, ApJ, 636, 698
- Fukugita & Peebles (2006) Fukugita, M., & Peebles, P. 2006, The Astrophysical Journal, 639, 590
- Fullmer & Londsdale (1989) Fullmer, L., & Londsdale, C. J. 1989, Cataloged galaxies and quasars observed in the IRAS survey
- Grimes et al. (2005) Grimes, J. P., Heckman, T., Strickland, D., & Ptak, A. 2005, ApJ, 628, 187
- Helsdon et al. (2001) Helsdon, S. F., Ponman, T. J., O’Sullivan, E., & Forbes, D. A. 2001, Monthly Notices of the Royal Astronomical Society, 325, 693
- Henley & Shelton (2015) Henley, D. B., & Shelton, R. L. 2015, Astrophysical Journal, 808
- Hernquist et al. (1996) Hernquist, L., Katz, N., Weinberg, D. H., & Miralda-Escudé, J. 1996, ApJ, 457, L51
- Hopkins et al. (2014) Hopkins, P. F., Kereš, D., Oñorbe, J., et al. 2014, MNRAS, 445, 581
- Hota & Saikia (2006) Hota, A., & Saikia, D. 2006, Monthly Notices of the Royal Astronomical Society, 371, 945
- Jarrett et al. (2012) Jarrett, T., Masci, F., Tsai, C., et al. 2012, The Astronomical Journal, 145, 6
- Jarrett et al. (2011) Jarrett, T. H., Cohen, M., Masci, F., et al. 2011, ApJ, 735, 112
- Jarrett et al. (2013) Jarrett, T. H., Masci, F., Tsai, C. W., et al. 2013, AJ, 145, 6
- Jo et al. (2018) Jo, Y.-S., il Seon, K., Shinn, J.-H., et al. 2018, The Astrophysical Journal, 862, 25
- Keeney et al. (2017) Keeney, B. A., Stocke, J. T., Danforth, C. W., et al. 2017, ApJS, 230, 6
- Keller et al. (2015) Keller, B. W., Wadsley, J., & Couchman, H. M. P. 2015, MNRAS, 453, 3499
- Kennicutt (1998) Kennicutt, Jr., R. C. 1998, ARA&A, 36, 189
- Kereš et al. (2005) Kereš, D., Katz, N., Weinberg, D. H., & Davé, R. 2005, Monthly Notices of the Royal Astronomical Society, 363, 2
- Kim & Fabbiano (2013) Kim, D.-W., & Fabbiano, G. 2013, The Astrophysical Journal, 776, 116
- Konami et al. (2011) Konami, S., Matsushita, K., Tsuru, T. G., Gandhi, P., & Tamagawa, T. 2011, PASJ, 63, S913
- Krause et al. (2018) Krause, M., Irwin, J., Wiegert, T., et al. 2018, A&A, 611, A72
- Lallement (2004) Lallement, R. 2004, Astronomy & Astrophysics, 422, 391
- Landsman (1993) Landsman, W. B. 1993, in Astronomical Society of the Pacific Conference Series, Vol. 52, Astronomical Data Analysis Software and Systems II, ed. R. J. Hanisch, R. J. V. Brissenden, & J. Barnes, 246
- Lee et al. (1993) Lee, M. G., Freedman, W. L., & Madore, B. F. 1993, ApJ, 417, 553
- Li et al. (2008) Li, J.-T., Li, Z., Wang, Q. D., Irwin, J. A., & Rossa, J. 2008, Monthly Notices of the Royal Astronomical Society, 390, 59
- Li & Wang (2013a) Li, J.-T., & Wang, Q. D. 2013a, MNRAS, 428, 2085
- Li & Wang (2013b) —. 2013b, MNRAS, 435, 3071
- Li et al. (2011) Li, J.-T., Wang, Q. D., Li, Z., & Chen, Y. 2011, The Astrophysical Journal, 737, 41
- Liu et al. (2011) Liu, J., Mao, S., & Wang, Q. D. 2011, Monthly Notices of the Royal Astronomical Society: Letters, 415, 64
- Liu et al. (2012) Liu, J., Wang, Q. D., & Mao, S. 2012, Monthly Notices of the Royal Astronomical Society, 420, 3389
- Martin et al. (2002) Martin, C. L., Kobulnicky, H. A., & Heckman, T. M. 2002, ApJ, 574, 663
- Mathews & Brighenti (2003) Mathews, W. G., & Brighenti, F. 2003, Annual Review of Astronomy and Astrophysics, 41, 191
- McCormick et al. (2013) McCormick, A., Veilleux, S., & Rupke, D. S. 2013, The Astrophysical Journal, 774, 126
- Ménard et al. (2010) Ménard, B., Kilbinger, M., & Scranton, R. 2010, MNRAS, 406, 1815
- Mewe et al. (1985) Mewe, R., Gronenschild, E., & Van den Oord, G. 1985, Astronomy and Astrophysics supplement series, 62, 197
- Miralda-Escudé et al. (1996) Miralda-Escudé, J., Cen, R., Ostriker, J. P., & Rauch, M. 1996, ApJ, 471, 582
- Mitra et al. (2015) Mitra, S., Davé, R., & Finlator, K. 2015, MNRAS, 452, 1184
- Nicastro et al. (2002) Nicastro, F., Zezas, A., Drake, J., et al. 2002, ApJ, 573, 157
- Oh et al. (2008) Oh, S.-H., de Blok, W. J. G., Walter, F., Brinks, E., & Kennicutt, Jr., R. C. 2008, AJ, 136, 2761
- O’Sullivan et al. (2003) O’Sullivan, E., Ponman, T. J., & Collins, R. S. 2003, MNRAS, 340, 1375
- Pahre et al. (2004) Pahre, M. A., Ashby, M. L. N., Fazio, G. G., & Willner, S. P. 2004, ApJS, 154, 229
- Prochaska et al. (2017) Prochaska, J. X., Werk, J. K., Worseck, G., et al. 2017, ApJ, 837, 169
- Rasmussen et al. (2003) Rasmussen, A., Kahn, S. M., & Paerels, F. 2003, in Astrophysics and Space Science Library, Vol. 281, The IGM/Galaxy Connection. The Distribution of Baryons at z=0, ed. J. L. Rosenberg & M. E. Putman, 109
- Rice et al. (1988) Rice, W., Lonsdale, C. J., Soifer, B. T., et al. 1988, ApJS, 68, 91
- Sersic (1968) Sersic, J. L. 1968, Atlas de Galaxias Australes
- Stocke et al. (2013) Stocke, J. T., Keeney, B. A., Danforth, C. W., et al. 2013, ApJ, 763, 148
- Strickland & Heckman (2007) Strickland, D. K., & Heckman, T. M. 2007, The Astrophysical Journal, 658, 258
- Strickland & Heckman (2009) —. 2009, ApJ, 697, 2030
- Strickland et al. (2004) Strickland, D. K., Heckman, T. M., Colbert, E. J. M., Hoopes, C. G., & Weaver, K. A. 2004, ApJS, 151, 193
- Strickland et al. (2000) Strickland, D. K., Heckman, T. M., Weaver, K. A., & Dahlem, M. 2000, AJ, 120, 2965
- Strickland et al. (2002) Strickland, D. K., Heckman, T. M., Weaver, K. A., Hoopes, C. G., & Dahlem, M. 2002, The Astrophysical Journal, 568, 689
- Strickland & Stevens (2000) Strickland, D. K., & Stevens, I. R. 2000, Monthly Notices of the Royal Astronomical Society, 314, 511
- Tang et al. (2009) Tang, S., Wang, Q. D., Mac Low, M.-M., & Joung, M. R. 2009, Monthly Notices of the Royal Astronomical Society, 398, 1468
- Tonry et al. (2001) Tonry, J. L., Dressler, A., Blakeslee, J. P., et al. 2001, ApJ, 546, 681
- Tripp et al. (2011) Tripp, T. M., Meiring, J. D., Prochaska, J. X., et al. 2011, Science, 334, 952
- Tüllmann et al. (2006) Tüllmann, R., Breitschwerdt, D., Rossa, J., Pietsch, W., & Dettmar, R.-J. 2006, A&A, 457, 779
- Tully (1988) Tully, R. B. 1988, Nearby galaxies catalog
- Tully & Fisher (1977) Tully, R. B., & Fisher, J. R. 1977, A&A, 54, 661
- Tumlinson et al. (2011) Tumlinson, J., Thom, C., Werk, J. K., et al. 2011, Science, 334, 948
- Tumlinson et al. (2013) —. 2013, ApJ, 777, 59
- Véron-Cetty & Véron (2006) Véron-Cetty, M.-P., & Véron, P. 2006, Astronomy & Astrophysics, 455, 773
- Wang (2010) Wang, Q. D. 2010, Proceedings of the National Academy of Science, 107, 7168
- Wang et al. (2001) Wang, Q. D., Immler, S., Walterbos, R., Lauroesch, J. T., & Breitschwerdt, D. 2001, ApJ, 555, L99
- Wang et al. (2016) Wang, Q. D., Li, J., Jiang, X., & Fang, T. 2016, MNRAS, 457, 1385
- Werk et al. (2014) Werk, J. K., Prochaska, J. X., Tumlinson, J., et al. 2014, ApJ, 792, 8
- Werk et al. (2016) Werk, J. K., Prochaska, J. X., Cantalupo, S., et al. 2016, ApJ, 833, 54
- White & Frenk (1991) White, S. D., & Frenk, C. S. 1991, The Astrophysical Journal, 379, 52
- White & Rees (1978) White, S. D., & Rees, M. J. 1978, Monthly Notices of the Royal Astronomical Society, 183, 341
- Wiegert et al. (2015) Wiegert, T., Irwin, J., Miskolczi, A., et al. 2015, AJ, 150, 81
- Wright et al. (2010) Wright, E. L., Eisenhardt, P. R. M., Mainzer, A. K., et al. 2010, AJ, 140, 1868
- Yamasaki et al. (2009) Yamasaki, N. Y., Sato, K., Mitsuishi, I., & Ohashi, T. 2009, PASJ, 61, S291
- Zhang et al. (2014) Zhang, D., Thompson, T. A., Murray, N., & Quataert, E. 2014, Astrophysical Journal, 784, arXiv:1310.1099
- Zhang & Zaritsky (2017) Zhang, H., & Zaritsky, D. 2017, Nature Astronomy, 1, 0103
- Zhang et al. (2016) Zhang, H., Zaritsky, D., Zhu, G., Ménard, B., & Hogg, D. W. 2016, ApJ, 833, 276
- Zhang et al. (1995) Zhang, Y., Anninos, P., & Norman, M. L. 1995, ApJ, 453, L57