Masking Salient Object Detection, a Mask Region-based Convolutional Neural Network Analysis for Segmentation of Salient Objects
Abstract
In this paper, we propose a broad comparison between Fully Convolutional Networks (FCNs) and Mask Region-based Convolutional Neural Networks (Mask-RCNNs) applied in the Salient Object Detection (SOD) context. Studies in the SOD literature usually explore architectures based in FCNs to detect salient regions and objects in visual scenes. However, besides the promising results achieved, FCNs showed issues in some challenging scenarios. Fairly recently studies in the SOD literature proposed the use of a Mask-RCNN approach to overcome such issues. However, there is no extensive comparison between the two networks in the SOD literature endorsing the effectiveness of Mask-RCNNs over FCN when segmenting salient objects. Aiming to effectively show the superiority of Mask-RCNNs over FCNs in the SOD context, we compare two variations of Mask-RCNNs with two variations of FCNs in eight datasets widely used in the literature and in four metrics. Our findings show that in this context Mask-RCNNs achieved an improvement on the F-measure up to 47% over FCNs.
I Introduction
Visual Salience (or Visual Saliency) is the characteristic of some objects or regions in images to stand out from their surrounding elements, attracting the attention of the human visual system [1]. Finding Visual Saliences has a wide range of applications in Computer Vision and Image Processing tasks like detecting, recognizing and tracking objects, image cropping, image resizing, and video compression or summarization [2, 3]. In the robotics field, finding salience regions in images can be used to improve algorithms of location and mapping of environments [4] and object localization [5, 6]. The Salient Object Detection (SOD) research field aims to detect and segment the regions in images with the high probability of being salient.
Recent works in SOD literature [7, 8, 9, 10, 3, 11, 12, 13, 14, 15] proposes the use of architectures based on the Fully Convolutional Network (FCN) proposed by Long et al. [16]. However, despite the promising results achieved by FCNs, there are relevant inaccuracies in the segmentation result, as presented in Fig. 1. Trying to solve similar problems, Nguyen et al. [17] fairly recently proposed the use of a Mask Region-based Convolutional Neural Network (Mask-RCNN) [18] approach to SOD. However an extensive comparison between the FCN and the Mask-RCNN was not performed.

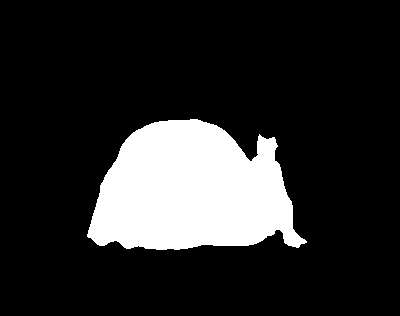
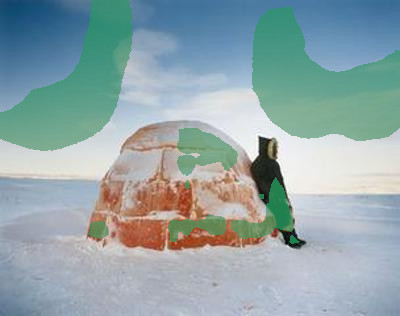
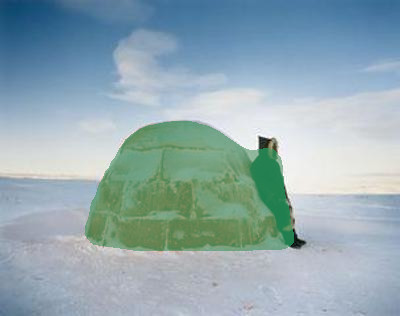
Taking in mind the shallow evaluation between the FCN and the Mask-RCNN available in the literature, in this work we propose a broad evaluation between the two early mentioned segmentation approaches. To perform the evaluation we propose four SOD approaches, two based on Mask-RCNN, and another two based on FCN. The comparison was made in eight well-known SOD datasets, by using the F-measure, Precision, Recall and Mean Absolute Error (MAE) metrics. The obtained results show the superiority of the Mask-RCNN over the FCN approaches from up to 47% of F-measure.
II Related Works
The approaches proposed in the SOD literature can be divided into three waves [19]: handcrafted-based, Convolutional Neural Network (CNN)-based [20], and FCN-based methods. The first attempts to find saliency regions in images were based on handcrafted features and addressed the problem through heuristics to find the saliency regions and traditional Computer Vision techniques to perform the segmentation of the saliency regions.
One of the earliest studies presented in the SOD literature was proposed by Itti et al. [21] in 1998 and started a wave of works on the subject. In the proposed method, a center-surrounding technique is utilized to extract information of color, intensity, and orientation from images. In the last step, they generate a set of feature maps for each extracted feature, which are combined to generate the Saliency Map.
Achanta et al. [22] extracted patches from the images to generate a feature vector of color and luminance. Then, a window surrounding approach is applied to calculate the difference of contrast between each pixel and its neighbors. Jiang et al. [23] combined context and shape information from the image to produce the Saliency Map. In the context extraction step, the image is segmented in super-pixels, and the saliency of a determined super-pixel is calculated as a function of its spatial neighbors. In the shape extraction step, they use an edge detector algorithm to find the contours of the objects.
Despite the promising results achieved by the handcrafted based methods, they lacked generalization capacity, causing decay in the algorithm performance in challenging scenarios. In order to overcome such limitations, CNN, an approach already applied in other Computer Vision problems like object detection and image classification started to be widespread in the SOD literature. When the CNNs started to be applied in the SOD, the common strategy presented in the literature (decompose an input image in patches or super-pixels) continued to be used similarly to handcrafted approaches [19].
One of the earliest models based on CNNs was presented by He et al. [24] (SuperCNN) in 2015. The proposed method decomposed each super-pixel in two contrast sequences of color uniqueness and color distribution. Each sequence feeds a different CNN with 1D convolutions in parallel. Wang et al. applied the Faster Region-based Convolutional Neural Network (Faster-RCNN) [25] architecture to classify the super-pixels as being part of the saliency or background regions. Low-level features (contrast and backgroundness) and an edge-based propagation method are applied to refine the Saliency Map.
Fusing local-context information to detect high-frequency content and global-context information to suppress homogeneous regions through holistic contrast and color statistics from the entire image, is another approach explored by CNN-based methods [26]. An example is the work of Zhao et al. [27], that proposed a method with a Neural Network to find the global-context saliences (upper-branch) and another Neural Network to extract local-context saliences (lower-branch).
Recent studies in the SOD literature started to explore FCN [16], an improvement of the standard CNNs developed for Semantic Segmentation problems. The FCN performs a more accurate segmentation in a per-pixel level and overcomes problems caused by fully connected layers such as blurriness and incorrect predictions near the boundaries of salient objects in super-pixel based methods [19].
Zhang et al. [9] adapted the Residual Network (ResNet)-101 network to perform segmentation. In a second step, the Simple Linear Iterative Clustering (SLIC) algorithm is applied in the input image to generate super-pixels of three different scales. The Saliency Map produced by the FCN is utilized to assign a saliency value to each super-pixel. An energy minimization function is applied to refine the saliency value of each super-pixel. In the last step, the Saliency Maps at each scale are utilized, generating the final Saliency Map.
Tang et al. [10] constructed the Saliency Map by fusing the Saliency Map of a FCN with the Saliency Map of a CNN. The FCN performs a pixel-level segmentation while the CNN performs super-pixel level segmentation, generating two Saliency Maps, which are concatenated to generate the Saliency Map. Xi et al. [3] proposed an end-to-end network with three sequential steps. A VGG-16 network is utilized in the first step to extract feature maps. Three fully convolutional layers are added at the end of the VGG-16 in the second step to make a non-linear regression. In the last step, bicubic interpolation is applied to restore the size of the Saliency Map.
Hou et al. [11] proposed a top-down approach to combine low-level with high-level features. A modification of the Holistically-Nested Edge Detector (HED) [12] is utilized to adapt the VGG-16 network for edge and boundary detection of salient objects. The output of each block in the network is concatenated with the output of all previews blocks through the short connections, generating a segmentation mask for each block of the network. In the last step, they concatenated all segmentation masks with a weighted fusion layer.

Nguyen et al. [17] proposed a framework with two steps to segment salient objects. In the first step, they utilized FCNs to generate a Saliency Map, called explicit Saliency Map, that targets the human common sense of salient objects and focus in the learning of different objects previously defined as salient. In the second step, they utilized an approach based in super-pixels to generate a second Saliency Map, called implicit Saliency Map, that focus in the learning of salient objects not belonging to the list of salient objects defined in the first step. Then, they defined a function that fuses both Saliency Maps. In the first step, they utilized four variations of FCN and also applied a Mask-RCNN to generate the explicit Saliency Map. However, the authors did not performed an explicit comparison between the FCN and Mask-RCNN. They only compared the entire framework proposed, changing the network utilized to generate the first saliency map. This brief comparison was performed only in one dataset and the entire framework was evaluated only in three datasets.
III Evaluated Networks
III-A Fully Convolutional Network (FCN)
The FCN was designed by Long et al. [16] in 2015 to perform Semantic Segmentation. In a FCN, the fully connected layers of a CNN are converted in convolutional layers. Thus, the output of the network is a heatmap with dense prediction values. In the end, bilinear interpolation is applied to convert the heatmap in a segmented image with the same size of the input image.
Among the FCNs models proposed by Long et al. [16], the FCN-8 achieved better segmentation results and was utilized in our work. In the convolutional step of CNN, there is an information loss as the image goes deeper into the network and the FCN-8 attempt to recover information from the top layers of the network to help in the upsampling step.
In order to evaluate the FCN, we use the KittiSeg [28] open-source framework111https://github.com/MarvinTeichmann/KittiSeg, following Bezerra et al. [29], which converts two versions of ResNet, with 50 and 101 layers, in FCN-8. Fig. 2 presents the ResNet-50 and ResNet-101 converted to FCN-8 in the KittiSeg implementation. The ResNets are structure by a sequence of four building blocks, with each building block containing a sequence of residual blocks. The difference between each building block is the number of filters in the convolutional layers.
In the implementation utilized, the output of the last building block enters a convolutional and upsample layers, generating a feature map which is pixelwise added to the third building block. The resulting feature map suffers an upsample and is pixelwise added to the output of the second building block, generating a feature map which is upsampled to generate the final Saliency Map. The output of the second and third building blocks also suffers a convolution operation before being added to the feature map.
III-B Mask Region-based Convolutional Network (Mask-RCNN)
The Mask-RCNN was developed by Girshick et al. [18] for Instance Segmentation and is composed of two sub-networks: the Faster-RCNN to perform object detection and classification, and an FCN to perform object segmentation. So, the Mask-RCNN has three outputs: the classes of the objects in the image, the coordinates of the bounding boxes that surround these objects and the segmentation mask.
In order to evaluate the Mask-RCNN, we utilize the Object Detection API [30], an open-source framework 222https://github.com/tensorflow/models/tree/master/research/object_detection which converts two versions of ResNet, with 50 and 101 layers in Mask-RCNNs. The implementation proposed in the Object Detection API converts Faster-RCNNs by adding a segmentation module attached in parallel with the classification and detection outputs. Fig. 3 presents the ResNet-50 and ResNet-101 converted to Mask-RCNN in the Object Detection API implementation.
In the implementation utilized, the Mask-RCNN is structured as follows: three building blocks of the ResNet are utilized to generate a feature map. Then, a module called Region Proposal Network (RPN) is linked in the network to generate a set of region proposals in the image with a high probability of being objects. These regions enter the Region of Interest Alignment (RoIAlign) layer to generate feature maps with a fixed size.

The region proposals enter the last building block of the ResNet, generating a feature map which enters in two fully connected layers attached in parallel to perform the classification and to adjust the bounding boxes. Also in parallel, the feature map enter in a upsample layer followed by five convolutional layers to generate the Saliency Map.
IV Experiments
IV-A Datasets
In order to evaluate the network models, we trained the models on the MSRA10K [31] dataset and tested on eight public datasets of salient objects widely used in the SOD literature: DUT-OMRON [32], ECSSD [33], HKU-IS [34], ICOSEG [35], PASCAL-S [36], SED1 [37], SED2 [37], and THUR [38].
The datasets are composed by images containing salient objects with different biases (e.g., number of salient objects, image clutter, center-bias) and the referent ground-truth mask with the expected segmentation of the salient objects.
DUT-OMRON is a large dataset with 5,168 natural images with one or more salient objects and backgrounds relatively complex. ECSSD contains 1,000 images with a great variety of scenarios and complex backgrounds. HKU-IS contains 4,447 challenging images with low contrast or multi foreground objects. ICOSEG is an interactive co-segmentation dataset and contains 643 images with single or multiple salient objects for each image.
The PASCAL-S has 850 natural images with multiple complex objects and cluttered backgrounds and derives from the validation set of the PASCAL VOC 2012 segmentation challenge [39]. SED1 and SED2 are the smallest datasets, which contain only 100 images. The THUR dataset contains 6,232 images and is the unique dataset divided into classes, with a total of five classes (butterfly, coffee mug, dog jump, giraffe, and plane).
Among all SOD datasets utilized, the MSRA10K is the largest (10,000 images) and it is utilized to train the FCN and Mask-RCNN models in our work, following similar work in the literature [40, 10, 9, 7, 3, 8, 41, 13, 14]. In order to train the Mask-RCNN, it was necessary to generate the bounding boxes of each salient object in the images of the MSRA10K dataset.
IV-B Evaluation Metrics
The architecture models trained in the SOD problem are evaluated and compared through four metrics widely used in the SOD literature: Precision (Equation 1), Recall (Equation 2), F-measure (Equation 3), and MAE (Equation 4).
| (1) |
| (2) |
| (3) |
The in the F-measure formula changes the Precision and Recall importance. In the SOD literature, receives the value [37, 42, 31, 43] to increase the Precision importance.
The MAE formula is presented in Equation 4. The and are the image width and height, respectively. The is the predicted Saliency Map, and is the ground truth Saliency Map.
| (4) |
IV-C Experiments
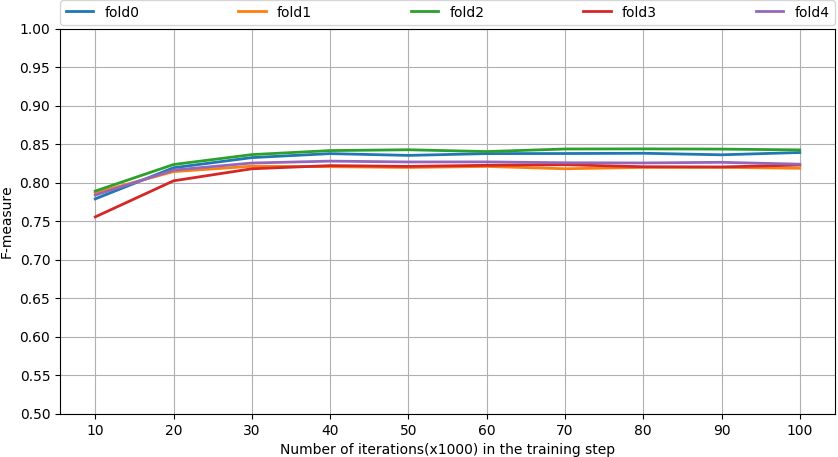
The networks evaluated in our work were validated through a K-fold strategy with equal to five. For each fold, the networks were trained with 100,000 iterations in the MSRA10K dataset. For each model evaluated, an initial learning rate was defined through preliminary experiments.
The ResNets 50 and 101 converted to FCN received an initial learning rate of and the ResNets 50 and 101 converted to Mask-RCNN received an initial learning rate of . An exponential learning rate decay, similar with the proposed in the literature [44], was utilized and for all networks, the initial learning rate is divided by 10 at the iteration 50,000 generating a learning rate that is divided by 10 again at the iteration 75,000.
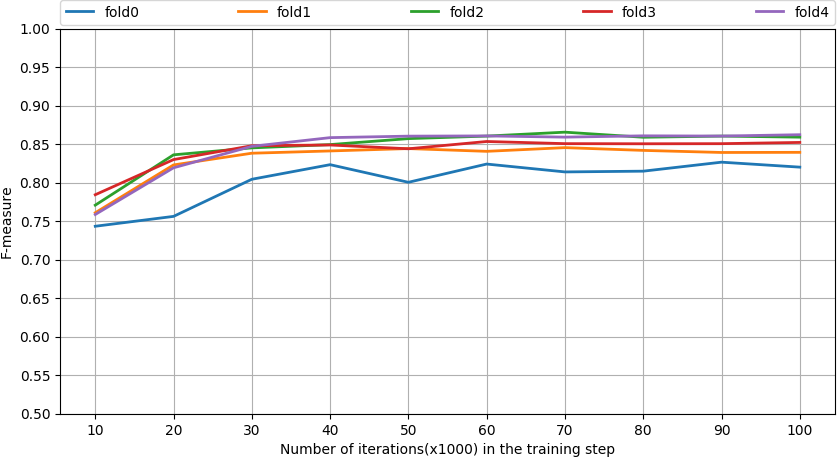
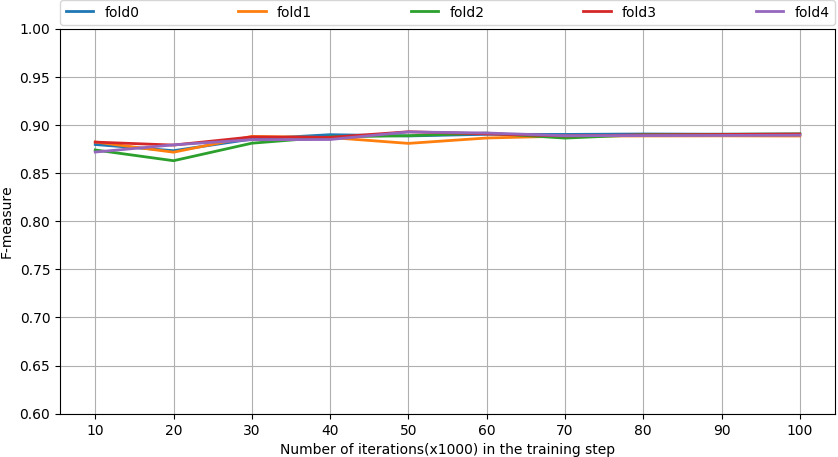
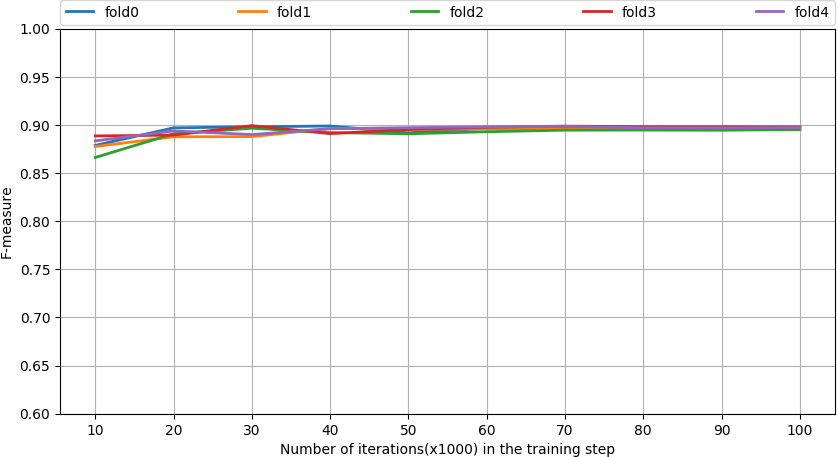
Fig. 4 presents the learning curves with the F-measures of each fold generated by the ResNet-50 and ResNet-101 converted to FCN and Mask-RCNN, respectively. After training the folds and choosing the best iteration to train each model, we trained each network model five times using the entire MSRA10K dataset and tested in eight public datasets widely utilized in the literature. Table I presents the average F-measure, Precision, Recall, and MAE achieved and the standard deviation of each model.
| Network | Metric | DUT-OMRON | ECSSD | HKU-IS | ICOSEG | PASCAL-S | SED1 | SED2 | THUR | ||||||||
| Avg | Std | Avg | Std | Avg | Std | Avg | Std | Avg | Std | Avg | Std | Avg | Std | Avg | Std | ||
| FCN ResNet-50 | F-measure Precision Recall MAE | 0.4999 0.6815 0.4411 0.1067 | 0.0163 0.0172 0.0355 0.0015 | 0.7902 0.8872 0.6975 0.0927 | 0.0102 0.0169 0.0411 0.0054 | 0.7618 0.8702 0.6659 0.0738 | 0.0098 0.0183 0.0377 0.0031 | 0.7488 0.8264 0.6926 0.0879 | 0.0100 0.0170 0.0477 0.0072 | 0.7141 0.8238 0.6466 0.1047 | 0.0082 0.0159 0.0330 0.0034 | 0.6410 0.8909 0.4971 0.1298 | 0.0263 0.0132 0.0372 0.0090 | 0.4083 0.8486 0.2646 0.1487 | 0.0265 0.0293 0.0230 0.0050 | 0.6178 0.6913 0.6499 0.0999 | 0.0107 0.0192 0.0499 0.0020 |
| Mask-RCNN ResNet-50 | F-measure Precision Recall MAE | 0.6964 0.7060 0.7646 0.0765 | 0.0023 0.0034 0.0039 0.0012 | 0.8383 0.8671 0.8137 0.0743 | 0.0022 0.0028 0.0040 0.0010 | 0.7979 0.8299 0.7781 0.0679 | 0.0017 0.0030 0.0054 0.0004 | 0.7495 0.7929 0.7356 0.0927 | 0.0019 0.0016 0.0038 0.0007 | 0.7850 0.8287 0.7722 0.0896 | 0.0017 0.0025 0.0048 0.0008 | 0.8861 0.9052 0.8644 0.0539 | 0.0051 0.0057 0.0044 0.0018 | 0.7873 0.8733 0.6813 0.0801 | 0.0081 0.0037 0.0095 0.0023 | 0.6680 0.6617 0.8014 0.0912 | 0.0019 0.0026 0.0041 0.0007 |
| FCN ResNet-101 | F-measure Precision Recall MAE | 0.4424 0.6410 0.3796 0.1078 | 0.0327 0.0484 0.0463 0.0080 | 0.7665 0.8970 0.6592 0.0949 | 0.0176 0.0222 0.0308 0.0044 | 0.7353 0.8658 0.6320 0.0757 | 0.0216 0.0323 0.0358 0.0044 | 0.6820 0.7694 0.6306 0.1080 | 0.0287 0.0612 0.0503 0.0097 | 0.6919 0.8174 0.6135 0.1070 | 0.0156 0.0322 0.0287 0.0042 | 0.5382 0.7879 0.4420 0.1527 | 0.0520 0.0683 0.0640 0.0075 | 0.3150 0.6299 0.2441 0.1862 | 0.0444 0.1203 0.0637 0.0227 | 0.5763 0.6581 0.6088 0.1021 | 0.0191 0.0487 0.0439 0.0077 |
| Mask-RCNN ResNet-101 | F-measure Precision Recall MAE | 0.7072 0.7166 0.7739 0.0739 | 0.0033 0.0051 0.0028 0.0013 | 0.8465 0.8712 0.8258 0.0694 | 0.0024 0.0028 0.0049 0.0007 | 0.8066 0.8384 0.7853 0.0653 | 0.0023 0.0042 0.0044 0.0005 | 0.7575 0.7974 0.7442 0.0886 | 0.0036 0.0044 0.0050 0.0013 | 0.7897 0.8347 0.7754 0.0872 | 0.0005 0.0024 0.0036 0.0006 | 0.9002 0.9200 0.8710 0.0480 | 0.0008 0.0020 0.0026 0.0004 | 0.7911 0.8745 0.6844 0.0812 | 0.0039 0.0052 0.0097 0.0014 | 0.6765 0.6650 0.8227 0.0880 | 0.0018 0.0030 0.0045 0.0007 |
As presented in Table I, the higher contribution of the Mask-RCNN was in the Recall, which indicates that the Mask-RCNN impressively reduced the false negative error, as shown in Fig. 1. With the ResNet-50 backbone, the Mask-RCNN overcame the FCN F-measure by 37.9% in the SED2, 24.51% in the SED1, and 19.65% in the DUT-OMRON datasets in the best cases and overcame the FCN F-measure by 0.07% in the ICOSEG dataset in the worst case. Also, with exception of the ICOSEG dataset, the Mask-RCNN achieved lower MAEs when compared with the FCN, both with ResNet-50 backbone. With the ResNet-101 backbone, the Mask-RCNN overcame the FCN F-measure by 7.13% in the HKU-IS dataset in the worst case. However, the Mask-RCNN overcame the FCN F-measure by 47.61% in the SED2, 36.20% in the SED1, and 26.48% in the DUT-OMRON datasets, both with ResNet-101 backbone. Also, the Mask-RCNN achieved lower MAEs in all datasets when compared with the FCN.
V Conclusion
In this work, we compared two versions of FCNs with two versions of Mask-RCNNs through extensive experiments on eight public datasets using four metrics (F-measure, Precision, Recall, and MAE). We have shown that the standard Mask-RCNNs with ResNets backbones outperforms the standard FCNs, with the same backbones, in the SOD problem. The RPN attached before the segmentation module in the Mask-RCNN improved the segmentation results by significantly decreasing the false negative error. Although, the Mask-RCNNs evaluated in this work are outperformed by state-of-art results [45] based on enhanced FCNs, further research enhancing the Mask-RCNNs in a similar way could provide competitive results. Our findings endorse that the Mask-RCNN is a promising alternative to solve the SOD problem.
ACKNOWLEDGMENT
The authors would like to thank the Coordination for the Improvement of Higher Education Personnel (CAPES) for the Masters scholarship. We gratefully acknowledge the founders of the publicly available datasets and the support of NVIDIA Corporation with the donation of the GPUs used for this research.
References
- [1] L. Itti, “Visual salience,” Scholarpedia, vol. 2, no. 9, p. 3327, 2007, revision #72776.
- [2] G. Lee, Y. Tai, and J. Kim, “Deep saliency with encoded low level distance map and high level features,” in 2016 IEEE Conference on Computer Vision and Pattern Recognition (CVPR), June 2016, pp. 660–668.
- [3] X. Xi, Y. Luo, F. Li, P. Wang, and H. Qiao, “A fast and compact saliency score regression network based on fully convolutional network,” CoRR, vol. abs/1702.00615, 2017.
- [4] E. Todt and C. Torras, “Outdoor landmark-view recognition based on bipartite-graph matching and logistic regression,” in Proceedings 2007 IEEE International Conference on Robotics and Automation, April 2007, pp. 4289–4294.
- [5] F. Orabona, G. Metta, and G. Sandini, “Object-based visual attention: a model for a behaving robot,” in 2005 IEEE Computer Society Conference on Computer Vision and Pattern Recognition (CVPR’05) - Workshops, Sep. 2005, pp. 89–89.
- [6] Y. Yu, G. K. I. Mann, and R. G. Gosine, “An object-based visual attention model for robotic applications,” IEEE Transactions on Systems, Man, and Cybernetics, Part B (Cybernetics), vol. 40, no. 5, pp. 1398–1412, Oct 2010.
- [7] X. Li, L. Zhao, L. Wei, M. Yang, F. Wu, Y. Zhuang, H. Ling, and J. Wang, “Deepsaliency: Multi-task deep neural network model for salient object detection,” IEEE Transactions on Image Processing, vol. 25, no. 8, pp. 3919–3930, Aug 2016.
- [8] Y. Tang, X. Wu, and W. Bu, “Deeply-supervised recurrent convolutional neural network for saliency detection,” in ACM Multimedia, 2016.
- [9] J. Zhang, Y. Dai, and F. Porikli, “Deep salient object detection by integrating multi-level cues,” in 2017 IEEE Winter Conference on Applications of Computer Vision (WACV), March 2017, pp. 1–10.
- [10] Y. Tang and X. Wu, “Saliency detection via combining region-level and pixel-level predictions with CNNs,” in ECCV, 2016.
- [11] Q. Hou, M. Cheng, X. Hu, A. Borji, Z. Tu, and P. H. S. Torr, “Deeply supervised salient object detection with short connections,” IEEE Transactions on Pattern Analysis and Machine Intelligence, pp. 1–1, 2018.
- [12] S. Xie and Z. Tu, “Holistically-nested edge detection,” International Journal of Computer Vision, vol. 125, no. 1, pp. 3–18, Dec 2017. [Online]. Available: https://doi.org/10.1007/s11263-017-1004-z
- [13] P. Zhang, W. Liu, H. Lu, and C. Shen, “Salient object detection by lossless feature reflection,” in IJCAI, 2018.
- [14] ——, “Salient object detection with lossless feature reflection and weighted structural loss,” IEEE Transactions on Image Processing, vol. PP, pp. 1–1, 01 2019.
- [15] G. Li, Y. Xie, and L. Lin, “Weakly supervised salient object detection using image labels,” in AAAI, 2018.
- [16] J. Long, E. Shelhamer, and T. Darrell, “Fully convolutional networks for semantic segmentation,” in 2015 IEEE Conference on Computer Vision and Pattern Recognition (CVPR), June 2015, pp. 3431–3440.
- [17] T. V. Nguyen, K. Nguyen, and T. Do, “Semantic prior analysis for salient object detection,” IEEE Transactions on Image Processing, vol. 28, no. 6, pp. 3130–3141, June 2019.
- [18] K. He, G. Gkioxari, P. Dollar, and R. Girshick, “Mask R-CNN,” in The IEEE International Conference on Computer Vision (ICCV), Oct 2017.
- [19] A. Borji, M.-M. Cheng, H. Jiang, and J. Li, “Salient object detection: A survey,” CoRR, vol. abs/1411.5878, 2014.
- [20] Y. Lecun, L. Bottou, Y. Bengio, and P. Haffner, “Gradient-based learning applied to document recognition,” in Proceedings of the IEEE, 1998, pp. 2278–2324.
- [21] L. Itti, C. Koch, and E. Niebur, “A model of saliency-based visual attention for rapid scene analysis,” IEEE Trans. Pattern Anal. Mach. Intell., vol. 20, no. 11, pp. 1254–1259, Nov. 1998. [Online]. Available: https://doi.org/10.1109/34.730558
- [22] R. Achanta, F. Estrada, P. Wils, and S. Süsstrunk, Salient Region Detection and Segmentation, ser. ICVS’08. Berlin, Heidelberg: Springer-Verlag, 2008, pp. 66–75. [Online]. Available: http://dl.acm.org/citation.cfm?id=1788524.1788532
- [23] Z. Y. T. L. Huaizu Jiang, Jingdong Wang and N. Zheng, “Automatic salient object segmentation based on context and shape prior,” in Proceedings of the British Machine Vision Conference. BMVA Press, 2011, pp. 110.1–110.12, http://dx.doi.org/10.5244/C.25.110.
- [24] S. He, R. W. H. Lau, W. Liu, Z. Huang, and Q. Yang, “Supercnn: A superpixelwise convolutional neural network for salient object detection,” International Journal of Computer Vision, vol. 115, no. 3, pp. 330–344, Dec 2015. [Online]. Available: https://doi.org/10.1007/s11263-015-0822-0
- [25] S. Ren, K. He, R. Girshick, and J. Sun, “Faster R-CNN: Towards real-time object detection with region proposal networks,” IEEE Transactions on Pattern Analysis and Machine Intelligence, vol. 39, no. 6, pp. 1137–1149, June 2017.
- [26] L. Wang, H. Lu, X. Ruan, and M.-H. Yang, “Deep networks for saliency detection via local estimation and global search,” 2015 IEEE Conference on Computer Vision and Pattern Recognition (CVPR), pp. 3183–3192, 2015.
- [27] R. Zhao, W. Ouyang, H. Li, and X. Wang, “Saliency detection by multi-context deep learning,” in IEEE Conference on Computer Vision and Pattern Recognition (CVPR), 2015.
- [28] M. Teichmann, M. Weber, J. M. Zöllner, R. Cipolla, and R. Urtasun, “Multinet: Real-time joint semantic reasoning for autonomous driving,” IEEE Intelligent Vehicles Symposium, pp. 1013–1020, 2018.
- [29] C. S. Bezerra, R. Laroca, D. R. Lucio, E. Severo, L. F. Oliveira, A. S. Britto Jr., and D. Menotti, “Robust iris segmentation based on fully convolutional networks and generative adversarial networks,” in Conference on Graphics, Patterns and Images, Oct 2018, pp. 281–288.
- [30] J. Huang, V. Rathod, C. Sun, M. Zhu, A. Korattikara, A. Fathi, I. Fischer, Z. Wojna, Y. Song, S. Guadarrama, and K. Murphy, “Speed/accuracy trade-offs for modern convolutional object detectors,” in 2017 IEEE Conference on Computer Vision and Pattern Recognition (CVPR), July 2017, pp. 3296–3297.
- [31] M.-M. Cheng, N. J. Mitra, X. Huang, P. H. S. Torr, and S.-M. Hu, “Global contrast based salient region detection,” IEEE TPAMI, vol. 37, no. 3, pp. 569–582, 2015.
- [32] C. Yang, L. Zhang, R. X. Lu, Huchuan, and M.-H. Yang, “Saliency detection via graph-based manifold ranking,” in Computer Vision and Pattern Recognition (CVPR), 2013 IEEE Conference on. IEEE, 2013, pp. 3166–3173.
- [33] J. Shi, Q. Yan, L. Xu, and J. Jia, “Hierarchical image saliency detection on extended cssd,” IEEE Transactions on Pattern Analysis and Machine Intelligence, vol. 38, no. 4, pp. 717–729, April 2016.
- [34] G. Li and Y. Yu, “Visual saliency based on multiscale deep features,” 2015 IEEE Conference on Computer Vision and Pattern Recognition (CVPR), pp. 5455–5463, 2015.
- [35] D. Batra, A. Kowdle, D. Parikh, J. Luo, and T. Chen, “iCoseg: Interactive co-segmentation with intelligent scribble guidance,” in IEEE Computer Society Conference on Computer Vision and Pattern Recognition, June 2010, pp. 3169–3176.
- [36] Y. Li, X. Hou, C. Koch, J. M. Rehg, and A. L. Yuille, “The secrets of salient object segmentation,” 2014 IEEE Conference on Computer Vision and Pattern Recognition, pp. 280–287, 2014.
- [37] A. Borji, M.-M. Cheng, H. Jiang, and J. Li, “Salient object detection: A benchmark,” IEEE TIP, vol. 24, no. 12, pp. 5706–5722, 2015.
- [38] M.-M. Cheng, N. Mitra, X. Huang, and S.-M. Hu, “Salientshape: group saliency in image collections,” The Visual Computer, vol. 30, no. 4, pp. 443–453, 2014.
- [39] M. Everingham, L. Van Gool, C. K. I. Williams, J. Winn, and A. Zisserman, “The PASCAL Visual Object Classes Challenge 2012 (VOC2012) Results,” http://www.pascal-network.org/challenges/VOC/voc2012/workshop/index.html.
- [40] G. Nie, Y. Guo, Y. Liu, and Y. Wang, “Real-time salient object detection based on fully convolutional networks,” in Advances in Image and Graphics Technologies, Y. Wang, S. Wang, Y. Liu, J. Yang, X. Yuan, R. He, and H. B.-L. Duh, Eds. Singapore: Springer Singapore, 2018, pp. 189–198.
- [41] S. S. Kruthiventi, V. Gudisa, J. H. Dholakiya, and R. Venkatesh Babu, “Saliency unified: A deep architecture for simultaneous eye fixation prediction and salient object segmentation,” in IEEE Conference on Computer Vision and Pattern Recognition, 2016.
- [42] R. Achanta, S. Hemami, F. Estrada, and S. Susstrunk, “Frequency-tuned salient region detection,” in IEEE Conference on Computer Vision and Pattern Recognition, June 2009, pp. 1597–1604.
- [43] F. Perazzi, P. Krähenbühl, Y. Pritch, and A. Hornung, “Saliency filters: Contrast based filtering for salient region detection,” in 2012 IEEE Conference on Computer Vision and Pattern Recognition, June 2012, pp. 733–740.
- [44] M. Z. Alom, T. M. Taha, C. Yakopcic, S. Westberg, M. Hasan, B. C Van Esesn, A. Awwal, and V. Asari, “The history began from alexnet: A comprehensive survey on deep learning approaches,” CoRR, 03 2018.
- [45] J.-J. Liu, Q. Hou, M.-M. Cheng, J. Feng, and J. Jiang, “A simple pooling-based design for real-time salient object detection,” in IEEE CVPR, 2019.