The Star Formation History and Dynamics of the Ultra-diffuse Galaxy Dragonfly 44 in MOND and MOG
Abstract
The observed line-of-sight velocity dispersion of the ultra diffuse galaxy Dragonfly 44 (DF44) requires a Newtonian dynamical mass-to-light ratio of Solar units. This is well outside the acceptable limits of our stellar population synthesis (SPS) models, which we construct using the integrated galactic initial mass function (IGIMF) theory. Assuming DF44 is in isolation and using Jeans analysis, we calculate profiles of DF44 in Milgromian dynamics (MOND) and modified gravity (MOG) theories without invoking dark matter. Comparing with the observed kinematics, the best-fitting MOND model has and a constant orbital anisotropy of . In MOG, we first fix its two theoretical parameters and based on previous fits to the observed rotation curve data of The HI Nearby Galaxy Survey (THINGS). The DF44 profile is best fit with , larger than plausible SPS values. MOG produces a profile for DF44 with acceptable and isotropic orbits if and are allowed to vary. MOND with the canonical can explain DF44 at the confidence level (1.66%) if considering both its observed kinematics and typical star formation histories in an IGIMF context. However, MOG is ruled out at (-value of ) if its free parameters are fixed at the highest values consistent with THINGS data.
1 Introduction
Ultra diffuse galaxies (UDGs, van Dokkum et al., 2015) are characterised by an extremely low surface brightness of mag arcsec-2, comparable to those of dwarf galaxies. But unlike dwarfs, UDGs have extended stellar distributions, sometimes with a size comparable to that of the Milky Way ( kpc).
van Dokkum et al. (2018) and van Dokkum et al. (2019a) previously reported the discovery of two ‘dark matter-free’ UDGs, NGC 1052-DF2 (DF2) and NGC 1052-DF4 (DF4), with line-of-sight velocity dispersions of km/s (Danieli et al., 2019) and km/s (van Dokkum et al., 2019b), respectively. In both cases, the upper limit to the halo mass is (van Dokkum et al., 2018, 2019a; Wasserman et al., 2018). They argue that the apparent lack of dark matter in DF2 and DF4 is in contrast to Dragonfly 44 (DF44), which is gravitationally dominated by dark matter (van Dokkum et al., 2016). This large apparent difference in dark matter content is surprising as DF2, DF4 and DF44 have a very similar stellar mass and morphology.
UDGs are also interesting systems for testing classical and alternative gravity theories such as Milgrom’s modified Newtonian dynamics (MOND, Milgrom, 1983a) or Moffat’s modified gravity (MOG, Moffat, 2005). UDGs generally experience internal accelerations below the characteristic MOND acceleration of . Therefore, MOND predicts a different than Newtonian dynamics in the absence of dark matter. In Kroupa et al. (2018) and Haghi et al. (2019), we calculated for the UDGs DF2 and DF4 using a new analytic formulation and fully self-consistent live -body models in MOND. We showed that the velocity dispersion calculated by taking into account the external field effect (EFE) from possible host galaxies leads to being well consistent with the observed values in both cases. The same conclusions are reached independently by Famaey et al. (2018).
The velocity dispersion profile of UDGs can also be modeled using the appropriate Jeans equation, from which one can derive the statistical properties of the velocity distribution of stars (Binney & Tremaine, 2008). This calculation requires knowledge of the gravitational potential and the stellar density distribution, in addition to some assumptions about the shape of the velocity distribution.
Taking to be a function of radius alone for eight MW dwarf spheroidal galaxies (dSphs) and using spherical Jeans analysis, Angus & McGaugh (2008) showed that most of them have a MOND dynamical ratio compatible with stellar population synthesis (SPS) models. Using Jeans analysis, Haghi & Amiri (2016) studied the internal dynamics of eight MW dSphs in the framework of the MOG theory. They showed that when letting the two MOG parameters and (Sec. 3.1) vary on a case by case basis, the best-fitted ratios for almost all dSphs are comparable with the SPS values. However, this eliminates the predictability of the theory.
In this contribution, we focus on DF44, a UDG in the Coma Cluster (van Dokkum et al., 2016; Di Cintio et al., 2017). Recently, van Dokkum et al. (2019b) obtained a revised mean line-of-sight velocity dispersion within its half-light radius of km/s and thus an estimated halo mass of . DF44 has a rising profile, from km/s at kpc to km/s at kpc, with no observed signs of rotation. They showed that this profile can only be fit with a standard halo if the velocity distribution has a strong tangential anisotropy (). A good fit also results from a dark matter halo with a relatively flat density profile (e.g. Di Cintio et al., 2014) and no orbital anisotropy (). van Dokkum et al. (2019b) also calculated the mass profile of DF44, finding a Newtonian dynamical mass-to-light ratio in the photometric band of Solar units within the effective radius of kpc. The reported is similar to other UDGs but higher than normal galaxies of the same luminosity.
Using then available data, Hodson & Zhao (2017) suggested that DF44 poses a problem for MOND, leading them to seek further modifications to the theory. The deep-MOND dynamical mass , meaning that underestimated measurement errors on can lead one to prematurely conclude against this highly non-linear theory.
Bílek et al. (2019) revisited the question of whether MOND can adequately explain the internal kinematics of DF44, taking into account the latest measurements. Assuming isotropy of the velocity dispersion tensor and , they found that MOND matches the observed in the central regions. The agreement is poorer in the outer regions, but the MOND prediction is still within 2 of the observations.
We use spatially resolved stellar kinematic data of DF44 to test MOND and MOG by solving the Jeans equation and determining the expected profile. Since its stars experience an orbital acceleration , there will be clear water between the Newtonian and Milgromian predictions. We will show that the dynamics of DF44 can be explained in the MOND alternative to dark matter using an acceptable stellar ratio without making further ad hoc modifications to MOND. The difference between our conclusions and those of Hodson & Zhao (2017) arise mainly from a subsequent downwards revision to (van Dokkum et al., 2019b).
Throughout this contribution we differentiate between the dynamical and stellar mass-to-light ratio in the photometric band, and , respectively, with the latter including stellar remnants. The gravity theory used to calculate should be clear from the context. If Newtonian gravitation without dark matter were correct, then the Newtonian . If Newtonian gravitation with dark matter in the galaxy were to be correct, then . If MOND is correct (taking into account the external field effect), then the MOND always. These statements hold for the case that tidal effects are not important.
Our paper is organized as follows based on photometry of DF44 and our understanding of stars, the stellar population synthesis (SPS) prediction for its ratio is presented in Sec. 2. After briefly reviewing the basics of the MOND and MOG theories and introducing the Jeans equation (Sec. 3), we present our results (Sec. 4). We then discuss our results in Sec. 5 and present our conclusions in Sec. 6.
2 SPS prediction for the ratio in the IGIMF context
We begin by discussing our SPS models, which we use to provide a gravity model-independent expectation for the ratio of DF44. With the correct gravity theory, this must be consistent with what we infer from our dynamical modeling (Sec. 4.2).
2.1 The galaxy-wide IMF
The stellar ratio depends on the age and metallicity of the stellar population and the stellar initial mass function (IMF), which in turn depends on the metallicity and star formation rate (SFR, Kroupa et al. 2013; Yan et al. 2017; Jeřábková et al. 2018; Zonoozi et al. 2019). In galactic environment studies, the stellar IMF is usually assumed to be invariant. But there are observational indications that the galaxy-wide IMF (gwIMF) may depend on the star formation environment (cloud density and metallicity), becoming top-heavy under extreme starburst conditions (Dabringhausen et al., 2009, 2010, 2012; Marks et al., 2012; Banerjee et al., 2012; Kroupa et al., 2013; Schneider et al., 2018; Kalari et al., 2018; Jeřábková et al., 2017). The data suggest that with increasing embedded cluster metallicity and decreasing density, the IMF becomes less top-heavy. Changes to the IMF have also been proposed to explain ratios estimated through integrated light analysis of globular clusters (GCs) in M31, which show an inverse trend with metallicity (Zonoozi et al., 2016; Haghi et al., 2017). Another argument supporting a systematic variation of the IMF is the fraction of low-mass X-ray binaries in Virgo GCs and ultra compact dwarf galaxies (Dabringhausen et al., 2012).
To quantify the gwIMF, Kroupa & Weidner (2003) formulated the integrated galaxy IMF (IGIMF) theory by assuming that all stars form in embedded clusters (Lada & Lada, 2003; Kroupa, 2005; Megeath et al., 2016) and adding the IMFs of all clusters which form in a star formation epoch. Based on the IGIMF theory, the gwIMF is top-light (deficit of massive stars) in low mass galaxies because they are expected to have a low SFR (Úbeda et al., 2007; Lee et al., 2009; Watts et al., 2018; Yan et al., 2017). The gwIMF is predicted to be more top-heavy in massive galaxies with a high SFR, as is observed (Hoversten & Glazebrook, 2008; Lee et al., 2009; Meurer et al., 2009; Habergham et al., 2010; Gunawardhana et al., 2011; Zhang et al., 2018; Hopkins, 2018).
There are also competing models based on the stochasticity of a universal gwIMF for the deficiency of high-mass stars in low-density regions, as suggested by deep observations of M83’s outskirts (Koda et al., 2012). The stochastic models however face the challenge of needing to account for the systematic shift with increasing SFR of the observationally deduced gwIMF being top-light for dwarf disk and top-heavy for massive disk galaxies (Lee et al., 2009; Gunawardhana et al., 2011). Old, dormant galaxies also indicate significant gwIMF variations at the low-mass end elliptical galaxies may be dominated by very low mass stars (van Dokkum & Conroy, 2010, 2011; Conroy et al., 2017), while ultra-faint dwarf galaxies may have a deficit of low mass stars when compared to the canonical stellar population (Geha et al., 2013; Gennaro et al., 2018). Here, we study the influence of the gwIMF and star formation history (SFH) on the stellar ratio of DF44.
2.2 The expected ratio in the IGIMF context
Based on the canonical gwIMF 111The ‘canonical gwIMF’ or ‘canonical IMF’, is the standard invariant two-part power-law IMF with Salpeter index of for stellar mass and for smaller stellar masses., the ratio of a 10 Gyr old DF44-like galaxy is about 1 in Solar units. Assuming a bottom-heavy or top-heavy gwIMF, the ratio would increase owing to the higher fraction of low mass stars or stellar remnants, respectively.
Here, we use the IGIMF theory to determine DF44’s ratio. In the IGIMF context, the gwIMF would be top-heavy if the SFR (Yan et al., 2017; Jeřábková et al., 2018). We assume a constant galaxy-wide SFR over the duration of star formation, . Assuming an age of 10 Gyr for DF44 (van Dokkum et al., 2019b), we calculate its ratio for different values of its total mass and . The SFR increases with decreasing , since , where is the total mass of all stars were formed in the galaxy.
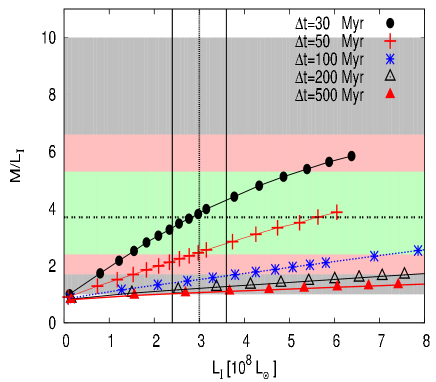
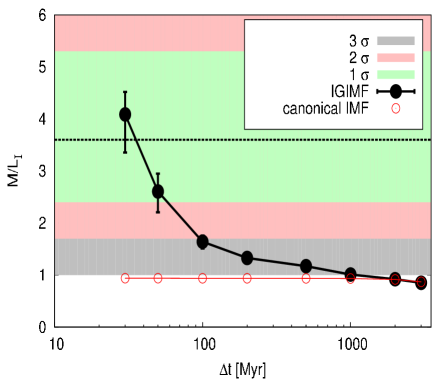
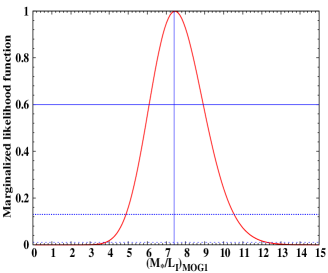
Fig. 1 shows the calculated present-day ratio versus the total -band luminosity for different . The total luminosity of DF44 is , which we show as vertical lines. The bottom panel of Fig. 1 shows the ratio as a function of the star formation timescale . Decreasing leads to a higher present-day ratio. This is because decreasing increases the SFR which, in the context of the IGIMF, implies a more top-heavy IMF and hence a higher mass-to-light ratio as well as a higher average stellar age. Assuming that Myr, the ratio must be in the range .
However, the expected is almost independent of for the canonical IMF since the galaxy is much older than in the range considered (red line in Fig. 1). The minor decrease of the expected for the canonical IMF at Gyr is due to the lower number of remnants formed for a longer duration of star formation.
3 Modeling the velocity dispersion in MOG and MOND
3.1 Modified Gravity (MOG)
In the weak field approximation, one can obtain the exact static spherically symmetric solution of the MOG field equation for a point-like mass by perturbing the fields around Minkowski space-time for an arbitrary distribution of non-relativistic matter (Moffat & Rahvar, 2013). In this regime, the MOG gravitational potential and gravitational acceleration are found using the principle of superposition as follows (see their equation 32):
| (1) |
Here, is the Newtonian gravitational constant, is determined by the coupling strength of the fifth force vector, , to the baryonic matter and is the range of this force. The parameters and are the free parameters of the theory that should be universal parameters fixed by observations (Moffat & Toth, 2009). The resulting MOG acceleration from a point-like mass in the weak field regime contains a Yukawa-type force added to the Newtonian acceleration (Moffat, 2006):
| (2) |
The gravitational potential/field of an extended self-gravitating spherically symmetric system in MOG has been derived based on the point mass potential (Moffat & Rahvar, 2013; Roshan & Abbassi, 2014).
By rotation curve analysis of the THe HI Nearby Galaxy Survey (THINGS) catalog of galaxies with a wide range of luminosities (from ), Moffat & Rahvar (2013) have shown that and are universal parameters with the values and , respectively. They then applied the effective MOG potential with these fixed universal parameters to a sample of spiral galaxies in the Ursa Major catalog of galaxies and obtained good fits to galaxy rotation curve data. However, Haghi & Amiri (2016) showed that for almost all dSphs of the MW, the best-fitting values of and are larger than and . They concluded that these parameters are not really universal constants in MOG as theoretically predicted (Green et al., 2018), but instead take different values for different classes of objects. In Sec. 4.3, we will confirm this conclusion again by showing that MOG with the universal parameters and requires an unacceptable ratio for DF44.
3.2 Milgromian dynamics (MOND)
In the non-relativistic version of MOND interpreted as modified gravity (comprehensively reviewed in Famaey & McGaugh, 2012), the gravitational acceleration in an isolated spherically symmetric system is related to the Newtonian gravity by (Milgrom, 1983a; Bekenstein & Milgrom, 1984)
| (3) |
where Milgrom’s constant is the transition acceleration of the theory below which Newtonian dynamics breaks down (Begeman et al., 1991; Famaey et al., 2007) and is an interpolation function which is very close to when but saturates at for . Different types of MOND interpolating functions have been used in the literature. The most common families of functions were reviewed in Famaey & McGaugh (2012). The transition around can be interpreted to be due to the quantum vacuum (Milgrom, 1999; Smolin, 2017; Cadoni & Tuveri, 2019).
As the internal acceleration of DF44 is significantly below , the choice of interpolation function has a negligible effect on our results. Here, we use the standard function . With this function, the MOND acceleration is related to the Newtonian acceleration as follows (Milgrom, 1983b):
| (4) |
where at some 3D radius within which the enclosed baryonic mass . This is determined by combining photometric observations of with the chosen or fitted stellar mass-to-light ratio .
To assess how DF44 should behave in MOND, we can apply the deep-MOND virial relation (Milgrom, 1995) to estimate that its globally averaged one-dimensional velocity dispersion should be km/s for an I-band luminosity of (van Dokkum et al., 2019b) and a stellar mass to light ratio of 1 Solar unit in this band (Sec. 2). This is rather similar to their reported velocity dispersions, suggesting that MOND may be consistent with DF44.
3.3 Jeans analysis
In order to find in a non-rotating spherically symmetric system, we use the Jeans equation (Binney & Tremaine, 2008):
| (5) |
where , , , and are the radial distance from the center of the galaxy, the spatial number density of stars, the velocity anisotropy, the radial velocity dispersion as a function of radial distance and the gravitational potential, respectively. In general, could be zero (i.e. isotropic velocity dispersion tensor), constant or a function of .
The observable is given by
| (6) |
where and are the 2D and 3D distances from the center of the galaxy, respectively, and .
For the density distribution, we use a Plummer model (Plummer, 1911):
| (7) |
where is the total mass of the galaxy and is its Plummer radius, which is smaller than the 3D half-light radius (Wolf et al., 2010). In this study, we assume kpc and a total luminosity of (van Dokkum et al., 2016, 2019b).
| Model | |||||
| (P-value) | |||||
| MOG 1 | (fixed) | (fixed) | |||
| MOG 2 | (fixed) | ||||
| MOG 3 | (fixed) | ||||
| MOND | – | – |
4 Results
By adjusting the free parameters of a model, the fit to the data can be improved or worsened. We quantify the goodness of each fit using the reduced statistic, which is defined as
| (8) |
where is the uncertainty of observed data point , is the number of data points and is the number of degrees of freedom in the model.
4.1 MOG fits
By applying the formalism described in Sec. 3 to the observed data of DF44, we calculate its profile. Given that DF44 has , its baryonic mass is within the range of galaxies in the THINGS catalog. Thus, in the first step (MOG1), we fix the MOG parameters to and , which are upper limits inferred from fitting MOG to galaxy RCs (Moffat & Rahvar, 2013).
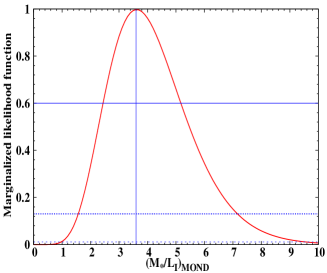
We allow variation in the ratio and anisotropy parameter . As shown in Table 1, although a good fit is achieved with reduced , the inferred of for model MOG1 is larger than expected from SPS models (Fig. 2). We also derive the uncertainty on the ratio. The marginalized 1, 2 and 3 confidence intervals on are indicated in the right-hand panel of Fig. 2 as horizontal lines.
In order to produce higher values of with a lower , one needs to assign larger values of and compared to and . Given that the above and are upper limits, we conclude that the best-fitting parameters are inconsistent with limits imposed by rotation curve analyses. Indeed, it has already been shown that these parameters should not be taken as universal constants but should be considered as mass-dependent (Moffat, 2006; Haghi & Rahvar, 2010; Haghi & Amiri, 2016). For example, fits to data of the MW dSph galaxies yield average values of and kpc-1 (Haghi & Amiri, 2016).
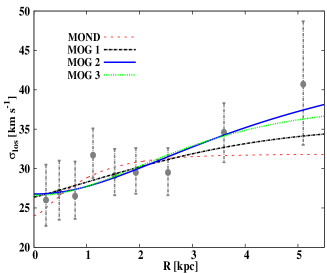
Therefore, in the second step, we let these two parameters vary and fit the velocity dispersion data with a fixed (model MOG2) or 1 (model MOG3) Solar units. Fig. 2 shows that the MOG theory can successfully reproduce the observed data with acceptable values of . In these cases, MOG prefers an isotropic velocity dispersion tensor of DF44 (i.e. ).
As shown in Table 1, the best-fitting values of and kpc-1 are consistent with the results for dSph galaxies (Haghi & Amiri, 2016). However, the best-fitting values are larger than those inferred from rotation curve analysis of spiral galaxies, supporting the hypothesis that the MOG parameters are mass-dependent. This is consistent with the trend claimed by Brownstein & Moffat (2007) that the best-fitting values of and decrease when moving from low-mass systems (e.g. dwarf galaxies) to massive systems (e.g. dwarf and normal X-ray clusters). However, MOG does not offer a physical explanation for such a dependency.
4.2 MOND fit
By solving the Jeans equation, we calculate in the MOND framework. The best-fitting values of the mass-to-light ratio and anisotropy parameter along with the minimum value are given in Table 1. The MOND fit to the profile is shown in Fig. 2 as a red dashed line. The reduced of is quite good, as can also be seen in Fig. 2 the best-fitting profile passes through 8 out of 9 data points within their 1 uncertainties, while the prediction for the outermost point is only just outside its 1 range. In this model, the anisotropy is negative () i.e. the tangential velocity dispersion exceeds the radial one. In addition, to be comfortably explained in MOND, DF44 should have a ratio of around 3.6 Solar units. Our result is in good agreement with those of Bílek et al. (2019), who found the tangentially anisotropic model with and provides a reasonable fit to the data (see their fig 2b).
As can be seen in Fig. 2, the ratio of inferred from our MOND dynamical model of DF44 (shown as horizontal lines) can be acceptable in the context of the IGIMF theory if the star formation occurred very rapidly (within the first 50-80 Myr) and shut off thereafter (Fig. 1).
At 3, our MOND dynamical modeling is consistent with (middle panel of Fig. 2). The significant uncertainty in this is a consequence of the fact that in the deep-MOND limit, allowing large changes in to have a relatively modest impact on the observed kinematics. A mass-to-light ratio of arises in our IGIMF model for Gyr (Fig. 1). This is longer than DF44’s dynamical timescale of Myr if kpc and the 3D velocity dispersion is the observed of 30 km/s.
A short star formation timescale, being consistent with MOND, might also naturally explain the large size of DF44, since gas expelled by massive stars would cause it to expand (Wu & Kroupa, 2018). This result is in line with the suggestion by van Dokkum et al. (2018) that UDGs must have had extremely high gas densities at the time of their formation and perhaps feedback from an intense, compact star burst that created them caused both the cessation of star formation and their expansion to become UDGs.
In the context of the IGIMF theory, the slope of the gwIMF above 1 varies with the SFR. A higher SFR leads to the gwIMF being more top-heavy, while the slope of the gwIMF does not change for and remains the same as the canonical IMF (but see Jeřábková et al. 2018). Adopting an age of 10 Gyr and , only stars with remain alive on the main sequence and contribute to the total luminosity. Stars with higher masses have already evolved and turned into remnants, so they contribute to the total mass but not to the luminosity. Since we fix the -band luminosity of the modeled galaxies to be the same as DF44, adopting the IGIMF instead of the canonical IMF only changes the total mass of DF44 and hence its . DF44’s suggested short star formation duration implies that its color will be independent of as long as this is much less than its age.
4.3 Consistency with observations
In this section, we show the joint constraint on the and of DF44 based on dynamical modeling and typical values of as found by Pflamm-Altenburg & Kroupa (2009), respectively. We also show the locus of values consistent with stellar population modeling in the IGIMF framework (Sec. 2).
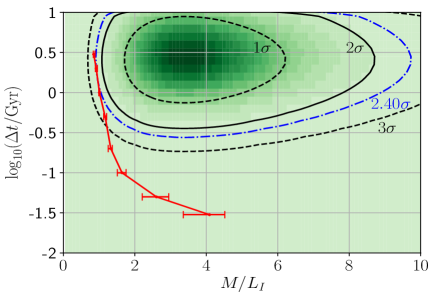
We begin by plotting a 2D array of probabilities as a function of and (with in Gyr). We then show the 68.3%, 95.4% and 99.7% confidence levels of the probability distribution (Fig. 3). The probability is the product of the posterior on from the kinematics (Eq. 8) multiplied by the likelihood of a particular star formation timescale, i.e.
| (10) |
and Gyr is the expected from Pflamm-Altenburg & Kroupa (2009) for an assumed gas mass of (using a lower or higher value has a negligible effect). According to section 5 of their work, has a dispersion of dex. We impose an upper limit of Gyr since the red colour of DF44 shows it did not form stars very recently. Since our dynamically inferred posteriors on (Fig. 2) are calculated for fixed , we convolve our with a Gaussian in of width , thereby accounting for a 20% uncertainty in (section 6.2 of van Dokkum et al., 2019b).
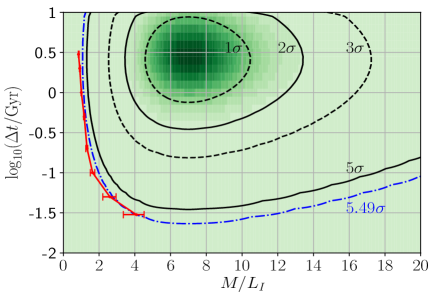
To quantify the consistency of each model with observations, we change the confidence level until the corresponding contour just intersects one point on the SPS track of . In this way, we find that MOND is consistent with observations at 1.66%, which corresponds to for a Gaussian distribution. However, MOG1 is consistent with observations only at the level (), so our results rule out MOG in its present form we are already setting its free parameters to the upper limits allowed by THINGS (Sec. 4.1).
The MOND model marginally matches the data if we bear in mind that there must occasionally be outliers from the correct theory. Given that we have accurate kinematics for galaxies and MOND works well in the vast majority of them (Li et al., 2018), we expect to come across a few cases where the consistency is only at the percent level. Indeed, it would be somewhat unusual if MOND explained all observed galaxies within . However, there should be no events within a sample of this size, showing that presently available data on DF44 rule out the MOG model if its free parameters are universal (as claimed by its proponents, Green, Moffat, & Toth, 2018) and our other modeling assumptions are correct. If DF44 has some rotation within the plane of the sky, its self-gravity would be even stronger than we assumed, thus requiring an even larger and making the situation worse for MOG. The same is true if we use the canonical IMF instead of the IGIMF as the former predicts (Fig. 1).
5 Discussion
van Dokkum et al. (2019b) recently reported a revised stellar velocity dispersion within the effective radius for the UDG known as DF44, implying its Newtonian Solar units. They argue that the galaxy is gravitationally dominated by dark matter, in apparent contrast to the UDGs DF2 and DF4. They claimed that the MOND-predicted velocity dispersion of DF44 is lower than the observed value, challenging alternatives to dark matter theories such as MOND.
We took DF44 to be in equilibrium by adopting a simplified density profile without any tidal interaction. Tidal disruption scenarios cannot easily be reconciled with the high GC counts of UDGs in Coma and their lack of obvious tidal features. The fact that DF44 appears to live in a dynamically cold environment (van Dokkum et al., 2019b, their section 6.1) can be interpreted as evidence against tidal heating by the Coma cluster. However, some tidal heating could increase the velocity dispersion in the outer parts of DF44, easing the tension with MOND (Bílek et al., 2019).
In addition to neglecting tides, our MOND calculations assume no external field effect (EFE; see Famaey & McGaugh 2012 for a review and discussion of the MOND-unique EFE; see also Wu & Kroupa 2015 for an accessible description). Since the internal acceleration is for , the EFE would not significantly affect our results as long as the external field (EF) is much weaker than this. The MOND dynamical mass of the Coma cluster is (Sanders, 2003). This implies DF44 is Mpc from the center of the Coma cluster, in which case DF44 is not in the cluster. This is entirely consistent with its sky-projected separation of Mpc (Bílek et al., 2019, their section 3.1) and the observation that two other galaxies, DF42 and DFX2, have a radial velocity within 100 km/s of the value for DF44, suggesting these are part of a different group which is dynamically much colder than the Coma cluster (van Dokkum et al., 2019b, their section 6.1). For a MW-like galaxy with to provide an EF comparable to , the separation with DF44 would need to be kpc. There is no such galaxy so close to DF44, strengthening confidence in our assumption that it can be treated as isolated.
So far, we have assumed that DF44 is at a downrange distance of Mpc based on its redshift. However, it may have a peculiar velocity of a few hundred km/s. The MOND-predicted for fixed and apparent magnitude (Kroupa et al., 2018). Since in the deep-MOND limit (Milgrom, 1995), the MOND . Thus, placing DF44 just 10% further away reduces the best-fitting to 3.0, improving the agreement with SPS expectations. Its observed velocity dispersion could also have been overestimated slightly.
Our analysis prefers a relatively short formation time scale for DF44. This can occur if it is a tidal dwarf galaxy (TDG) and lost its gas reservoir by ram pressure or tidal stripping i.e. if it was quenched (Weisz et al., 2015). The temporal evolution of the quenched fraction can also provide clues as to how quickly dwarf galaxies can undergo quenching. For example, in the lowest-mass systems, nearly 40% already appear to be quenched by Gyr ago, which implies a quenching timescale of 1-2 Gyr (Weisz et al., 2015). Therefore, DF44 may well have been quenched within 1 Gyr of its formation.
Once there is no further gas supply, the available gas is consumed on a dynamical time-scale. Pressure supported systems do indeed form within a few dynamical times, as is nicely evident in elliptical galaxies see the downsizing results by Thomas et al. (1999) and Recchi et al. (2009). Since DF44 is pressure-supported (van Dokkum et al., 2016), it may well have a somewhat shorter than estimated by Pflamm-Altenburg & Kroupa (2009) since their work only considered late-type galaxies.
6 Conclusion
We constructed SPS models of DF44 in the IGIMF framework to estimate its stellar ratio independently of the assumed gravity law. We then used spatially-resolved kinematic data of DF44 to infer its dynamical in the framework of MOG and MOND, which are alternative approaches to the cold dark matter hypothesis. The main conclusions of these calculations are as follows:
-
•
First, we used MOG with the upper limits and inferred from fits to galaxy rotation curves (Moffat & Rahvar, 2013). The only free parameter was the stellar ratio. We found that these models provide a reasonably good fit, but the required high near-infrared ratio of Solar units is completely inconsistent with stellar population synthesis modeling for any plausible star formation duration.
-
•
Then, we let and vary as free parameters and fitted the velocity dispersion data assuming = 1 and 3 Solar units. The best-fitting values of and are larger than and , supporting the hypothesis that the MOG parameters are mass-dependent. They are compatible with the average values of and obtained from fitting MOG to data of the MW dSph galaxies (Haghi & Amiri, 2016). These values are significantly larger than and inferred from fits to the rotation curves of spiral galaxies (Moffat & Rahvar, 2013).
-
•
We calculated the profile of DF44 in MOND and found that the best fitting model with constant orbital anisotropy has and a stellar mass-to-light ratio of Solar units. Obtaining requires a star formation duration Myr. However, the lower limit on is 1.0, consistent with the canonical IMF and expectations from SPS modeling in the IGIMF context for Gyr (Fig. 1).
-
•
By considering the joint constraints on and from dynamical modelling and observations of other galaxies, respectively, we showed that MOND is consistent with our Gyr star formation model of DF44 at (1.66% confidence). The same approach shows that MOG is ruled out at since it has only a chance of explaining the observations even if and are set to the upper limits inferred from rotation curve fitting.
Acknowledgements
AHZ and IB are supported by Alexander von Humboldt postdoctoral research fellowships. The authors wish to thank the reviewer for very detailed comments which significantly improved this manuscript.
References
- Angus & McGaugh (2008) Angus, G. W., & McGaugh, S. S. 2008, MNRAS, 383, 417
- Banerjee et al. (2012) Banerjee, S., Kroupa, P., & Oh, S. 2012, MNRAS, 426, 1416
- Begeman et al. (1991) Begeman, K. G., Broeils, A. H., & Sanders, R. H. 1991, MNRAS, 249, 523
- Bekenstein & Milgrom (1984) Bekenstein, J., & Milgrom, M. 1984, ApJ, 286, 7
- Bílek et al. (2019) Bílek, M., Müller, O., & Famaey, B. 2019, A&A, 627, L1
- Binney & Tremaine (2008) Binney, J., & Tremaine, S. 2008, Galactic Dynamics: Second Edition (Princeton University Press)
- Brownstein & Moffat (2007) Brownstein, J. R., & Moffat, J. W. 2007, MNRAS, 382, 29
- Cadoni & Tuveri (2019) Cadoni, M., & Tuveri, M. 2019, Phys. Rev. D, 100, 024029
- Conroy et al. (2017) Conroy, C., van Dokkum, P. G., & Villaume, A. 2017, ApJ, 837, 166
- Dabringhausen et al. (2010) Dabringhausen, J., Fellhauer, M., & Kroupa, P. 2010, MNRAS, 403, 1054
- Dabringhausen et al. (2009) Dabringhausen, J., Kroupa, P., & Baumgardt, H. 2009, MNRAS, 394, 1529
- Dabringhausen et al. (2012) Dabringhausen, J., Kroupa, P., Pflamm-Altenburg, J., & Mieske, S. 2012, ApJ, 747, 72
- Danieli et al. (2019) Danieli, S., van Dokkum, P., Conroy, C., Abraham, R., & Romanowsky, A. J. 2019, ApJL, 874, L12
- Di Cintio et al. (2017) Di Cintio, A., Brook, C. B., Dutton, A. A., et al. 2017, MNRAS, 466, L1
- Di Cintio et al. (2014) —. 2014, MNRAS, 441, 2986
- Famaey et al. (2007) Famaey, B., Bruneton, J.-P., & Zhao, H. 2007, MNRAS, 377, L79
- Famaey et al. (2018) Famaey, B., McGaugh, S., & Milgrom, M. 2018, MNRAS, 480, 473
- Famaey & McGaugh (2012) Famaey, B., & McGaugh, S. S. 2012, Living Reviews in Relativity, 15, 10
- Geha et al. (2013) Geha, M., Brown, T. M., Tumlinson, J., et al. 2013, ApJ, 771, 29
- Gennaro et al. (2018) Gennaro, M., Tchernyshyov, K., Brown, T. M., et al. 2018, ApJ, 855, 20
- Green et al. (2018) Green, M. A., Moffat, J. W., & Toth, V. T. 2018, Physics Letters B, 780, 300
- Gunawardhana et al. (2011) Gunawardhana, M. L. P., Hopkins, A. M., Sharp, R. G., et al. 2011, MNRAS, 415, 1647
- Habergham et al. (2010) Habergham, S. M., Anderson, J. P., & James, P. A. 2010, ApJ, 717, 342
- Haghi & Amiri (2016) Haghi, H., & Amiri, V. 2016, MNRAS, 463, 1944
- Haghi et al. (2017) Haghi, H., Khalaj, P., Hasani Zonoozi, A., & Kroupa, P. 2017, ApJ, 839, 60
- Haghi & Rahvar (2010) Haghi, H., & Rahvar, S. 2010, International Journal of Theoretical Physics, 49, 1004
- Haghi et al. (2019) Haghi, H., Kroupa, P., Banik, I., et al. 2019, MNRAS, 487, 2441
- Hodson & Zhao (2017) Hodson, A. O., & Zhao, H. 2017, A&A, 607, A109
- Hopkins (2018) Hopkins, A. M. 2018, Publications of the Astronomical Society of Australia, 35, 39
- Hoversten & Glazebrook (2008) Hoversten, E. A., & Glazebrook, K. 2008, ApJ, 675, 163
- Jeřábková et al. (2018) Jeřábková, T., Hasani Zonoozi, A., Kroupa, P., et al. 2018, A&A, 620, A39
- Jeřábková et al. (2017) Jeřábková, T., Kroupa, P., Dabringhausen, J., Hilker, M., & Bekki, K. 2017, A&A, 608, A53
- Kalari et al. (2018) Kalari, V. M., Carraro, G., Evans, C. J., & Rubio, M. 2018, ApJ, 857, 132
- Koda et al. (2012) Koda, J., Yagi, M., Boissier, S., et al. 2012, ApJ, 749, 20
- Kroupa (2005) Kroupa, P. 2005, in ESA Special Publication, Vol. 576, The Three-Dimensional Universe with Gaia, ed. C. Turon, K. S. O’Flaherty, & M. A. C. Perryman, 629
- Kroupa & Weidner (2003) Kroupa, P., & Weidner, C. 2003, ApJ, 598, 1076
- Kroupa et al. (2013) Kroupa, P., Weidner, C., Pflamm-Altenburg, J., et al. 2013, The Stellar and Sub-Stellar Initial Mass Function of Simple and Composite Populations (Springer Science and Business Media Dordrecht), 115
- Kroupa et al. (2018) Kroupa, P., Haghi, H., Javanmardi, B., et al. 2018, Nature, 561, E4
- Lada & Lada (2003) Lada, C. J., & Lada, E. A. 2003, ARA&A, 41, 57
- Lee et al. (2009) Lee, J. C., Gil de Paz, A., Tremonti, C., et al. 2009, ApJ, 706, 599
- Li et al. (2018) Li, P., Lelli, F., McGaugh, S., & Schombert, J. 2018, A&A, 615, A3
- Marks et al. (2012) Marks, M., Kroupa, P., Dabringhausen, J., & Pawlowski, M. S. 2012, MNRAS, 422, 2246
- Megeath et al. (2016) Megeath, S. T., Gutermuth, R., Muzerolle, J., et al. 2016, AJ, 151, 5
- Meurer et al. (2009) Meurer, G. R., Wong, O. I., Kim, J. H., et al. 2009, ApJ, 695, 765
- Milgrom (1983a) Milgrom, M. 1983a, ApJ, 270, 365
- Milgrom (1983b) —. 1983b, ApJ, 270, 371
- Milgrom (1995) —. 1995, ApJ, 455, 439
- Milgrom (1999) —. 1999, Physics Letters A, 253, 273
- Moffat (2005) Moffat, J. W. 2005, J. Cosmology Astropart. Phys, 5, 003
- Moffat (2006) —. 2006, Journal of Cosmology and Astroparticle Physics, 3, 4
- Moffat & Rahvar (2013) Moffat, J. W., & Rahvar, S. 2013, MNRAS, 436, 1439
- Moffat & Toth (2009) Moffat, J. W., & Toth, V. T. 2009, Classical and Quantum Gravity, 26, 085002
- Pflamm-Altenburg & Kroupa (2009) Pflamm-Altenburg, J., & Kroupa, P. 2009, ApJ, 706, 516
- Plummer (1911) Plummer, H. C. 1911, MNRAS, 71, 460
- Recchi et al. (2009) Recchi, S., Calura, F., & Kroupa, P. 2009, A&A, 499, 711
- Roshan & Abbassi (2014) Roshan, M., & Abbassi, S. 2014, Phys. Rev. D, 90, 044010
- Sanders (2003) Sanders, R. H. 2003, MNRAS, 342, 901
- Schneider et al. (2018) Schneider, F. R. N., Sana, H., Evans, C. J., et al. 2018, Science, 359, 69
- Smolin (2017) Smolin, L. 2017, Physical Review D, 96, 104042
- Thomas et al. (1999) Thomas, D., Greggio, L., & Bender, R. 1999, MNRAS, 302, 537
- Úbeda et al. (2007) Úbeda, L., Maíz-Apellániz, J., & MacKenty, J. W. 2007, AJ, 133, 932
- van Dokkum et al. (2019a) van Dokkum, P., Danieli, S., Abraham, R., Conroy, C., & Romanowsky, A. J. 2019a, ApJL, 874, L5
- van Dokkum et al. (2016) van Dokkum, P., Abraham, R., Brodie, J., et al. 2016, ApJ, 828, L6
- van Dokkum et al. (2018) van Dokkum, P., Cohen, Y., Danieli, S., et al. 2018, ApJl, 856, L30
- van Dokkum et al. (2019b) van Dokkum, P., Wasserman, A., Danieli, S., et al. 2019b, ApJ, 880, 91
- van Dokkum et al. (2015) van Dokkum, P. G., Abraham, R., Merritt, A., et al. 2015, ApJ, 798, L45
- van Dokkum & Conroy (2010) van Dokkum, P. G., & Conroy, C. 2010, Nature, 468, 940
- van Dokkum & Conroy (2011) —. 2011, ApJ, 735, L13
- Wasserman et al. (2018) Wasserman, A., Romanowsky, A. J., Brodie, J., et al. 2018, ApJ, 863, L15
- Watts et al. (2018) Watts, A. B., Meurer, G. R., Lagos, C. D. P., et al. 2018, MNRAS, 477, 5554
- Weisz et al. (2015) Weisz, D. R., Dolphin, A. E., Skillman, E. D., et al. 2015, ApJ, 804, 136
- Wolf et al. (2010) Wolf, J., Martinez, G. D., Bullock, J. S., et al. 2010, MNRAS, 406, 1220
- Wu & Kroupa (2015) Wu, X., & Kroupa, P. 2015, MNRAS, 446, 330
- Wu & Kroupa (2018) —. 2018, ApJ, 853, 60
- Yan et al. (2017) Yan, Z., Jerabkova, T., & Kroupa, P. 2017, A&A, 607, A126
- Zhang et al. (2018) Zhang, Z.-Y., Romano, D., Ivison, R. J., Papadopoulos, P. P., & Matteucci, F. 2018, Nature, 558, 260
- Zonoozi et al. (2016) Zonoozi, A. H., Haghi, H., & Kroupa, P. 2016, ApJ, 826, 89
- Zonoozi et al. (2019) Zonoozi, A. H., Mahani, H., & Kroupa, P. 2019, MNRAS, 483, 46