|
|
Droplet leaping governs microstructured surface wetting |
| Susumu Yadaa, Shervin Bagheria, Jonas Hanssonb, Minh Do-Quanga, Fredrik Lundella, Wouter van der Wijngaartb and Gustav Amberga,c | |
|
|
Microstructured surfaces that control the direction of liquid transport are not only ubiquitous in nature, but they are also central to technological processes such as fog/water harvesting, oil-water separation, and surface lubrication. However, a fundamental understanding of the initial wetting dynamics of liquids spreading on such surfaces is lacking. Here, we show that three regimes govern microstructured surface wetting on short time scales: spread, stick, and contact line leaping. The latter involves establishing a new contact line downstream of the wetting front as the liquid leaps over specific sections of the solid surface. Experimental and numerical investigations reveal how different regimes emerge in different flow directions during wetting of periodic asymmetrically microstructured surfaces. These insights improve our understanding of rapid wetting in droplet impact, splashing, and wetting of vibrating surfaces and may contribute to advances in designing structured surfaces for the mentioned applications. |
1 Introduction
Natural surfaces with texture provide organisms the ability to control liquid transport in fascinating ways. For example, lotus leaves have hierarchically structured surfaces that ease droplet removal1, 2. The “pitcher plant” Nepenthes alata has wettable asymmetric microridges on their peristomes that make the surface slippery and aid in catching insects efficiently3, 4. Ryegrass leaves have inclined protrusions to help to shed off water unidirectionally5. Cacti in deserts gather water through thorns with surface structures that collect fog effectively6.
Understanding how liquids act on non-smooth surfaces has also become increasingly important in technological processes, such as printing, coating, adhesion, mixing, and sorting7. In particular, natural surfaces have inspired the fabrication of micro- and nanoscopic topographies where asymmetric structures are introduced to enable capillary-driven directional liquid transport8, 9, 10. Chu et. al.8 first demonstrated that droplets can spread unidirectionally on arrays of asymmetric nanorods. Various applications of asymmetric-structured surfaces have been reported since, including mixing in microreactors11, oil-water separation12, and transport in microfluidic channels13.
The spreading of a liquid droplet over a textured surface has thus far been analyzed in the slow late spreading regime ( 100 ms to few seconds)14, 15, 8, 11, 16. The details and mechanisms of such spreading have been described in terms of contact-line pinning16, 3, Laplace pressure16, 17, 11, and gradients in surface energy18, 19. Also, numerical simulations have provided valuable insights into the spreading mechanisms in the late regime20, 21. However, the rapid wetting that precedes this late spreading is not well understood. Rapid wetting is crucial for droplet impact on solid surfaces22, 23, or in situations where time scales are imposed externally, such as wetting phenomena in the presence of vibrations24.
Here, we theoretically, experimentally and numerically investigate rapid wetting on microstructures. We consider the dynamics of the leading contact line on slanted ridges in a two dimensional plane. We elucidate how the contact line follows the microstructures and explain and predict the effect of the geometry on the spreading speed.
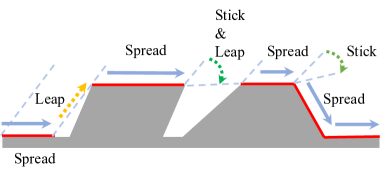
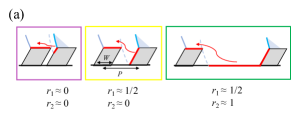
We hypothesize that three wetting regimes determine the contact line velocity and that wetting can be understood from the succession of these regimes as the contact line travels over the surface (Fig. 1). The first regime, called spread, is the movement of the contact line on a homogeneous surface with a velocity determined by surface chemistry and liquid-gas properties25, 26. The second regime, called stick, refers to the pinning of the contact line on surface corners, resulting in a temporarily stationary contact line27. Both spread and stick regimes are well understood28, 15, 27 in contrast to the third phenomenon we observed and that we call leap. Contact line leaping involves the establishment of a new contact line downstream of the wetting front when the liquid leaps over specific sections of the solid surface, trapping gas between the solid and the liquid. As the surface wets, the wetting regimes can follow each other in any order, as illustrated in Fig. 1.
2 Experiments and methods
2.1 Experimental set-up
Spontaneous droplet spreading is recorded with a high-speed camera (DANTEK dynamics Speedsense M) at a frame rate of 52,044 per second. A water droplet develops from a needle with outer diameter of 0.31 mm (Hamilton, gauge 30, point style 3) and starts to spread spontaneously immediately after it touches a substrate. Water is pumped by a syringe pump (Cetoni, neMESYS 1000N) at a flow rate 0.04 l/s. The flow rate is so small that a static state is assumed before the droplet touches the surface. The initial radius of the droplet is determined by the distance between the needle and the surface and fixed to 0.4 mm. The scope is composed of 128 128 pixels, which leads to the spatial resolution 8m. As seen in Fig. 3(c), owning to the limited spatial resolution, the observed droplet has finite spreading radius even before it actually touches the substrate. In order to estimate the initial time in which the droplet starts to spread, a power-law curve is fitted to the time history of observed spreading radius where , , and are scalar parameters. The initial time is then determined by shifting the original spreading time by .
2.2 Sample preparation
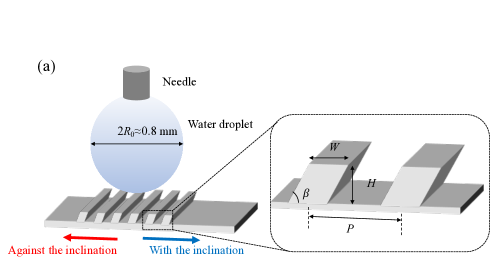
The microstructured surfaces are made from Ostemer 220 (Mercene Labs, Stockholm, Sweden), a UV-curing Off-Stoichiometry-Thiol-Ene (OSTE) resin, with excellent lithographic patterning, previously used to create complex slanted structures29. The samples are manufactured as follows. First, a flat Ostemer layer is manufactured on a smooth plastic film. Second, slanted Ostemer ridges are patterned on the base layer by exposing slanted UV light through a patterned photomask. After development in Aceton, a surface modification is performed to hydrophilize the surface (equilibrium contact angle on a flat substrate) in order to achieve partial wetting. Surface structures are characterized with scanning electron microscopy as shown in Supplementary Fig. 1. The inclination of the ridges is 60∘ for all the structures. The samples used in this work are labeled as (, ) where and are the width and pitch of the ridge in micrometers, respectively, and listed in Table 1.
| Label | |||||
|---|---|---|---|---|---|
| (10, 15) | 10 | 15 | 14 | 1.39 0.10 | 1.21 0.06 |
| (10, 20) | 10 | 20 | 14 | 1.61 0.15 | 1.30 0.11 |
| (10, 30) | 10 | 30 | 14 | 3.07 0.50 | 4.66 0.71 |
| (15, 23) | 15 | 23 | 14 | 1.30 0.12 | 1.13 0.07 |
| (15, 30) | 15 | 30 | 14 | 1.43 0.11 | 4.12 0.58 |
| (15, 45) | 15 | 45 | 14 | 3.11 0.67 | 6.3 1.4 |
| (20, 30) | 20 | 30 | 15 | 1.99 0.33 | 5.19 0.84 |
| (20, 40) | 20 | 40 | 17 | 3.77 0.44 | 5.5 1.7 |
| (20, 60) | 20 | 60 | 17 | 1.80 0.36 | 5.06 0.62 |
2.3 Navier-Stokes-Cahn-Hillard equations
The Navier-Stokes equations combined with the phase-field approach (Cahn-Hilliard equation) are solved to simulate the droplet wetting on a comparable geometry to the experiments. The incompressible Navier-Stokes equations are given by
| (1) |
| (2) |
The non-dimensional numbers characterizing the system are the capillary number =, the Reynolds number =, and the Cahn number =. Here, and are the density and viscosity of the liquid phase, is the surface tension of the liquid, and is the width of the liquid-gas interface. Moreover, and are the characteristic velocity and length of the system, respectively. The scalar is the phase field variable, where represents the liquid phase, and the vapor phase. The effect of gravity is negligible since the Bond number = is small (0.03 for =0.4 mm).
The Cahn-Hilliard equation is given by
| (3) |
where is the chemical potential of the system defined as . The Peclet number is defined as where is a mass diffusivity. Here, is the double well function, where the minimum represents the stable phases for gas () and liquid (). The boundary condition for on a solid surface is given by30, 31
| (4) |
where is equilibrium contact angle and is a polynomial which rapidly shifts from (vapor phase ) to (liquid phase ). The line friction parameter is associated with molecular-origin energy dissipation at the moving contact line.
2.3.1 Numerical simulations and parameters
The Navier-Stokes-Cahn-Hilliard equations are solved using in-house software called FemLego30. The physical properties are chosen to be comparable to the experiments. The characteristic density and viscosity are set to the values of pure water (0.992 kg/m3 and 0.997 Pas respectively), and the length scale is set to 0.4 mm to match with the initial radius of the droplet in the experiments, which leads to =29200. Surface tension is fixed to 0.073 N/m, which gives the capillary speed =73 m/s employed as the characteristic velocity , and leads to =1. The mass diffusivity in the Peclet number is set to 5.7 10-6 m2/s, which leads to =5120. The choice of Peclet number does not influence the results. The line friction parameter is obtained by fitting31, 25 the simulated spreading radius with the experiments on a smooth substrate and found to be =0.10 Pas (See Supplementary Fig. 2). The interface thickness is set to 2 m, and results in =510-3. The interface is thicker than the actual physical interface but it is sufficiently thin compared to the structures in order not to influence the simulated results.
3 Wetting mechanism
3.1 Wetting regimes
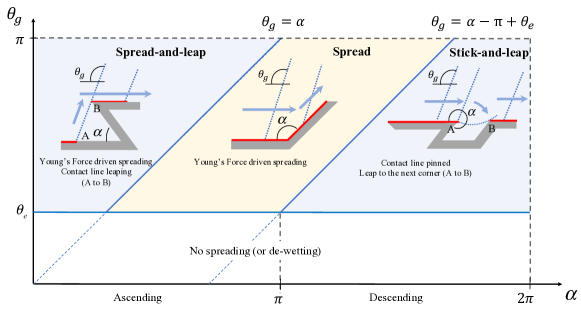
For wetting of structured surfaces, the combination of spread, stick and leap that ultimately determines the contact-line speed depends on the relation between the globally observed apparent dynamic contact angle , and the corner angle of the surface, (Fig. 2). The former angle is the apparent angle between the solid and the liquid-gas interface measured from the wetted side in the vicinity of the contact line. The corner angle defines the local corner of the surface structure that is approached by a moving contact line (see insets in Fig. 2). For the rapid wetting considered here, contact line movement is driven by Young’s force per unit length of a contact line . During spontaneous spreading, we have .
Three different spreading mechanisms can be distinguished (Fig. 2); (i) a spread-and-leap behavior of the contact line when ; (ii) a stick-and-leap behavior of the contact line when , and; (iii) continuous spreading driven by for intermediate corner angles . For spread-and-leap, the moving contact line leaps from the valley to the nearest ridge, leaving behind some dry surface. For stick-and-leap, the contact line is held pinned32 at the corner while the liquid-air interface above the pinning site bulges due to inertial forces. If there exists a rise of the surface sufficiently nearby, the interface eventually makes contact with the next rise in the texture, resulting in a leap that leaves dry the entire valley between the pinning position and the new contact line. For intermediate angles, where no leaping occurs and the liquid wets the dry solid, the contact line speed varies with the slope of the surface. In particular, a reduced speed is expected in downward-sloping sections of the surface, compared to flat sections, due to a reduced Young’s force .
3.2 Experimental and numerical observations
We experimentally investigated wetting of asymmetric ridges by depositing a water drop of radius mm on the surfaces and recording the first ms of wetting using a high-speed video camera (Fig. 3a). We also numerically simulated spreading of droplets on axisymmetric textured surfaces with the same height, pitch and angle as in our experiments using a phase-field approach30, 33.
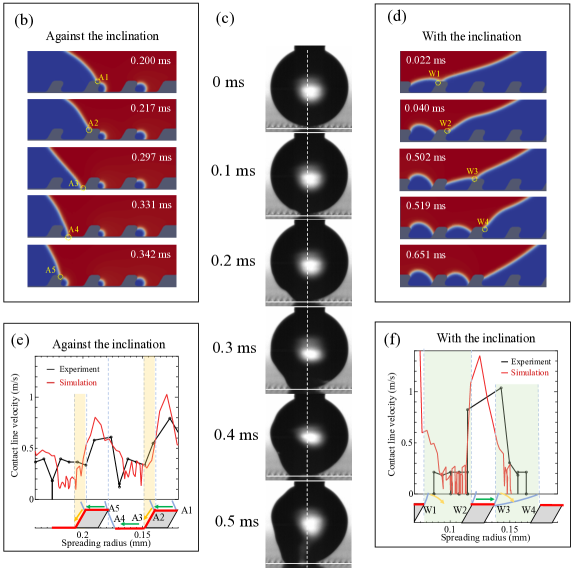
Figure 3(c) shows a time sequence of a water drop spreading on a surface with m, m, m. The experiments reveal the asymmetric evolution of the droplet spreading on the structure; the contact line travels faster against the inclination (passing five ridges in ms) than with the inclination (passing two ridges in ms). Our numerical simulations reproduce the experimental droplet shapes and the apparent contact line velocity with respect to the spreading radius (see Supplementary Fig. 3 and Supplementary Movie 1). This agreement between experiment and numerical model allows us to rely on the simulations for understanding the detailed contact line movement across the textured surface.
The difference between the wetting dynamics in the two directions results from the difference in wetting regimes. Figure 3(b) shows a time sequence of the liquid-gas interface as the droplet travels against the direction of inclination over one ridge. Figure 3(e) shows how the corresponding contact line velocity varies during the same time interval. We observe a fast spread on ridge tips (A1A2), slower spread while descending into the valley (A2A3), and finally an increase in speed with a spread-and-leap to the next ridge (A3A4A5). During the process of moving from A1 to A5, the simulation-predicted apparent dynamic contact angle is in the range of to (Supplementary Fig. 4), whereas the corner angles encountered by the moving contact line have the values (A1), (A2), (A3), and (A4-A5). Thus, our numerical observations conform with the kinematic map in Fig. 2, explaining the mechanisms behind the peaks and troughs of the contact line speed.
Figure 3(d) shows spreading in the direction with the inclination over one periodic structure. The corresponding contact line speed (Fig. 3f) has a distinct slow-fast-slow spreading velocity going from point W1 to point W4. This velocity profile corresponds to stick-and-leap (W1W2) at the corner W1, followed by fast spread on the flat top of the ridge (W2W3) and then again followed by stick-and-leap (W3W4). As the liquid front moves from W1 to W3, the apparent dynamic contact angle varies from to (Supplementary Fig. 4). The stick-and-leap follows from at the corners W1 and W3.
Further insight into the contact-line speed can be gained by characterizing the driving and resisting forces during initial wetting. The Young’s force driving the contact line can be balanced by an inertial force or a contact line friction force , where is a characteristic contact line speed on a smooth surface. The contact line friction is related to non-hydrodynamic energy dissipation at the contact line, connected to molecular scale processes represented by the line friction parameter, 34, 30. The viscous resistance associated with bulk liquid viscosity () can be neglected in the early stages of wetting since 26.
The Ohnesorge number based on the line friction parameter, , expresses the relative importance of line friction and fluid inertia. For a water droplet of radius mm, , where we computed the contact line friction to Pas by combining experiments and numerical simulations (see Section 2 and Supplementary Fig. 2 for details). Since is of order one, both inertia and contact line friction may be involved in resisting the spreading. However, they play very different roles during spread-and-leap compared to stick-and-leap. As we will show in the following, in the former regime line friction dominates, whereas, in the latter, inertial forces determine the contact-line speed.
4 Influence of the pitch on spreading speed
4.1 Passage time ratio
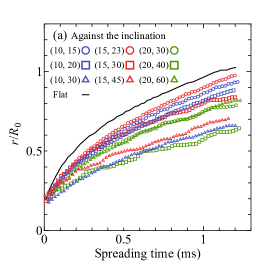
Figure 4(a) shows the experimental spreading radius evolution in the direction against the inclination for surfaces with different width () and pitch (). We observe that the spread on structured surfaces is always slower compared to a smooth surface (solid line). To characterize the spread-and-leap regime quantitatively, we define the passage time ratio,
| (5) |
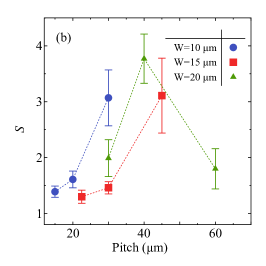
where and correspond to the liquid front travel time over the distance on structured surfaces and smooth surfaces, respectively. Large values of thus indicate slow spreading on structured surfaces compared to smooth surfaces. Figure 4(b) shows that passage time increases nearly by a factor three when the pitch is increased from m to m for W=10 m. A similar increase in is also observed for W=15 m. However, for wider structures W=20 m (Fig. 4b), the same rapid increase is observed when the pitch is increased from m to m; but the passage time reduces for very large pitch ( m).
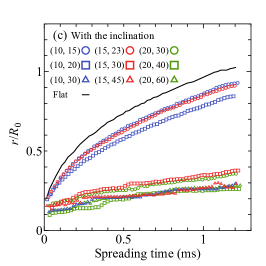
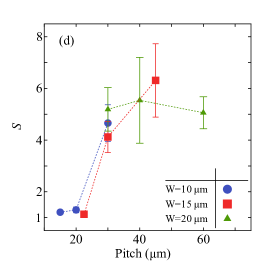
Figure 4(c) shows how the experimental spreading radius evolves in the direction with the inclination for surfaces with a different pitch. Compared to the smooth surface, we observe a slow spreading, which rapidly decreases with the pitch. From the corresponding passage times (symbols in Fig. 4(d)), increases monotonically for small and saturates to for large . We note that the travel time can be a factor five higher compared to a smooth surface, and thus also significantly larger compared to the spread-and-leap regime considered in the previous section (c.f. Fig. 4(b, d)).
4.2 Model and scaling analysis
4.2.1 A model for spread-and-leap regime
In order to understand and to predict the observed wetting behaviour, we build simple models based on estimates of the relevant forces.
The non-monotonic behavior in Fig. 4(b) for W=20 m can be explained by characterizing leaping over the microstructures in more detail. For a smooth flat surface, the passage time over a distance can be estimated as , where is the average contact-line velocity. For a surface with ridges, the wetted distance per period can be estimated as . Here, and represent the wetted portions of the vertical walls of the ridge and the valley between the ridges, respectively (see Fig. 5a). The time it takes for the contact line to move a distance is , where is the pitch-averaged contact-line velocity. Inserting the scaling estimates for and in Eq. (5), we obtain,
| (6) |
For a very large pitch (rightmost frame in Fig. 5a), nearly all the structured surface is wetted ( and ); we have very small leaping and . For a very small pitch (leftmost frame in Fig. 5a) the entire valleys between ridges remain dry ( and ); we have maximum leaping and . For intermediate values of the pitch , where and , a maximum value of the travel-time ratio exists.
To be more quantitative, we consider local contact line velocity based on phase field theory. As discussed in Section 3.1, the spreading in the direction against the inclination is in spread-and-leap regime. In this regime, we assume Young’s force is driving the contact line and the line friction is the resistive force. Assuming that wetting resistance for spread-and-leap is dominated by line friction, we can develop a theoretical model of the contact-line velocity based on the Navier-Stokes-Cahn-Hilliard equations35, 36,
| (7) |
The wetted part of ridged surface is divided into smooth sections. Here, in Eq. (7) is the local dynamic contact angle formed between the liquid interface and the th section of the structured surface. We assume that Eq. (7) is a valid model of liquid front at any surface point 35, 36. Considering the local dynamic contact angle and velocity, we sum up the time to pass sections
| (8) |
and
| (9) | ||||
where , and are the local dynamic contact angle, contact line velocity, and length of section respectively, and is the global apparent dynamic contact angle. The above effective spreading model is similar to that used in Lee et al.36. Compared to the sawtooth geometries analyzed by Lee et. al.36., the geometry studied here is more complicated as it includes backward facing sections and sharper angles. The present model accounts for the backward facing part of the structure. The droplet interface is assumed to be linear with a constant angle , and the surface after the leap point is assumed to be not wetted. The wetted area is colored red in Fig. 5(a).
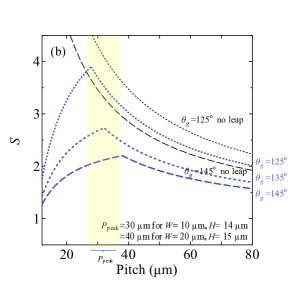
Figure 5(b) shows the dependence of on the pitch obtained from the model for three different local dynamic contact angles. We observe that the model captures the trend of the resistance due to surface texture relatively well, confirming that line-friction is the dominating physical resistance for the spreading. The spread-and-leap model explains the – perhaps counter-intuitive – fast spreading for small pitch. Without taking into account the leaping, a spreading model where all solid is wetted will overestimate significantly (Fig. 5b). The model also predicts the pitch that gives the maximum , . For W= 10 m, is 32 m, 39 m for W=15 m, and 43 m for W=20 m (obtained assuming ). The estimate of explains why the non-monotonic behaviour is observed only for W=20 m. For W=10 m and 15 m, each is below . However for W=20 m, is close to the intermediate pitch 40 m, therefore the non-monotonic behavior is observed.
4.3 Scaling analysis for stick-and-leap regime
The spreading in the direction with the inclination is in stick-and-leap regime. The contact line travels on the tip of the ridges and is pinned on the corner intermittently, and the interface bulges by the liquid inertia until it makes a new contact to the next structure. To understand the role of pinning, we perform a simple scaling analysis. In the direction with the inclination, Young’s force is balanced both by inertia and line friction. Here, Young’s force accelerates the spreading motion when the contact line is pulled over the structure (W2 W3 in Fig. 3f), and then adds to the droplet inertia. When the contact line reaches the acute corner at W3, it is momentarily pinned there. The contact line remains pinned until the inertia in the droplet brings the local dynamic contact angle out of equilibrium such that the droplet interface can make contact with the solid in the forward direction.
Assuming the surface energy is distributed to the kinetic energy over a whole droplet during the spreading on the top of the ridge, we have
| (10) |
and
| (11) |
where is the initial radius of the droplet, is the width of the ridge, is the space between the ridges, and is a characteristic velocity for inertia. The prefactor in Eq. (11) can be neglected for simplicity.
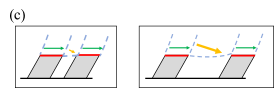
Based on this physical insight as depicted in Fig. 5(c), we can model the passage time for stick-and-leap as
| (12) |
Here, the first term quantifies the balance between Young’s force and line friction, i.e., the travel time for the interface to move over the top of the ridge of width . The second term quantifies the pinning time, i.e., the time needed for inertia to push the interface to the next ridge, leaping the distance . Recalling that , we can formulate the passage time as
| (13) |
We observe that the second term dominates when inertia is much larger than the line friction (). For , in Eq. (13) saturates to the constant value . In our scaling analysis, we have assumed that this saturation value is reached when the liquid-gas interface remains pinned at the acute corner infinitely long.
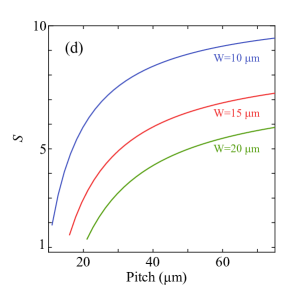
Figure 5(d) presents obtained from Eq. (13) for different ridge widths. We observe that the scaling estimates for stick-and-slip correctly capture the trend of increasing passage time with increasing pitch. The scaling analysis shows that inertia plays a central role in the stick-and-leap regime, in contrast to spread-and-leap in the direction against inclination. Surface energy is converted to the kinetic energy of the droplet ( inertia) while the contact line spreads on the top of the ridge, and inertia drives the liquid front to reach the next rise of the surface during the stick-and-leap at corners (W2 in Fig. 3f).
We note that the advancement of the contact line is primarily determined by the line friction and the geometrical details of the structure when moving against the inclination, but that it is inertial when moving with the inclination.
5 Conclusions
We have presented a comprehensive study of rapid wetting on complex asymmetric microstructures. We identified three wetting regimes, denoted as spread, stick, and leap. By coordinated simulations and experiments we can follow the passage of the contact line over the microstructure in detail and formulate a model as well as scaling estimates that explain how the geometrical features determine the macroscopic wetting speed. We showed that when wetting proceeds against the inclination of the ridges, a spread-and-leap behavior underpins the wetting and the driving Young’s force is primarily balanced by contact line friction. In contrast, when the spreading direction is with the inclination, a stick-and-leap behavior is observed, and it is the liquid inertia that limits the wetting speed. Our experiments and theory show that leaping phenomenon plays a central role in increasing the spreading speed compared to a surface textured without leaping. We believe that this newly identified spreading mechanism forms the foundation to design surface structures for controlling wetting under realistic unsteady environments.
Conflicts of interest
There are no conflicts to declare.
Acknowledgements
This work was supported by the Swedish Research Council (VR 2015-04019). S.B acknowledges the support of the Swedish Foundation of Strategic research (SSF-FFL6). We thank Calvin J. Brett at KTH for his kind help for SEM measurements.
- Liu et al. 2017 M. Liu, S. Wang and L. Jiang, Nature Reviews Materials, 2017, 2, 17036.
- Guo and Liu 2007 Z. Guo and W. Liu, Plant Science, 2007, 172, 1103 – 1112.
- Chen et al. 2016 H. Chen, P. Zhang, L. Zhang, H. Liu, Y. Jiang, D. Zhang, Z. Han and L. Jiang, Nature, 2016, 532, 85.
- Bohn and Federle 2004 H. F. Bohn and W. Federle, Proceedings of the National Academy of Sciences, 2004, 101, 14138–14143.
- Guo et al. 2012 P. Guo, Y. Zheng, C. Liu, J. Ju and L. Jiang, Soft Matter, 2012, 8, 1770.
- Ju et al. 2012 J. Ju, H. Bai, Y. Zheng, T. Zhao, R. Fang and L. Jiang, Nature Communications, 2012, 3, 1247.
- E and Gutoff 1992 C. E and E. Gutoff, Modern Coating and Drying Technology, John Wiley and Sons, Inc., New York, 1992.
- Chu et al. 2010 K. H. Chu, R. Xiao and E. N. Wang, Nature Materials, 2010, 9, 413–417.
- Holmes and Böhringer 2015 H. R. Holmes and K. F. Böhringer, Microsystems & Nanoengineering, 2015, 1, 15022.
- Malvadkar et al. 2010 N. A. Malvadkar, M. J. Hancock, K. Sekeroglu, W. J. Dressick and M. C. Demirel, Nat. Mat., 2010, 9, 1023.
- Lin et al. 2018 Y. Lin, Z. Hu, C. Gao, Z. Guo, C. Li and Y. Zheng, Advanced Materials Interfaces, 2018, 5, 1800962.
- Li et al. 2016 C. Li, N. Li, X. Zhang, Z. Dong, H. Chen and L. Jiang, Angewandte Chemie - International Edition, 2016, 100191, 14988–14992.
- Zhang et al. 2017 P. Zhang, L. Zhang, H. Chen, Z. Dong and D. Zhang, Advanced Materials, 2017, 1702995, 1–7.
- Bonn et al. 2009 D. Bonn, J. Eggers, J. Indekeu, J. Meunier and E. Rolley, Rev. Mod. Phys., 2009, 81, 739.
- Tanner 1979 L. H. Tanner, J. Phys. D, 1979, 12, year.
- Yu et al. 2018 C. Yu, C. Li, C. Gao, Z. Dong, L. Wu and L. Jiang, ACS Nano, 2018, 12, 5149–5157.
- Si et al. 2018 Y. Si, T. Wang, C. Li, C. Yu, N. Li, C. Gao, Z. Dong and L. Jiang, ACS Nano, 2018, 12, 9214–9222.
- Shastry et al. 2006 A. Shastry, M. J. Case and K. F. Böhringer, Langmuir, 2006, 22, 6161–6167.
- Liu et al. 2017 C. Liu, J. Sun, J. Li, C. Xiang, L. Che, Z. Wang and X. Zhou, Scientific Reports, 2017, 7, 1–8.
- Cavalli et al. 2013 A. Cavalli, M. L. Blow and J. M. Yeomans, Soft Matter, 2013, 9, 6862.
- Chamakos et al. 2016 N. T. Chamakos, G. Karapetsas and A. G. Papathanasiou, Colloids and Surfaces A, 2016, 511, 180.
- Li et al. 2016 J. Li, Y. Hou, Y. Liu, C. Hao, M. Li, M. K. Chaudhury, S. Yao and Z. Wang, Nature Physics, 2016, 12, 606–612.
- Agapov et al. 2014 R. L. Agapov, J. B. Boreyko, D. P. Briggs, B. R. Srijanto, S. T. Retterer, C. P. Collier and N. V. Lavrik, Adv. Mat. Interfaces, 2014, 1, 1.
- Habibi et al. 2016 M. Habibi, M. Eslamian, F. Soltani-Kordshuli and F. Zabihi, Journal of Coatings Technology and Research, 2016, 13, 211–225.
- Vo and Tran 2018 Q. Vo and T. Tran, Phys. Rev. E, 2018, 97, 063101.
- Do-Quang et al. 2015 M. Do-Quang, J. Shiomi and G. Amberg, Eur. Phys. Lett., 2015, 110, 46002.
- Mori et al. 1982 Y. Mori, T. van de Ven and S. Mason, Colloids and Surfaces, 1982, 4, 1 – 15.
- Bird et al. 2008 J. C. Bird, S. Mandre and H. A. Stone, Phys. Rev. Lett., 2008, 100, 1.
- Hansson et al. 2016 J. Hansson, H. Yasuga, T. Haraldsson and W. van der Wijngaart, Lab Chip, 2016, 16, 298.
- Carlson et al. 2009 A. Carlson, M. Do-Quang and G. Amberg, Phys. Fluids, 2009, 21, 1.
- Carlson et al. 2012 A. Carlson, G. Bellani and G. Amberg, Phys. Rev. E, 2012, 85, 1.
- Quéré 2008 D. Quéré, Annual Review of Materials Research, 2008, 38, 71–99.
- Wang et al. 2015 J. Wang, M. Do-Quang, J. J. Cannon, F. Yue, Y. Suzuki, G. Amberg and J. Shiomi, Sci. Rep., 2015, 5, 8474.
- Johansson and Hess 2018 P. Johansson and B. Hess, Phys. Rev. Fluids, 2018, 3, 074201.
- Yue and Feng 2011 P. Yue and J. J. Feng, Phys. Fluids, 2011, 23, 012106.
- Lee et al. 2019 Y. Lee, N. Matsushima, S. Yada, S. Nita, T. Kodama, G. Amberg and J. Shiomi, Scientific Reports, 2019, 9, 7787.