Phonon thermal Hall effect in strontium titanate
Abstract
It has been known for more than a decade that phonons can produce an off-diagonal thermal conductivity in presence of magnetic field. Recent studies of thermal Hall conductivity, , in a variety of contexts, however, have assumed a negligibly small phonon contribution. We present a study of in quantum paraelectric SrTiO3, which is a non-magnetic insulator and find that its peak value exceeds what has been reported in any other insulator, including those in which the signal has been qualified as ’giant’. Remarkably, and peak at the same temperature and the former decreases faster than the latter at both sides of the peak. Interestingly, in the case of La2CuO4 and -RuCl3, and peak also at the same temperature. We also studied KTaO3 and found a small signal, indicating that a sizable is not a generic feature of quantum paraelectrics. Combined to other observations, this points to a crucial role played by antiferrodistortive domains in generating of this solid.
In most insulators, thermal conductivity can be understood with reasonable accuracy by picturing phonons as carriers of heat scattered either by other phonons or by defects and boundaries Berman . An impressive agreement between experimental data near room temperature and ab initio solutions of the Peierls-Boltzmann equation has been achieved in the last few years Lindsay2019 . Since phonons are neutral quasi-particles lacking magnetic moment, one may assume that their path is not affected by a magnetic field and therefore, in contrast to magnons and electrons, they cannot give rise to a transverse response. However, experiments carried out more than a decade ago Strohm2005 showed that there is a finite measurable phonon Hall effect. The appearance of a finite transverse thermal gradient upon application of a longitudinal heat current, implied a finite in Tb3Ga3O12, a paramagnetic insulator Strohm2005 ; Inyushkin2007 . The experimental observation motivated numerous theoretical studies Sheng2006 ; Kagan2008 ; Wang2009 ; Zhang2010 ; Agarwalla ; Qin2012 ; Mori2014 invoking a variety of possible sources of phonon Hall effect including spin-phonon coupling Sheng2006 ; Kagan2008 ; Wang2009 , phonon Berry curvature Zhang2010 ; Qin2012 , skew scattering Mori2014 or simply ionic bonding Agarwalla .
During the past few years, thermal Hall effect was studied in magnetic insulators Onose2010 ; Liu2017 ; Murakami2017 , spin-liquid candidates Hirschberger2015 ; Sugii2017 and multi-ferroics Ideue2017 . These studies of mostly assumed a marginal contribution by phonons and the detected signal was often (but not always Sugii2017 ) attributed to magnetic excitations. More recently, has been measured in the Kitaev spin-liquid candidate -RuCl3 Kasahara2018 ; Kasahara2018n ; Hentrich2019 and in cuprates Grissonnanche2019 . In both cases, the observed signal was assumed to exceed significantly what could be purely a phononic contribution.
In this paper, we present a study of thermal Hall effect in SrTiO3 crystals, a quantum paraelectric Müller1979 with a variety of remarkable properties Collignon2018 . We found a sizable in this solid. Since phonons are the unique heat carriers in this non-magnetic band insulator, it is hard to see how carriers other than phonons can cause the observed . The magnitude of the observed signal is twice larger than what was reported in LaCuO4 Grissonnanche2019 . However, at 15T, remains 400 times smaller than and calling this a ‘giant’ thermal Hall effect Ideue2017 ; Grissonnanche2019 does not appear as an illuminating choice.
The study of three different crystals showed that while the peak can vary from one sample to another, the overall temperature dependence remains the same. This sample dependence is reminiscent of what was reported in -RuCl3 Kasahara2018 ; Kasahara2018n ; Hentrich2019 . Comparing the temperature dependence of and in SrTiO3, it becomes clear that they both peak at the same temperature, but the decrease in is sharper both below and above the peak temperature. We note that in both -RuCl3 Hentrich2019 and La2CuO4 Grissonnanche2019 and peak at the same temperature. We also studied KTaO3, another quantum paraelectric with no antiferrodistortive transition and found that its is much smaller. This observation indicates a crucial role played by polar domain walls of SrTiO3 in generating . This hypothesis is strengthened by detailed study of how the amplitude of the signal in the same sample is affected by its thermal history after trips across the 105 K structural transition.
A member of the perovskite ABO3 family, SrTiO3 avoids a ferroelectric instability thanks to the quantum fluctuations Müller1979 . Upon the introduction of a tiny amount of mobile electrons, this wide-gap insulator turns to a dilute metal Spinelli subject to a superconducting instability Schooley1964 ; Lin2013 and displaying non-trivial charge transport at room temperature Lin2017 . Its cubic crystal structure at room temperature is lost below 105K Shirane1969 . This structural transition is antiferrodistortive (AFD): neighboring TiO6 octahedra tilt clockwise and anti-clockwise. As a consequence, the tiny tetragonal distortion generates significant anisotropy in charge transport Tao2016 . In absence of strain, three possible domains can be present Tao2016 . The polar walls between these micrometric domains have been a subject of numerous studies Buckley1999 ; Scott2012 ; Salje2013 .
Previous studies of heat transport in this solid Steigmeier ; Lin2014Martelli2018 uncovered two remarkable features. In a pioneer study, Steigmeier Steigmeier determined the temperature dependence of the thermal conductivity (which peaks to 30 W/K-m at T), and found that below the maximum, it depends on the applied electric field. More recently, Martelli and co-workers Martelli2018 found that thermal conductivity decreases faster than below the peak. Such a behavior has only been observed in a handful of solids and attributed to the Poiseuille flow of phonons Beck , triggered by abundant normal (i.e. momentum-conserving) collisions among phonons. Soft phonons, either those associated with the antiferrodistortive transition Yamada1969 ; Vogt , or modes corresponding to the aborted ferroelectricity Vogt , are suspected to drive these unusual features of heat transport Martelli2018 . This may also be the case of the observation reported in the present paper.
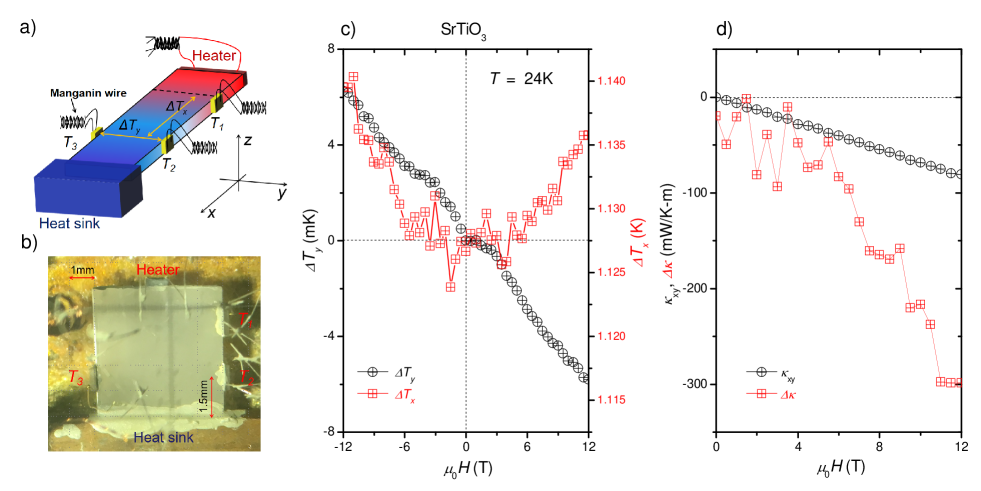
We measured the thermal Hall effect by using a one-heater-three-thermometers method as shown in Fig. 1a,b (See the Supplemental Material supplement , for more details). Fig. 1c-d shows the data at 24 K. As seen in Fig. 1c, Tx is an even and Ty is an odd function of magnetic field. Ty, shifted vertically to zero by a tiny quantity due to unavoidable misalignment between and , has opposite signs for positive and negative magnetic fields, which implies , as one would expect for the off-diagonal component of the conductivity tensor. On the other hand, Tx is finite at zero field and increases symmetrically with applied magnetic field implying .
The field dependence of thermal Hall conductivity and the field-induced change in thermal conductivity at T= 24 K are plotted in Fig. 1d. The magnitude of attains -80 mW/K-m, twice larger than the maximum observed in cuprates Grissonnanche2019 . As seen in the figure, however, this is four times smaller than the field-induced change in longitudinal thermal conductivity, , itself about one percent of total signal. We note that Jin et al. Jin2015 have recently reported on a similar field-induced decrease in the lattice thermal conductivity of another band insulator.
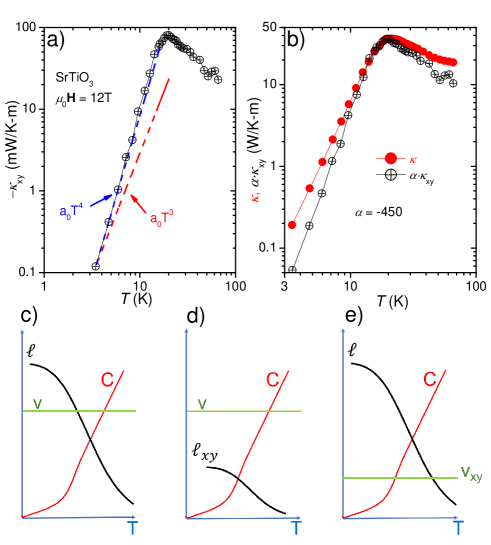
The temperature dependence of in SrTiO3 is shown in Fig. 2a. As seen in the figure, in a magnetic field of 12 T, it peaks to -0.08 W/K-m at and falls rapidly at both sides of this peak. Panel b presents a comparison of the temperature dependence of and , with the former multiplied by a factor . Both peak at the same temperature, but the decrease in is faster on either sides of the maximum. As found previously Martelli2018 , in SrTiO3 follows Tβ (with slightly larger than 3) below the peak temperature. decreases even more sharply in this regime, and it almost follows a temperature dependence. With warming, the drop in the transverse signal is slightly sharper than the drop in the longitudinal one.
A phenomenological picture of equates it with a product of specific heat, C, velocity, v, and mean-free-path, . This should be summed over different phonon modes, indexed :
| (1) |
Here, is a dimension-dependent normalisation factor. Usually, the variation of sound velocity with temperature is negligible. Indeed, the experimentally measured elastic moduli of SrTiO3 Rehwald (and therefore its sound velocity) changes by less than a few percent in our temperature range of interest. The thermal evolution of the mean-free-path and the specific heat, on the other hand, is strong and opposite to each other (see Fig. 2c). Therefore, in an insulator peaks at a temperature where the global phonon trajectory (i.e. phonon population times phonon mean-free-path) is maximal. This temperature has a physical significance. Thermal conductivity is most vulnerable to the introduction of point defects near this peak temperature Berman . Our observation that peaks at this very temperature is a source of information on what causes the transverse signal. Phenomenologically, a finite implies either an off-diagonal (temperature-independent) velocity or an off-diagonal (temperature-dependent) mean-free-path. Therefore:
| (2) |
Presumably, and are both much smaller than their longitudinal counterparts as sketched in Fig. 2d and Fig. 2e. Therefore, the fact that peaks at the same temperature but decreases faster may be ascribed to one of the right-hand terms of equation 2 or their combination.
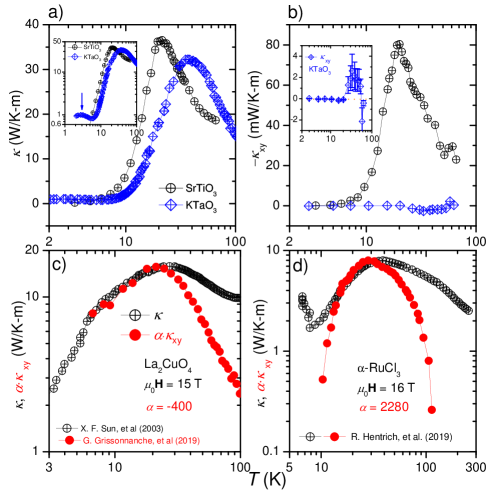
The magnitude of in strontium titanate is two orders of magnitude larger than what was reported for Tb3Ga3O12 Inyushkin2007 . This raises a natural question: can proximity to a ferroelectric (FE) quantum criticality Rowley play a role in generating a large phonon thermal Hall effect? In order to answer this question, we investigated heat transport in KTaO3. This insulator, like SrTiO3, is close to a FE transition, but its low-temperature electric permittivity is five times smaller Lowndes1973 .
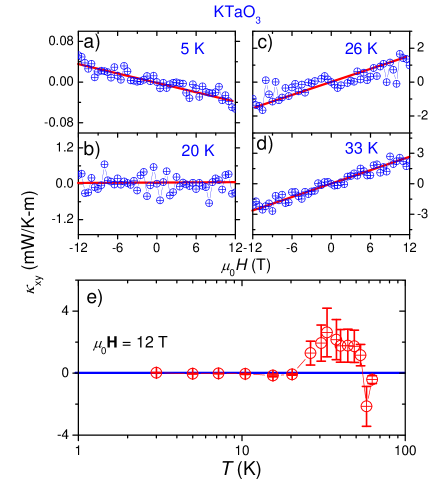
In agreement with what was reported before for KTaO3 Tachibana2008 and SrTiO3 Steigmeier ; Martelli2018 , we found that the amplitude of the peak in longitudinal thermal conductivity is comparable (30-35 W/K-m) in the two perovskites (see Fig. 3a). On the other hand, the amplitude of the thermal Hall conductivity is very different. In KTaO3, is more than one order of magnitude smaller than in SrTiO3 (Fig. 3b). Let us note that even in the case of longitudinal thermal conductivity, there are remarkable differences between these two solids. Around T 5K, thermal conductivity is sharply decreasing (displaying a faster than cubic temperature dependence) in SrTiO3 but is increasing (presenting an additional bump, as seen in the inset of Fig. 3a in KTaO3. In other words, the consequences of anharmonicity for longitudinal heat transport is qualitatively different in these two apparently similar solids. Structurally, the most notable difference is the absence of the AFD transition in cubic KTaO3 Barrett1968 , in contrast to its presence in SrTiO3. This is our first evidence that this peculiar structural transition plays a role in setting the amplitude of .
The correlation between the position of peaks in longitudinal and transverse response in SrTiO3 and KTaO3 led us to put under scrutiny the published data in two other insulators. As seen in Fig. 3c-d, according to the available data, there is a similar correlation between and in both La2CuO4 Sun2003 ; Grissonnanche2019 and in -RuCl3 Hentrich2019 . In all cases, and peak at almost the same temperature and the decrease in is sharper (or in one case almost equal) to the decrease in . We notice that this correlation, which was not reported before, indicates a major role played by the principal heat carriers in setting the transverse response.
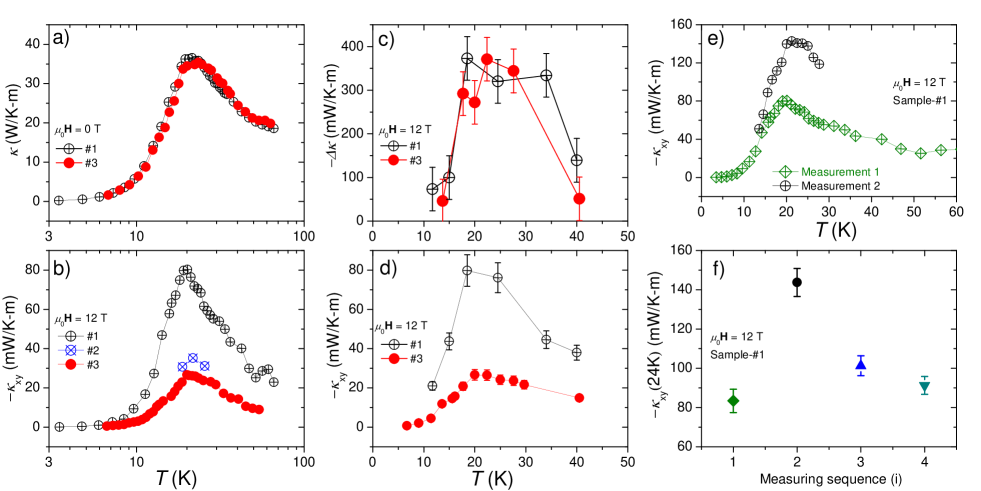
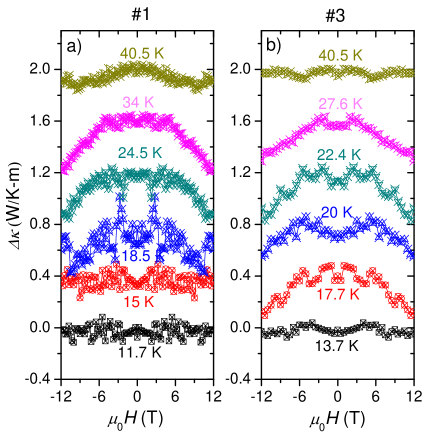
Our additional measurements build up the case for a prominent role played by AFD domains. The results are shown in Fig. 4. First of all, we studied three different SrTiO3 samples, provided by two different companies. As shown in Fig. 4a-b, all three samples show a sizable , but different amplitudes. Two samples in which the magnitude of is almost the same (panel a), display a threefold difference in their peak of (panel b, d). As seen in panel (c), the field-induced decrease in is roughly the same in the two samples.
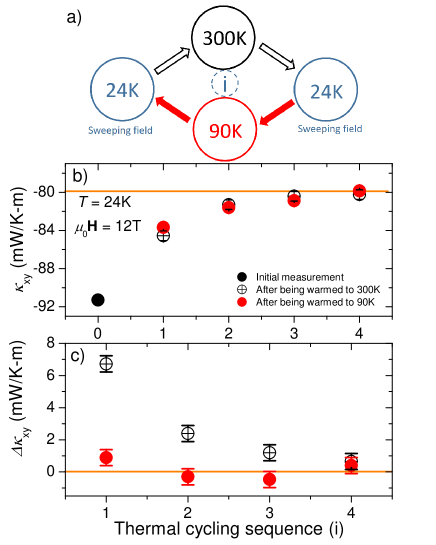
In a second set of measurements, we repeated our measurements of on the same sample after warming it above T K and cooling it back again. As seen in Fig. 4e-f (for more details, see the Supplemental Materials supplement ), warming above the AFD transition temperature can change the magnitude of (T=24 K) in the same sample.
Buckley et al. Buckley1999 observed needle-like structural domains below 105 K in SrTiO3 and “found almost no memory of the domain patterns under repeated heating and cooling through the transition point”Buckley1999 . The typical size of the observed domains was a micron, comparable to the apparent phonon mean-free-path extracted from longitudinal thermal conductivity and specific heat Martelli2018 . An intimate link between domain configuration and the amplitude of would explain why the amplitude of can be different after thermal cycling above TAFD, wiping out the previous configuration of domains. Obviously, the sample dependence of the signal and its virtual absence in KTaO3 also find natural explanations.
Theoretical scenarios for phonon thermal Hall effect Sheng2006 ; Kagan2008 ; Wang2009 ; Zhang2010 ; Agarwalla ; Qin2012 ; Mori2014 either invoke skew scattering of heat carriers or let the magnetic field generate a transverse velocity. Let us have a look to our results in either of these schemes. One may be tempted to attribute the observed to skew scattering of phonons by the AFD domain walls, which according to a number of experiments Scott2012 ; Salje2013 are polar. However, the skew-scattering picture would have a hard time to explain the disconnection between the field-induced decrease in and the finite (Fig. 4c, d). Alternatively, one may point to the fact that the slight tetragonal distortion leads to quasi-degenerate acoustic phonon modes and it has been suggested Bussmann that the acoustic phonons hybridize with the transverse optical phonons. Thanks to these features, the magnetic field may become able to couple to titanium-oxygen ionic bonds Agarwalla and generate a transverse velocity. Presumably, this should crucially depend on the relative orientation of the magnetic field and each of the three tetragonal domains; hence a dependence on precise domain configuration. Note that Ab initio theoretical calculations find imaginary frequencies Ashauer for strontium titanate. Two recent theoretical studies succeeded in finding real phonon frequencies Feng ; Tadano . However, the focus of both was the cubic state and the phonon spectrum below the AFD transition remains unknown. Future theoretical studies may fill this void. Future experiments may use strain to control the configuration of domains.
In summary, phonons in SrTiO3 can generate a larger than what was reported in any other insulator. This is not generic to all quantum paraelectric solids and appear to be intimately linked to the occurrence of antiferrodistortive (AFD) transition in SrTiO3. We find that not only in SrTiO3, but also in other insulators and peak at the same temperature. The observation appears as a clue to identify carriers and collisions which generate the transverse signal. In the case of SrTiO3, two experimental observations point to the role of tetragonal domains in generating the signal.
We are grateful to Jing-yuan Chen, Gaël Grissonnanche, Steve Kivelson and Louis Taillefer for stimulating discussions. This work was supported by the Agence Nationale de la Recherche (ANR-18-CE92-0020-01). B. F. acknowledges support from Jeunes Equipes de l’Institut de Physique du Collge de France (JEIP). Z. Z. acknowledges support from the National Science Foundation of China (Grant No. 11574097 and No. 51861135104) and The National Key Research and Development Program of China (Grant No.2016YFA0401704). X. L. acknowledges a PhD scholarship by the China Scholarship Council (CSC).
References
- (1) R. Berman, Thermal Conduction in Solids, Oxford University Press, Oxford (1976).
- (2) L. Lindsay, A. Katre, A. Cepellotti, and N. Mingo, J. Appl. Phys. ADVTHRM2019, 050902 (2019).
- (3) C. Strohm, G. L. J. A. Rikken, and P. Wyder, Phys. Rev. Lett. 95, 155901 (2005).
- (4) A. V. Inyushkin and A. N. Taldenkov, JETP Lett. 86, 379 (2007).
- (5) L. Sheng, D. N. Sheng, and C. S. Ting, Phys. Rev. Lett. 96, 155901 (2006).
- (6) Yu. Kagan and L. A. Maksimov, Phys. Rev. Lett. 100, 145902 (2008).
- (7) J.-S. Wang and L. Zhang, Phys. Rev. B 80, 012301 (2009).
- (8) L. Zhang, J. Ren, J.-S. Wang, and B. Li, Phys. Rev. Lett. 105, 225901 (2010).
- (9) T. Qin, J. Zhou, and J. Shi, Phys. Rev. B 86, 104305 (2012).
- (10) M. Mori, A. Spencer-Smith, O. P. Sushkov, and S. Maekawa, Phys. Rev. Lett. 113, 265901 (2014).
- (11) B. K. Agarwalla, L. Zhang, J.-S. Wang, and B. Li, Eur. Phys. J. B 81, 197 (2011)
- (12) Y. Onose, T. Ideue, H. Katsura, Y. Shiomi, N. Nagaosa, and Y. Tokura, Science 329, 297 (2010).
- (13) J. Liu, L.J. Cornelissen, J. Shan, T. Kuschel, and B.J. van Wees, Phys. Rev. B 95, 140402 (2017).
- (14) S. Murakami, and A. Okamoto, J. Phys. Soc. Jpn. 86, 011010 (2017).
- (15) M. Hirschberger, J. W. Krizan, R. J. Cava, N. P. Ong, Science 348, 106 (2015).
- (16) K. Sugii, M. Shimozawa, D. Watanabe, Y. Suzuki, M. Halim, M. Kimata, Y. Matsumoto, S. Nakatsuji, and M. Yamashita, Phys. Rev. Lett. 118, 145902 (2017).
- (17) T. Ideue, T. Kurumaji, S. Ishiwata, and Y. Tokura, Nat. Mater. 16, 797 (2017).
- (18) Y. Kasahara, K. Sugii, T. Ohnishi, M. Shimozawa, M. Yamashita, N. Kurita, H. Tanaka, J. Nasu, Y. Motome, T. Shibauchi, and Y. Matsuda, Phys. Rev. Lett. 120, 217205 (2018).
- (19) Y. Kasahara, T. Ohnishi, Y. Mizukami, O. Tanaka, S. Ma, K. Sugii, N. Kurita, H. Tanaka, J. Nasu, Y. Motome, T. Shibauchi, and Y. Matsuda, Nature (London) 559, 227 (2018).
- (20) R. Hentrich, M. Roslova, A. Isaeva, T. Doert, W. Brenig, B. Büchner, and C. Hess, Phys. Rev. B 99, 085136 (2019).
- (21) G. Grissonnanche, A. Legros, S. Badoux, E. Lefrançois, V. Zatko, M. Lizaire, F. Laliberté, A. Gourgout, J.-S. Zhou, S. Pyon, T. Takayama, H. Takagi, S. Ono, N. Doiron-Leyraud, and L. Taillefer, Nature 571, 376 (2019).
- (22) K.A. Müller and H. Burkard, Phys. Rev. B 19, 3593-3602 (1979).
- (23) C. Collignon, X. Lin, C. W. Rischau, B. Fauqueé, and K. Behnia, Annu. Rev. Condens. Matter Phys. 10, 25-44 (2019).
- (24) A. Spinelli, M. A. Torija, C. Liu, C. Jan and C. Leighton, 2010. Phys. Rev. B 81, 155110 (2010)
- (25) J. F. Schooley, W. R. Hosler, and M. L. Cohen, Phys. Rev. Lett. 12, 474 (1964).
- (26) X. Lin, Z. Zhu, B. Fauqueé, and K. Behnia, Phys. Rev. X 3, 021002 (2013).
- (27) X. Lin, C.W. Rischau, L. Buchauer, A. Jaoui, B. Fauqu´e, and K. Behnia, npj Quantum Mater. 2, 41 (2017).
- (28) G. Shirane and Y. Yamada, Phys. Rev. 177, 858 (1969).
- (29) Q. Tao, B. Loret, B. Xu, X. Yang, C. W. Rischau, X. Lin, B. Fauqueé, M. J. Verstraete, and K. Behnia, Phys. Rev. B 94, 035111 (2016).
- (30) A. Buckley, J. P. Rivera, and E. K. H. Salje, J. Appl. Phys. 86, 1653 (1999).
- (31) J. F. Scott, E. K. H. Salje, and M. A. Carpenter, Phys. Rev. Lett. 109, 187601 (2012).
- (32) E. K. H. Salje, O. Aktas, M. A. Carpenter, V. V. Laguta, and J. F. Scott, Phys. Rev. Lett. 111, 247603 (2013).
- (33) E. F. Steigmeier, Phys. Rev. 168, 523 (1968).
- (34) X. Lin et al. , Phys. Rev. B 90, 140508(R) (2014).
- (35) V. Martelli, J. L. Jiménez, M. Continentino, E. Baggio-Saitovitch, and K. Behnia, Phys. Rev. Lett. 129, 125901 (2018).
- (36) H. Beck, P. F. Meier, and A. Thellung, Phys. Status Solidi (a) 24, 11 (1974).
- (37) Y. Yamada and G. Shirane, J. Phys. Soc. Jpn. 26, 396 (1969).
- (38) H. Vogt, Phys. Rev. B 51, 8046 (1995).
- (39) See the supplemental material.
- (40) H. Jin, O. D. Restrepo, N. Antolin, S. R. Boona, W. Windl, R. C. Myers, and J. P. Heremans, Nat. Mater. 14, 601 (2015).
- (41) W. Rehwald, Solid State Commun. 8, 1483 (1970).
- (42) S. E. Rowley et al., Nature Physics, 10, 367 (2014)
- (43) R P Lowndes and A Rastogi, J. Phys. C: Solid State Phys. 6, 932 (1973)
- (44) M. Tachibana, T. Kolodiazhnyi, and E. Takayama-Muromachi, Appl. Phys. Lett, 93, 092902 (2008).
- (45) H.H. Barrett, Phys. Lett. A 26, 217 (1968)
- (46) X. F. Sun, J. Takeya, S. Komiya, and Y. Ando, Phys. Rev. B 67, 104503 (2003).
- (47) A. Bussmann-Holder, Phys. Rev. B 56, 10762 (1997).
- (48) U. Aschauer and N. A. Spaldin, J. Phys. Condens. Matter 26, 122203 (2014).
- (49) L. Feng, T. Shiga, and J. Shiomi, Appl. Phys. Express 8, 071501 (2015).
- (50) T. Tadano and S. Tsuneyuki, Phys. Rev. B 92, 054301 (2015).
Supplemental Material for “Phonon thermal Hall effect in strontium titanate”
S1 Samples and measurement technique
Single crystals of SrTiO3 and KTaO3 were obtained commercially. The dimensions of the SrTiO3 samples (#1 and #2 from SurfaceNet, #3 from CrysTech) were and their orientation along (100). The KTaO3 sample had a dimension of . Three thermometers (Cernox-1030) were used to simultaneously measure the longitudinal and transverse thermal gradient. A one-heater-three-thermometers technique was employed. The heat flow was applied along the x-axis and the magnetic field oriented along the z-axis. Then the longitudinal (Tx= T1-T2) and the transverse (Ty= T3-T2) temperature difference were detected simultaneously using three resistive chips (Cernox-1030), measuring T1, T2 and T3. The longitudinal () and the transverse () thermal conductivity were obtained using:
| (S1) |
| (S2) |
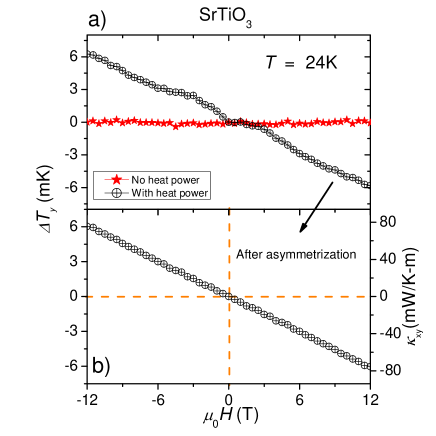
Here, , , , are the heat power, length between T1 and T2, the sample width and thickness respectively. All the measurements were performed in a PPMS (Physical Property Measurement System) within a stable high-vacuum sample chamber. The thermal gradient in the sample was produced through a 1k chip resistor alimented by a DC current source (Keithley 6220). The DC voltage on the heater was measured through a Keithley 2000. Three lock-in amplifiers (SR830) were used to monitor the T1, T2 and Ty in AC mode at low frequency (f 17Hz). In order to attain a higher resolution, was measured in a differential mode: the difference between the T2 and T3 resistances was measured by a lock-in amplifier after being amplified by 100. Both field-sweeping and temperature-sweeping protocols were used in measuring and the two sets of data were found to match.
S2 Suppression of the background signal
As seen in Fig. S1, there is a small change in the transverse thermal gradient () induced by the magnetic field even in absence of an applied heat. This background signal has two origins. First of all, the resistive chips have a finite magnetoresistance. This can be reduced by choosing two very similar thermometers. The other source of this background is the misalignment between transverse electrodes. Both effects (magneto-resistance and misalignment) are expected to be symmetric with the magnetic field, in contrast to the intrinsic thermal Hall effect signal. As illustrated in Fig. S1a (black circles), the measured signal is dominantly odd. To extract the purely asymmetric component of the raw data, we anti-symmetrized it: ( = (). The extracted signal is linear with the magnetic field as shown in Fig. S1b.
S3 Dependence on heat power
Combining equations S1 and S2, we get:
| (S3) |
| (S4) |
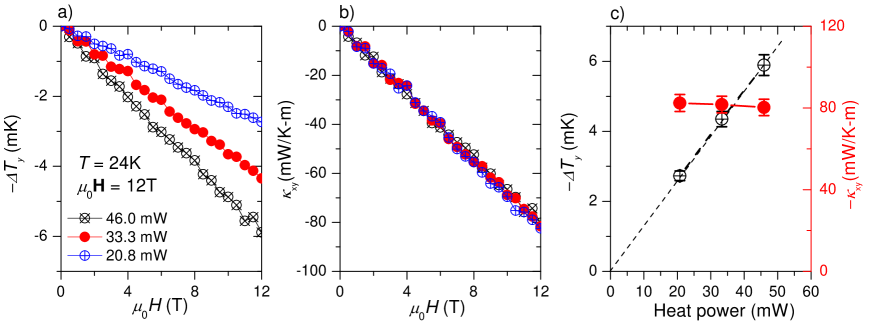
According to the formula S4, the transverse temperature difference is expected to be linear with the heat power. Fig. S2a-b presents data obtained with three different heat powers (=20.8 mW, 33.3 mW amd 46.0 mW) applied to the same sample kept at the temperature of 24K. As expected, is the same and is a linear function of the heat power (Fig. S2c).
S4 Thermal Hall conductivity of KTO
As discussed in the main text, we observed a very small signal in KTaO3, about 30 times smaller than in SrTiO3. of KTaO3 has a peak about 3 mW/K-m, which is 1/12000 of . We swept the field from +12T to -12T at different temperatures. In Fig. S3a-d, four typical curves are shown. After extracting the value at 12T, we determined the temperature dependence of , shown in Fig. S3e. We note that of KTaO3 is positive at its peak value, in contrast to SrTiO3 and La2CuO4. Error bars in Fig. S3e are large. This is because, we needed to apply a quite large heat power (50-80mW above 20K) to detect a of such a small magnitude in KTaO3. This large heat power will generate a large thermal gradient (1K/mm) and difference (3K between and ) on the sample, which will introduce a large error. To ensure the reliability of the data, we estimate this error large as 50. This is added to the error from scattered data points in .
S5 Thermal history measurements
We reported four sequences of thermal measurement in the main manuscript (Fig. 4f). Each sequence of measurement was separated from the previous one by a warming process to room temperature and staying in air for several days. What we report here is a second set of thermal history measurements, in which each thermal cycle has two different warming temperature points, 300K and 90K, above and below the AFD transition temperature (105K) respectively. After an initial measurement of by sweeping field from +12T to -12T at 24K (labelled as thermal circling sequence 0), two other field sweeps and measurements were performed at 24K. In each case the sample was warmed to 300K and to 90K and was kept in high-vacuum for hours (see Fig. S4a). Such thermal circles were repeated four times and the results are shown in Fig. S4b-c. It’s obvious that warming to 300K can significantly change the , but not warming to 90K . This observation points out to the role of AFD domains in setting the magnitude of . Interestingly, after three cycles, is gradually stabilized and no more affected by the thermal cycling.
S6 Field dependent thermal conductivity in STO
We also studied the The field dependence of the thermal conductivity in two SrTiO3 samples. The results, shown in Fig. S5, are roughly similar in the two samples. In the temperature range, a magnetic field of 12 T induces a change (), which is about one percent of total . The magnitude of is larger than the off-diagonal response.