Robust block magnetism in the spin ladder compound BaFe2Se3 under hydrostatic pressure
Abstract
The majority of the iron-based superconductors (FeSCs) exhibit a two-dimensional square lattice structure. Recent reports of pressure-induced superconductivity in the spin-ladder system, BaFe2X3 (X =S,Se), introduce a quasi-one-dimensional prototype and an insulating parent compound to the FeSCs. Here we report X-ray, neutron diffraction and muon spin relaxation experiments on BaFe2Se3 under hydrostatic pressure to investigate its magnetic and structural properties across the pressure-temperature phase diagram. A structural phase transition was identified at a pressure of 3.7(3) GPa. Neutron diffraction measurements at 6.8(3) GPa and 120 K show that the block magnetism persists even at these high pressures. A steady increase and then fast drop of the magnetic transition temperature and greatly reduced moment above the pressure indicate potentially rich and competing phases close to the superconducting phase in this ladder system.
In correlated electron materials, applied pressure or chemical substitution can alter the electronic structure and, concomitantly, the electron correlations, leading to wide varieties of electronic phases and phase transitions. These include metal-insulator transitions, charge density wave order, antiferromagnetism, and superconductivity (SC) McWhan et al. (1971, 1973); VUL (2006); Keimer et al. (2015); Stewart (2011); Dai (2015); Dagotto (2013). In iron-based superconductors, optimal superconductivity typically appears when the magnetic order is suppressed by the doping of carriers. Recent discoveries of pressure-induced SC around a critical pressure () of 10 GPa with the superconducting temperature up to 24 K in BaFe2X3(X = S,Se) Takahashi et al. (2015); Yamauchi et al. (2015); Ying et al. (2017) provide a new avenue for documenting the connection between magnetism and superconductivity without introducing any disorder by chemical doping. Importantly, these materials display a quasi-one-dimensional (1D) iron ladder structure Caron et al. (2011); Nambu et al. (2012) rather than the more usual square planar structure, and the parent compounds are insulators rather than poor metals. The reduced dimensionality and the metal-insulator transition preceding the superconducting phase resemble the characteristics of the cuprate system Sr14-xCaxCu24O41VUL (2006); Nagata et al. (1998). These ladder materials can thus provide important insights into the similarities and differences for both copper and iron-based superconductors.
Extensive experimental and theoretical work has been carried out on BaFe2X3 at ambient pressure Mourigal et al. (2015); Dong et al. (2014); Patel et al. (2018); Lovesey et al. (2016); Wang et al. (2017); König et al. (2018); Aoyama et al. (2019); Herbrych et al. (2018); Takubo et al. (2017). In BaFe2S3, stripe-type antiferromagnetic (AFM) order (Fig. 1 (a)) has been found below the Néel temperature () of 119 K Takahashi et al. (2015); Yamauchi et al. (2015). In contrast, BaFe2Se3 shows an exotic block-type magnetic order below 255 K Caron et al. (2011); Nambu et al. (2012). The origin of this magnetic structure was ascribed theoretically to an orbital-selective Mott (OSMP) phase from multi-orbital Hubbard models for a 1D system Luo et al. (2013); Rincón et al. (2014); Herbrych et al. (2018). Recent studies of the pressure-temperature (-) phase diagram by local magnetic probes have focused primarily on BaFe2S3, the first Fe-based spin-ladder system where pressure-induced superconductivity was reported Chi et al. (2016); Zheng et al. (2018); Materne et al. (2019). In BaFe2Se3, limited pressure-dependent experimental work has been carried out beyond transport measurements. The lack of information on the magnetic properties across the - phase diagram is particularly notable. This is a result of the experimental challenges of performing neutron diffraction experiments at simultaneous high pressure ( 2 GPa) and cryogenic temperatures, leaving a crucial gap in experimental characterization of the iron-based spin ladder systems. In addition, the sensitivity of the magnetism to the local structure and stoichiometry in different samples may produce varied magnetic behaviors Zheng et al. (2018); Saparov et al. (2011). Thus, studies on the same sample are essential to establish a unified - phase diagram.
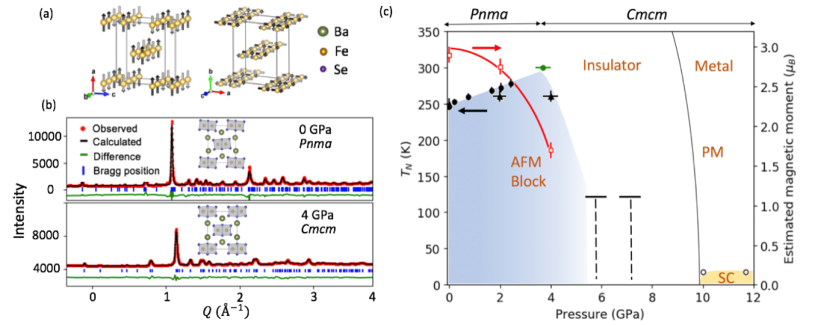
In this Letter, we present a comprehensive characterization of the magneto-structural properties of BaFe2Se3 across a large region of the - phase diagram using three complementary experimental probes at various pressure and temperature conditions: neutron powder diffraction (NPD) with pressures up to 6.8 GPa and temperatures down to 120 K, muon spin relaxation () measurements up to 2.43 GPa and down to 10 K, and X-ray powder diffraction (XRD) measurements up to 12 GPa at 300 K. Our measurements identify a structural transition from the to space group at 3.7(3) GPa. We observe a gradual enhancement of with pressure up to , followed by a considerable reduction of above . Intriguingly, the block-type magnetism in BaFe2Se3 remains stable up to the highest pressure measured by NPD (6.8 GPa), despite the fact that the crystallographic structure above is identical to that of BaFe2S3 with stripe-type magnetism. Comparison between these two ladder compounds yields important insights into the origin of the unusual block-type magnetism, and potentially the mechanism of superconductivity in these systems, greatly enriching the discussion of magnetism and superconductivity in iron-based materials.
A powder sample of BaFe2Se3 was synthesized by a self-flux solid state reaction Caron et al. (2011). NPD measurements were conducted on the Pearl at the ISIS pulsed neutron facility in the UK Bull et al. (2016). Diffraction data at ambient pressure were collected on HB3A, HFIR. measurements at ambient pressure and pressure-dependent were conducted on the beam line M20D at TRIUMF, Canada and the General Purpose Decay channel (GPD) instrument at the PSI, Switzerland Khasanov et al. (2016), respectively. Room temperature XRD experiments under pressure were performed at 12.2.2, Advanced Light Source. Experimental details are described in the supplementary information (SI).
The XRD (Fig. 1(b)) and NPD (Fig. S1) patterns at ambient conditions are well described by the structure, as verified by Rietveld refinements using the FULLPROF Suite Rodriguez-Carvajal (1990) with = 6.4. At = 4 GPa, the structure provides a significantly better fit ( = 2.8) than ( = 6.6). The main difference between the two structures is that the ladder plane is tilted with respect to the crystallographic axis in the structure (inset of Fig. 1 (b)). The critical pressure marking the transition from to is estimated to be 3.7(3) GPa Svitlyk et al. (2019), based on inspection of the diffraction patterns (Fig. S2) and the corresponding refined lattice parameters versus pressure (see below).
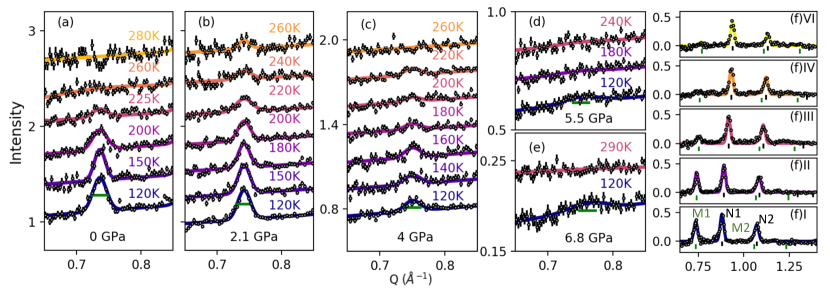
In Figure 2, we present NPD patterns at various pressures and temperatures. At ambient pressure, the diffraction patterns collected at and below 225 K show an additional Bragg reflection at , indexed as = (). The calculated pattern is consistent with an Fe4 block-type spin structure Caron et al. (2011, 2012); Nambu et al. (2012), further confirmed by Rietveld refinement of the NPD data collected on HB3A at 1.5 K (Fig. S3) with a refined ordered moment of 2.9(3) /Fe and transition temperature of 250 (5) K. With increasing pressure, this magnetic peak (broad hump for last two pressures) persists, indicating that the block magnetic state persists to the highest attainable pressure of 6.8 GPa. Refined full width at half maximum (FWHM) values (Fig. S4) suggest that this peak is Q-resolution limited at 0, 2.1, 4 GPa (the horizontal bar in Fig. 2 (a-c)). However, at 5.5 and 6.8 GPa, the width of this magnetic peak is almost twice as wide as the instrumental -resolution of (Fig. 2 (d-e)). Such broadening implies a crossover to short-range, block-type magnetic correlations, suggesting that any transition to true long-range magnetic order occurs below 120 K for 5.5 and 6.8 GPa.
At = 4 GPa (), the integrated intensity of is significantly reduced compared to that at lower pressures (33%), indicating a significant suppression of the ordered magnetic moment after the structural transition. Assuming the block-type magnetic structure but varying the spin orientations, the fits to the data (Fig. 2 (f)III) and the difference data between low and high temperature (Fig. S5) for the first two magnetic peaks (,) display slightly better results with spins perpendicular to the ladder direction ( or axis) than along the ladder direction ( axis). Importantly, above , there is no clear observation of magnetic signal associated with the stripe structure found in BaFe2S3. Bragg reflections of the stripe structure would contribute significant intensity at = 0.93 and 1.31 (for = 6.8 GPa) for spins along the axis and or axes, respectively. Given statistics of the NPD data, we place an upper limit of 0.3 for any stripe-type moment in contrast to BaFe2S3 where stripe-type order is throughout the phase. This demonstrates that the structural symmetry is not solely responsible for the block-type order in BaFe2Se3.
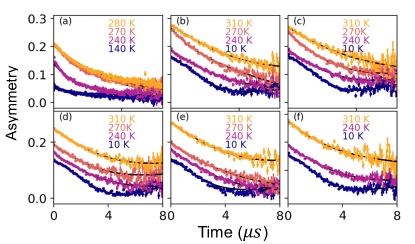
As for the pressure-dependence of , the peak at = 260 K is observed at 2.1 GPa but not 0 GPa (Fig. 2(a-b)), indicating an increase in with increasing pressure in the phase. To verify it, we now turn to pressure-dependent measurements, which have finer control on the pressure and temperature. In Fig. 3, we display temperature-dependent spectra from 0 up to 2.43 GPa collected in a zero field (ZF) configuration. The initial drop of the total asymmetry at low temperatures originates from the long-range magnetic order; from this drop, we can obtain the magnetically ordered volume fraction under various pressures.
We modelled the spectra with an exponentially relaxing component and a Kubo-Toyabe component, corresponding to muons stopping in the sample and the sample holder, respectively Khasanov et al. (2016). All fits were performed using MUSRFIT package Suter and Wojek (2012). We extracted the magnetic volume fraction () as a function of temperature for pressures up to 2.43 GPa (Fig. 4 (b)). A bulk magnetic transition is manifest as a large increase in the as the is lowered. With increasing pressure from 0 to 2.43 GPa, we observe the magnetic transition gradually moving to higher temperature. We quantify at each pressure by defining it as the midpoint of the temperature region where the changes (black star in Fig. 4 (b)), with error bars fixed at 20% of the width of that temperature region. The results are shown as black dots in Fig. 1 (c). We note that the remains close to 1 at low temperature for all pressures, implying a fully ordered state below .
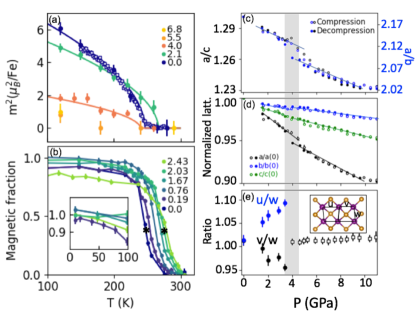
The smooth increase in could be associated with local lattice changes driven by pressure. We fitted the Fe atomic coordinates in the phase in the Rietveld refinements, in which the Wyckoff positions allow for a variation. These lead to the change of bond length between adjacent iron atoms along the ladder ( and ) and the rung (), with their ratios () plotted in Fig. 4 (e). The increase of and decrease of with increasing pressure indicate a clear tendency to form the block state, which is also observed at ambient pressure with decreasing temperature Nambu et al. (2012). Such a strong change due to the magnetoelastic coupling may account for the enhancement of .
Having established the influence of pressure on , we now turn to the evolution of the ordered magnetic moment. We extracted the magnetic order parameter curves from the integrated area of (Fig. 2) for measured pressures (Fig. 4 (a)). Fitting to a simple power law provides an estimated critical exponent of 0.29(2), close to the 3D Ising value of 0.31. Comparison with the order parameter curve determined at ambient pressure, for which low-temperature data are available, allows us to estimate the low-temperature, saturated ordered moment at 2 and 4 GPa, as shown by red squares in Fig. 1 (c). The order parameter curves can be used to extract as well; the results are plotted as black triangles in Fig. 1 (c) and are consistent with the results within the uncertainty. For 5.5 and 6.8 GPa, the symbols represent the upper boundary of the .
By combining the experimental observations from XRD, NPD and measurements under hydrostatic pressure on the same sample, we can establish the - phase diagram shown in Fig. 1 (c). Despite their different structures at ambient pressure, BaFe2S3 and BaFe2Se3 exhibit superconductivity at similar pressures and , as well as a common metal-insulator transition preceding the SC state. Another similarity is the initial enhancement of Zheng et al. (2018); Materne et al. (2019) with increasing pressure, implying the magneto-elastic coupling inherent in the ladder system. Several differences also exist between the two compounds. Along with its unusual block-type magnetism, BaFe2Se3 exhibits a potentially richer - phase diagram. The structural phase transition from the to the phase at GPa is confirmed by both X-ray and neutron diffraction measurements. No structural phase transition occurs in BaFe2S3, where the structure is present up to 12 GPa Kobayashi et al. (2018). In terms of the magnetic properties of BaFe2Se3, both the ordered moment and drop quickly above . This might associate with the Fe high-spin (HS) to low-spin (LS) transition induced by the structural transition, across which the structure has more compact stacking of the ladders (Fig. 4(c)). The abrupt shortening is also observed in FeS and FeSe, where the structural transition is accompanied with a pressure-induced HS-LS transition Fei et al. (1995); Rueff et al. (1999); Lebert et al. (2018). Despite the large reduction of and , the short-range block-type spin correlations remain present up to measured pressure of 6.8 GPa. Robust block magnetism in the phase, where the adjacent Fe-Fe distances are equivalent, implies that its origin may strongly relate to the electronic and orbital degrees of freedom.
Our results have vastly extended the range of pressures for which quantitative information exists on the structural phase transition, the evolution of the magnetic transition temperature and magnetic moment approaching the SC phase in the spin-ladder system BaFe2Se3. They have also made possible detailed comparisons with the sister compound BaFe2S3. The BaFe2Se3 - phase diagram displays persistent block magnetism across a wide pressure range, characterized by an initial increase in , followed by a strong reduction of after the structural transition and a steadily reduced ordered moment with pressure. Such rich behavior is distinct from the dopant dependent phase diagram in other FeSCs with a 2D square lattice Fernandes et al. (2014), where the magnetic ordered phase is continuously suppressed close to the SC phase. This may be associated with enhanced electron correlations in the quasi-1D ladder approaching the insulator-metal transition. The next frontier requires extending measurements into the SC phase starting from 10 GPa Ying et al. (2017). Whether the driving force of the superconductivity is induced by magnetic fluctuations due to the competition between block and stripe magnetic states proposed theoretically Zhang et al. (2018) or other electronic phases is still an open question.
The authors would like to acknowledge the beam line support from Martin Kunz and Andrew Doran at ALS, Gerald Morris at TRIUMF and Keith Taddei at HFIR. The authors would like to also thank STFC for provision of beam time at the ISIS Neutron and Muon FacilityWu et al. (2018).This work is funded by the U.S. Department of Energy, Office of Science, Office of Basic Energy Sciences, Materials Sciences and Engineering Division under Contract No. DE-AC02-05-CH11231 within the Quantum Materials Program (KC2202). M. W. and J. J. Y were supported by NSFC-11904414 and NSF of Guangdong under Contract No. 2018A030313055. S.K.L. was supported by an AAUW Dissertation Fellowship.
References
- McWhan et al. (1971) D. B. McWhan, J. P. Remeika, T. M. Rice, W. F. Brinkman, J. P. Maita, and A. Menth, Phys. Rev. Lett. 27, 941 (1971).
- McWhan et al. (1973) D. B. McWhan, A. Menth, J. P. Remeika, W. F. Brinkman, and T. M. Rice, Phys. Rev. B 7, 1920 (1973).
- VUL (2006) Physics Reports 428, 169 (2006), ISSN 0370-1573.
- Keimer et al. (2015) B. Keimer, S. Kivelson, M. Norman, S. Uchida, and J. Zaanen, Nature 518, 179 EP (2015).
- Stewart (2011) G. R. Stewart, Rev. Mod. Phys. 83, 1589 (2011).
- Dai (2015) P. Dai, Rev. Mod. Phys. 87, 855 (2015).
- Dagotto (2013) E. Dagotto, Rev. Mod. Phys. 85, 849 (2013).
- Takahashi et al. (2015) H. Takahashi, A. Sugimoto, Y. Nambu, T. Yamauchi, Y. Hirata, T. Kawakami, M. Avdeev, K. Matsubayashi, F. Du, C. Kawashima, et al., Nature Materials 14, 1008 (2015), ISSN 1476-1122.
- Yamauchi et al. (2015) T. Yamauchi, Y. Hirata, Y. Ueda, and K. Ohgushi, Phys. Rev. Lett. 115, 246402 (2015).
- Ying et al. (2017) J. Ying, H. Lei, C. Petrovic, Y. Xiao, and V. V. Struzhkin, Physical Review B Rapid Communication 95, 241109(R) (2017).
- Caron et al. (2011) J. M. Caron, J. R. Neilson, D. C. Miller, A. Llobet, and T. M. McQueen, Phys. Rev. B 84, 180409(R) (2011).
- Nambu et al. (2012) Y. Nambu, K. Ohgushi, S. Suzuki, F. Du, M. Avdeev, Y. Uwatoko, K. Munakata, H. Fukazawa, S. Chi, Y. Ueda, et al., Phys. Rev. B 85, 064413 (2012).
- Nagata et al. (1998) T. Nagata, M. Uehara, J. Goto, J. Akimitsu, N. Motoyama, H. Eisaki, S. Uchida, H. Takahashi, T. Nakanishi, and N. Môri, Phys. Rev. Lett. 81, 1090 (1998).
- Mourigal et al. (2015) M. Mourigal, S. Wu, M. B. Stone, J. R. Neilson, J. M. Caron, T. M. McQueen, and C. L. Broholm, Phys. Rev. Lett. 115, 047401 (2015).
- Dong et al. (2014) S. Dong, J.-M. Liu, and E. Dagotto, Phys. Rev. Lett. 113, 187204 (2014).
- Patel et al. (2018) N. D. Patel, A. Nocera, G. Alvarez, A. Moreo, S. Johnston, and E. Dagotto, Tech. Rep. (2018), eprint 1807.10419v2.
- Lovesey et al. (2016) S. W. Lovesey, D. D. Khalyavin, and G. van der Laan, Physica Scripta 91, 015803 (2016), ISSN 0031-8949.
- Wang et al. (2017) M. Wang, S. J. Jin, M. Yi, Y. Song, H. C. Jiang, W. L. Zhang, H. L. Sun, H. Q. Luo, A. D. Christianson, E. Bourret-Courchesne, et al., Phys. Rev. B 95, 060502(R) (2017).
- König et al. (2018) E. J. König, A. M. Tsvelik, and P. Coleman, Phys. Rev. B 98, 184517 (2018).
- Aoyama et al. (2019) T. Aoyama, S. Imaizumi, T. Togashi, Y. Sato, K. Hashizume, Y. Nambu, Y. Hirata, M. Matsubara, and K. Ohgushi, Tech. Rep. (2019), eprint 1902.10900v1.
- Herbrych et al. (2018) J. Herbrych, N. Kaushal, A. Nocera, G. Alvarez, A. Moreo, and E. Dagotto, Nature Communications p. 3736 (2018), ISSN 2041-1723.
- Takubo et al. (2017) K. Takubo, Y. Yokoyama, H. Wadati, S. Iwasaki, T. Mizokawa, T. Boyko, R. Sutarto, F. He, K. Hashizume, S. Imaizumi, et al., Phys. Rev. B 96, 115157 (2017).
- Luo et al. (2013) Q. Luo, A. Nicholson, J. Rincón, S. Liang, J. Riera, G. Alvarez, L. Wang, W. Ku, G. D. Samolyuk, A. Moreo, et al., Phys. Rev. B 87, 024404 (2013).
- Rincón et al. (2014) J. Rincón, A. Moreo, G. Alvarez, and E. Dagotto, Phys. Rev. Lett. 112, 106405 (2014).
- Chi et al. (2016) S. Chi, Y. Uwatoko, H. Cao, Y. Hirata, K. Hashizume, T. Aoyama, and K. Ohgushi, Phys. Rev. Lett. 117, 047003 (2016).
- Zheng et al. (2018) L. Zheng, B. A. Frandsen, C. Wu, M. Yi, S. Wu, Q. Huang, E. Bourret-Courchesne, G. Simutis, R. Khasanov, D. X. Yao, et al., Physical Review B 98, 18 (2018), ISSN 24699969, eprint 1807.10703.
- Materne et al. (2019) P. Materne, W. Bi, J. Zhao, M. Y. Hu, M. L. Amigó, S. Seiro, S. Aswartham, B. Büchner, and E. E. Alp, Physical Review B 99, 020505(R) (2019), ISSN 2469-9950.
- Saparov et al. (2011) B. Saparov, S. Calder, B. Sipos, H. Cao, S. Chi, D. J. Singh, A. D. Christianson, M. D. Lumsden, and A. S. Sefat, Phys. Rev. B 84, 245132 (2011).
- Bull et al. (2016) C. L. Bull, N. P. Funnell, M. G. Tucker, S. Hull, D. J. Francis, and W. G. Marshall, High Pressure Research 36, 493 (2016).
- Khasanov et al. (2016) R. Khasanov, Z. Guguchia, A. Maisuradze, D. Andreica, M. Elender, A. Raselli, Z. Shermadini, T. Goko, F. Knecht, E. Morenzoni, et al., High Pressure Research 36, 140 (2016).
- Rodriguez-Carvajal (1990) J. Rodriguez-Carvajal, in Satellite meeting on powder diffraction of the XV congress of the IUCr (Toulouse, France:[sn], 1990), vol. 127.
- Svitlyk et al. (2019) V. Svitlyk, G. Garbarino, A. D. Rosa, E. Pomjakushina, A. Krzton-Maziopa, K. Conder, M. Nunez-Regueiro, and M. Mezouar, Journal of Physics: Condensed Matter 31, 085401 (2019).
- Caron et al. (2012) J. M. Caron, J. R. Neilson, D. C. Miller, K. Arpino, A. Llobet, and T. M. McQueen, Phys. Rev. B 85, 180405(R) (2012).
- Suter and Wojek (2012) A. Suter and B. Wojek, Physics Procedia 30, 69 (2012).
- Kobayashi et al. (2018) K. Kobayashi, S. Maki, Y. Murakami, Y. Hirata, K. Ohgushi, and J. ichi Yamaura, Superconductor Science and Technology 31, 105002 (2018).
- Fei et al. (1995) Y. Fei, C. T. Prewitt, H.-k. Mao, and C. M. Bertka, Science 268, 1892 (1995), ISSN 0036-8075.
- Rueff et al. (1999) J.-P. Rueff, C.-C. Kao, V. V. Struzhkin, J. Badro, J. Shu, R. J. Hemley, and H. K. Mao, Phys. Rev. Lett. 82, 3284 (1999).
- Lebert et al. (2018) B. W. Lebert, V. Balédent, P. Toulemonde, J. M. Ablett, and J.-P. Rueff, Phys. Rev. B 97, 180503(R) (2018).
- Fernandes et al. (2014) R. M. Fernandes, A. V. Chubukov, and J. Schmalian, Nature Physics 10, 97 (2014), ISSN 1745-2473.
- Zhang et al. (2018) Y. Zhang, L.-F. Lin, J.-J. Zhang, E. Dagotto, and S. Dong, Phys. Rev. B 97, 045119 (2018).
- Wu et al. (2018) S. Wu, C. L. Bull, T. R. Forrest, J. Yin, B. Frandsen, and R. J. Birgeneau, STFC ISIS Neutron and Muon Source (2018), URL https://doi.org/10.5286/ISIS.E.RB1810189.