The Galactic bulge diffuse emission in broad-band X-rays with NuSTAR
Abstract
The diffuse hard X-ray emission that fills the Galactic center, bulge, and ridge is believed to arise from unresolved populations of X-ray binary systems. However, the identity of the dominant class of accreting objects in each region remains unclear. Recent studies of Fe line properties and the low-energy ( keV) X-ray continuum of the bulge indicate a major population fraction of non-magnetic cataclysmic variables (CVs), in particular quiescent dwarf novae. This is in contrast to previous high-energy ( keV) X-ray measurements of the bulge and ridge, which indicate a dominant population of magnetic CVs, in particular intermediate polars. In addition, NuSTAR broad-band measurements have uncovered a much heavier intermediate polar population in the central pc than previously assumed, raising the possibility that some fraction of this population extends further from the center. Here we use NuSTAR’s large aperture for unfocused photons and its broad-band X-ray range to probe the diffuse continuum of the inner 1–3∘ of the Galactic bulge. This allows us to constrain possible multi-temperature components of the spectrum, such as could indicate a mixture of soft and hard populations. Our emissivity is consistent with previous hard X-ray measurements in the bulge and ridge, with the diffuse X-ray luminosity tracing the stellar mass. The spectrum is well-described by a single-temperature thermal plasma with keV, with no significant emission above 20 keV. This supports that the bulge is dominated by quiescent dwarf novae; we find no evidence of a significant intermediate polar population in the hard X-ray band.
Subject headings:
Galaxy: center; X-ray: binaries; X-rays: diffuse background; X-rays: general1. Introduction
The Galactic diffuse X-ray emission (GDXE), an unresolved X-ray emission that fills the Galactic center and extends over along the Galactic plane, has been extensively studied since its discovery over 30 years ago (e.g., Worrall et al., 1982; Revnivtsev et al., 2006b, 2009). This emission has been observed from 0.5 keV to 50 keV (Muno et al., 2004; Heard & Warwick, 2013; Yuasa et al., 2012; Krivonos et al., 2007), with strong Fe emission features at 6.4 keV, from neutral or weakly ionized Fe, and at 6.7 keV and 7.0 keV, from He-like K and H-like Ly ions (Koyama et al., 1989, 1996; Xu et al., 2016; Yamauchi et al., 2016; Koyama, 2018; Nobukawa et al., 2016). The GDXE comprises three distinct regions: the Galactic center (inner 100 pc, or ), Galactic bulge (inner 1 kpc, or ), and Galactic ridge (). Throughout this paper, we use these spatial definitions to distinguish the Galactic center X-ray emission (GCXE), the Galactic bulge X-ray emission (GBXE), and the Galactic ridge X-ray emission (GRXE).
Recently, the seemingly coherent picture of the GDXE, with the Galactic center, bulge, and ridge all dominated by a similar unresolved binary population, has been challenged by NuSTAR broad-band and Suzaku Fe line measurements. Previously, both low-energy (10 keV) and high-energy (10 keV) observations were attributed to a dominant population of magnetically accreting white dwarf (WD) binaries, in particular intermediate polars (IPs), with an average WD mass of (Revnivtsev et al., 2006b; Krivonos et al., 2007; Yuasa et al., 2012; Heard & Warwick, 2013). However, NuSTAR observations of the inner 100 pc now indicate that the Galactic center is dominated by heavier IPs with (Perez et al., 2015; Hailey et al., 2016; Hong et al., 2016). In addition, Suzaku measurements have revealed differing Fe line intensities in the three regions, indicating a changing underlying source population (Xu et al., 2016; Yamauchi et al., 2016; Koyama, 2018; Nobukawa et al., 2016). The Fe line properties of the bulge, in particular, are well-described by a dominant population of non-magnetic WD binaries (Nobukawa et al., 2016), in particular quiescent dwarf novae (DNe).
The NuSTAR telescope (Harrison et al., 2013), due to its angular resolution of 18′′full-width half-max ( pc at the Galactic center) for focused photons and wide aperture (several deg2) for unfocused photons (Wik et al., 2014; Madsen et al., 2017; Perez et al., 2017), provides the unique ability to separately measure the innermost Galactic center, the bulge, and the ridge using the same instrument. The goal of this paper is to use the broad-band X-ray energy range of NuSTAR to probe the origin of the diffuse X-ray emission of the inner of the Galactic bulge, and to compare with previous NuSTAR studies of the inner 10 pc and inner 100 pc of the Galactic center. Our focus here is on the underlying point source components of the diffuse emission in both regions; the NuSTAR Galactic center analyses (Perez et al., 2015; Hailey et al., 2016; Hong et al., 2016) excluded regions of known truly diffuse emission, such as molecular clouds, and the diffuse emission of the bulge is known to be dominated by unresolved point sources (Revnivtsev et al., 2009; Hong, 2012).
This analysis offers the following advantages. First, we are able to search for a possible multi-temperature component of the GBXE. The low-energy Fe line studies (Yamauchi et al., 2016; Koyama, 2018; Nobukawa et al., 2016; Xu et al., 2016) that conclude that the bulge is dominated by DNe are in contrast to the IP interpretation favored by previous hard X-ray measurements of the bulge and ridge (Yuasa et al., 2012; Krivonos et al., 2007). If the bulge is indeed dominated by a soft spectrum consistent with DNe, the broad energy range of NuSTAR allows us to search for evidence of a separate IP population contributing to the hard X-ray band. Such an observation could indicate that the heavy IP population observed in the central pc extends outwards into the bulge. Second, if a substantial IP population does exist in the bulge, then the NuSTAR high-energy measurement is necessary to derive the correct WD mass, as narrow-band analyses that fit only the cooler regions of the accretion flow can bias the derived shock temperatures (and thus derived WD masses) to lower values (Hailey et al., 2016). Finally, this work has complementary systematics to the low-energy X-ray studies of the bulge. In particular, these studies rely on comparison of diffuse Fe line properties with a limited sample of isolated binary systems (3 polars, 16 IPs, 16 DNe, and 4 active binaries), with large spectral variations within each source sample. The analysis presented here, in contrast, must exclude the Fe line regions (see Sec. 3.4), and instead bases interpretation on the broad-band continuum shape, which can be better determined than temperatures derived using narrow energy bands.
In Sec. 2, we review the previous studies of the GDXE and introduce the various candidate source populations, which will motivate the spectral models used in our analysis. In Sec. 3, we outline the NuSTAR observations used and the data preparation, in particular the use of unfocused (“0-bounce”) photons that allows us to have a larger sky coverage than typical for focused (“2-bounce”) photons. We present the spectral modeling analysis in Sec. 4. These results are discussed in Sec. 5, and conclusions are presented in Sec. 6.
2. Review of possible origins of the GDXE
Measurements of the large-scale diffuse morphology and deep measurements of isolated fields indicate that the broad-band nature of the GDXE is primarily due to unresolved low-luminosity X-ray point sources. Revnivtsev et al. (2006b) found that the 3-20 keV spectrum along the Galactic ridge traces the Galactic stellar mass density (as measured by the infrared surface brightness of the Galaxy), with a measured luminosity consistent with the emissivity per unit stellar mass of X-ray sources in the solar neighborhood. We stress that it has a consistent value over the large-scale extent of Galaxy: disk and bulge (Revnivtsev et al., 2006a; Krivonos et al., 2007). Subsequent deep Chandra observations of the “Limiting Window”, a low-extinction region in the Galactic bulge, resolved over 80% of the keV emisison into discrete sources (Revnivtsev et al., 2009). A truly diffuse origin is disfavored, as such a high-temperature ( K) interstellar plasma could not be contained by the gravitational well of the Galactic disk, and no Galactic source capable of supplying the necessary energy replenishment rate has been identified (Ebisawa et al., 2001; Tanaka, 2002; Ebisawa et al., 2005).
The identity of the dominant point source class, however, remains unclear. Cataclysmic Variables (CVs) are a natural candidate, as they have a large space density with low-luminosity objects dominating the overall X-ray flux of the population (Sazonov et al., 2006a; Byckling et al., 2010; Pretorius & Knigge, 2012; Pretorius et al., 2013; Reis et al., 2013; Pretorius & Mukai, 2014; Britt et al., 2015). CVs are binary systems in which a WD accretes matter from a late-type main sequence companion via Roche-lobe overflow (Mukai, 2017). The most numerous subclass of CVs is the DNe, which in quiescence are thought to produce hard X-rays from the optically thin boundary layer of the accretion disk. Polars and IPs, classes of magnetic CVs (mCVs) that have WD magnetic fields strong enough to distort the inner accretion disk, are less numerous, but are especially prolific sources of keV emission. In contrast, coronally active binaries (ABs), which are normal star binaries with increased X-ray emission due to strong magnetic fields, have been proposed as at most a sub-dominant contribution to the X-ray source population (Revnivtsev et al., 2009).
Previous studies of the Galactic center, bulge, and ridge, which have favored a uniform IP interpretation of the diffuse emission with an average WD mass of , have been challenged by recent NuSTAR observations of the Galactic center and Suzaku measurements of the Fe line properties in each region. Measurements of the ridge by INTEGRAL showed a hard X-ray (17-60 keV) luminosity per stellar mass resembling that of mCVs in the solar neighborhood, with a spectrum consistent with a 1-dimensional accretion flow model of IPs (Suleimanov et al., 2005a) with an average WD mass of (Krivonos et al., 2007). In the bulge, Suzaku measured a 2-50 keV spectrum, which if interpreted as IPs yields (Yuasa et al., 2012). The Chandra discovery in the “Limiting Window” of 10 periodic X-ray sources, interpreted to be mostly mCVs, lent support to this IP interpretation in the bulge (Hong et al., 2012). In the inner 100 pc, Heard & Warwick (2013) used XMM-Newton observations of the Galactic center to argue that the harder ( keV) component of the soft (2-10 keV) spectrum is dominated by mCVs, primarily IPs, with an average WD mass of . In hard X-rays, Revnivtsev et al. (2006b) showed that the RXTE and INTEGRAL combined 3-100 keV spectrum of the Galactic center supports a composite population of IPs, polars, DNe, and ABs, with the 10 keV spectrum dominated by IPs. This result should be viewed with caution, however, as it is now known that the INTEGRAL 20 keV Galactic center spectrum suffered significant contamination from molecular clouds, non-thermal filaments, and a bright pulsar wind nebula (Mori et al., 2015).
The results of the NuSTAR Galactic center survey program, however, have revealed a much heavier average WD mass in the inner 100 pc. This program discovered an X-ray component in the inner pc 4 pc that is significantly harder than that previously measured in the Galactic center, bulge, or ridge (Perez et al., 2015). Subsequent NuSTAR broad-band measurements of isolated IPs showed that both this central hard X-ray emission and low-energy Chandra measurements of the inner pc (Muno et al., 2004, 2009) indicate a dominant population of IPs with higher average WD mass, , than previously derived (Hailey et al., 2016). This mass agrees with the average WD mass in CV systems measured by the wide-field Sloan Digital Sky Survey, (Zorotovic et al., 2011). Further support comes from the NuSTAR Galactic center point source survey, which showed that the log-log distributions of both NuSTAR hard X-ray point sources and Chandra soft X-ray sources in the same region can be accounted for by a population with average temperature keV, consistent with these heavier WD masses (Hong et al., 2016).
In contrast to this heavy IP population, an increasing fraction of non-magnetic CVs is indicated with increasing distance from the Galactic center by recent measurements of Fe line properties in the bulge and ridge (Xu et al., 2016; Yamauchi et al., 2016; Nobukawa et al., 2016). Fe emission lines are sensitive tracers of hot plasma temperature in accretion flow. Xu et al. (2016) compared Suzaku measurements of the Fe line properties of the 2-10 keV spectrum of the bulge with those of isolated CVs and ABs in the solar neighborhood, showing that the Fe properties of the bulge are inconsistent with the selected sample of IPs or polars, but similar to DNe. They conclude that the low-energy emission is dominated by faint DNe and ABs, although mCVs may dominate the high-energy spectrum. This result is supported by Yamauchi et al. (2016) and Nobukawa et al. (2016), who measured varying Fe line equivalent widths in Suzaku spectra of the Galactic center, bulge, and ridge, which were interpreted as changing population fractions in each region. Non-magnetic CVs, although originally proposed by Mukai & Shiokawa (1993), had previously been disfavored as a dominant contributor to the GDXE as their typical luminosity was thought to be too high. Recent work has revealed a much lower average luminosity (Reis et al., 2013), allowing the individual sources to escape the point detection limit (Ebisawa et al., 2001).
In this paper, we use new NuSTAR measurements of the Galactic bulge and previous NuSTAR measurements of the Galactic center to bolster the case that the diffuse emission in the two regions arises from differing underlying point source populations. The apparent discrepancy between the average WD mass in different regions of the GDXE could thus be due to misidentification of the dominant source population in the bulge and ridge. For the same WD mass, the inner accretion flow of a non-magnetic CV has a lower temperature than the standoff shock and accretion column of a mCV (e.g., Ezuka & Ishida, 1999; Anzolin et al., 2008; Ishida et al., 2009; Mukai, 2017). Thus, the softer spectrum of the bulge and the harder spectrum of the center could arise from a population with the same average WD mass, but with different accretion properties. Alternately, perhaps more massive stellar remnants accumulate in the Galactic center due to dynamical friction (Portegies Zwart et al., 2001), or stellar remnants in binary systems become more massive due to increased accretion rates in the dense environment, although we note that mass gain and mass segregation in different stellar environments is a complex and unresolved topic (Wijnen et al., 2015; Ge et al., 2015).
Additional support for a dominant non-magnetic CV component of the diffuse emission further along the disk comes from the NuSTAR point source survey in the Norma Arm region. Chandra measurements of the log-log distribution in this region were found to be in very good agreement with that predicted for CV populations (Fornasini et al., 2014). The NuSTAR survey of this region measured a log-log distribution that is consistent with Chandra sources if the average source spectrum is thermal with keV (Fornasini et al., 2017). This is significantly harder than the keV spectrum derived by previous soft X-ray measurements of the Galactic center (Muno et al., 2004; Heard & Warwick, 2013), but softer than NuSTAR measurements of Galactic center, thus possibly indicating a lower fraction of IPs relative to other types of CVs in this region.
3. NuSTAR Data Preparation
3.1. Introduction to 0-bounce and 2-bounce photons
To obtain the wide solid-angle aperture necessary to study the diffuse X-ray emission from the Galactic bulge, we exploit NuSTAR’s ability to measure unfocused, or “0-bounce”, X-rays from a -radius field-of-view (FOV). The details of the NuSTAR instrument relevant for this analysis are summarized here.
NuSTAR has two identical telescopes, each consisting of an independent optic and focal-plane detector, referred to as FPMA and FPMB. The optics use a conical approximation to the grazing-incidence Wolter-I design, in which X-rays are focused by reflection from an upper parabolic mirror section and then a lower hyperbolic mirror section. The FOV for these focused, or “2-bounce”, photons is .
To block unfocused X-rays from reaching the NuSTAR detectors, a series of aperture stops are attached to each focal-plane bench. However, this shielding is not complete, and there remains a -radius aperture, partially blocked by the optics bench, from which totally unfocused, or “0-bounce”, photons can reach the detectors. The solid-angle aperture for 0-bounce photons is over two orders of magnitude larger than the FOV for focused photons, even after accounting for blocking by the optics and vignetting effects due to the aperture stop.
This large solid angle for 0-bounce photons allows us to study the diffuse emission of the Galactic bulge. In this analysis, we construct a spectrum using photons from the full detector plane, which are a combination of photons from the 0-bounce aperture, the 2-bounce FOV, and instrument background (similar to the technique used in Ng et al. (2019)). Via this technique, we lose the imaging capabilities of the NuSTAR optics, but gain spectral information from a large region of the sky.
Although the aperture for 0-bounce photons is much larger, the 2-bounce FOV is not entirely negligible, due to the increasing intensity of the Galactic diffuse flux in the 2-bounce FOV of our observations. Using the mass model of the Nuclear Stellar Disk and Nuclear Bulge, as described in Sec. 4.3, we estimate that the 2-bounce count rate from the Galactic center in our spectrum is % as high as the 0-bounce count rate from the bulge. We thus need to account for both components in our spectral analysis. We correctly account for the different 0-bounce and 2-bounce effective areas, efficiencies, and sky coverage during spectral modeling, as described in Sec. 3.2 and 3.3. (We note that “1-bounce” photons or “ghost rays”, which undergo only single mirror reflection, have an effective area that is 10% as high as the 2-bounce effective area and are thus negligible (Madsen et al., 2017).)
3.2. Observations, data cleaning, and sky coverage
NuSTAR observed the Galactic center for a total of Ms over the period from July 2012 through October 2014 (Mori et al., 2015; Hong et al., 2016). Using focused photons, these observations imaged the central of the Galaxy. We use three tiled observations (Table 1) from the “Block B” survey (Hong et al., 2016), chosen to minimize the 2-bounce flux from bright sources closer to the Galactic center.
We derive fit and flux parameters from each of these three observations individually. We do not stack the three spectra, as each has a different, time-dependent instrumental background. In particular, the normalization of the line and continuum emission components, as well as the spectral shape of the low-energy instrumental background, can vary between each observation. As we are not limited by the statistics of each observations, but instead by systematics associated with the instrumental background model (Ng et al., 2019), we leave the three observations as independent measurements.
Data reduction and spectral extraction were performed with the NuSTAR Data Analysis Software pipeline (NuSTARDAS) v1.5.1. We first remove all data from passages through the South Atlantic Anomaly. In addition, we remove any periods with a 3–5 keV count rate higher than 0.3 cts/s, as this is indicative of increased background due to solar flaring. This removed ks from Obs 40032006001.
To study the diffuse emission, we must also remove any contaminating emission from bright isolated point sources. This consists of “stray light”, which is extremely bright contamination caused by 0-bounce photons from isolated bright point sources within (Madsen et al., 2017). We flag as “bad” any pixels with this contamination. These are then removed during the data screening procedure implemented in NuSTARDAS. We discuss in Sec. 4.4.3 the upper luminosity limit on a 0-bounce source that is just below the threshold for stray light removal, and which therefore may remain after this cleaning procedure. Using the NuSTAR Galactic center source catalog Hong et al. (2016), the total 10-40 keV flux of identified point sources in our 2-bounce FOV is ph s-1 cm-2. This is negligibly small compared to our measured GBXE flux.
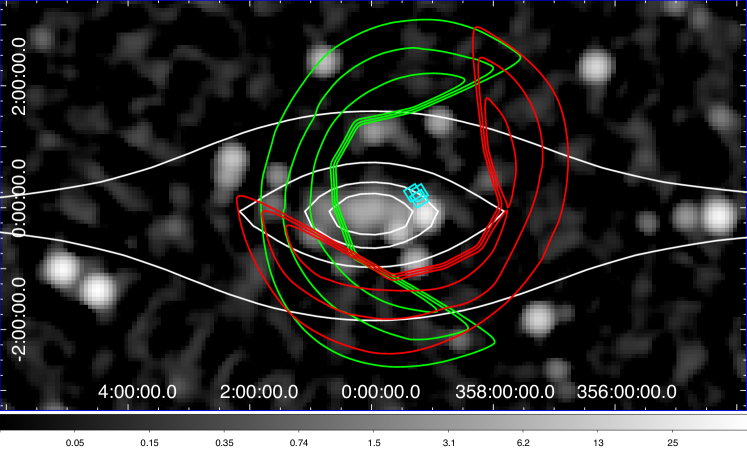
To construct a sky-exposure map for 0-bounce photons, we use the instrument geometric model from the nuskybgd code (Wik et al., 2014). This map is corrected for obscuration by the optics bench and the vignetting effect due to the aperture stops attached to each focal plane bench. The effective solid angle of sky coverage for each observation, after accounting for these effects, is given in Table 1. Note that this pixel removal affects the average solid angle, as different detector areas see slightly different regions of sky with a different efficiency.
The resulting total sky coverage of these three observations is shown in Fig. 1. Although FPMA and FPMB have largely overlapping FOVs for focused photons, their 0-bounce apertures cover very different regions of the sky, as indicated in the green and red contours of Fig. 1. We use only data from FPMA for this analysis, as the 0-bounce sky coverage of FPMA covers the Galactic bulge while avoiding the inner 100 pc Galactic center region.
| Observation ID | Pointing (J2000)111Roll angle was 332∘ for all. | Effective Exposure222After all data cleaning. | Effective Detector Area333After stray light, ghost ray, and bad pixel removal. | Effective Avg. Solid Angle444Average solid angle of sky from which 0-bounce photons can be detected, after correcting for removal of stray light and bad pixels, as well as efficiency due to vignetting effects. | |
|---|---|---|---|---|---|
| RA (deg) | DEC (deg) | FPMA (ks) | FPMA (cm2) | FPMA (deg2) | |
| 40032002001 | 265.7969 | 39.8 | 7.14 | 4.06 | |
| 40032003001 | 265.6991 | 39.8 | 8.18 | 3.47 | |
| 40032006001 | 265.7595 | 28.6 | 9.98 | 3.76 | |

3.3. Spectral file preparation
We construct a spectrum using photons from all portions of the detector not contaminated by stray-light. Our spectral model must account for five components: 0-bounce diffuse emission from the Galactic bulge, 2-bounce diffuse emission from the Galactic center, both 2-bounce and 0-bounce emission from the cosmic X-ray background (CXB), and instrumental background.
To account for both 0-bounce and 2-bounce astrophysical emission within the same spectra, we make custom auxiliary response files (ARFs) for each observation and each model component that account for the differing effective area, in units of cm2, and effective average solid angle of sky coverage, in units of deg2.
For the 2-bounce spectral components, we first derive the NuSTAR effective area file for the detector region after all bad pixel and data cleaning using the standard numkarf procedure from the NuSTARDAS. This accounts for the effective area of the focusing optics, as well as efficiencies due to detector absorption. We scale this file by the corresponding 2-bounce sky coverage, to yield an ARF file in units of cm2 deg2.
For the 0-bounce spectral components, the effective area is the physical detector area, after removal of stray light and bad, pixels, listed in Table 1. We scale this by the effective sky coverage of 0-bounce photons, after all data cleaning and accounting for the efficiency due to vignetting effects, also listed in Table 1. These model components are also subject to the energy-dependent efficiency for photons to pass through the beryllium window in front of the detectors, which drops sharply below 10 keV but is approximately unity elsewhere, and an absorption term (nuabs, Madsen et al. (2017)) that accounts for the detector CdZnTe dead layer. (This beryllium widow efficiency and detector absorption are included for the 2-bounce components via the effective area file produced by numkarf.)
The derived (or fixed) fluxes of all astrophysical components are thus reported in units of . Spectral fitting and flux derivations are performed in XSPEC version 12.9.0 Arnaud (1996).
3.4. Binning and Energy Range
For spectral analysis, we use the energy range 5–100 keV. The highest-energy ( keV) region is necessary to properly constrain the continuum component of the instrumental background. In contrast, the low-energy (3–5 keV) components of the instrumental background cannot be well constrained by our data, and are thus ignored. In particular, this instrumental background includes line-like emissions at keV and keV with strengths that vary between different observations (Wik et al., 2014), and which can significantly bias the derived low-energy continuum shape (for detailed discussion of the difficulty of using the 3–5 keV region with the 0-bounce analysis technique, see Ng et al. (2019)).
Additionally, we ignore the energy range 6–9 keV, as this region contains significant line emission from neutral and ionized Fe that is degenerate between the 2-bounce Galactic center diffuse component and the 0-bounce Galactic bulge diffuse component (Nobukawa et al., 2016). These Fe line properties are a valuable input to constraining the temperature of any emission. However, any observed line flux is a combination of 0-bounce emission from the bulge and 2-bounce emission from the center. As the IPM model that we use to describe the Galactic center emission (see Sec. 4.3) does not describe this line emission, we cannot accurately model how much of the observed flux is due to the bulge emission only.
Instead, the focus of this paper is to use the broad-band continuum to constrain the spectrum of the bulge emission. For this reason, we still include 5–6 keV, as this gives valuable constraints on the continuum shape. This study complements the recent Fe line studies, as it allows us to search for a high-energy contribution to the population.
We bin each spectrum using a logarithmic binning scheme, with 200 bins per decade in energy. This allows for clear visual inspection when viewing a large energy range on a logarithmic axis, and yields a statistical error that is approximately uniform at 10% across the full energy range, with counts per bin at the lowest energies and at least 50 counts per bin at the highest energies. There are no significant variations in the derived Galactic diffuse fit parameters due to alternate binning schemes.
| 40032002001 | 40032003001 | 40032006001 | ||||
| Parameter | 1T | IPM | 1T | IPM | 1T | IPM |
| 1.7 | 1.6 | 1.5 | ||||
| Rel. Norm. | 49 | 36 | 35 | |||
| [keV] | 8.0 | - | 8.0 | - | 7.4 | - |
| [] | - | 0.44 | - | 0.45 | - | 0.41 |
| erg s-1 cm-2 deg | 10.3 | 10.0 | 10.2 | 10.3 | 10.4 | 10.5 |
| (dof) | 1.11 (197) | 1.08 (198) | 1.10 (197) | 1.06 (198) | 1.05 (197) | 1.04 (198) |
4. Spectral Model
4.1. Instrumental Background Model
A standard NuSTAR instrumental background model has previously been derived from phenomenological fits to “blank sky” observations (Wik et al., 2014).
It is dominated at high energies by a series of Lorentzian lines and a relatively flat continuum component, modeled as a broken power-law with a break at 124 keV.
At low energies, it is dominated by a 3.5 keV line, a 4.5 keV line, and a 1 keV thermal plasma component (the apec model in XSPEC) that is possibly due to reflected solar X-rays, whose intensity can vary with time.
For this analysis, however, we use a slightly modified version of the standard low-energy instrumental background model. This is motivated by measurements of occulted data, which is collected during the same observation periods we use for our main analysis but when the FOV of NuSTAR is blocked by the Earth. The occulted data gives a better constraint on the internal background spectrum than, for example, blank-sky data collected in another time period, because it is free of low-energy emission from the CXB, which can obscure the low-energy instrumental component, and because it accurately describes instrumental background components that may have long-term time variation. We find that for energies above 20 keV, the occulted data is well described by the above model. Below 20 keV, however, the occulted data indicates residual emission that is not accounted for by this default model.
These low-energy occulted fits are improved if we replace the 1 keV thermal plasma component with a power-law continuum. In this modified instrumental background model, we use occulted data from each observation to derive a best-fit power-law index and relative normalization with respect to the high-energy continuum. We then freeze both of these parameters in the instrumental background model that we apply to non-occulted data. These parameters are shown in Table 2. This modified background model has been validated on extragalactic observations, where it yields the correct expected CXB spectral shape and flux (see Appendix A).
The instrumental background model we use in this analysis thus consists of (i.) the continuum and line components from Wik et al. (2014), with the line widths and energies fixed and the continuum and line normalizations left free, and (ii.) the low-energy power-law component described above. Compared to the default instrumental model, this low-energy power-law background model has no significant effect on the derived continuum shape of the Galactic bulge diffuse emission, with the derived temperature or IP mass of the GBXE remaining unchanged, within the 90% C.I., between the two instrumental models. However, it does affect the measured 5–20 keV flux of this diffuse emission, lowering it by up to 15% as compared to the default model. We further discuss uncertainties on the derived GBXE flux in Sec. 4.4.3.
4.2. Cosmic X-ray Background (CXB) Model
We model both the 0-bounce and the 2-bounce components of the CXB as a cutoff power-law, with 3–20 keV flux and spectral indices fixed to those measured by INTEGRAL (Churazov, E. et al., 2007). We have verified these spectral parameters and flux with NuSTAR extragalactic data, accounting for the 0-bounce and 2-bounce emission components as described in Sec. 3.3 and using the instrumental background model described in Sec. 4.1. This provides further validation of our combined 0-bounce and 2-bounce spectral analysis procedure, and of our modified instrumental background model. See Appendix A for details.
4.3. 2-bounce Diffuse Emission: The Galactic Center
It is not possible to independently fit the 2-bounce diffuse emission from the Galactic center and the 0-bounce diffuse emission from the Galactic bulge, due to their similar spectral shapes. Instead we use previous measurements to fix the 2-bounce spectral shape and relative flux.
Motivated by NuSTAR measurements of diffuse emission in the inner 10 pc (Perez et al., 2015; Hailey et al., 2016) and of point sources in the inner 100 pc (Hong et al., 2016), we fix the spectrum of the 2-bounce emission from the Galactic center to a 1-dimensional accretion flow model of IPs (see Sec. 4.4.2) with . We do not include the soft keV component of GCDE, as it is negligible in the energy range keV (Perez et al., 2015; Hailey et al., 2016). We note that there is no significant variation in the derived Galactic bulge luminosity or spectral shape (with temperature, IP mass and 5–20 keV flux remaining consistent within 90% C.I.) if we instead use a model with , as has been motivated by the previous studies described in Sec. 2. This is due to the overall continuum shape being dominated by the GBXE, with the GCXE only a sub-dominant component. We further discuss the small effects of varying the 2-bounce Galactic center spectral shape on the derived Galactic bulge continuum shape in Sec. 4.4.1 and 4.4.2.
We use a mass model of the Nuclear Stellar Disk and the Nuclear Bulge (Launhardt et al., 2002) to fix the flux of this component relative to that of the Galactic bulge diffuse component. RXTE measurements have shown that the 3–20 keV diffuse X-ray flux traces the stellar mass distribution (Revnivtsev et al., 2009). We thus fix the 3–20 keV 2-bounce flux relative to the 3–20 keV 0-bounce flux, in units of erg s-1 cm-2 deg-2 to be the ratio of the integrated stellar mass in the 2-bounce FOV to that in the 0-bounce FOV. This ratio is 2.7, 2.2, and 2.5 for Obs 40032002001, 40032005001, 40032006001, respectively. Note that although the flux in units of erg s-1 cm-2 deg-2 is expected to be higher for the 2-bounce Galactic center component than for the 0-bounce bulge component, the overall count rate of our measurement, in units of ph s-1, is much higher for the 0-bounce component due to the much larger 0-bounce FOV. Also, although the ratios differ between the three observations, the 2-bounce sky regions are overlapping and the 0-bounce sky regions are essentially the same; the difference is due to the different stray light and bad pixel removal, and thus different 2-bounce and 0-bounce effective areas and average solid angles, between the three observations.
4.4. 0-bounce Diffuse Emission: The Galactic Bulge
We investigate two different models to describe the diffuse emission from the Galactic bulge: a single-temperature thermal plasma (1T) model, which allows us to describe the spectrum without assuming the identity of the underlying population, and an intermediate polar mass (IPM) model, which allows us to directly compare with previous NuSTARmeasurements from the Galactic center and Suzaku, RXTE, and INTEGRALmeasurements of the bulge and ridge.
4.4.1 Single-temperature Thermal Plasma Model
For the same WD mass, non-magnetic CVs exhibit significantly softer emission and cooler average plasma temperatures than mCVs, due to the different mechanisms by which the plasma is heated in each system (Xu et al., 2016; Hailey et al., 2016). In non-magnetic CVs, the observed X-ray emission is dominated by hot plasma at the inner boundary of the accretion disk, with approximately half of the gravitational energy of the accreting material dissipated in a relatively cool disk that does not affect the X-ray flux. In mCV systems, the accretion disk is disturbed by the WD’s magnetic field lines, funneling material along these field lines toward the WD poles. The hottest material, and thus the hardest X-rays, originate at the stand-off shock region, with a temperature that scales with the WD mass. Below this, a column of cooling material with peak emissivity in soft X-rays extends towards the WD surface.
The simplest model for both categories of systems is a one-temperature plasma. Though this model only approximates the possible multi-temperature nature of the accretion flow, it allows us to compare with previous GDXE measurements. As with the 2-bounce GCDE, we do not include the soft keV component of 0-bounce GBDE, as it is negligible in the energy range keV (Yuasa et al., 2012). This single-temperature plasma is described using the bremss model in XSPEC. This component is subject to absorption by the interstellar medium, with a column density fixed to the approximate average value in the region covered, cm-2 (Launhardt et al., 2002). As we only use data in the range keV, our derived spectral parameters are not significantly affected by changes in this value.
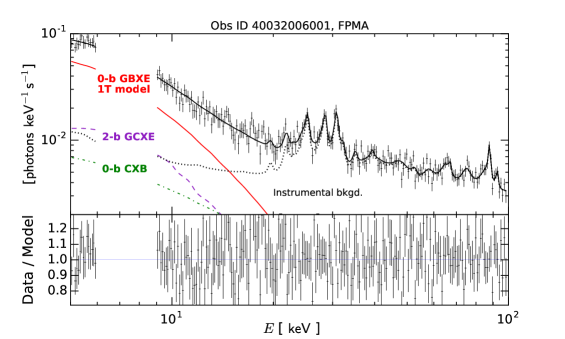
The results of fitting this model to our three observations are shown in Fig. 2 and Table 2. All three spectra are well described by this model, with and a best-fit temperature of keV.
This is significantly softer than the spectrum measured by NuSTAR in the Galactic center, where the point source and diffuse populations are consistent with an average temperature of keV (Hong et al., 2016; Perez et al., 2015), as we discuss further in Sec. 5. This conclusion is robust to variations in the assumed 2-bounce Galactic center diffuse spectrum and the low-energy internal background model. If we replace the GCDE model with a softer population of IPs with , as motivated by studies of the GCDE prior to NuSTAR (see Sec 2), the best-fit temperatures increase slightly, by 10–13% for each observation, but remains consistent within the 90% C.I. errors quoted in Table 2. Replacing the low-energy internal power-law component with the 1 keV thermal plasma component from the standard NuSTAR background model has a similar effect.
4.4.2 IP Mass Model
In order to allow direct comparison of our continuum spectral shape with previous NuSTAR measurements of the GCXE and with previous Suzaku, RXTE, and INTEGRAL broad-band measurements of the bulge and ridge that favored an IP interpretation (Revnivtsev et al., 2006b; Krivonos et al., 2007; Yuasa et al., 2012), we also model our GBXE spectrum using an IP mass model. As most IPs have higher mass transfer rates than polars, and thus significantly higher hard X-ray luminosities, they are a natural candidate for the origin of the GDXE. As mentioned above, the X-ray emission of mCVs is an inherently multi-temperature process, and measurements using only the low-energy X-ray spectra will be biased to a lower temperature and mass. However, broad-band X-ray measurements, such as possible with NuSTAR have been shown to accurately constrain the WD mass (Hailey et al., 2016; Shaw et al., 2018).
To model IPs, we use a 1-dimensional accretion flow model that accounts for the density and temperature profile of the accretion column, but uses simple emissivity profile that ignores soft X-ray emission lines (Suleimanov et al., 2005b). The hottest temperature scales with the depth of the potential well, and thus the WD mass. We use this IPM model to derive the average WD mass implied by our Galactic bulge spectrum. Of course, this mass is only reliable if the spectrum is dominated by emission from IPs, and would be different if attributed to a different point source population, such as non-magnetic CVs. As in the 1-temperature model, we include absorption by the interstellar medium with a column density fixed to cm-2 (Launhardt et al., 2002).
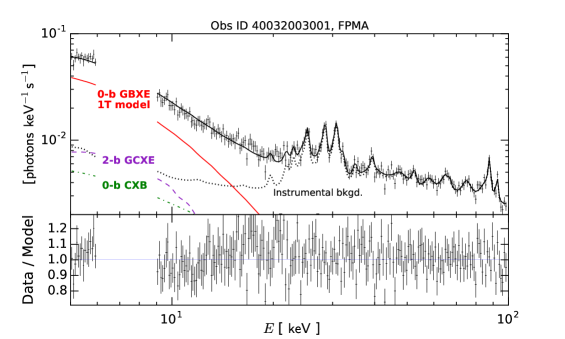
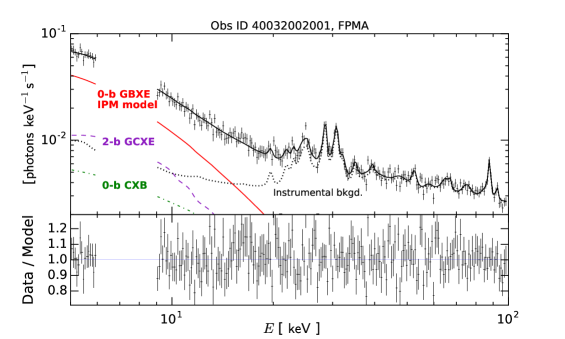
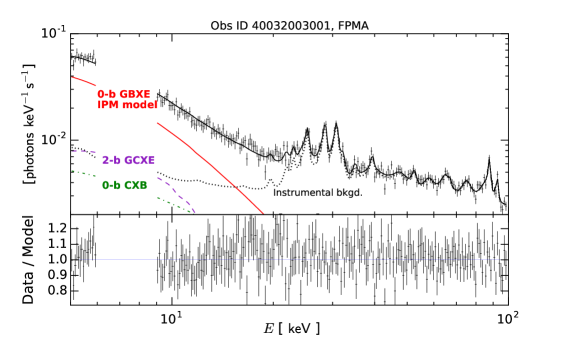
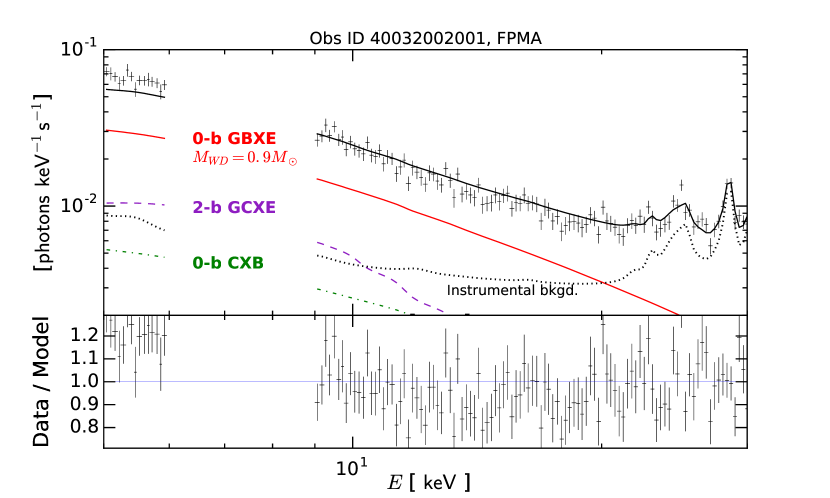
The results of fitting the IPM model to our three observations are shown in Fig. 3 and Table 2. Similar to the 1T model, all three spectra are well-described with . The best-fit average WD mass of again indicates that the spectrum is significantly softer than that measured by NuSTAR in the Galactic center. As with the 1T model, the derived average WD mass increases slightly if we use the softer model of the GCXE or replace the low-energy internal power-law component with the usual 1 keV thermal plasma component, but remains consistent with the 90% C.I. errors of Table 2. In addition, if we instead freeze the WD mass in our IPM model of the 0-bounce bulge emission to be , the fit deteriorates significantly for energies below 20 keV, with a for each observation. This is illustrated in Fig. 4.

4.4.3 GBXE Luminosity
The measured 5–20 keV flux of the GBXE component is presented in Table 2. In this section, we discuss our flux and luminosity results in the energy band 3–20 keV, in order to better compare with previous hard X-ray studies of the bulge and ridge. We note, however, that this is not an exact comparison, as some sub-dominant fraction of the total 3–5 keV diffuse emission is attributed to the soft keV diffuse component (Perez et al., 2015; Hailey et al., 2016; Yuasa et al., 2012), which we ignore in our fits.
The measured GBXE flux, erg s-1 cm-2 deg-2, is consistent for each of the three observations. Integrating over the mass model of Launhardt et al. (2002) and accounting for efficiency effects due to vignetting, we obtain a luminosity to stellar mass ratio of erg s-1 . The dominant uncertainty on this measurement is due to the overall NuSTAR calibration uncertainty, which is 10% (Madsen et al., 2015). Here we assume a uniform distance to the bulge of 8.5 kpc (Revnivtsev et al., 2006b).
We estimate the upper luminosity limit at which a 0-bounce point source would remain unresolved in our measurement using two methods. First, we estimate the source luminosity that would produce a count rate across our detector that is approximately twice the instrumental background rate in the energy range 3–20 keV. This is the source brightness that should produce a clearly visible stray light pattern on our detectors. This yields an estimated upper limit of erg s-1 cm-2 or erg s-1, which is 10% of our total measured bulge luminosity. Second, we check this estimate using the INTEGRAL point source catalog of this region (Krivonos et al., 2012, 2017). There are three sources that remain after all our data cleaning, the brightest of which has erg s-1 cm-2, consistent with the upper limit estimated via our first method. We note that our measured flux is not contaminated by the total flux of this source, due to vignetting-induced inefficiency effects.
We can compare our luminosity to previous bulge measurements. Our measured emissivity, erg s-1 is consistent with that measured by RXTE in the bulge and ridge, erg s-1 (Revnivtsev et al., 2006b), as well as more recent RXTE measurements which give erg s-1 (Revnivtsev & Molkov, 2012). Our measured is also consistent with the 3–20 keV X-ray emissivity of sources in the stellar neighborhood, erg s-1 , excluding young coronal stars (Sazonov et al., 2006b).
5. Discussion
Our measurement of the broad-band continuum of the GBXE is significantly softer than the spectrum observed by NuSTAR in the Galactic center and than the high-energy Suzaku spectrum measured by Yuasa et al. (2012) in nearby regions of the bulge. There is no detection of the GBXE above the instrumental background level for energies 20 keV. While NuSTAR measurements of both the diffuse emission and point sources of the inner 100 pc indicate a population dominated by IPs with , the diffuse bulge spectrum presented here is instead consistent with a large population of DNe, as has been indicated by more recent Suzaku studies of the low-energy continuum and Fe line properties of the diffuse emission (Yamauchi et al., 2016; Xu et al., 2016; Nobukawa et al., 2016; Koyama, 2018) and updated luminosity functions of DNe(Reis et al., 2013; Byckling et al., 2010).
The derived temperature of the bulge, at keV, is lower than observed in the central region. The NuSTAR spectrum of the diffuse emission in the central 10 pc is described by a temperature of keV in the energy range above 5 keV (Perez et al., 2015; Hailey et al., 2016), and the combined log-log population analysis of Chandra and NuSTAR point sources in the central 100 pc implies a 20–50 keV (Hong et al., 2016). Both of these previous NuSTAR studies indicate that the GCXE is dominated by IPs with . Although a lower GCXE temperature and lighter WD mass were previously implied by low-energy X-ray data (Muno et al., 2004, 2009; Heard & Warwick, 2013), it has been shown that these narrow-band spectral fits bias the derived temperatures to lower values (Hailey et al., 2016), as they fit only the cooler regions of the accretion flow (Mukai, 2017).
We note that our spectrum is also significantly softer than previous broad-band measurements of the bulge using Suzaku, which warrants discussion. Yuasa et al. (2012) described the bulge diffuse spectrum in 2–10 keV and 15–50 keV using a two-temperature model with keV and keV, with the higher temperature having a high intrinsic absorption. The authors conclude that this emission is primarily due to a combination of IPs with and soft coronal X-ray sources.
The NuSTAR GBXE measurements presented here are inconsistent with this high-energy Suzaku spectrum. We prepare a simulated 40 ks observation using the best-fit spectrum from Yuasa et al. (2012), and combine this with simulated spectra of the 2-bounce GCXE, 0-bounce and 2-bounce CXB, and NuSTAR instrumental background. Fitting this simulated spectrum to a 1T model yields a keV, confirming that the reported Suzaku spectrum is significantly harder than the keV that we observe. Re-fitting our observed spectrum to the same model as Yuasa et al. (2012), with keV and a highly-absorbed that is left free, yields a best-fit keV for all three observations. This is consistent with our derived 1T temperature, though with a poorly-constrained error range of keV. Freezing all temperatures and absorption parameters to those measured by Yuasa et al. (2012) yields a poor fit to the low-energy NuSTAR data, again confirming that our measured spectrum is not consistent with this previous measurement.
The harder GBXE spectrum observed by Suzaku can be explained by differences in the regions measured by NuSTAR and by Yuasa et al. (2012). The regions in Yuasa et al. (2012), while covering out to radii of , also extend to of the center. This inner region is much closer to the inner pc of the Galactic center, where NuSTAR measured a hard IP spectrum. The Suzaku measurements thus cover a transition region, with their spectrum consisting of a combination of the softer DNe spectrum of the bulge and the harder IP spectrum of the center.
To allow direct comparison of our continuum spectral shape with previous broad-band measurements of the bulge and ridge that were interpreted as arising from a dominant IP population, we have also modeled our GBXE spectrum using an IP mass model. Our bulge spectrum is consistent with that measured in the ridge by INTEGRAL (Krivonos et al., 2007) and RXTE (Revnivtsev et al., 2009), which both used broad-band measurements to derive . If interpreted as arising from a dominant population of IPs, our GBXE measurement thus implies a much lighter average mass of WDs in these systems than in the central region.
However, we argue that this derived WD mass is not correct, as the underlying population is not dominated by IPs. Our GBXE temperature is not consistent with Suzaku measurements of isolated IPs, which showed an average temperature of keV (Xu et al., 2016). The WD mass is also significantly smaller than the average WD mass in CV systems measured by SDSS, (Zorotovic et al., 2011). Instead, the bulge temperature is consistent with the average temperature of isolated DNe, keV for an X-ray selected sample (Xu et al., 2016) or keV for an optically selected sample (Reis et al., 2013). This makes sense, as the inner accretion flow of a non-magnetic CV is cooler than the standoff shock and accretion column of a mCV.
This conclusion supports the recent Suzaku studies of the Fe line emission properties and low-energy continuum of the GDXE. Yamauchi et al. (2016), Xu et al. (2016), Nobukawa et al. (2016), and Koyama (2018) have shown that the Fe-K, Fe-He, and Fe-Ly lines have scale heights and equivalent widths that vary between the GCXE, GBXE, and GRXE, indicating different populations in each region. Yamauchi et al. (2016) notes that the EWs indicate that a small fraction (10-20%) of the bulge and ridge emission is due to mCVs, and that the majority are non-magnetic CVs, ABs, and coronally-active stars. Xu et al. (2016) further argued that the temperature and Fe EWs of the bulge indicate that the majority of sources are DNe. In addition, Nobukawa et al. (2016) showed that the low-energy continuum of the bulge is described by a soft bremsstrahlung with keV, which is inconsistent with a hard IP population.
Recent measurments of the X-ray luminosity function of DNe also support that they could be a dominant contributor to the Galactic diffuse emission. Reis et al. (2013) and Byckling et al. (2010) have shown that there is a population of DNe in the solar neighborhood with luminosities down to at least erg s-1, with spectra similar to the keV observed in brighter DNe. This could indicate a high space density of short-period, low-luminosity CVs (Pretorius & Knigge, 2012), as predicted by population synthesis models (de Kool, 1992; Politano, 1996). However, the statistics of these faint DNe population studies are still poor.
We thus conclude that while the diffuse hard X-ray emission of the Galactic center is dominated by IPs, the emission of the Galactic bulge is dominated by DNe. As we state above, our spectrum of the bulge is consistent with previous large-scale measurements along the Galactic ridge; however, there is evidence that the emission along the ridge may be more complicated than a single dominant population. NuSTAR measurements of resolved point sources in the Norma arm region () revealed an average temperature of keV (Fornasini et al., 2017), significantly harder than the average ridge spectrum measured by INTEGRAL and RXTE (Krivonos et al., 2007; Revnivtsev et al., 2009). This could indicate that the ratios of different source populations in each region are influenced by its particular star formation history, or that the sources resolved by NuSTAR are biased towards harder spectra. Follow-up studies of the broad-band spectra of individual sources and 0-bounce studies of the diffuse spectra in the Norma region may help resolve this issue.
6. Conclusion
We have used a technique that combines contributions from both the NuSTAR focused (“2-bounce”) and unfocused (“0-bounce”) fields-of-view to measure the broad-band continuum spectrum of the diffuse bulge X-ray emission. This allows us to accurately measure the temperature of the low-energy continuum and search for any possible high-energy population, as well as compare with previous broad-band measurements of the inner 10 pc and inner 100 pc of the Galactic center using the same instrument.
We detect the GBXE above the instrumental background up to energies of 20 keV. Our measured emissivity, erg s-1 is consistent with that measured by RXTE in the bulge and ridge. No significant emission is detected above 20 keV, and thus we do not find any evidence of an IP population that has been posited to dominate the hard X-ray emission. The spectrum, which is well-described by a 1T model with keV, is significantly softer than the NuSTAR measurements of the GCXE, where the point source and diffuse populations are consistent with an average temperature of keV (Hong et al., 2016; Perez et al., 2015). This is also softer than the broad-band Suzaku measurements of the GBXE reported in Yuasa et al. (2012). However, these measurements extended to radii of the Galactic center, and thus cover a transition region where the spectrum consists of a combination of the softer emission of the bulge and the harder emission of the center. We thus conclude that previous broad-band X-ray measurements of the bulge were likely contaminated by regions containing hard X-ray emission from the heavy intermediate polar population closer to the Galactic center. The broad-band continuum of the bulge is consistent with a dominant population of DNe, supporting the same conclusion reached using detailed Suzaku studies of the Fe line properties and low-energy continuum of the bulge and updated luminosity distribution measurements of local DNe. Future observations are necessary to further characterize the transition region between the dominant IP population of the center and this DNe population of the bulge.
References
- Anzolin et al. (2008) Anzolin, G., de Martino, D., Bonnet-Bidaud, J.-M., et al. 2008, A&A, 489, 1243
- Arnaud (1996) Arnaud, K. A. 1996, ASP Conference Series, 101, 17
- Balucinska-Church & McCammon (1992) Balucinska-Church, M., & McCammon, D. 1992, ApJ, 400, 699
- Britt et al. (2015) Britt, C. T., et al. 2015, Mon. Not. Roy. Astron. Soc., 448, 3455
- Byckling et al. (2010) Byckling, K., Mukai, K., Thorstensen, J. R., & Osborne, J. P. 2010, MNRAS, 408, 2298
- Churazov, E. et al. (2007) Churazov, E., Sunyaev, R., Revnivtsev, M., et al. 2007, A&A, 467, 529
- de Kool (1992) de Kool, M. 1992, Astronomy & Astrophysics, 261, 188
- Ebisawa et al. (2001) Ebisawa, K., Maeda, Y., Kaneda, H., & Yamauchi, S. 2001, Science, 293, 1633
- Ebisawa et al. (2005) Ebisawa, K., et al. 2005, Astrophys. J., 635, 214
- Ezuka & Ishida (1999) Ezuka, H., & Ishida, M. 1999, ApJS, 120, 277
- Fornasini et al. (2014) Fornasini, F. M., Tomsick, J. A., Bodaghee, A., et al. 2014, Astrophys. J., 796, 105
- Fornasini et al. (2017) Fornasini, F. M., et al. 2017, Astrophys. J. Suppl., 229, 33
- Ge et al. (2015) Ge, C., Li, Z., Xu, X., et al. 2015, Astrophys. J., 812, 130
- Gruber et al. (1999) Gruber, D. E., Matteson, J. L., Peterson, L. E., & Jung, G. V. 1999, Astrophys. J., 520, 124
- Hailey et al. (2016) Hailey, C. J., et al. 2016, Astrophys. J., 826, 160
- Harrison et al. (2013) Harrison, F. A., Craig, W. W., Christensen, F. E., et al. 2013, Astrophys. J., 770, 103
- Heard & Warwick (2013) Heard, V., & Warwick, R. S. 2013, MNRAS, 428, 3462
- Hong (2012) Hong, J. 2012, MNRAS, 427, 1633
- Hong et al. (2012) Hong, J., van den Berg, M., Grindlay, J. E., Servillat, M., & Zhao, P. 2012, ApJ, 746, 165
- Hong et al. (2016) Hong, J., et al. 2016, Astrophys. J., 825, 132
- Ishida et al. (2009) Ishida, M., Okada, S., Hayashi, T., et al. 2009, PASJ, 61, S77
- Koyama (2018) Koyama, K. 2018, Publ. Astron. Soc. Jap., 70, R1
- Koyama et al. (1989) Koyama, K., Awaki, H., Kunieda, H., Takano, S., & Tawara, Y. 1989, Nature, 339, 603
- Koyama et al. (1996) Koyama, K., Maeda, Y., Sonobe, T., et al. 1996, PASJ, 48, 249
- Krivonos et al. (2007) Krivonos, R., Revnivtsev, M., Churazov, E., et al. 2007, Astron. Astrophys., 463, 957
- Krivonos et al. (2012) Krivonos, R., Tsygankov, S., Lutovinov, A., et al. 2012, A&A, 545, A27
- Krivonos et al. (2017) Krivonos, R. A., Tsygankov, S. S., Mereminskiy, I. A., et al. 2017, MNRAS, 470, 512
- Launhardt et al. (2002) Launhardt, R., Zylka, R., & Mezger, P. G. 2002, Astron. Astrophys., 384, 112
- Madsen et al. (2017) Madsen, K. K., Christensen, F. E., Craig, W. W., et al. 2017, J. Astron. Telesc. Instrum. Syst., arXiv:1711.02719
- Madsen et al. (2017) Madsen, K. K., Forster, K., Grefenstette, B. W., Harrison, F. A., & Stern, D. 2017, Astrophys. J., 841, 56
- Madsen et al. (2015) Madsen, K. K., et al. 2015, Astrophys. J. Suppl., 220, 8
- Mori et al. (2015) Mori, K., et al. 2015, Astrophys. J., 814, 94
- Mukai (2017) Mukai, K. 2017, Publ. Astron. Soc. Pac., 129, 062001
- Mukai & Shiokawa (1993) Mukai, K., & Shiokawa, K. 1993, ApJ, 418, 863
- Muno et al. (2004) Muno, M. P., Baganoff, F. K., Bautz, M. W., et al. 2004, Astrophys. J., 613, 326
- Muno et al. (2009) Muno, M. P., Bauer, F. E., Baganoff, F. K., et al. 2009, Astrophys. J. S., 181, 110
- Ng et al. (2019) Ng, K. C. Y., Roach, B. M., Perez, K., et al. 2019, arXiv:1901.01262
- Nobukawa et al. (2016) Nobukawa, M., Uchiyama, H., Nobukawa, K. K., Yamauchi, S., & Koyama, K. 2016, Astrophys. J., 833, 268
- Perez et al. (2017) Perez, K., Ng, K. C. Y., Beacom, J. F., et al. 2017, Phys. Rev., D95, 123002
- Perez et al. (2015) Perez, K., Hailey, C. J., Bauer, F. E., et al. 2015, Nature, 520, 646
- Politano (1996) Politano, M. 1996, Astrophysical Journal, 465, 338
- Portegies Zwart et al. (2001) Portegies Zwart, S. F., McMillan, S. L. W., Hut, P., & Makino, J. 2001, Mon.Not.Roy.Soc., 321, 199
- Pretorius & Knigge (2012) Pretorius, M. L., & Knigge, C. 2012, MNRAS, 419, 1442
- Pretorius et al. (2013) Pretorius, M. L., Knigge, C., & Schwope, A. D. 2013, MNRAS, 432, 570
- Pretorius & Mukai (2014) Pretorius, M. L., & Mukai, K. 2014, Mon. Not. Roy. Astron. Soc., 442, 2580
- Reis et al. (2013) Reis, R. C., Wheatley, P. J., Gansicke, B. T., & Osborne, J. P. 2013, Mon. Not. Roy. Astron. Soc., 430, 1994
- Revnivtsev & Molkov (2012) Revnivtsev, M., & Molkov, S. 2012, Monthly Notices of the Royal Astronomical Society, 424, 2330
- Revnivtsev et al. (2006a) Revnivtsev, M., Molkov, S., & Sazonov, S. 2006a, Mon. Not. Roy. Astron. Soc., 373, L11
- Revnivtsev et al. (2009) Revnivtsev, M., Sazonov, S., , et al. 2009, Nature, 458, 1142
- Revnivtsev et al. (2006b) Revnivtsev, M., Sazonov, S., Gilfanov, M., Churazov, E., & Sunyaev, R. 2006b, Astron. Astrophys., 452, 169
- Sazonov et al. (2006a) Sazonov, S. Y., Revnivtsev, M., Gilfanov, M., Churazov, E., & Sunyaev, R. 2006a, Astron. Astrophys., 450, 117
- Sazonov et al. (2006b) —. 2006b, Astron. Astrophys., 450, 117
- Shaw et al. (2018) Shaw, A. W., Heinke, C. O., Mukai, K., et al. 2018, Mon. Not. Roy. Astron. Soc., 476, 554
- Suleimanov et al. (2005a) Suleimanov, V., Revnivtsev, M., & Ritter, H. 2005a, A&A, 435, 191
- Suleimanov et al. (2005b) —. 2005b, A&A, 435, 191
- Tanaka (2002) Tanaka, Y. 2002, A&A, 382, 1052
- Wijnen et al. (2015) Wijnen, T. P. G., Zorotovic, M., & Schreiber, M. R. 2015, Astron. and Astroph., 577, A143
- Wik et al. (2014) Wik, D. R., et al. 2014, Astrophys. J., 792, 48
- Wilms et al. (2000) Wilms, J., Allen, A., & McCray, R. 2000, ApJ, 542, 914
- Worrall et al. (1982) Worrall, D. M., Marshall, F. E., Boldt, E. A., & Swank, J. H. 1982, Astrophys. J., 255, 111
- Xu et al. (2016) Xu, X.-j., Wang, Q. D., & Li, X.-D. 2016, Astrophys. J., 818, 136
- Yamauchi et al. (2016) Yamauchi, S., Nobukawa, K. K., Nobukawa, M., Uchiyama, H., & Koyama, K. 2016, Publ. Astron. Soc. Jap., 68, 59
- Yan et al. (1998) Yan, M., Sadeghpour, H. R., & Dalgarno, A. 1998, The Astrophysical Journal, 496, 1044
- Yuasa et al. (2012) Yuasa, T., Makishima, K., & Nakazawa, K. 2012, Astrophys. J., 753, 129
- Zorotovic et al. (2011) Zorotovic, M., Schreiber, M. R., & Gänsicke, B. T. 2011, A&A, 536, A42
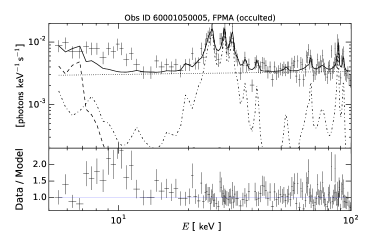
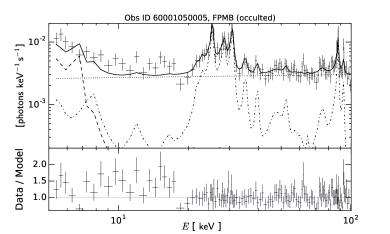
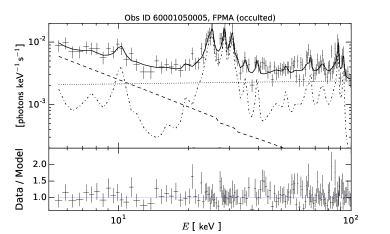
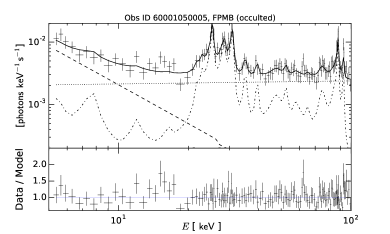
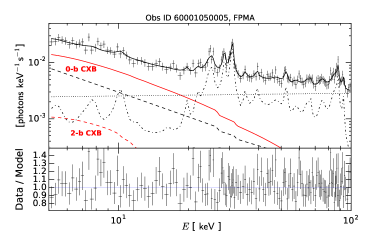
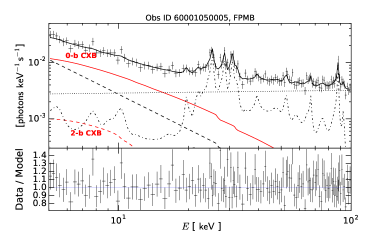
Appendix A Validation of 0-bounce, 2-bounce, and background treatment using Obs 60001050005
We validate our treatment of the 0-bounce, 2-bounce, and instrumental background emission components by measuring the cosmic X-ray background (CXB) spectral shape and flux. For this study, we use Obs 60001050005, an extragalactic field with the point-like source NGC4051, and apply similar data cleaning as described in Sec. 3.2. We remove a 60′′-radius region around this source. We also remove data from passages through the South Atlantic Anomaly and any periods with an elevated 3–5 keV count rate. We then extract spectra from the full remaining FOV in two configurations: occulted data, when the NuSTAR FOV is blocked by the Earth, and science-mode data, which is typically used for analysis.
We use the occulted data to investigate our instrumental background models, as shown in Fig. 5. The two background models that we compare are introduced in Sec. 4.1. The default NuSTAR background model (Wik et al., 2014) exhibits significant residual emission below 20 keV. In contrast, our modified background model, in which the 1 keV thermal plasma component is replaced with a power-law, removes any significant features from the fit residuals, yielding a good fit quality with 0.95 (107.91/114) and 0.84 (84.63/101) for FPMA and FPMB, respectively.
We then apply our modified instrumental background model to the science-mode data. We fix the background power-law index and relative normalization with respect to the high-energy continuum to the best-fit values from occulted data, while the line and continuum component normalizations are left free. The 0-bounce and 2-bounce effective areas are treated as described in Sec. 3.3. We force the flux of the 2-bounce component, in units of , to be equal to that of the 0-bounce component, since we do not expect significant variations in the flux between the two regions. The CXB spectral shape frozen to that measured by INTEGRAL (Churazov, E. et al., 2007), with the flux of 0-bounce CXB left free to fit.
This treatment of the 0-bounce, 2-bounce, and instrumental emission provides a good description of the data, as shown in Fig, 6. The overall fit quality is good, with 0.88 (105.14/120) and 0.87 (94.06/108) for FPMA and FPMB, respectively. The derived 3-20 keV CXB flux is for FPMA and for FPMB. This is consistent with the 3–20 keV flux measured by INTEGRAL, , given the 10% overall NuSTAR cross-calibration uncertainty (Madsen et al., 2015). We thus conclude that our analysis method yields the correct overall spectral shape and flux level for the CXB.