Temperature and field evolution of site-dependent magnetism in -Fe2O3 nanoparticles
Abstract
8 nm -Fe2O3 nanoparticles exhibit a spin reorientation transition that begins at 150 K which is a hallmark of this unique iron-oxide polymorph. We find that the change from the high to low temperature magnetic structures has been suppressed by 50 K. At the spin reorientation temperature, a change of the field-dependent response of the tetrahedral sites in intermediate field strengths (0.25 – 1.5 T) indicates that a collective tetrahedral distortion occurs to which the octahedral sites adjust, altering the magnetic anisotropy. An abrupt step in the hyperfine parameters’ temperature dependencies, especially at 125 K for the hyperfine field associated with the Fe4 tetrahedral sites, suggests strongly a change in the superexchange pathways are responsible for the spin reorientation.
I Introduction
-Fe2O3 is the least common and understood iron oxide polymorph. Initial reports specifying this phase, distinct from Fe3O4, and - and -Fe2O3, appeared in the 1930sForestier and Guit-Guillain (1934). But, it was not until the late 1990sTronc et al. (1998) that a silica matrix surrounding -Fe2O3 parent nanoparticles was identified as the method to permit phase-pure synthesis of this intermediate phase between metastable -Fe2O3 and thermodynamically stable -Fe2O3. -Fe2O3 has attracted significant interest recently due to its potential of providing large coercive fields Namai et al. (2012); Ohkoshi and Tokoro (2013); Gich et al. (2005); Tseng et al. (2009), a characteristic unique from the other iron oxides. In addition, -Fe2O3 is a multiferroic with an appreciable room temperature ferrimagnetism and ferroelectricityGich et al. (2014), making it an interesting complimentary candidate material to BiFeO3 (BFO), the well-known room temperature multiferroicGuo et al. (2017) that has an antiferromagnetic-like incommensurate cycloidal-type spin configuration that results in no useful magnetization at room temperature, hampering the development of applicationsXu et al. (2018).
Despite the wealth of research into the iron oxides, a detailed understanding of the -phase’s structure was not achieved until 1998 by Tronc et al.Tronc et al. (1998), reflecting the difficulty of phase-pure synthesis. Sol-gel techniques have largely been adopted, allowing for relatively precise control over particle size, a critical factor in achieving thermodynamic stability of the -phaseSakurai et al. (2005a). To change the shape and magnetocrysalline anisotropy contributions to the magnetism and thereby increase the coercivity, several groups have focused on site-substitution with metal ions such as aluminum, gallium and indiumSakurai et al. (2005a); Namai et al. (2012); Ohkoshi and Tokoro (2013); Tseng et al. (2009); Gich et al. (2006); Machala et al. (2011). Such systems show coercive fields very often exceeding 2 T at room temperature, due in part to rod-like crystallization encouraged by the preferential adsorption at the impurity sites, as well as larger spin-orbit coupling enabled with the heavy metal ions. There has also been recent success in the direct conversion from magnetite (Fe3O4) to -Fe2O3 via a nano-size wet processTokoro et al. (2018), though the conversion largely results in maghemite (-Fe2O3).
-Fe2O3 crystallizes into an orthorhombic cell structure in the space group Gich et al. (2006). The unit cell parameters at room temperature have been reported as Å, Å, and ÅOhkoshi and Tokoro (2013), and it is comprised of four unique iron sites. A site labelling convention has emerged that tracks the level of distortion of the sites at 200 KTuček et al. (2010), where two octahedrally coordinated sites, Fe1 and Fe2 show similar, high levels of distortion, while another octahedral, Fe3, and a tetrahedral, Fe4 site present relatively little distortion.
-Fe2O3 is a ferrimagnet, although there exists some disagreement in the literature regarding the collinearity of the sublattice magnetizations. A collinear ferrimagnetic description has been identified by many groupsOhkoshi and Tokoro (2013); Tseng et al. (2009); Machala et al. (2011), where a weakly compensating tetrahedral sublattice magnetization results in the small ferromagnetic component along the -axis of the unit cell. Below a transition temperature of 125 K, however, the spin configuration turns into an incommensurate structure involving square-wave oscillation of the sublattice magnetizations. An alternative description of sinusoidally oscillating sublattice magnetizations has also been presented based on neutron powder diffraction measurementsGich et al. (2006). Additionally, a spin-canted descriptionKurmoo et al. (2005) as the origin of the ferrimagnetism has been inferred from the superexchange pathways associated with the 16 iron sites in the unit cell, where chains of Fe1-Fe2-Fe3 octahedra form ferromagnetic units that are antiferromagnetically coupled to the Fe4 tetrahedra. The tetrahedral sites experience spin frustration due to Fe4-Fe4 antiferromagnetic superexchange, resulting in a canted ground state. In this description, the transition at 125 K is associated with a change in the canting angleKurmoo et al. (2005). The transition is most notably marked by a near complete collapse of the coercive field around 75–80 K, followed by a reemergence around 125 K, indicating a change in the nature of the magnetic anisotropy and associated spin and electronic configurations of the Fe sites.
We have examined how the transition described above impacts 8 nm -Fe2O3 nanoparticles that are approximately half the size of previously studied systems which are phase pure and reasonably monodisperse (synthesis of this material is an ongoing challenge). These smaller nanoparticles provide an ideal test-bed for examining the interplay between the nanomagnetism of finite size effects (e.g. surface spin disorder) and a magnetic spin transition that is unique amongst the iron oxides. Considering the unit cell of -Fe2O3 is smaller compared to the other ferrimagnetic iron oxides (0.42 nm3 vs 0.58 nm3 for -Fe2O3 and Fe3O4) and its symmetry is low such that spin interactions are quite complexXu et al. (2018), -Fe2O3 is likely even more susceptible to finite-size effects on its magnetismfin . Indeed, we find that due to the approximately three-fold increase in surface-to-volume Fe3+ (compared to the larger, e.g. 25 nm, crystallites studied) that the transition from the high to low temperature magnetic structures had been suppressed to 40 K in comparison to the 90 K observed in larger (e.g. 25 nm) -Fe2O3 nanoparticles. The effect of surface spin disorder is revealed by an exchange bias field whose temperature dependence is linked to the transition. Site-specific magnetism identified by x-ray magnetic circular dichroism and Mössbauer spectroscopy show that the temperature dependence of the orbital and spin magnetism maps onto the observed changes in overall magnetic anisotropy. Also, an abrupt step in the hyperfine fields associated with the Fe4 tetrahedral sites suggests strongly a change in that superexchange pathway through the oxygen ions is responsible. The definite and unique thermal evolution of the Fe-sites’ magnetism along with an apparent lack of inter-site disorder suggests a collective transition of electronic localization properties.
II Experimental Methods
The nanoparticles were synthesized following the protocol developed by Ohkoshi et al.Ohkoshi and Tokoro (2013), involving a colloid of reverse micelles impregnated with iron nitrate nonahydrate (Alfa Aesar), and silica coated using a sol-gel approachHench and West (1990). We did not attempt to promote rod growth via preferential adsorption of heavy metal ions as in previous works, and instead modified the density of the alkane dispersive media by using n-decane (Fisher Chemical) instead of n-octane (n-hexane and n-dodecane were also used, but resulted in a small -Fe2O3 component, consistent with the sol-gel stage forming micelles too large for -Fe2O3 thermodynamic stability, where the condition for a given phase is related to the particle diameterOhkoshi and Tokoro (2013)). In brief, a reverse micelle solution was formed from 18.3 ml of n-decane mixed with 6 ml of DI water, 3.7 mL of 1-Butanol (Fisher), 4.05 g Cetrimonium bromide (CTAB; Fisher), and 0.9 g Fe(NO3)3-9H2O (Alfa Aesar). A second reverse micelle solution of made with the same amounts of decane, DI water and 1-Butanol with 2 ml of aqueous ammonia (20-30%; Aldrich) and 3.7 g CTAB. This second reverse micelle solution was added drop-wise to the first one under vigorous stirring over 10 minutes, and stirred for an addition 30 minutes. Then, a gel of 1.0 ml of tetraethyloxysilane (TEOS; Fisher) was added to the sol of dispersed reverse micelle solutions, and mixed for 18 hours. The solution was then centrifuged, and the precipitate washed in equal parts ethanol and chloroform to remove excess organics and surfactants, and air dried at 70∘C for 12 hours. The resulting transformation product was vacuum dried for two hours and sintered in a tube furnace at 1000∘C for four hours. For imaging purposes, the majority of the silica matrix was dissolved by stirring the -Fe2O3 nanoparticles in a 2M NaOH bath for 24 hours.
X-ray diffraction patterns were collected using a Bruker D8 Discover with DaVinci using Cu Kα radiation with a Bragg-Brentano geometry. For patterns collected under ambient conditions, a rotating stage was used with the sample mounted onto a zero-background quartz slide. A Göbel mirror was used on the primary optics, knife edges were used to minimize air-scattering, and a motorized slit and a Ni filter was used in front of the secondary detector Lynxeye optics in 1D mode. The low temperature x-ray diffraction patterns were collected using a Phenix closed-cycle refrigeration stage.
Transmission electron microscopy (TEM) imaging was performed using a FEI Talos F200X S/TEM. The nanoparticles were prepared by dropping a mixture of nanoparticle solution diluted in hexanes onto a copper coated carbon grid.
X-ray absorption spectroscopy (XAS) and x-ray magnetic circular dichroism (XMCD) measurements were done at beam line 4-ID-C of the Advanced Photon Source in a liquid helium cryostat with powder samples mounted on carbon tape onto a cold finger in a 7 T (maximum) field magnet. All XMCD spectra were collected in total electron yield mode and are XAS normalized as well as averaged over both field polarity measurements to remove non-magnetic artifacts.
Transmission Mössbauer spectra were collected between 10 and 300 K using a Janis SHI-850 closed cycle refrigeration system and a WissEl constant acceleration spectrometer with a 10-GBq 57Co source. The source drive velocity was calibrated using a 6 m thick -Fe foil at room temperature.
Magnetometry and susceptometry experiments were performed using a Quantum Design magnetic properties measurement system (MPMS XL-5). Hysteresis loops were measured from 2 K to 400 K from kOe after cooling in 50 kOe field, or a 0 Oe field (having quenched the magnet at 300 K beforehand, and using the field-profiling and cancelling capability). Zero-field cooled (ZFC)/field cooled (FC) DC susceptibility measurements were done by cooling from 400 to 2 K and subsequent measurements using 100 and 1000 Oe applied fields, and AC susceptibility measurements were done using a 2.5 Oe oscillating applied field from 10 Hz to 1k Hz from 2 K to 300 K. The nanoparticle sample was mounted in a Supracil quartz NMR tube. Energy dispersive x-ray (EDX, collected with a FEI Nova NanoSEM 450) data of the nanoparticles were used to estimate the Fe-oxide-to-SiO2 mass fractions so as to normalize the magnetometry and susceptometry measurements..
III Results and Discussion
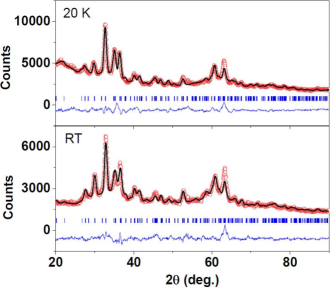
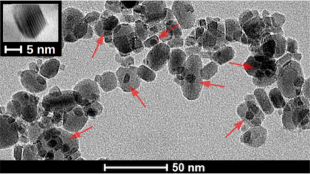
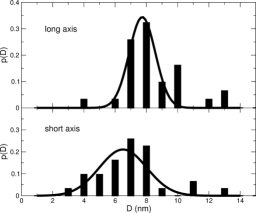
Representative XRD patterns collected between 20 K and room temperature of the -Fe2O3 nanoparticles with the majority of the SiO2 removed are shown in Fig. 1. The contribution from the remaining amorphous SiO2 was included in the patterns’ backgrounds during the Reitveld refinement process. Using the FullProf packageRodríguez-Carvajal (1993), refinements were done using the space group with site occupancies set to the values of -Fe2O3Gich et al. (2006) (i.e. equivalent occupation in the unit cell of each of the four iron sites) and the fitted lattice parameters were =5.0930.002 Å, =8.8740.004 Å and =9.5000.003 Å. The Scherrer broadening incorporated into the refinements identified a volume averaged crystallite size of 8 nm. Unlike previous results on larger 25 nm crystallitesGich et al. (2006); Tseng et al. (2009), there was no observable difference between the ambient temperature pattern and those collected at 50 K increments down to 20 KXRD ; Sakurai et al. (2005b). Previous reports on larger -Fe2O3 crystallites (e.g. see Tseng et al.Tseng et al. (2009) and references therein) identified an observable temperature dependence of and changing by 0.03–0.04% between 200 and 10 K. The XRD patterns of the 8 nm nanoparticles are Scherrer broadened to an extent that likely obscures such small changes in the lattice with cooling. Figure 2a shows a representative TEM image of the -Fe2O3 nanoparticles with most of the SiO2 matrix removed. The particles are mostly parallelepiped shaped, with a tendency towards cubes. Due to the range of shapes, we present the distribution of long- and short-axis ‘sides’ from TEM images (Fig. 2b) determined from ImageJSchneider et al. (2012) analysis. Nanoparticles appear to be well crystallized with clear images of the lattice planes (example in Fig. 2a inset).
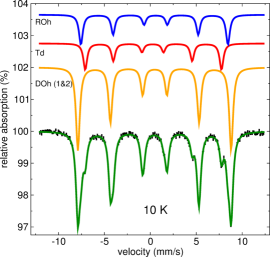
The 10 K Mössbauer spectrum (Fig. 3) presents hyperfine parameters that agree with previous measurementsGich et al. (2006). The spectrum is well described by three subspectra with Lorentzian FWHM =0.2470.008 mm/s (about twice the source’s natural =0.1330.002 mm/s) that reflects the intrinsic chemical and structural disorder due to finite size effects in the 8 nm nanoparticles. The disordered octahedral sites (Fe1 and Fe2) make up 553% of the absorption, and have a hyperfine field =51.830.06 T and isomer shift, =0.8140.006 mm/s. The broadened made resolving the individual Fe1 and Fe2 sites problematic (fits would have both sites settle into the same hyperfine parameters, although with increasing temperature the sites’ subspectra were observable as discussed below). The regular, ordered octahedral site (Fe3) makes up 224% of the relative absorption with a =49.730.08 T and =0.8560.006 mm/s, and experiences local distorted coordination (as expected from the crystal structureGich et al. (2006)) that provides an electric field described by a quadrupole shift =-0.140.03 mm/s. The tetrahedral Fe4 site makes up the rest of the spectrum with a =46.080.02 T and =0.6400.002 mm/s.
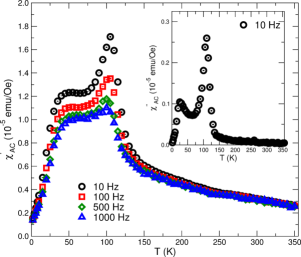
Low field AC magnetic susceptibility measurements present magnetism that is in keeping with the high-temperature to low-temperature (meta)magnetic transition of -Fe2O3Gich et al. (2006); Sakurai et al. (2005b). Figure 4 shows the results of zero-field cooled 2.5 Oe AC susceptibility measurements in =10 Hz – 1 kHz. With warming from 2 K, the in-phase signal, increases in a frequency independent manner quickly until 25 K, whereupon there is a divergence of the frequency responses, where lower frequencies (slower measuring time) yield larger susceptibilities, but the temperature dependencies of are essentially identical with a plateau between 35 and 75 K. Above 75 K, there is a further increase in with a peak at 1052 K, in agreement with the magnetic transition of the -phase. While the peak temperature is frequency independent (Fig. 4), the amplitude of decreases quite significantly with increasing measuring frequency, indicating that the spin reorientation is occurring over a small range of time scales, with the magnetic fluctuations (response of the in-phase component) falling out of the measuring time window. Above 105 K, there is a rapid decrease in with some weak frequency dependence that disappears by 250 K, reflecting the onset of spin dynamics, which the Mössbauer spectra collected over that temperature range reveals (discussed below), and likely from previously frozen frustrated spins (e.g. at the Td sites)Xu et al. (2018) thawing with warming. The high temperature behaviour is similar to previous results on 25 nm -Fe2O3 nanoparticlesGich et al. (2006) with a peak occurring at the transition around 100 K. However, the second sharp maximum in at 90 K present in 25 nm nanoparticles has been suppressed to 35 K (with the plateau ending by 75 K) indicating that the shift in magnetic structures has been driven to lower temperatures in these 8 nm nanoparticles. In keeping with this, the dissipative, out-of-phase component () are qualitatively identical with maxima at 90 and 100 K for the 25 nm crystallites and 252 K and 1105 K for these 8 nm crystallites (inset to Fig. 4). Both and show the same frequency-independent, amplitude-dependent temperature trends.
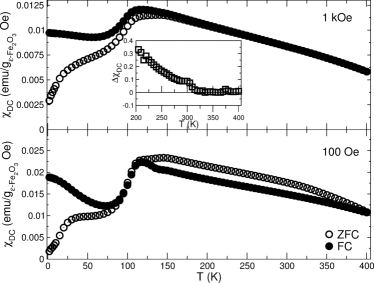
Figure 5 shows the low field DC susceptibility () temperature dependence in 100 Oe and 1 kOe fields. Results are qualitatively similar to larger 25 nm spheresGich et al. (2006) and 20100 nm rodsTadic et al. (2017) of -Fe2O3. However, like the discussed above, indicates atypical nanomagnetism for iron-oxide single-domain nanoparticles. Consider the 10 mT temperature scans. Once the -Fe2O3 nanoparticles were cooled to 2 K in zero field, with warming increases until a plateau between 30 and 75 K (Fig. 5 bottom), followed with a further significant increase with warming to 105 K. These features are linked to the thermal evolution of the magnetic structure going from its low temperature to high temperature configurationGich et al. (2006); Sakurai et al. (2005b); Tadic et al. (2017). With further warming, between 100 and 150 K, there is a slight increase in that is hinting at the effects of small distortions occurring between the Fe-O bondsGich et al. (2006), altering the magnetism in a manner similar to the Verwey transition in Fe3O4Senn et al. (2012); the temperature evolution of the site-specific bonding and magnetism discussed below will provide more insights. Between 150 and 400 K, decreases gradually as thermally driven fluctuations reduce the nanoparticles’ magnetizations over the measurement time. With cooling from 400 K in the 100 Oe field, is less than , atypical behaviour for a nanomagnetic system. From first principles calculationsAhamed et al. (2018) -Fe2O3 should have a tetrahedral (Td, Fe4-site) based high anisotropy component, and these sites are frustrated with a strong temperature dependent site magnetization (identified previouslyGich et al. (2006); Ohkoshi and Tokoro (2013); Tseng et al. (2009) and characterized below). It is likely that the 100 Oe field may not be able to fully couple the the overall ferrimagnetic spin structure resulting in the observed irreversibility; similar behaviour has been reported previouslyZhao et al. (2006); P et al. (2014).
With cooling, presents a ‘bump’ between 150 and 115 K, the established signature of the onset of the transition in the phaseSakurai et al. (2005b), and and overlap until 115 K, where the low temperature structure is established. Below this temperature, and diverge, tracking with the irreversible magnetization processes identified with discussed above. Using a larger measuring field (1 kOe shown in Fig. 5) suppresses the signatures of the transitions discussed above, as the larger field quenches the signatures of the changes in magnetic structure with warming and cooling and the spin frustration (e.g. above 150 K, and overlap – see in the inset of Fig. 5), and the frustrated magnetism from the temperature dependent higher anisotropy Fe4 Td site is no longer observableSakurai et al. (2005b); Xu et al. (2018).
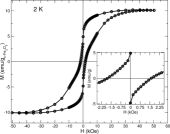
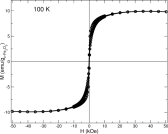
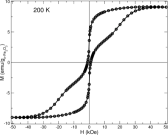
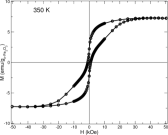
Figure 6 shows representative 400 K zero-field cooled hysteresis loops between 2 to 350 K that show changes to the overall magnetism of the nanoparticles: The loop shapes change quite dramatically between temperatures, providing a measure of the impact of the spin reorientation transition and the complexity of the thermal evolution of the overall magnetic anisotropy. The loops hint at an interesting interaction between the Fe1-to-Fe4 sites’ electronic structure and magnetism, examined in detail using Mössbauer and x-ray synchrotron spectroscopies, discussed later.
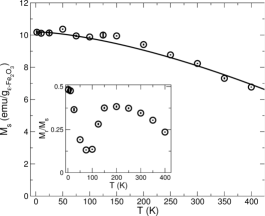
Figure 7 presents the temperature dependence of the saturation magnetization () and remanent magnetization () of the -Fe2O3 nanoparticles. is well described over the complete range of temperatures using the Bloch T3/2 law for collective spin oscillations, , where (solid line in Fig. 7) in good agreement with the Bloch constant of similar sized iron oxide nanoparticlesGoya et al. (2003); Barbeta et al. (2010). Interestingly, separates from the trend at 50 K and between 125 and 200 K, which indicates that the spin wave behaviour is affected by the transition from low temperature to high temperature magnetic phases and the concomitant anisotropy changes. The temperature dependence of (inset to Fig. 7) shows the impact of these changes even more clearly, especially below 200 K, in agreement with previous results on -Fe2O3 nanoparticlesTseng et al. (2009); Gich et al. (2006).
The unusual temperature dependence of the -Fe2O3 nanoparticles’ remanent magnetization () from the hysteresis loop measurements (e.g. Fig. 6) is shown clearly by in the inset of Fig. 7. At the lowest temperatures (2 – 10 K) 0.5, in keeping with a random distribution of noninteracting (i.e. no dipolar effects) uniaxial single domain nanoparticlesStoner and Wohlfarth (1948). With warming into the transition from 25 to 100 K there is a significant decrease of to 0.15, which is indicating that the nanoparticles’ spin (domain) structure is being altered, e.g. the ferrimagnetic spin configuration is changing with warming as is the magnetocrystalline anisotropy. With further warming to 150 K, where the high temperature phase takes a hold of the magnetic structure, there is an equally rapid return of 0.4 that decreases monotonically to 0.25 by 400 K due to thermal effects and the temperature dependence of the anisotropy ( where ).
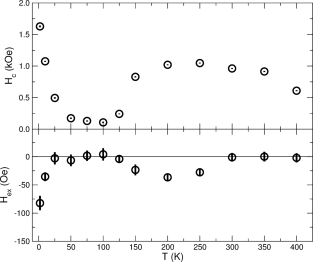
The shifting of spin configurations of the -Fe2O3 nanoparticles and the impact on the magnetic anisotropy () with temperature is most unmistakably observed in the coercivity’s temperature dependence ( where and Hc2 are the negative field and positive field coercivities, respectively) presented in Fig. 8. From 400 to 150 K, is weakly temperature dependent, but with the onset of the transition with further cooling, rapidly decreases to 0 until the onset of the low temperature magnetic structure is established at 50 K. Once the low temperature spin configuration has been frozen in (as revealed explicitly by the temperature dependence of the Mössbauer spectroscopy and XMCD site-specific magnetism discussed below) increases monotonically to its maximum value at 2 K.
At least 50% of the Fe3+ ions are on or near the surface (a unit-cell thick) of the 8 nm crystallites. Also, the Fe1 and Fe2 Oh and Fe4 Td sites experience disorder even inside the ‘core’. Thus, a considerable number of the Fe3+ ions should be magnetically frustrated (e.g. will experience broken bonds or are uncompensatated, which we quantify using Mössbauer spectroscopy). This should result in the observed complex hysteresis loop shapes due to the competing surface and core anisotropies, and also can enable a unidirectional anisotropy that results in an exchange bias loop shift – behaviour that has been observed in similar sized -Fe2O3 nanoparticlesSkoropata et al. (2014), and many other ferrite-based nanomagnets, including core/shell structured magnetsSkoropata and van Lierop (2017). We observed a small but measurable ‘spontaneous’ exchange bias loop shift (, bottom panel of Fig. 8). mirrors the results of the spin reorientation transition between 25 K and 150 K (as identified with the and the site-specific magnetism discussed below) and we link this exchange coupling to both spin frustration and the spontaneous symmetry breaking of the magnetic transition (0 through the high-temperature to low-temperature spin transition). Similar magnetism has been reported in the structural/magnetism multiferroic analogue BFODong et al. (2011); Maity et al. (2013). Field-cooling from 400 K in a 50 kOe field removes and leaves unaffected. We postulate that the 50 kOe field during cooling (especially through the spin transition) forces the alignment of the spins so as to weaken or entirely remove the exchange coupling pathways that enable .
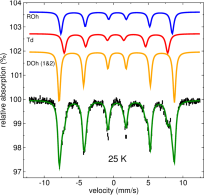
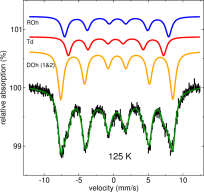
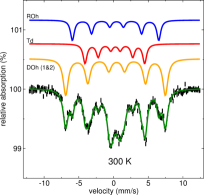
To clearly characterize the site-specific structure and magnetism changes identified by the magnetometry and susceptometry, we turn to the information provided by Mössbauer spectroscopy that measures the atomic 57Fe magnetism. Mössbauer spectroscopy uses the resonant absorption and recoilless emission of gamma rays to excite transitions in the probe nuclei. The atomic-level electronic and magnetic environments of 57Fe atoms throughout the sample volume are characterized by the hyperfine parameters that affect the energy required to excite the transitions. These transitions are identified by the hyperfine field () that describes the magnetic environment, and the isomer shift () and quadrupolar splitting () that reflect the local electronic environment about the 57Fe nucleus in the nanoparticles, and the spectral component linewidths () due to the lifetime of the excited state of the nucleus, with any measured increase in compared to that of the 6 m -Fe foil related to structural or chemical disorder from a (small) distribution of hyperfine parameters away from the site-specific values (e.g. of the ideal, bulk structure). Example spectra at temperatures through the low temperature to high temperature regimes of the spin transition are shown in Fig. 9. The temperature dependence of the spectral total relative absorption, i.e. the 57Fe recoil free fraction (-factor, or Debye-Waller factor), presented in Fig. 10, clearly identifies the change in the magnetic configuration starting at 150 K and evolving with further cooling. The -factor is related to the crystal lattice phonon-modes and is very sensitive to changes in electronic bonding (e.g. the onset of a magnetic order at )Gütlich and Trautwein (2010), and the increase in at 125 K is in agreement with the magnetic transition detected with neutron diffractionGich et al. (2005, 2006).
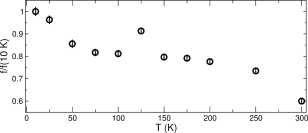
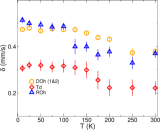
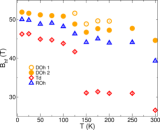
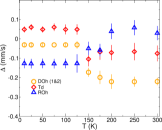
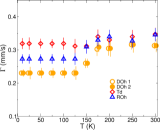
Figure 11 shows the fit results to the Mössbauer spectra. Overall, the interesting site-specific behaviour presented agrees with previous observationsGich et al. (2006), including the general trends observed in the hyperfine fields and isomer shifts. Since these -Fe2O3 nanoparticles are significantly smaller, the spectra exhibit the effects of structural and chemical disorder due to finite-size effects (e.g. spectral linewidths significantly broader than the nature linewidth of the -ray source (0.1330.004 mm/s)). Four components for the different Fe sites were usedrel , however both distorted octahedral sites (DOh; Fe1 and Fe2) settled towards the same hyperfine parameters with equivalent s, with both sites becoming clearly resolvable (e.g. specific s for each site) across the transition. Fig. 11a shows that the isomer shifts of the two distorted octahedral sites have the expected thermal evolution due to second-order Doppler shift effectsGütlich and Trautwein (2010), but the tetrahedral and regular octahedral sites show a step-like behaviour through the transition. This can be ascribed to a decrease in 2 - 3 intermixing, lowering the 4 occupation and allowing a radial decompression of the other -shell charge densities, thereby lowering , the electronic density at the nucleus. A subtle change in the ferrimagnetic structure could precipitate this, via either the direct overlap and covalency of the bonds, or indirectly by a change in the distortion of the coordination polyhedra of the Fe-sublattices, such that the energy separation between the orbitals (through O exchange) is redistributed. At the low temperatures (10–100 K), the large hyperfine fields (Fig. 11b) observed for all components is typical for high-spin complexes with large Fermi contact fields, and are consistent with s of all other iron-oxides; Oh and Td s are in good agreement with those of - and -Fe2O3, and Fe3O4Greenwood and Gibb (1971). of the Fe1,2 DOh sites show that the magnetic transition is ‘sluggish’ with the Fe1 DOh site experiencing changes to the local magnetic environment at a higher temperature than the Fe2 DOh site. The Fe4 Td site also shows the slow thermal development of the transition, with a slow decrease in between 25 and 100 K (as indicated by e.g. discussed above). Then, a most dramatic change in local environment through the transition is observed, dropping 40% in a step-like fashion, that indicated a dominant contribution to the Fermi contact component of via a reduction in core-spin polarization due to a change in charge mixing, and the orbital- and spin-dipolar contributions to the hyperfine field is present. The change in the local electronic charge distribution symmetry that affects is observable in the step-line change in values (Fig. 11c) that is common to all sites and consistent with changes in distortion of the coordination polyhedra. The overall changes in hyperfine parameters may also be consistent with a localized-to-itinerant transition in the electronic orbitals, such that the superexchange conditions change spontaneously, e.g. at the Fe4 sites, and propagate throughout the crystal structure. The temperature dependence of the fitted linewidths for each site (Fig. 11d) show that the site disorder is constant throughout the transition, specifically indicating a lack of changes in the Fe4 inter-site disorder, and the higher temperature spectra reveal that the amount of disorder about the Fe1,2 DOh sites increases slightly with warming through the transition. In combination, the fit results of the Mössbauer spectra show that there is a collective transition centred on the tetrahedral sites, whose effects presumably propagate through to the other Fe sites.
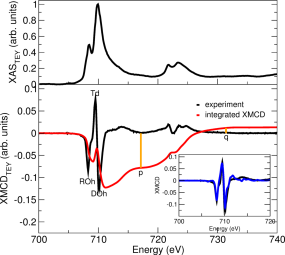
X-ray absorption spectroscopy (XAS) collected over the Fe (700–730 eV) L3,2 edges (2 transitions) were collected to develop a more detailed picture of the evolution of the Fe electronic configurations with temperature and field (x-ray magnetic circular dichroism, XMCD). Figure 12 shows the 10 K XAS and XAS normalized XMCD spectra. The Fe XAS spectrum was typical for a spinel Fe-oxideBrice-Profeta et al. (2005) and is in in good agreement with results on larger -Fe2O3 nanoparticlesTseng et al. (2009). Ligand-field multiplet simulationsFernández-Rodríguez et al. (2015); Stavitski and De Groot (2010) including weighted contributions from all sites (determined from the Mössbauer fits) are in good agreement with the spectra (Fig. 12 inset). The XMCD spectrum site assignment show that the octahedral sites’ magnetizations align parallel to each other, and the antiferromagnetically coupled tetrahedral sites align anti-parallel.
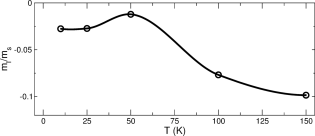
Using sum rule analysisThole et al. (1992); Carra et al. (1993); Chen et al. (1995) on the XMCD spectra collected at various temperatures, we have determined the relative contributions of spin and orbital moments using /=, where and are the integrated XMCD intensities over the edge, and the combined and edges, respectively, shown in Fig. 12. We find an anti-parallel spin and orbital alignment (the negative sign of /), and an increase in / as it enters the spin reorientation transition with warming from 10 K, followed by a rapid decrease of / until 150 K.
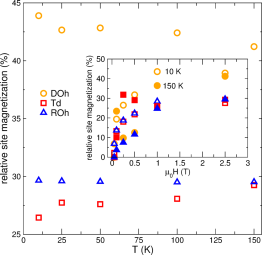
The magnitudes of the relative site magnetization ascertained from the edge amplitudes as a function of temperature is presented in Fig. 14, with the field dependence of the sites at 10 and 100 K presented in the inset. The temperature dependence of the site magnetizations reflect over the same range of temperatures (keeping in mind that there is no direct relationship between elemental magnetization and due to complexities of the transferred hyperfine field effectsSkoropata (2017)). The field dependence of the Fe sites (inset of Fig. 14) identifies a nearly constant magnetization for the tetrahedral site when the field is larger than about 0.5 T. This behaviour, in contrast to the other sites showing a typical vs dependence over these field values indicates the alignment of the tetrahedral site occurs at smaller fields than that of the octahedral sites. This further corroborates the imbalance of the Td Fe4 moments as the source of the ferrimagnetic configuration of this material, consistent with both the collinear ferrimagnetic and canted antiferromagnetic descriptions suggested previouslyTronc et al. (1998); Gich et al. (2005). Furthermore, the change in the magnetic response of the tetrahedral site at the spin reorientation temperature further supports the notion of a collective tetrahedral distortion – in crystal structure and/or electronic localization – to which the octahedral sites adjust. Indeed, there may be a sufficiently strong Fe4-Fe4 inter-site coupling such that a spontaneous distortion to lower symmetry with cooling is energetically favoured, which is reasonable given the shared oxygen bonds in these sites. This may also result in the observed spontaneous exchange bias, since a change in crystal symmetry will surely affect the exchange interactions present, and a coexistence of two or more regions of differing exchange interactions will generally produce a unidirectional anisotropy.
IV Conclusions
We find that clear evidence of the spin transition unique to -Fe2O3, however the shift from the low temperature to high temperature magnetic configuration has been driven to lower temperatures in these 8 nm nanoparticles compared to previous reports on nanoparticles more than twice this size. Due to finite-size effects, a significant amount of spin disorder is revealed by a spontaneous exchange bias field whose temperature dependence is linked to the transition described above, as well as the substantial frustration on (), and thermal evolution of the Fe sites’ coordination environments (, and (especially the Td Fe4 sites), likely due to many surface sitesfin suffering broken coordination due to the relative smaller size and increased surface area of the 8 nm -Fe2O3 nanoparticles. We find that the site-specific magnetism maps onto the changes in anisotropy (tracking with the coercive field’s temperature dependence) and an abrupt step in the hyperfine fields associated with the Fe4 tetrahedral sites suggests strongly a change in that superexchange pathway through the O2 ions is responsible. Furthermore, a change in the magnetic response of the tetrahedral site in intermediate fields at the spin reorientation temperature indicates that a collective tetrahedral distortion to which the octahedral sites adjust is occurring. The definite and unique thermal evolution of the Fe4 sites along with an apparent lack of inter-site disorder suggests a collective transition of electronic localization properties, as temperature dependence x-ray diffraction measurements present no obvious change in crystal structure. Examining the temperature dependence of the and electronic states of the O ions using K-edge XAS, as well as hard x-ray K-edge XAFS investigations of the Fe coordination as a function of temperature and field would provide further insights into the structure-function relationships in this novel iron-oxide.
Acknowledgements.
We thank Dr. D. J. Keavney for assistance with the XAS and XMCD measurements. The authors acknowledge funding from the Natural Sciences and Engineering Research Council of Canada (RGPIN-2018-05012) and the Canada Foundation for Innovation. Use of the Advanced Photon Source at Argonne National Laboratories was supported by the US DOE under contract DE-AC02-06CH11357.References
- Forestier and Guit-Guillain (1934) H. Forestier and G. Guit-Guillain, C.R. Acad. Sci.(Paris) 199 (1934).
- Tronc et al. (1998) E. Tronc, C. Chanéac, and J. P. Jolivet, Journal of Solid State Chemistry 139, 93 (1998).
- Namai et al. (2012) A. Namai, M. Yoshikiyo, K. Yamada, S. Sakurai, T. Goto, T. Yoshida, T. Miyazaki, M. Nakajima, T. Suemoto, H. Tokoro, and S.-i. Ohkoshi, Nature Communications 3, 1035 (2012).
- Ohkoshi and Tokoro (2013) S. I. Ohkoshi and H. Tokoro, Bulletin of the Chemical Society of Japan 86, 897 (2013).
- Gich et al. (2005) M. Gich, A. Roig, C. Frontera, E. Molins, J. Sort, G. Chouteau, D. Martin y Marero, and J. Nogués, Journal of Applied Physics 98, 044307 (2005).
- Tseng et al. (2009) Y. C. Tseng, N. M. Souza-Neto, D. Haskel, M. Gich, C. Frontera, A. Roig, M. van Veenendaal, and J. Nogu’es, Physical Review B 79, 094404 (2009).
- Gich et al. (2014) M. Gich, I. Fina, A. Morelli, F. Sánchez, M. Alexe, J. Gàzquez, J. Fontcuberta, and A. Roig, Advanced Materials 26, 4645 (2014).
- Guo et al. (2017) E.-J. Guo, J. R. Petrie, M. A. Roldan, Q. Li, R. D. Desautels, T. Charlton, A. Herklotz, J. Nichols, J. van Lierop, J. W. Freeland, S. V. Kalinin, H. N. Lee, and M. R. Fitzsimmons, Advanced Materials 29, 1700790 (2017).
- Xu et al. (2018) K. Xu, J. S. Feng, Z. P. Liu, and H. J. Xiang, Physical Review Applied 9, 044011 (2018).
- Sakurai et al. (2005a) S. Sakurai, S. Ohkoshi, J. Jin, and K. Hashimoto, Journal of Applied Physics 97, 10K312 (2005a).
- Gich et al. (2006) M. Gich, C. Frontera, A. Roig, E. Taboada, E. Molins, H. R. Rechenbert, C. Ritter, V. Hardy, J. Sort, V. Skumryev, and J. Nogue’es, Chemistry of Materials 18, 3889 (2006).
- Machala et al. (2011) L. Machala, J. Tuček, and R. Zbořil, Chemistry of Materials 23, 3255 (2011).
- Tokoro et al. (2018) H. Tokoro, W. Tarora, A. Namai, M. Yoshikiyo, and S. Ohkoshi, Chemistry of Materials 30, 2888 (2018).
- Tuček et al. (2010) J. Tuček, R. Zbořil, A. Namai, and S. Ohkoshi, Chemistry of Materials 22, 6483 (2010).
- Kurmoo et al. (2005) M. Kurmoo, J.-L. Rehspringer, A. Hutlova, C. D’Orléans, S. Vilminot, C. Estournès, and D. Niznansky, Chemistry of Materials 17, 1106 (2005).
- (16) If we assume a 8 nm sided cube is the typical crystallite (in keeping with the observed TEM of these and others -Fe2O3 nanoparicles) from the unit cell, we expect 70% of the Fe ions to be on or near the surface, while for the typical 25 nm sized crystallies 20% of the Fe3+ ions are on or near the surface.
- Hench and West (1990) L. L. Hench and J. K. West, Chemistry Reviews 90, 33 (1990).
- Rodríguez-Carvajal (1993) J. Rodríguez-Carvajal, Physica B 192, 55 (1993).
- (19) The only observable different in XRD patterns was from the backgrounds from the different sample holders and stages.
- Sakurai et al. (2005b) S. Sakurai, K. Hashimoto, and S. Ohkoshi, Journal of the Physical Society of Japan 74, 1946 (2005b).
- Schneider et al. (2012) C. A. Schneider, W. S. Rasband, and K. W. Eliceiri, Nature Materials 9, 671 (2012).
- Tadic et al. (2017) M. Tadic, I. Milosevic, S. Kralj, M. Mitric, D. Makovec, M.-L. Saboungi, and L. Motte, Nanoscale 9, 10579 (2017).
- Senn et al. (2012) M. S. Senn, J. P. Wright, and J. P. Attfield, Nature 481, 173 (2012).
- Ahamed et al. (2018) I. Ahamed, R. Pathak, R. Skomski, and A. Kashyap, AIP Advances 8, 055815 (2018).
- Zhao et al. (2006) B. C. Zhao, Y. Q. Ma, W. H. Song, and Y. P. Sun, Physics Letters A 354, 472 (2006).
- P et al. (2014) K. P, P. S., K. Varapasadarao, C. Santosh, S. Mallick, A. N. Grace, and C. Bahadur, Applied Physics Letters 105, 052412 (2014).
- Goya et al. (2003) G. F. Goya, T. S. Berquó, F. C. Fonseca, and M. P. Morales, Journal of Applied Physics 94, 3520 (2003).
- Barbeta et al. (2010) V. B. Barbeta, P. K. Kiyohara, F. B. Effenberger, and L. M. Rossi, Journal of Applied Physics 107, 073913 (2010).
- Stoner and Wohlfarth (1948) E. C. Stoner and E. P. Wohlfarth, Philosophical Transactions of the Royal Society Series A 240, 599 (1948).
- Skoropata et al. (2014) E. Skoropata, R. D. Desautels, C.-C. Chi, H. Ouyang, J. W. Freeland, and J. van Lierop, Phys. Rev. B 89, 024410 (2014).
- Skoropata and van Lierop (2017) E. Skoropata and J. van Lierop, “Characterization of magnetism in core–shell nanoparticles,” in Magnetic Characterization Techniques for Nanomaterials, edited by C. S. Kumar (Springer Berlin Heidelberg, Berlin, Heidelberg, 2017) pp. 375–412.
- Dong et al. (2011) S. Dong, Y. Yao, Y. Hou, Y. Liu, Y. Tang, and X. Li, Nanotechnology 22, 385701 (2011).
- Maity et al. (2013) T. Maity, S. Goswami, D. Bhattacharya, and S. Roy, Physical Revew Letters 110, 107201 (2013).
- Gütlich and Trautwein (2010) P. Gütlich and E. Trautwein, Mössbauer spectroscopy and transition metal chemistry: Fundamentals and applications (Springer Science & Business Media, 2010).
- (35) was calculated from spectra with velocity ranges 15 mm/s to avoid potential baseline artifcats.
- (36) The 300 K spectrum was fitted using a multilevel relaxation modelDesautels et al. (2008); van Lierop and Ryan (2001) using the static hyperfine parameters. Each site underwent slow spin fluctuations (D MHz, T MHz, R MHz; <10 the Mössbauer effect measuring time) consistent with collective magnetic excitations, and no superparamagnetic spin flucuations were required to describe the spectrum.
- Greenwood and Gibb (1971) N. N. Greenwood and T. C. Gibb, Mössbauer Spectroscopy (Chapman and Hall Ltd., London, 1971).
- Brice-Profeta et al. (2005) S. Brice-Profeta, M.-A. Arrio, E. Tronc, N. Menguy, I. Letard, C. Cartier dit Moulin, M. Noguès, C. Chanéac, J.-P. Jolivet, and P. Sainctavit, J. Magn. Magn. Mater. 288, 354 (2005).
- Fernández-Rodríguez et al. (2015) J. Fernández-Rodríguez, B. Toby, and M. van Veenendaal, Journal of Electron Spectroscopy and Related Phenomon 202, 81 (2015).
- Stavitski and De Groot (2010) E. Stavitski and F. M. F. De Groot, Micron 41, 687 (2010).
- Thole et al. (1992) B. T. Thole, P. Carra, F. Sette, and G. van der Laan, Physical Review Letters 68, 1943 (1992).
- Carra et al. (1993) P. Carra, B. T. Thole, M. Altarelli, and X. Wang, Physical Review Letters 70, 694 (1993).
- Chen et al. (1995) C. T. Chen, Y. U. Idzerda, H.-J. Lin, N. V. Smith, G. Meigs, E. Chaban, G. H. Ho, E. Pellegrin, and F. Sette, Physical Review Letters 75, 152 (1995).
- Skoropata (2017) E. Skoropata, The origin of the magnetism of maghemite (-Fe2O3)-based core/shell nanoparticles, Ph.D. thesis, University of Manitoba (2017).
- Desautels et al. (2008) R. D. Desautels, E. Skoropata, and J. van Lierop, J. Appl. Phys. 103, 07D512 (2008).
- van Lierop and Ryan (2001) J. van Lierop and D. H. Ryan, Phys. Rev. B 63, 064406 (2001).