PDANet: Polarity-consistent Deep Attention Network
for Fine-grained Visual Emotion Regression
Abstract.
Existing methods on visual emotion analysis mainly focus on coarse-grained emotion classification, i.e. assigning an image with a dominant discrete emotion category. However, these methods cannot well reflect the complexity and subtlety of emotions. In this paper, we study the fine-grained regression problem of visual emotions based on convolutional neural networks (CNNs). Specifically, we develop a Polarity-consistent Deep Attention Network (PDANet), a novel network architecture that integrates attention into a CNN with an emotion polarity constraint. First, we propose to incorporate both spatial and channel-wise attentions into a CNN for visual emotion regression, which jointly considers the local spatial connectivity patterns along each channel and the interdependency between different channels. Second, we design a novel regression loss, i.e. polarity-consistent regression (PCR) loss, based on the weakly supervised emotion polarity to guide the attention generation. By optimizing the PCR loss, PDANet can generate a polarity preserved attention map and thus improve the emotion regression performance. Extensive experiments are conducted on the IAPS, NAPS, and EMOTIC datasets, and the results demonstrate that the proposed PDANet outperforms the state-of-the-art approaches by a large margin for fine-grained visual emotion regression. Our source code is released at: https://github.com/ZizhouJia/PDANet.
1. Introduction
Visual content is often used in psychology to evoke emotions in human viewers (Detenber et al., 1998). Nowadays, with the wide popularity of mobile devices, humans have become used to recording their activities, sharing their experiences, and expressing their opinions using images and videos with text in social networks like Flickr and Weibo (Zhao et al., 2018c). Automatically discovering the implied emotions from the huge volume of multimedia content can help in understanding humans’ behaviors and preferences, which are crucial in many practical applications, such as smart advertising (Yang et al., 2013), multimedia retrieval (Zhao et al., 2014b; Yang et al., 2018a), and political voting forecasts (Tumasjan et al., 2010; Chung and Mustafaraj, 2011).
Visual emotion analysis (VEA) is a high-level abstraction task, which aims to recognize the emotions induced by visual content. Because of the presence of two main challenges, i.e. affective gap (Hanjalic, 2006; Zhao et al., 2014a) between low-level visual features and high-level emotion semantics and the perception subjectivity (Peng et al., 2015; Zhao et al., 2016) among different viewers, VEA is a non-trivial problem. To bridge the affective gap, the key is to extract discriminative features (Machajdik and Hanbury, 2010; Lu et al., 2012; Zhao et al., 2014a; Rao et al., 2019b; You et al., 2016b). To tackle the subjectivity issue, we can predict personalized emotion perceptions for each viewer (Zhao et al., 2018d), or learn the emotion distributions for each image (Peng et al., 2015; Yang et al., 2017; Zhao et al., 2017a, d; Zhao et al., 2018a). With the advent of deep learning, the research emphasis on VEA has shifted from traditional hand-crafted features designing (Machajdik and Hanbury, 2010; Lu et al., 2012; Zhao et al., 2014a) to end-to-end deep representation learning with convolutional neural networks (CNNs) (Peng et al., 2015; Rao et al., 2019b; You et al., 2016b; Yang et al., 2017; You et al., 2017; Zhu et al., 2017; Song et al., 2018; Yang et al., 2018b). These CNN-based methods either focus on dominant emotion classification (Rao et al., 2019b; You et al., 2016b; You et al., 2017; Zhu et al., 2017; Song et al., 2018; Yang et al., 2018b; Zhao et al., 2019b) or emotion distribution learning (Peng et al., 2015; Yang et al., 2017; Zhao et al., 2018e). Meanwhile, due to the similar mechanism to the human visual system and ability to model context information, visual attention has recently been incorporated into CNNs for visual emotion classification (You et al., 2017; Song et al., 2018; Yang et al., 2018b) and achieves state-of-art performances.
However, there are several issues with above-mentioned CNN methods on the affective gap challenge:
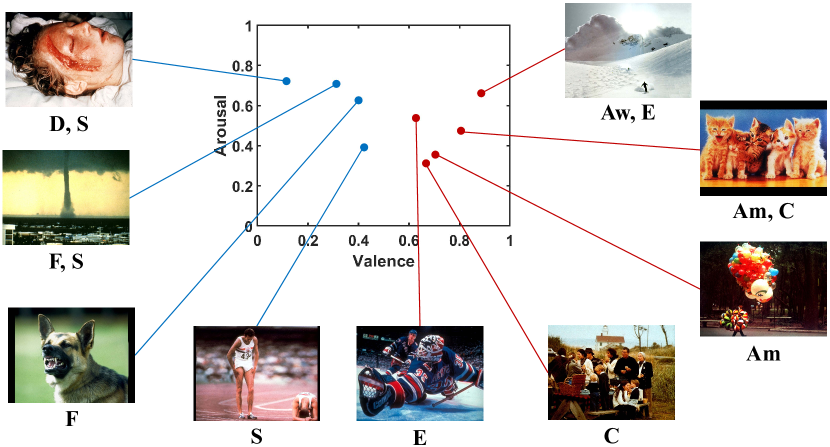
First, these methods mainly focus on coarse-grained visual emotion classification, i.e. assigning a dominant emotion category to an image, based on the emotion model of discrete emotion states (DES), such as the Mikels’ eight emotions (Mikels et al., 2005) and binary sentiment. As emotions are naturally complex, subjective, and subtle (Peng et al., 2015; Zhao et al., 2016; Rao et al., 2019b; Yang et al., 2018b), it is obviously insufficient to model emotion at such a coarse-grained level. As shown in Figure 1, the images belonging to the same emotion category may greatly differ in the continuous valence-arousal-dominance (VAD) space (Schlosberg, 1954). On the other hand, discrete emotions do not provide a one-to-one relationship between the visual content and emotions (Mikels et al., 2005), which highlights the utility of a dimensional approach.
Second, the attention based CNN methods on VEA only consider spatial attention. Although spatial attention modulates the local spatial connectivity patterns along each channel via spatially attentive weights (You et al., 2017; Song et al., 2018; Yang et al., 2018b), it neglects the interdependency between different channels. Nevertheless, channel-wise attention is very important, which can be viewed as a process of selecting semantic attributes and is essentially consistent with the CNN features (Chen et al., 2017).
In this paper, we study the fine-grained visual emotion regression problem to enrich the descriptive power of emotions based on VAD dimensions. The dimensional emotion values not only control for the inter-correlated nature of human emotions evoked by images (Lu et al., 2012), but also is more consistent with how the brain is organized to process emotions at their most basic level (Lang et al., 1998; Lindquist et al., 2012). Specifically, we design a novel network architecture, i.e. Polarity-consistent Deep Attention Network (PDANet), that integrates attention into a CNN with an emotion polarity constraint for fine-grained visual emotion regression. First, both spatial and channel-wise attentions are incorporated into a CNN with mean squared error (MSE) loss. In this way, both the local spatial context along each channel and the interdependency between different channels are taken into account. Second, according to the assumption that VAD dimensions can be classified into different polarities (Russell and Carroll, 1999; Zhang et al., 2016; Subramanian et al., 2018; Mollahosseini et al., 2019; Zhao et al., 2019a), we propose a novel polarity-consistent regression (PCR) loss based on the weakly supervised emotion polarity. The penalty of the predictions that have opposite polarity to the ground truth is increased. In this way, the polarity can be viewed as a constraint to guide the attention generation. With the polarity preserved attention map, the proposed PDANet method can obtain better visual emotion regression performances.
In summary, the contributions of this paper are threefold:
-
(1)
We propose to study the fine-grained visual emotion regression problem based on deep learning techniques. To the best of our knowledge, this is the first deep method for regressing visual emotions.
-
(2)
We develop a novel network architecture, i.e. PDANet, that integrates both spatial and channel-wise attentions into a CNN with an emotion polarity constraint for visual emotion regression. Based on the weakly supervised emotion polarity, we propose a novel PCR loss, which enables PDANet to generate polarity preserved attention map and thus improve the emotion regression results.
-
(3)
We conduct extensive experiments on the IAPS (Lang et al., 1997), NAPS (Marchewka et al., 2014), and EMOTIC (Kosti et al., 2017) datasets, and the results demonstrate the superiority of the proposed PDANet method, as compared to the state-of-the-art approaches. The summarized datasets, baselines, evaluation metrics, and the reported results provide a systematic benchmark for future research on the visual emotion regression task.
2. Related Work
2.1. Visual Emotion Analysis
Most existing methods on visual emotion analysis (VEA) either design hand-crafted features or employ deep learning frameworks to bridge the “affective gap” (Hanjalic, 2006). In the early years, numerous hand-crafted features were designed at different levels for VEA, such as low-level ones like Wiccest and Gabor (Yanulevskaya et al., 2008), color (Machajdik and Hanbury, 2010; Sartori et al., 2015; Alameda-Pineda et al., 2016), texture (Machajdik and Hanbury, 2010), and shape (Lu et al., 2012); mid-level ones such as composition (Machajdik and Hanbury, 2010), sentributes (Yuan et al., 2013), principles-of-art (Zhao et al., 2014a), and bag-of-visual-words (Rao et al., 2016); and high-level ones such as adjective noun pairs (ANP) (Borth et al., 2013). Some methods also fused different levels of features for affective image retrieval (Zhao et al., 2014b), personalized emotion prediction (Zhao et al., 2016, 2018d), and emotion distribution learning (Zhao et al., 2017a, b, d; Zhao et al., 2018a).
Recently, with the success of convolutional neural networks (CNNs) on many computer vision tasks, researchers have also applied CNNs to the VEA tasks. Extended from SentiBank (Borth et al., 2013), DeepSentiBank (Chen et al., 2014) constructs a visual sentiment concept to classify ANP for detecting emotions depicted in images. Peng et al. (2015) fine-tuned a pre-trained CNN to predict emotion distributions. A progressive CNN architecture is designed to make use of noisily labeled data for binary sentiment classification (You et al., 2016b). Rao et al. (2019b) proposed to learn multi-level deep representations for image emotion classification (MldrNet), which includes 3 different CNN models: Alexnet (Krizhevsky et al., 2012), aesthetics CNN, and texture CNN. On the basis of MldrNet, different levels of features are integrated with a bidirectional Gated Recurrent Unit model to exploit their dependencies (Zhu et al., 2017). Yang et al. (2017) designed a multi-task deep framework by jointly optimizing emotion classification and distribution learning tasks. To explore the correlation of emotional labels with the same polarity, Yang et al. (2018a) employed deep metric learning to optimize both the retrieval and classification tasks by jointly minimizing the traditional cross-entropy loss and a novel sentiment constraint.
Different from the above-mentioned methods, which try to improve the global image representations, several methods (Li et al., 2012; Yang et al., 2018c; You et al., 2017; Song et al., 2018; Yang et al., 2018b; Rao et al., 2019a) consider local information for VEA. While the regions in (Li et al., 2012; Yang et al., 2018c, b) are produced by some segmentation or detection methods, such as EdgeBoxes (Zitnick and Dollár, 2014) and faster R-CNN (Ren et al., 2015), the local information is reflected by spatial attention in (You et al., 2017; Song et al., 2018; Yang et al., 2018b; Yao et al., 2019). There are also some methods on domain adaptation (Zhao et al., 2018e; Zhao et al., 2019b) and zero-shot learning (Zhan et al., 2019) to deal with the label absence problem. Please refer to (Joshi et al., 2011; Zhao et al., 2018b) for a more comprehensive survey of VEA.
All of these CNN-based methods focus on coarse-grained visual emotion classification, i.e. assigning a dominant discrete emotion category to an image. Differently, in this paper, we propose to study fine-grained visual emotion regression based on CNNs by incorporating visual attention and a polarity constraint. Although it is not easy for users to understand, the regression result is more powerful and can be used for more accurate emotion analysis during background processing.
2.2. Visual Attention
Visual attention refers to a set of cognitive operations that allow us to efficiently deal with the limited processing capacity of the visual system by selecting relevant information and by filtering out irrelevant information (McMains and Kastner, 2009). That is, we divert our attention to the regions of interest instead of the whole image. In this way, we can consider visual attention as a dynamic feature extraction mechanism that combines contextual fixations over time (Mnih et al., 2014; Stollenga et al., 2014; Chen et al., 2017).
As a widely studied topic in multimedia and computer vision, visual attention has recently been seamlessly incorporated into deep learning architectures and achieved outstanding performances in many vision-related tasks, such as image classification (Larochelle and Hinton, 2010; Mnih et al., 2014; Zhao et al., 2017c; Hu et al., 2018; Woo et al., 2018), image generation (Tang et al., 2014), image captioning (Xu et al., 2015; Jia et al., 2015; You et al., 2016a; Chen et al., 2017; Lu et al., 2017; Chen et al., 2018a; Anderson et al., 2018), video captioning (Gao et al., 2017; Song et al., 2017), video representation learning (Zhao et al., 2017e), and visual question answering (Xu and Saenko, 2016; Yang et al., 2016; Lu et al., 2016; Anderson et al., 2018), in addition to non-vision related tasks, such as text sentiment analysis (Chen et al., 2018b). These attention methods can be roughly divided into three categories: spatial attention (Xu et al., 2015; Xu and Saenko, 2016; Yang et al., 2016), semantic attention (Jia et al., 2015; You et al., 2016a; Chen et al., 2018a), and channel-wise attention (Chen et al., 2017; Hu et al., 2018).
There are also several methods that employ attention for VEA (You et al., 2017; Song et al., 2018; Yang et al., 2018b; Yao et al., 2019). You et al. (2017) directly estimated the spatial attention. Song et al. (2018) employed a saliency map (Li and Yu, 2016) as a prior knowledge and regularizer to holistically refine the attention distribution. Yang et al. (2018b) proposed a weakly supervised coupled CNN with two branches: one is used to detect an emotion-specific soft map and the other combines the holistic and localized information for emotion classification. Yao et al. (2019) jointly modeled the polarity- and emotion-specific attended features. All these methods only consider spatial attention for visual emotion classification or retrieval. Differently from these, we propose a novel network architecture that integrates both spatial and channel-wise attention into a CNN for visual emotion regression. Further, we design a novel polarity-consistent regression loss to guide the attention generation.
3. PDANet: Polarity-consistent Deep Attention Network
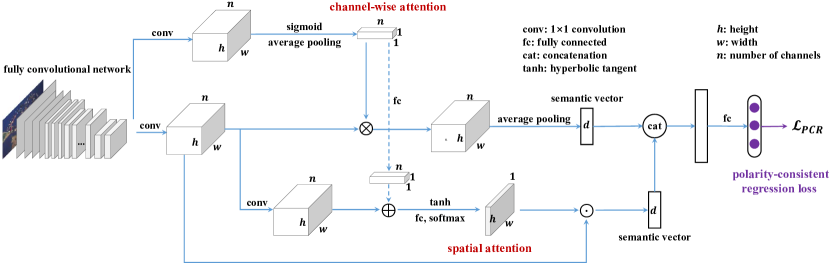
An overview of the proposed polarity-consistent deep attention network (PDANet) is illustrated in Figure 2. The goal is to learn a discriminative model from images with attentive regions for fine-grained visual emotion regression where only image-level VAD labels are provided. Specifically, the proposed PDANet consists of three main components: a pre-trained FCN which is exploited to learn image representations, a two-branch multi-layer neural network to estimate both the spatial attention and channel-wise attention, and a fully connected layer to optimize the emotion regression task. The training of PDANet is performed by minimizing the polarity-consistent regression (PCR) loss. The whole framework is trained in an end-to-end manner.
3.1. Image Representation Extraction
Recent research has convincingly demonstrated that CNNs are highly capable of learning visual representations. Generally, the extracted features from different CNN layers usually have different properties (Song et al., 2018). For example, the features at the bottom layers tend to reflect the low-level information (e.g. texture), while the features at the top layers usually correspond to high-level semantics. Following (Song et al., 2018; Yang et al., 2018b), we use the output of fully convolutional layers to represent local regions of an image. Without loss of generality and following (Yang et al., 2018b), we choose a widely used CNN architecture, i.e. ResNet-101 (He et al., 2016), as our basic CNN model to extract image representations. Suppose we are given training samples , where is an affective image, is the corresponding continuous VAD value. For image , suppose the feature maps of the conv5 in ResNet-101 are (we omit for simplicity in the following), where and are the spatial size (height and width) of the feature map, and is the number of channels. We reshape F as
| (1) |
by flattening the height and width of the original F, where and . Here we can consider as the visual feature of the -th location.
3.2. Spatial Attention Estimation
Image regions not only play an important role in image captioning (Xu et al., 2015; Jia et al., 2015; You et al., 2016a; Chen et al., 2017; Lu et al., 2017; Chen et al., 2018a; Anderson et al., 2018) and visual question answering (Xu and Saenko, 2016; Yang et al., 2016; Lu et al., 2016; Anderson et al., 2018), but are also crucial in expressing emotions (You et al., 2017; Song et al., 2018; Yang et al., 2018b). Take the picnic image with discrete label ‘C’ in Figure 1 for example. There are several objects in the image, including adult, child, table, chair, basket, cabin, etc. Obviously, these objects contribute differently to predicting the emotions of this image. Therefore, directly applying a global visual feature to recognize emotion may lead to sub-optimal results due to the irrelevant regions (e.g. table, chair, basket, cabin). In this paper, we employ the spatial attention mechanism to emphasize the emotional semantic-related regions. Following (Chen et al., 2017; Song et al., 2018), we employ a multi-layer neural network, i.e. two convolutional layers and then a hyperbolic tangent function to generate the spatial attention distributions over all the image regions. That is
| (2) | ||||
where and are two parameter matrices, is the size of hidden layers, is a -dimensional bias vector, and denotes the addition of a matrix and a vector, which is performed by adding the vector to each column of the matrix.
Then a dimensional semantic vector based on spatial attention is obtained as follows
| (3) |
where sp is short for sum pooling, and is the multiplication of a matrix and a vector, which is performed by multiplying each value in the vector to each column of the matrix.
3.3. Channel-wise Attention Estimation
Based on the assumption that each channel of a feature map in a CNN is a response activation of the corresponding convolutional layer, channel-wise attention can be viewed as a process of selecting semantic attributes (Chen et al., 2017). To generate the channel-wise attention, we first reshape F to G
| (4) |
where represents the -th channel of the feature map F. The channel-wise attention is defined as
| (5) |
where is a transformation matrix, is a bias term, and ap is short for average pooling. We can obtain another dimensional semantic vector based on channel-wise attention
| (6) |
where is the linear combination between a vector and a matrix, which is performed by multiplying each row of the matrix by the corresponding element of the vector.
Further, we also update the spatial attention based on the channel-wise attention
| (7) | ||||
where fc is short for fully connected.
3.4. Polarity-consistent Regression Loss
We concatenate and to obtain an aggregated semantic vector , which can be viewed as the final visual representation and fed into a fully connected layer to predict the emotion labels. The mean squared error (MSE) loss of emotion regression is defined as
| (8) |
where is the dimension number of the adopted emotion model ( in this paper), and indicates the emotion label of the -th dimension, e.g. .
Directly optimizing the emotion regression loss in Eq. (8) may result in attended regions of the objects that have totally different emotion polarity from the visual emotion. Take the balloon image with label ‘Am’ in Figure 1 for example. The object chair surrounded by dry grass and fallen leaves tends to convey negative emotion. In this paper, we proposed a polarity-consistent regression (PCR) loss to guide the attention generation based on the assumption that VAD dimensions can be classified into different polarities (Russell and Carroll, 1999; Zhang et al., 2016; Subramanian et al., 2018; Mollahosseini et al., 2019; Zhao et al., 2019a). That is, the penalty of the predictions that have opposite polarity to the ground truth is increased. The PCR loss is defined as
| (9) |
where is a penalty coefficient that controls the penalty extent. Similar to the indicator function, g(.,.) represents whether to add the penalty or not and is defined as
| (10) |
where is a function to compute the polarity of given dimensional emotions. In our experiment, is selected on the validation set and is set as a dichotomization function as in (Subramanian et al., 2018). Since the derivatives with respect to all parameters can be computed, we can train the proposed PDANet effectively in an end-to-end manner using stochastic gradient descent (SGD) to minimize the loss function in Eq. (9).
4. Experiments
In this section, we first introduce the detailed experimental settings, including the datasets, baselines, evaluation metrics, and implementation details. We then evaluate the performance of the proposed method as compared to the state-of-the-art approaches. Finally, we conduct an ablation study to analyze the impact of different components and visualize the attention maps to further demonstrate the effectiveness of the proposed method.
| Method | IAPS | NAPS | EMOTIC | |||||||||
|---|---|---|---|---|---|---|---|---|---|---|---|---|
| V | A | D | M | V | A | D | M | V | A | D | M | |
| PAEF (Zhao et al., 2014a) | 5.431 | 2.050 | 1.893 | 3.125 | 4.353 | 1.723 | 3.482 | 3.186 | 2.015 | 4.211 | 3.230 | 3.152 |
| SentiBank (Borth et al., 2013) | 5.383 | 2.018 | 1.904 | 3.102 | 4.439 | 1.788 | 3.525 | 3.251 | 1.920 | 3.613 | 3.084 | 2.872 |
| AlexNet (Krizhevsky et al., 2012) | 5.174 | 1.998 | 1.903 | 3.025 | 4.378 | 1.789 | 3.499 | 3.222 | 1.882 | 3.444 | 3.046 | 2.791 |
| VGG-16 (Simonyan and Zisserman, 2015) | 5.089 | 2.031 | 1.835 | 2.985 | 4.460 | 1.765 | 3.500 | 3.242 | 2.021 | 4.403 | 3.327 | 3.250 |
| ResNet-101 (He et al., 2016) | 3.456 | 1.266 | 1.222 | 1.981 | 2.577 | 1.061 | 2.002 | 1.880 | 1.866 | 3.269 | 3.061 | 2.732 |
| FT AlexNet (You et al., 2016b) | 4.479 | 1.968 | 2.993 | 3.147 | 3.701 | 1.556 | 2.993 | 2.750 | 2.202 | 3.699 | 3.121 | 3.007 |
| FT VGG-16 (You et al., 2016b) | 3.560 | 1.672 | 1.450 | 2.227 | 3.096 | 1.130 | 2.335 | 2.187 | 1.895 | 3.414 | 3.069 | 2.793 |
| FT ResNet-101 (You et al., 2016b) | 3.214 | 1.597 | 1.844 | 2.218 | 2.252 | 0.955 | 1.844 | 1.684 | 1.844 | 3.304 | 3.093 | 2.747 |
| MldrNet (Rao et al., 2019b) | 5.219 | 2.073 | 2.005 | 3.099 | 4.012 | 2.413 | 3.170 | 3.198 | 2.059 | 4.266 | 3.242 | 3.189 |
| SentiNet-A (Song et al., 2018) | 3.952 | 1.975 | 1.707 | 2.545 | 2.943 | 1.440 | 2.430 | 2.271 | 1.902 | 3.445 | 3.078 | 2.808 |
| WSCNet (Yang et al., 2018b) | 3.255 | 1.571 | 1.524 | 2.117 | 2.951 | 1.181 | 2.266 | 2.133 | 1.849 | 3.367 | 3.153 | 2.790 |
| PDANet (ours) | 3.179 | 1.279 | 1.221 | 1.893 | 2.248 | 0.971 | 1.793 | 1.671 | 1.776 | 3.261 | 3.076 | 2.704 |
| Method | IAPS | NAPS | EMOTIC | |||||||||
|---|---|---|---|---|---|---|---|---|---|---|---|---|
| V | A | D | M | V | A | D | M | V | A | D | M | |
| PAEF (Zhao et al., 2014a) | -0.491 | -0.454 | -0.384 | -0.443 | -0.261 | 0.143 | -0.222 | -0.113 | -0.006 | 0.337 | 0.037 | 0.123 |
| SentiBank (Borth et al., 2013) | -0.399 | -0.294 | -0.443 | -0.378 | -0.464 | -0.233 | -0.351 | -0.349 | 0.466 | 1.709 | 0.488 | 0.888 |
| AlexNet (Krizhevsky et al., 2012) | 0.005 | -0.191 | -0.436 | -0.207 | -0.321 | -0.234 | -0.273 | -0.276 | 0.654 | 2.097 | 0.604 | 1.118 |
| VGG-16 (Simonyan and Zisserman, 2015) | 0.170 | -0.355 | -0.061 | -0.082 | -0.513 | -0.099 | -0.275 | -0.296 | -0.038 | -0.104 | -0.261 | -0.135 |
| ResNet-101 (He et al., 2016) | 3.324 | 3.546 | 3.297 | 3.389 | 3.926 | 3.931 | 4.121 | 3.993 | 0.733 | 2.499 | 0.558 | 1.263 |
| FT AlexNet (You et al., 2016b) | 0.250 | 0.191 | -0.824 | -0.128 | 0.761 | -0.216 | -0.421 | 0.041 | 0.057 | 1.510 | 0.373 | 0.647 |
| FT VGG-16 (You et al., 2016b) | 2.250 | 1.667 | 1.571 | 1.829 | 2.270 | 2.582 | 1.871 | 2.241 | 0.587 | 2.165 | 0.533 | 1.095 |
| FT ResNet-101 (You et al., 2016b) | 3.003 | 2.038 | 1.429 | 2.157 | 3.058 | 3.728 | 2.144 | 2.977 | 0.840 | 2.416 | 0.459 | 1.238 |
| MldrNet (Rao et al., 2019b) | -0.081 | -0.569 | -0.993 | -0.548 | 0.543 | -3.804 | 0.693 | -0.856 | -0.224 | 0.211 | -0.002 | -0.005 |
| SentiNet-A (Song et al., 2018) | 2.365 | -0.071 | 0.638 | 0.978 | 3.062 | 1.759 | 2.866 | 2.562 | 0.553 | 0.209 | 0.505 | 0.422 |
| WSCNet (Yang et al., 2018b) | 2.915 | 2.170 | 1.040 | 2.042 | 2.632 | 2.247 | 2.110 | 2.330 | 0.816 | 2.272 | 0.272 | 1.120 |
| PDANet (ours) | 3.859 | 3.479 | 3.305 | 3.548 | 4.701 | 4.443 | 4.737 | 4.627 | 1.180 | 2.515 | 0.511 | 1.402 |
4.1. Datasets
To evaluate the performances of the proposed method, we employ 3 publicly available datasets that contain continuous emotion labels: IAPS (Lang et al., 1997), NAPS (Marchewka et al., 2014), and EMOTIC (Kosti et al., 2017).
The International Affective Picture System (IAPS) (Lang et al., 1997) is an emotion evoking image set in psychology. It consists of 1,182 documentary-style natural color images depicting complex scenes, such as portraits, babies, animals, landscapes, etc. Each image is associated with an empirically derived mean and standard deviation (STD) of VAD ratings in a 9-point rating scale by about 100 college students.
The Nencki Affective Picture System (NAPS) (Marchewka et al., 2014) consists of 1,356 realistic, high-quality photographs with five categories, i.e. people, faces, animals, objects, and landscapes. These images were rated by 204 mostly European participants in a 9-point bipolar semantic sliding scale on the VA and approach-avoidance (we use dominance for simplicity) dimensions. On average, 55 ratings were collected for each image.
The Emotions in Context Database (EMOTIC) (Kosti et al., 2017) is a dataset of images containing people in context in non-controlled environments. It is composed of images from MSCOCO (Lin et al., 2014), Ade20k (Zhou et al., 2019), and images downloaded from Google. The images were annotated by Amazon Mechanical Turk (AMT) workers with 26 emotion categories and the continuous 10-scale VAD dimensions. In total, there are 18,316 images in this dataset with 23,788 annotated people.
4.2. Baselines
To the best of our knowledge, PDANet is the first work on deep learning based visual emotion regression. To demonstrate its effectiveness, we compare it with several baselines, including the methods using hand-crafted features, CNN-based methods, and attention based methods. For the traditional methods, we extract mid-level 165 dimensional principles-of-art based emotion features (PAEF) (Zhao et al., 2014a), and high-level 1,200 dimensional adjective noun pairs (ANP) with SentiBank (Borth et al., 2013). We use support vector regression (SVR) with the radial basis function (RBF) kernel in the LIBSVM library (Chang and Lin, 2011) as the regressor. For the CNN-based methods, following (You et al., 2016b), we first fine-tune three classical deep learning methods pre-trained on ImageNet: AlexNet (Krizhevsky et al., 2012), VGG-16 (Simonyan and Zisserman, 2015), and ResNet-101 (He et al., 2016). Second, we show the results of fully connected features extracted from the ImageNet CNN, which are classified by SVR. We also compare PDANet with one specifically designed deep methods, i.e. multi-level deep representations (MldrNet) (Rao et al., 2019b). For the attention-based methods, we choose two recently published methods: SentiNet-A (Song et al., 2018) and WSCNet (Yang et al., 2018b), which respectively estimate the spatial attention with the saliency map as a prior regularizer and generate a sentiment map as a detection task in a weakly supervised manner. Please note that for both CNN and attention based methods, we replace the cross-entropy loss with MSE loss for the visual emotion regression task.
4.3. Evaluation Metrics
We employ mean squared error () and R squared () to evaluate the visual emotion regression results. is a quadratic scoring rule that measures the average magnitude of the error. It is defined as the average of squared differences between the prediction and ground truth
where is the number of testing samples, and and are the ground truth and prediction of the VAD emotions, respectively. and the smaller the better.
, also known as the coefficient of determination, shows how well the predicted results explain the variability in the ground truth values. It is defined as
where is the mean of the ground truth emotions. The numerator is MSE and the denominator is the variance of emotions. , with a larger value representing a better result. Please note that other regression measures, such as mean absolute error and root mean squared error, can also be used as evaluation metrics. Due to the page limit, we do not report these results.
4.4. Implementation Details
Our model is based on the state-of-the-art CNN architecture ResNet-101 (He et al., 2016). The network is initialized with the weights from the pre-trained ResNet-101 model on ImageNet (Deng et al., 2009). In addition, we resize the image to pixels, apply random horizontal flips, and crop a random patch as a form of data augmentation to reduce overfitting. We replace the last layers (global average pooling and fully connected layer) with the proposed attention networks. We use a weight decay of 0.0005 with a momentum of 0.9, a batch size of 32, and fine-tune all layers with SGD. The learning rates of the convolutional layers and the last fully-connected layer are initialized as 0.001 and 0.01, respectively. For the IAPS and NAPS datasets, the total number of epochs is 300 with learning rate dropped by a factor of 10 for the last 50 epochs. For the EMOTIC dataset, the total number of epochs is 50 and the learning rate is dropped by a factor of 10 for the last 10 epochs. Since the EMOTIC dataset is initially constructed to recognize emotions in context for the people contained in an image, there might be more than one VAD label for each image (Kosti et al., 2017). We employ the average VAD values of all the people’s emotions as the ground truth for an image in our emotion regression task. For all the three datasets, we randomly split each into 70% training, 10% validation, and 20% testing. The VAD labels are normalized to [0, 1] for better comparison. At test time, we adopt the standard 10-crop testing and our prediction takes the regressors’ output for final evaluation. Our model is implemented using PyTorch. All of our experiments are performed on 2 NVIDIA RTX 2080Ti GPUs with 11 GB memory.
4.5. Comparison with the State-of-the-art
| Method | IAPS | NAPS | EMOTIC | |||||||||
|---|---|---|---|---|---|---|---|---|---|---|---|---|
| V | A | D | M | V | A | D | M | V | A | D | M | |
| S | 4.947 | 2.012 | 1.785 | 2.915 | 3.587 | 1.641 | 2.836 | 2.688 | 1.998 | 3.730 | 3.112 | 2.947 |
| CW | 3.362 | 1.267 | 1.316 | 1.982 | 2.340 | 1.011 | 1.909 | 1.753 | 1.819 | 3.271 | 3.088 | 2.726 |
| S+CW | 3.320 | 1.319 | 1.259 | 1.966 | 2.254 | 0.985 | 1.800 | 1.680 | 1.819 | 3.269 | 3.072 | 2.720 |
| S+CW+PCR | 3.179 | 1.279 | 1.221 | 1.893 | 2.248 | 0.971 | 1.793 | 1.671 | 1.776 | 3.261 | 3.076 | 2.704 |
| Method | IAPS | NAPS | EMOTIC | |||||||||
|---|---|---|---|---|---|---|---|---|---|---|---|---|
| V | A | D | M | V | A | D | M | V | A | D | M | |
| S | 0.444 | -0.263 | 0.211 | 0.131 | 1.545 | 0.613 | 1.674 | 1.277 | 0.017 | 1.438 | 0.304 | 0.586 |
| CW | 3.506 | 3.539 | 2.782 | 3.276 | 4.483 | 4.217 | 4.397 | 4.366 | 0.968 | 2.493 | 0.473 | 1.311 |
| S+CW | 3.587 | 3.327 | 3.097 | 3.337 | 4.681 | 4.347 | 4.714 | 4.581 | 0.966 | 2.497 | 0.521 | 1.328 |
| S+CW+PCR | 3.859 | 3.479 | 3.305 | 3.548 | 4.701 | 4.443 | 4.737 | 4.627 | 1.180 | 2.515 | 0.511 | 1.402 |
The performance comparisons between the proposed PDANet model and the state-of-the-art approaches as measured by and are shown in Table 1 and Table 2, respectively. From these results, we can observe that:
(1) The traditional methods, i.e. those which extract visual features (either hand-crafted or CNN-based) and feed them to typical regressors, do not perform well. Due to the presence of affective gap, the directly extracted features are likely to be inconsistent with the highly abstract emotions. One interesting observation is that the hand-crafted features perform comparably or even better than the pre-trained CNN features (e.g. AlexNet, VGG-16). This shows the difference between emotion analysis and other computer vision problems. Images with similar appearances may convey totally different emotions, while the images containing quite different content may evoke the same emotions. The pre-trained CNN that is designed for objective vision tasks (e.g. object classification) cannot well capture this phenomenon, while the artistic principles and semantic ANP features are more robust. As the adopted three datasets are mainly natural scenes, containing obvious semantics, ANP achieves better performance than PAEF, which is more suitable to deal with abstract and artistic images.
(2) In most cases, the fine-tuned CNN on the affective datasets outperform the corresponding methods in traditional learning paradigm, i.e. those with separate feature extraction and regressor learning. The fine-tuned CNN has the capability to analyze visual emotions, as after fine-tuning, the CNN can learn to adapt to the emotion datasets. These results show the generalizability of fine-tuned CNNs on visual emotion regression.
(3) Generally, the attention based methods performs comparably to the traditional methods and CNN-based methods, which demonstrates the effectiveness of attention in visual emotion regression. Even though only spatial attention is considered (e.g. WSCNet (Yang et al., 2018b)), the performance is still improved. This is reasonable, because it can distill the spatially informative regions in an image and thus mitigate the influence of background and irrelevant objects.
(4) The proposed PDANet model performs the best in almost all cases. We take the IAPS dataset and the mean result for example to quantitatively show the performance improvements. On the one hand, the relative performance improvements of PDANet over the traditional methods and CNN-based methods are 39.42%, 38.98%, 37.43%, 36.58%, 4.46%, and 39.84%, 15.01%, 14.67%, 38.92%, respectively. On the other hand, the proposed PDANet achieves 25.61% and 10.57% relative performance improvements as compared to SentiNet-A (Song et al., 2018) and WSCNet (Yang et al., 2018b), respectively.
(5) These results demonstrate that the proposed PDANet model can achieve superior performance relative to the state-of-the-art approaches. The performance improvements benefit from the advantages of PDANet. First, the joint consideration of spatial attention and channel-wise attention takes into account the attentive information in context more thoroughly. Not only the importance of local spatial context along each channel, but also weights of the interdependency between different channels, are evaluated. Second, the PCR loss can guide the process of attention generation. With the polarity constraint, the generated attention is more likely to emphasize the regions that have the same polarity as the whole image and ignore the ones that are confusing for emotion regression.
4.6. Ablation Study
The proposed PDANet model contains two major novel components: an attention generation strategy for incorporating both spatial and channel-wise context and a polarity-consistent regression (PCR) loss for guiding the attention generation. We conduct an ablation study to further verify their effectiveness. We begin with an experiment on spatial or channel-wise attention with traditional MSE regression loss. And then we test the performance of combining the spatial and channel-wise attentions. Finally, we add the PCR loss. The emotion regression results measured by and are shown in Table 3 and Table 4, respectively.
From the results, we have the following observations: (1) Simply considering the spatial or channel-wise attention performs the worst with channel-wise attention slightly better than spatial, which shows the significance of the interdependency between different channels. (2) The combination of spatial and channel-wise attentions performs better than each single attention. This demonstrates the necessity of considering both spatial and channel-wise aspects when modeling attention for visual emotion regression. (3) All the components, i.e. spatial attention, channel-wise attention, and the PCR loss, contribute to the visual emotion regression task. The proposed PDANet model that jointly combines the novel attention strategy and employs the PCR loss performs the best. These observations demonstrate the effectiveness of the proposed PDANet model.
4.7. Visualization
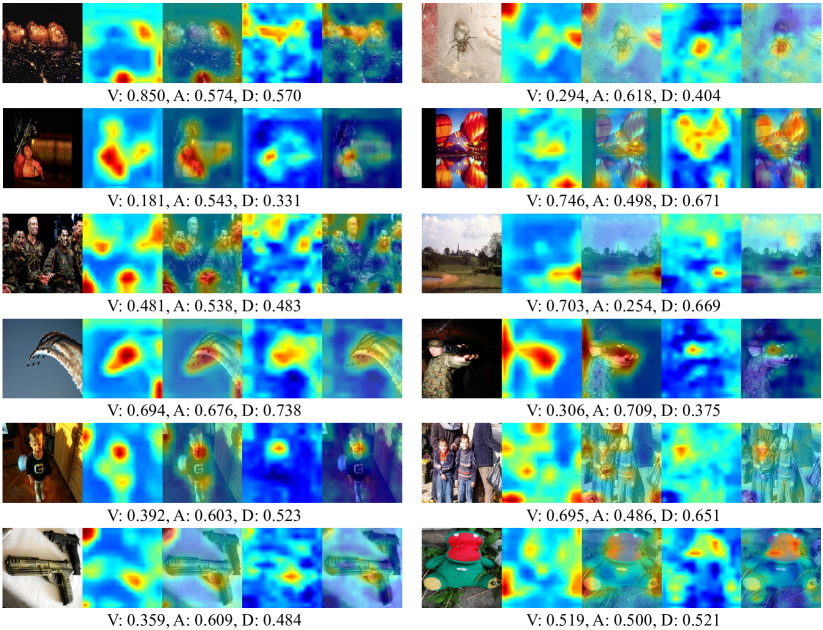
In order to show the interpretability of our model, we use the heat map generated by the Grad-Cam algorithm (Selvaraju et al., 2017) to visualize the attention learned by WSCNet (Yang et al., 2018b) and the proposed PDANet. As illustrated in Figure 3, we observe that the attention maps generated by the proposed PDANet, can focus comparably or even better on the attentive and discriminative regions than WSCNet (Yang et al., 2018b), which employs a specific attention map detection branch. Take the group on the top left corner for example, PDANet focuses on the fireworks, which obviously determines the positive emotion, while WSCNet mainly concentrates on the background.
5. Conclusion
In this paper, we make significant progress toward solving the fine-grained visual emotion regression problem with deep learning techniques. A novel network architecture, termed Polarity-consistent Deep Attention Network (PDANet), is developed by integrating visual attention into a CNN with a novel polarity-consistent regression (PCR) loss. Both spatial and channel-wise attentions are considered to model the local spatial context along each channel and the interdependency between different channels. The optimization of the PCR loss enables PDANet to generate polarity preserved attention maps, which can boost the emotion regression performance. The extensive experiments conducted on the IAPS, NAPS, and EMOTIC datasets demonstrate that PDANet significantly outperforms the state-of-the-art approaches for visual emotion regression. We also provided a systematic benchmark, including datasets, baselines, evaluation metrics, and results, for future research on visual emotion regression.
For further studies, we plan to extend the proposed PDANet model to other visual emotion analysis tasks, such as classification and retrieval. In addition, we will explore temporal attention in PDANet in order to attend features for emotion analysis of video content. Adapting a visual emotion regression model from a labeled source domain to another unlabeled target domain is also an interesting direction.
Acknowledgements.
This work was supported by Berkeley DeepDrive, the National Natural Science Foundation of China (Nos. 61701273, 61571269), Natural Science Foundation of Jiangsu Province (No. BK20181354), and the National Key R&D Program of China (No. 2017YFC011300).References
- (1)
- Alameda-Pineda et al. (2016) Xavier Alameda-Pineda, Elisa Ricci, Yan Yan, and Nicu Sebe. 2016. Recognizing emotions from abstract paintings using non-linear matrix completion. In IEEE Conference on Computer Vision and Pattern Recognition. 5240–5248.
- Anderson et al. (2018) Peter Anderson, Xiaodong He, Chris Buehler, Damien Teney, Mark Johnson, Stephen Gould, and Lei Zhang. 2018. Bottom-up and top-down attention for image captioning and visual question answering. In IEEE Conference on Computer Vision and Pattern Recognition. 6077–6086.
- Borth et al. (2013) Damian Borth, Rongrong Ji, Tao Chen, Thomas Breuel, and Shih-Fu Chang. 2013. Large-scale visual sentiment ontology and detectors using adjective noun pairs. In ACM International Conference on Multimedia. 223–232.
- Chang and Lin (2011) Chih-Chung Chang and Chih-Jen Lin. 2011. LIBSVM: a library for support vector machines. ACM Transactions on Intelligent Systems and Technology 2, 3 (2011), 27.
- Chen et al. (2018a) Hui Chen, Guiguang Ding, Zijia Lin, Sicheng Zhao, and Jungong Han. 2018a. Show, Observe and Tell: Attribute-driven Attention Model for Image Captioning.. In International Joint Conference on Artificial Intelligence. 606–612.
- Chen et al. (2017) Long Chen, Hanwang Zhang, Jun Xiao, Liqiang Nie, Jian Shao, Wei Liu, and Tat-Seng Chua. 2017. Sca-cnn: Spatial and channel-wise attention in convolutional networks for image captioning. In IEEE Conference on Computer Vision and Pattern Recognition. 5659–5667.
- Chen et al. (2014) Tao Chen, Damian Borth, Trevor Darrell, and Shih-Fu Chang. 2014. Deepsentibank: Visual sentiment concept classification with deep convolutional neural networks. arXiv:1410.8586 (2014).
- Chen et al. (2018b) Yuxiao Chen, Jianbo Yuan, Quanzeng You, and Jiebo Luo. 2018b. Twitter Sentiment Analysis via Bi-sense Emoji Embedding and Attention-based LSTM. In ACM International Conference on Multimedia. 117–125.
- Chung and Mustafaraj (2011) Jessica Elan Chung and Eni Mustafaraj. 2011. Can collective sentiment expressed on twitter predict political elections?. In AAAI Conference on Artificial Intelligence.
- Deng et al. (2009) Jia Deng, Wei Dong, Richard Socher, Li-Jia Li, Kai Li, and Li Fei-Fei. 2009. Imagenet: A large-scale hierarchical image database. In IEEE Conference on Computer Vision and Pattern Recognition. 248–255.
- Detenber et al. (1998) Benjamin H Detenber, Robert F Simons, and Gary G Bennett Jr. 1998. Roll ‘em!: The effects of picture motion on emotional responses. Journal of Business and Economic Management 42, 1 (1998), 113–127.
- Gao et al. (2017) Lianli Gao, Zhao Guo, Hanwang Zhang, Xing Xu, and Heng Tao Shen. 2017. Video captioning with attention-based LSTM and semantic consistency. IEEE Transactions on Multimedia 19, 9 (2017), 2045–2055.
- Hanjalic (2006) Alan Hanjalic. 2006. Extracting moods from pictures and sounds: Towards truly personalized TV. IEEE Signal Processing Magazine 23, 2 (2006), 90–100.
- He et al. (2016) Kaiming He, Xiangyu Zhang, Shaoqing Ren, and Jian Sun. 2016. Deep residual learning for image recognition. In IEEE Conference on Computer Vision and Pattern Recognition. 770–778.
- Hu et al. (2018) Jie Hu, Li Shen, and Gang Sun. 2018. Squeeze-and-excitation networks. In IEEE Conference on Computer Vision and Pattern Recognition. 7132–7141.
- Jia et al. (2015) Xu Jia, Efstratios Gavves, Basura Fernando, and Tinne Tuytelaars. 2015. Guiding the long-short term memory model for image caption generation. In IEEE International Conference on Computer Vision. 2407–2415.
- Joshi et al. (2011) Dhiraj Joshi, Ritendra Datta, Elena Fedorovskaya, Quang-Tuan Luong, James Z Wang, Jia Li, and Jiebo Luo. 2011. Aesthetics and emotions in images. IEEE Signal Processing Magazine 28, 5 (2011), 94–115.
- Kosti et al. (2017) Ronak Kosti, Jose M Alvarez, Adria Recasens, and Agata Lapedriza. 2017. Emotion recognition in context. In IEEE Conference on Computer Vision and Pattern Recognition. 1667–1675.
- Krizhevsky et al. (2012) Alex Krizhevsky, Ilya Sutskever, and Geoffrey E Hinton. 2012. Imagenet classification with deep convolutional neural networks. In Advances in Neural Information Processing Systems. 1097–1105.
- Lang et al. (1997) Peter J Lang, Margaret M Bradley, and Bruce N Cuthbert. 1997. International affective picture system (IAPS): Technical manual and affective ratings. NIMH Center for the Study of Emotion and Attention (1997), 39–58.
- Lang et al. (1998) Peter J Lang, Margaret M Bradley, and Bruce N Cuthbert. 1998. Emotion, motivation, and anxiety: Brain mechanisms and psychophysiology. Biological Psychiatry 44, 12 (1998), 1248–1263.
- Larochelle and Hinton (2010) Hugo Larochelle and Geoffrey E Hinton. 2010. Learning to combine foveal glimpses with a third-order Boltzmann machine. In Advances in Neural Information Processing Systems. 1243–1251.
- Li et al. (2012) Bing Li, Weihua Xiong, Weiming Hu, and Xinmiao Ding. 2012. Context-aware affective images classification based on bilayer sparse representation. In ACM International Conference on Multimedia. 721–724.
- Li and Yu (2016) Guanbin Li and Yizhou Yu. 2016. Deep contrast learning for salient object detection. In IEEE Conference on Computer Vision and Pattern Recognition. 478–487.
- Lin et al. (2014) Tsung-Yi Lin, Michael Maire, Serge Belongie, James Hays, Pietro Perona, Deva Ramanan, Piotr Dollár, and C Lawrence Zitnick. 2014. Microsoft coco: Common objects in context. In European Conference on Computer Vision. 740–755.
- Lindquist et al. (2012) Kristen A Lindquist, Tor D Wager, Hedy Kober, Eliza Bliss-Moreau, and Lisa Feldman Barrett. 2012. The brain basis of emotion: a meta-analytic review. Behavioral and Brain Sciences 35, 3 (2012), 121–143.
- Lu et al. (2017) Jiasen Lu, Caiming Xiong, Devi Parikh, and Richard Socher. 2017. Knowing when to look: Adaptive attention via a visual sentinel for image captioning. In IEEE Conference on Computer Vision and Pattern Recognition. 375–383.
- Lu et al. (2016) Jiasen Lu, Jianwei Yang, Dhruv Batra, and Devi Parikh. 2016. Hierarchical question-image co-attention for visual question answering. In Advances In Neural Information Processing Systems. 289–297.
- Lu et al. (2012) Xin Lu, Poonam Suryanarayan, Reginald B Adams Jr, Jia Li, Michelle G Newman, and James Z Wang. 2012. On shape and the computability of emotions. In ACM International Conference on Multimedia. 229–238.
- Machajdik and Hanbury (2010) Jana Machajdik and Allan Hanbury. 2010. Affective image classification using features inspired by psychology and art theory. In ACM International Conference on Multimedia. 83–92.
- Marchewka et al. (2014) Artur Marchewka, Łukasz Żurawski, Katarzyna Jednoróg, and Anna Grabowska. 2014. The Nencki Affective Picture System (NAPS): Introduction to a novel, standardized, wide-range, high-quality, realistic picture database. Behavior Research Methods 46, 2 (2014), 596–610.
- McMains and Kastner (2009) Stephanie A McMains and Sabine Kastner. 2009. Visual attention. Encyclopedia of Neuroscience (2009), 4296–4302.
- Mikels et al. (2005) Joseph A Mikels, Barbara L Fredrickson, Gregory R Larkin, Casey M Lindberg, Sam J Maglio, and Patricia A Reuter-Lorenz. 2005. Emotional category data on images from the International Affective Picture System. Behavior Research Methods 37, 4 (2005), 626–630.
- Mnih et al. (2014) Volodymyr Mnih, Nicolas Heess, Alex Graves, et al. 2014. Recurrent models of visual attention. In Advances in Neural Information Processing Systems. 2204–2212.
- Mollahosseini et al. (2019) Ali Mollahosseini, Behzad Hasani, and Mohammad H Mahoor. 2019. AffectNet: A Database for Facial Expression, Valence, and Arousal Computing in the Wild. IEEE Transactions on Affective Computing 10, 1 (2019), 18–31.
- Peng et al. (2015) Kuan-Chuan Peng, Amir Sadovnik, Andrew Gallagher, and Tsuhan Chen. 2015. A Mixed Bag of Emotions: Model, Predict, and Transfer Emotion Distributions. In IEEE Conference on Computer Vision and Pattern Recognition. 860–868.
- Rao et al. (2019a) Tianrong Rao, Xiaoxu Li, Haimin Zhang, and Min Xu. 2019a. Multi-level region-based Convolutional Neural Network for image emotion classification. Neurocomputing 333 (2019), 429–439.
- Rao et al. (2016) Tianrong Rao, Min Xu, Huiying Liu, Jinqiao Wang, and Ian Burnett. 2016. Multi-scale blocks based image emotion classification using multiple instance learning. In IEEE International Conference on Image Processing. 634–638.
- Rao et al. (2019b) Tianrong Rao, Min Xu, and Dong Xu. 2019b. Learning multi-level deep representations for image emotion classification. Neural Processing Letters (2019).
- Ren et al. (2015) Shaoqing Ren, Kaiming He, Ross Girshick, and Jian Sun. 2015. Faster r-cnn: Towards real-time object detection with region proposal networks. In Advances in Neural Information Processing Systems. 91–99.
- Russell and Carroll (1999) James A Russell and James M Carroll. 1999. On the bipolarity of positive and negative affect. Psychological Bulletin 125, 1 (1999), 3.
- Sartori et al. (2015) Andreza Sartori, Dubravko Culibrk, Yan Yan, and Nicu Sebe. 2015. Who’s afraid of Itten: Using the art theory of color combination to analyze emotions in abstract paintings. In ACM International Conference on Multimedia. 311–320.
- Schlosberg (1954) Harold Schlosberg. 1954. Three dimensions of emotion. Psychological Review 61, 2 (1954), 81.
- Selvaraju et al. (2017) Ramprasaath R. Selvaraju, Michael Cogswell, Abhishek Das, Ramakrishna Vedantam, Devi Parikh, and Dhruv Batra. 2017. Grad-CAM: Visual Explanations From Deep Networks via Gradient-Based Localization. In IEEE International Conference on Computer Vision. 618–626.
- Simonyan and Zisserman (2015) Karen Simonyan and Andrew Zisserman. 2015. Very deep convolutional networks for large-scale image recognition. In International Conference on Learning Representations.
- Song et al. (2017) Jingkuan Song, Lianli Gao, Zhao Guo, Wu Liu, Dongxiang Zhang, and Heng Tao Shen. 2017. Hierarchical LSTM with adjusted temporal attention for video captioning. In International Joint Conference on Artificial Intelligence. 2737–2743.
- Song et al. (2018) Kaikai Song, Ting Yao, Qiang Ling, and Tao Mei. 2018. Boosting image sentiment analysis with visual attention. Neurocomputing 312 (2018), 218–228.
- Stollenga et al. (2014) Marijn F Stollenga, Jonathan Masci, Faustino Gomez, and Jürgen Schmidhuber. 2014. Deep networks with internal selective attention through feedback connections. In Advances in Neural Information Processing Systems. 3545–3553.
- Subramanian et al. (2018) Ramanathan Subramanian, Julia Wache, Mojtaba Khomami Abadi, Radu L Vieriu, Stefan Winkler, and Nicu Sebe. 2018. ASCERTAIN: Emotion and personality recognition using commercial sensors. IEEE Transactions on Affective Computing 9, 2 (2018), 147–160.
- Tang et al. (2014) Yichuan Tang, Nitish Srivastava, and Ruslan R Salakhutdinov. 2014. Learning generative models with visual attention. In Advances in Neural Information Processing Systems. 1808–1816.
- Tumasjan et al. (2010) Andranik Tumasjan, Timm O Sprenger, Philipp G Sandner, and Isabell M Welpe. 2010. Predicting elections with twitter: What 140 characters reveal about political sentiment. In AAAI Conference on Weblogs and Social Media.
- Woo et al. (2018) Sanghyun Woo, Jongchan Park, Joon-Young Lee, and In So Kweon. 2018. Cbam: Convolutional block attention module. In European Conference on Computer Vision. 3–19.
- Xu and Saenko (2016) Huijuan Xu and Kate Saenko. 2016. Ask, attend and answer: Exploring question-guided spatial attention for visual question answering. In European Conference on Computer Vision. 451–466.
- Xu et al. (2015) Kelvin Xu, Jimmy Ba, Ryan Kiros, Kyunghyun Cho, Aaron Courville, Ruslan Salakhudinov, Rich Zemel, and Yoshua Bengio. 2015. Show, attend and tell: Neural image caption generation with visual attention. In International Conference on Machine Learning. 2048–2057.
- Yang et al. (2013) Byunghwa Yang, Youngchan Kim, and Changjo Yoo. 2013. The integrated mobile advertising model: The effects of technology-and emotion-based evaluations. Journal of Business Research 66, 9 (2013), 1345–1352.
- Yang et al. (2018a) Jufeng Yang, Dongyu She, Yukun Lai, and Ming-Hsuan Yang. 2018a. Retrieving and classifying affective Images via deep metric learning. In AAAI Conference on Artificial Intelligence.
- Yang et al. (2018b) Jufeng Yang, Dongyu She, Yu-Kun Lai, Paul L Rosin, and Ming-Hsuan Yang. 2018b. Weakly supervised coupled networks for visual sentiment analysis. In IEEE Conference on Computer Vision and Pattern Recognition. 7584–7592.
- Yang et al. (2017) Jufeng Yang, Dongyu She, and Ming Sun. 2017. Joint image emotion classification and distribution learning via deep convolutional neural network. In International Joint Conference on Artificial Intelligence. 3266–3272.
- Yang et al. (2018c) Jufeng Yang, Dongyu She, Ming Sun, Ming-Ming Cheng, Paul L Rosin, and Liang Wang. 2018c. Visual sentiment prediction based on automatic discovery of affective regions. IEEE Transactions on Multimedia 20, 9 (2018), 2513–2525.
- Yang et al. (2016) Zichao Yang, Xiaodong He, Jianfeng Gao, Li Deng, and Alex Smola. 2016. Stacked attention networks for image question answering. In IEEE Conference on Computer Vision and Pattern Recognition. 21–29.
- Yanulevskaya et al. (2008) Victoria Yanulevskaya, Jan C van Gemert, Katharina Roth, Ann-Katrin Herbold, Nicu Sebe, and Jan-Mark Geusebroek. 2008. Emotional valence categorization using holistic image features. In IEEE International Conference on Image Processing. 101–104.
- Yao et al. (2019) Xingxu Yao, Dongyu She, Sicheng Zhao, Jie Liang, Yu-Kun Lai, and Jufeng Yang. 2019. Attention-aware Polarity Sensitive Embedding for Affective Image Retrieval. In IEEE International Conference on Computer Vision.
- You et al. (2017) Quanzeng You, Hailin Jin, and Jiebo Luo. 2017. Visual Sentiment Analysis by Attending on Local Image Regions. In AAAI Conference on Artificial Intelligence. 231–237.
- You et al. (2016a) Quanzeng You, Hailin Jin, Zhaowen Wang, Chen Fang, and Jiebo Luo. 2016a. Image captioning with semantic attention. In IEEE Conference on Computer Vision and Pattern Recognition. 4651–4659.
- You et al. (2016b) Quanzeng You, Jiebo Luo, Hailin Jin, and Jianchao Yang. 2016b. Building a large scale dataset for image emotion recognition: The fine print and the benchmark. In AAAI Conference on Artificial Intelligence. 308–314.
- Yuan et al. (2013) Jianbo Yuan, Sean Mcdonough, Quanzeng You, and Jiebo Luo. 2013. Sentribute: image sentiment analysis from a mid-level perspective. In ACM International Workshop on Issues of Sentiment Discovery and Opinion Mining. 10.
- Zhan et al. (2019) Chi Zhan, Dongyu She, Sicheng Zhao, Ming-Ming Cheng, and Jufeng Yang. 2019. Zero-Shot Emotion Recognition via Affective Structural Embedding. In IEEE International Conference on Computer Vision.
- Zhang et al. (2016) Yanhao Zhang, Lei Qin, Rongrong Ji, Sicheng Zhao, Qingming Huang, and Jiebo Luo. 2016. Exploring coherent motion patterns via structured trajectory learning for crowd mood modeling. IEEE Transactions on Circuits and Systems for Video Technology 27, 3 (2016), 635–648.
- Zhao et al. (2017c) Bo Zhao, Xiao Wu, Jiashi Feng, Qiang Peng, and Shuicheng Yan. 2017c. Diversified visual attention networks for fine-grained object classification. IEEE Transactions on Multimedia 19, 6 (2017), 1245–1256.
- Zhao et al. (2017e) Na Zhao, Hanwang Zhang, Richang Hong, Meng Wang, and Tat-Seng Chua. 2017e. Videowhisper: Toward discriminative unsupervised video feature learning with attention-based recurrent neural networks. IEEE Transactions on Multimedia 19, 9 (2017), 2080–2092.
- Zhao et al. (2017a) Sicheng Zhao, Guiguang Ding, Yue Gao, and Jungong Han. 2017a. Approximating Discrete Probability Distribution of Image Emotions by Multi-Modal Features Fusion. In International Joint Conference on Artificial Intelligence. 4669–4675.
- Zhao et al. (2017b) Sicheng Zhao, Guiguang Ding, Yue Gao, and Jungong Han. 2017b. Learning visual emotion distributions via multi-modal features fusion. In ACM International Conference on Multimedia. 369–377.
- Zhao et al. (2018a) Sicheng Zhao, Guiguang Ding, Yue Gao, Xin Zhao, Youbao Tang, Jungong Han, Hongxun Yao, and Qingming Huang. 2018a. Discrete probability distribution prediction of image emotions with shared sparse learning. IEEE Transactions on Affective Computing (2018).
- Zhao et al. (2018b) Sicheng Zhao, Guiguang Ding, Qingming Huang, Tat-Seng Chua, Björn W Schuller, and Kurt Keutzer. 2018b. Affective Image Content Analysis: A Comprehensive Survey.. In International Joint Conference on Artificial Intelligence. 5534–5541.
- Zhao et al. (2018c) Sicheng Zhao, Yue Gao, Guiguang Ding, and Tat-Seng Chua. 2018c. Real-time multimedia social event detection in microblog. IEEE Transactions on Cybernetics 48, 11 (2018), 3218–3231.
- Zhao et al. (2014a) Sicheng Zhao, Yue Gao, Xiaolei Jiang, Hongxun Yao, Tat-Seng Chua, and Xiaoshuai Sun. 2014a. Exploring principles-of-art features for image emotion recognition. In ACM International Conference on Multimedia. 47–56.
- Zhao et al. (2019a) Sicheng Zhao, Amir Gholaminejad, Guiguang Ding, Yue Gao, Jungong Han, and Kurt Keutzer. 2019a. Personalized emotion recognition by personality-aware high-order learning of physiological signals. ACM Transactions on Multimedia Computing, Communications, and Applications 15, 1s (2019), 14.
- Zhao et al. (2019b) Sicheng Zhao, Chuang Lin, Pengfei Xu, Sendong Zhao, Yuchen Guo, Ravi Krishna, Guiguang Ding, and Kurt Keutzer. 2019b. CycleEmotionGAN: Emotional Semantic Consistency Preserved CycleGAN for Adapting Image Emotions. In AAAI Conference on Artificial Intelligence. 2620–2627.
- Zhao et al. (2018d) Sicheng Zhao, Hongxun Yao, Yue Gao, Guiguang Ding, and Tat-Seng Chua. 2018d. Predicting personalized image emotion perceptions in social networks. IEEE Transactions on Affective Computing 9, 4 (2018), 526–540.
- Zhao et al. (2017d) Sicheng Zhao, Hongxun Yao, Yue Gao, Rongrong Ji, and Guiguang Ding. 2017d. Continuous Probability Distribution Prediction of Image Emotions via Multi-Task Shared Sparse Regression. IEEE Transactions on Multimedia 19, 3 (2017), 632–645.
- Zhao et al. (2016) Sicheng Zhao, Hongxun Yao, Yue Gao, Rongrong Ji, Wenlong Xie, Xiaolei Jiang, and Tat-Seng Chua. 2016. Predicting personalized emotion perceptions of social images. In ACM International Conference on Multimedia. 1385–1394.
- Zhao et al. (2014b) Sicheng Zhao, Hongxun Yao, You Yang, and Yanhao Zhang. 2014b. Affective image retrieval via multi-graph learning. In ACM International Conference on Multimedia. 1025–1028.
- Zhao et al. (2018e) Sicheng Zhao, Xin Zhao, Guiguang Ding, and Kurt Keutzer. 2018e. EmotionGAN: unsupervised domain adaptation for learning discrete probability distributions of image emotions. In ACM International Conference on Multimedia. 1319–1327.
- Zhou et al. (2019) Bolei Zhou, Hang Zhao, Xavier Puig, Tete Xiao, Sanja Fidler, Adela Barriuso, and Antonio Torralba. 2019. Semantic understanding of scenes through the ade20k dataset. International Journal of Computer Vision 127, 3 (2019), 302–321.
- Zhu et al. (2017) Xinge Zhu, Liang Li, Weigang Zhang, Tianrong Rao, Min Xu, Qingming Huang, and Dong Xu. 2017. Dependency exploitation: a unified CNN-RNN approach for visual emotion recognition. In International Joint Conference on Artificial Intelligence. 3595–3601.
- Zitnick and Dollár (2014) C Lawrence Zitnick and Piotr Dollár. 2014. Edge boxes: Locating object proposals from edges. In European Conference on Computer Vision. 391–405.