A Photometric Analysis of the Relationship Between Type Ia Supernova
UV Flux and Host Galaxy Metallicity
Abstract
The effect of progenitor metallicity on Type Ia Supernovae (SNe Ia) has important cosmological implications due to the need for these standardizable candles to be compared across large spans of cosmic time in which the progenitor stars might have different properties. Theoretical models have come to different conclusions as to the wavelength range impacted by metallicity differences, leading to differing interpretations of the growing sample of UV observations. Recent work has claimed a correlation between the mid-UV flux of SNe Ia measured from Swift grism spectra and the gas-phase metallicities measured for their host galaxies. Here we examine UV photometry for the same objects. We find no significant correlations between the UV-optical colors (or UV/optical count rate ratios) of the SNe Ia and the host galaxy properties of mass or metallicity. The lack of a significant correlation with host galaxy metallicity implies another physical difference other than progenitor metallicity dominates the UV flux differences. We are no longer limited by a lack of UV observations. Rather, understanding the existing observations requires improved theoretical models and a larger parameter space of physical differences.
1 Introduction
Type Ia Supernovae (SNe Ia) are important cosmological tools because their similarly high luminosities allow them to be used as standard candles to measure distances. The dispersion in luminosities can be reduced with corrections for the light curve shape and colors (Phillips et al., 1999; Riess et al., 1996; Hamuy et al., 1996). Correlations have also been found with host galaxy mass (Kelly et al., 2010; Lampeitl et al., 2010; Childress et al., 2013; Hayden et al., 2013; Moreno-Raya et al., 2016) and are now corrected for in most cosmological studies (Scolnic et al., 2018). A variation in the magnitude of the so-called “mass step” have been found for different surveys, filter choices, and SN fitters (Kim et al., 2014; Brout et al., 2019). Correlations have also been found with the local host galaxy parameters as well (Rigault et al., 2013; Galbany et al., 2014). The physical connection between the host galaxy parameters and the SN luminosities is not yet clear. The concern is that systematic differences in the progenitors could change the observed properties of the explosion in a way not corrected for in the current methods of standardization.
Metallicity, here referring to the pre-explosion chemical abundances in the white dwarf, has been worried about as a potential systematic for many years (Höflich et al., 1998; Mazzali & Podsiadlowski, 2006) because of the secular building up of metals in the universe and the different chemical compositions of the galaxies hosting SNe Ia. Many models have explored how changes in progenitor metallicity will effect the bolometric and broadband fluxes of SNe Ia (Timmes et al., 2003, see also De et al., 2014 and references therein). Those which calculated effects at UV wavelengths found stronger effects in the UV than in the optical (Lentz et al., 2000; Sauer et al., 2008; Walker et al., 2012; Miles et al., 2016), though differing from each other in how much or in what wavelength regions the effects are seen.
Foley & Kirshner (2013) presented UV spectra of two SNe Ia which are nearly identical twins in terms of near-UV/optical spectra and light curve shapes. The most significant difference is in the mid-UV flux level. By comparison with the models of Lentz et al. (2000), they found a relative metallicity difference could approximate the spectral changes in the mid-UV. Brown et al. (2015) found that the same metallicity differences could be inferred from Swift/UVOT broad-band photometry given the assumption that the color variations were caused by the same metallicity differences as between the epoch 15 Lentz et al. (2000) models. Brown et al. (2015) also showed, however, that the UV flux levels of the Lentz et al. (2000) models were too high and that even the relative color differences between objects did not match the multi-epoch color differences of SNe 2011by and 2011fe. Using a different set of models from Walker et al. (2012), Brown et al. (2019) found that SN 2011fe had UV flux levels comparable to low-metallicity models while the redder SN 2017erp featured a depressed UV continuum which matched the higher-metallicity models. From the observations, it is clear that significant but distinct variations appear in the mid-UV and near-UV wavelength regions; however, the same physical difference – metallicity – has been invoked for both of the spectral ranges.
A promising approach is to look for other observables which correlate with the UV differences (e.g. Milne et al., 2013; Brown et al., 2018). Pan et al. (2019) report a correlation between the host galaxy metallicity and f2535,the ratio of the mid-UV flux between 2450-2620 Å and the optical flux between 4000-4500 Å, as measured in grism observations with the Neil Gehrels Swift Observatory’s Ultra-Violet Optical Telescope (Gehrels et al., 2004; Roming et al., 2005; Kuin et al., 2015). In this article we report whether we can confirm such a correlation from the Swift/UVOT photometry of the same objects. A shown below, the photometry does not show a correlation with the host galaxy properties.
2 Observations
The photometry used is from the Swift Optical Ultraviolet Supernova Archive (SOUSA; Brown et al., 2014). Most of the photometry has been previously published and made available via the Swift SN website and the Open Supernova Catalogue (OSC; Guillochon et al., 2017), while four additional objects were reduced and added following the posting of Pan et al. (2019).
Some objects from Pan et al. (2019) are not included, as we do not yet have pre-explosion or late-time images from which to subtract the underlying galaxy contribution to the observed count rates. This turns out to be especially important for the sample used by Pan et al. (2019). SN 2016ccz has the lowest host-galaxy metallicity in the Pan et al. (2019) sample and is claimed to have the highest mid-UV/optical flux ratio. This object dominates the UV-metallicity relationship in Pan et al. (2019). In our photometry analysis, we do not significantly detect SN2016ccz in the mid-UV uvm2 filter after subtraction of the host galaxy flux. While the Pan et al. (2018) UVOT grism reduction has some improvements compared to the default extractions, it can only estimate the underlying contribution based on the background flux on either side of the source spectrum. It does not use the more accurate spectral template image subtraction as in Smitka et al. (2016). This is necessary in cases of strong, non-uniform galaxy contamination. In the case of SN2016ccz, the mid-UV flux in their spectrum must be dominated by the galaxy. As SN2016ccz is not detected significantly and has a negative count rate consistent with zero flux, it would be excluded or treated as an upper limit if fitting the magnitudes or colors. Instead, we use the count rates and count rate errors at the epoch closest to the time of B-band maximum light to test for correlations with the host galaxy mass or metallicity.
3 Analysis
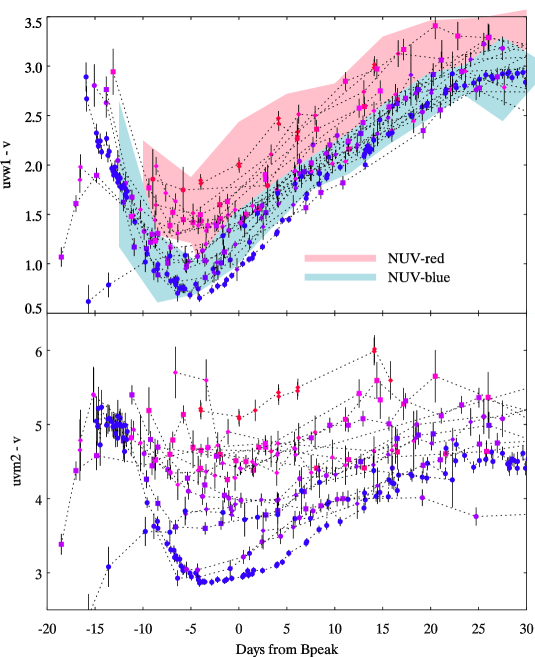
We first confirm that the observed colors are similar to those of other UV photometric Ia samples studied previously (e.g. Brown et al., 2010; Milne et al., 2010, 2013; Brown et al., 2017). Figure 1 shows the SN Ia color evolution plotted with color regions signifying NUV-blue and NUV-red SNe as designated by Milne et al. (2013). By fraction, the NUV-red SNe have previously been observed to be more common (Milne et al., 2013, 2015) at low redshift. This sample seems to have a larger fraction of NUV-blue SNe Ia. The spectroscopic nature of this sample could be biased, either in triggering or in publishing SNe Ia with higher (and thus more detectable) UV flux. The higher flux could result from intrinsic differences or from lower host galaxy or MW reddening. However, a similar range of colors is observed.
The color evolution plots are not corrected for reddening, which can have the effect of shifting a NUV-blue SN Ia into the NUV-red parameter space (Brown et al., 2017). To account for reddening, Figure 2 displays the observed colors, but with a reddening track showing the effect of different reddening laws. The vertical dispersion is indicative of intrinsic UV differences. Splitting the sample at 12 + log(OH)=8.6, we find that both groups disperse vertically, though the higher metallicity group has a smaller spread in the color. Regardless of whether the NUV-blue/red groups are distinct or a continuous color parameter, they are not related to the host galaxy metallicity. This seems to contradict the conclusions of Brown et al. (2019) if the metallicity differences of the Walker et al. (2012) models are attributed to the progenitor metallicity. Recent measurements of the gas phase metallicity in two star forming regions in NGC 5861 point to a subsolar metallicity (12 + log(OH)=7.67 0.01 and 7.87 0.03; Muñoz-Vergara et al., 2019) for the host of the NUV-red SN 2017erp.


We now look directly for correlations between the UV flux of this SN Ia sample and the properties of the host galaxies. To make a clearer comparison with the UV-optical flux ratios shown in Pan et al. (2019), we use the UVOT filter uvm2 for the mid-UV, and uvw1 and u for the near-UV, and B for the optical (sometimes designated as as per the UVOT convention). To incorporate the undetected flux of SN 2016ccz we now use measured count rates and associated errors at the epoch closest to maximum light in the B band rather than the fitted magnitudes. We first correct the count rates for the estimated Milky Way reddening (Schlafly & Finkbeiner, 2011) and the host galaxy reddening using the values from Pan et al. (2019). Some of the Pan et al. (2019) host galaxy reddening values are actually from the galaxy spectral fitting and thus not necessarily reflective of the line of sight reddening to a SN in or near a particular part of the host galaxy. We do a separate correction assuming that all of the SNe Ia have the same color at the time of maximum in the B band, set to the bluest object in this sample with (B-V)Bpeak=-0.15. The count rates are corrected for reddening using the extinction coefficients derived from the Cardelli et al. (1989) reddening law with RV=3.1 and the SN 2011fe spectrum (Brown et al., 2016).
We can confirm a trend of colors with the light curve shape (stretch or M15(B), as also seen in Brown et al. 2010 and Foley et al. 2016), so we exclude the rapidly-declining SNe 2005ke and 2011iv from this analysis to focus on the UV differences of SNe Ia with more normal light curve shapes.
Figure 3 shows the count rate ratios (with the color-based reddening correction) plotted with respect to the host galaxy mass and metallicity as reported by Pan et al. (2019). Linear fits are performed using the Python Markov chain Monte Carlo (MCMC) Bayesian linear fitting algorithm LINMIX (Kelly, 2007). This process is able to account for heteroscedastic errors in both the x and y components of the fit. The uncertainties in the host galaxy parameters from Pan et al. (2019) are not symmetric. In Table 1 we report results using the positive error bars for both, though we have checked that our conclusions are unchanged if we use just the negative error bars. We execute the MCMC fit with 10,000 draws from the posterior distribution and K=2 Gaussians in the mixture model. We provide the mean slope and intercept from the fits as well as the standard deviation of both of these parameters in Table 1. Values are provided for our color-based extinction correction as well as the original Pan et al. (2019) host reddening estimates. The mean slopes show a different trend than that seen by Pan et al. (2019), namely we see stronger trends in the near-UV u and uvw1 filters than in the mid-UV uvm2 filter. Nevertheless, a significant fraction of the draws from the posterior distribution have positive and negative slopes, and the mean slope is never greater than one standard deviation of the sampled slopes. The limited number of SNe Ia with low host masses and low host galaxy metallicities gives individual objects a disproportionate weight considering the large scatter in the more population regions of the host galaxy parameter space.
We also present the Kendall and Pearson correlation coefficients and p-values. These do not take into account the uncertainties, but are independent means of evaluating the significance of a correlation. The p-values are high, with the smallest being 0.16. Thus we do not find evidence with which to reject the null hypothesis that there is no correlation between the host galaxy mass or metallicity and the UV-optical count rate ratios at the time of B-band maximum light.

4 Discussion
The lack of correlations between the UV flux and the host galaxy metallicity is surprising given the many models which predict strong UV effects.
There are a number of reasons which might contribute to a lack of correlation between the UV properties of the SNe Ia and the measured metallicities of their host galaxies. First, within a galaxy there are metallicity gradients (Zaritsky et al., 1994), such that the global gas-phase metallicity may not represent the gas-phase metallicity at the location of the SN progenitor. Galbany et al. (2016) found that on average there are small differences between the total and local metallicity. These differences were measured as -0.018 and -0.088 dex, respectively, for the oxygen and stellar metallicities. For the oxygen abundances, the metallicity measured at the location of individual objects changed from 0.1 below to 0.1 above that of the host galaxy as a whole, while the stellar metallicity differences ranged from - 0.3 to 0.2 dex. Zhou et al. (2019) used integral field spectroscopy to study the local, central, and global metallicities of SN hosts. They conclude that the bias is small between them, though individual objects varied by up to 0.6 dex. Though small, these metallicity differences within a galaxy are as large as the range of this Pan et al. (2019) sample. To give an example noted by Foley & Kirshner (2013), the SDSS-measured metallicity of M101 is 9.12 (Prieto et al., 2008), but the gradient results in a value of 8.45 at the location of SN 2011fe (Stoll et al., 2011, and see also Vílchez et al., 2019). The global versus local metallicity difference for SN 2011fe is as large as that between the lowest and highest metallicities of the galaxies in Pan et al. (2019) sample. The lack of a correlation with the global host galaxy metallicity does not rule out the possibility of a correlation with the metallicity at the SN location.
Second, the time between the birth of a star and when it eventually explodes leads to a difference between the progenitor metallicity and the gas-phase metallicity measured near the time and place of explosion due to the chemical evolution of the galaxy (Wyse & Silk, 1987) and the migration of the progenitor from its birth place. This depends on the delay time distribution between progenitor formation and explosion (see Bravo & Badenes, 2011 and the discussion therein). SNe Ia in passive galaxies are found to have a larger difference than those in actively star-forming galaxies. If SNe Ia have the same birth to explosion delay and the underlying host galaxies evolve in a uniform matter, the metallicities would be uniformly shifted. Differences in the delay time and evolution of the galaxy metallicities, however, would lead to more scatter. The lack of a correlation with the current host galaxy metallicity does not rule out the possibility of a correlation with the progenitor metallicity at the time the progenitor formed.
Third, the white dwarf progenitor may have a different composition at the time of explosion than it did at birth. De et al. (2014) note that simmering causes a neutronization floor larger than that from the progenitor metallicity. They highlight that the most relevant parameter is the metallicity at the time of explosion. The lack of a correlation with the host galaxy metallicity does not rule out the possibility of a correlation with the SN progenitor metallicity at the time of explosion.
Finally, the explosion itself results in an mixing of the products of nucleosynthesis which can mimic the effect of metallicity differences (Höflich et al., 1998). The models of Walker et al. (2012) acknowledge that the adopted composition structure could be affected by upmixing as well as primordial metallicity. The lack of an observed correlation with the host galaxy metallicity does not rule out the possibility of a correlation with the metal content in the SN ejecta.
There are also complications of the observations and in the analysis which could mask a real correlation. While the UV photometry used here has much higher S/N than the spectra used by Pan et al. (2019), we have a comparable (and slightly smaller) sample. This is particularly problematic at the low mass and low metallicity regions where single objects have an enhanced impact on the correlations. Even with this sample, however, it is clear that there is significant scatter beyond any possible correlation. Such a scatter points to other physics which is at least as important as progenitor metallicity to the formation and absorption of the UV flux. The next advances will require going beyond the existing models. Self-consistent modeling of the progenitor evolution, nucleosynthesis, radiative transfer, and computation of observables is needed (Bravo et al., 2010; Miles et al., 2016).
A further complication in UV analyses is the correction for dust reddening. In particular, if a relevant variable such as metallicity also affects the optical colors from which the reddening is estimated (Höflich et al., 2000; Walker et al., 2012; Brown et al., 2019), an inaccurate correction of the UV flux could enhance or diminish the physical effect being studied. Brown et al. (2018) showed this effect in a study of the UV colors of SNe Ia of differing velocities for which the optical color effect is still being studied. This is important in studies such as this, as the amount and type of dust may also correlate with the host galaxy properties.
5 Conclusions
In conclusion, we find no evidence for a correlation between the mass or metallicity and the UV-optical colors or count rate ratios. This in contrast to the findings of Pan et al. (2019) which we attribute to an overestimate of the UV flux for SN 2016ccz in the lowest metallicity host galaxy of the sample. Samples covering a wider range in host galaxy parameters will help elucidate any physical connections which may exist. The large scatter seen perpendicular to correlations of the UV flux with light curve shape (Brown et al., 2010; Foley et al., 2016), optical colors (as a proxy for reddening; Brown et al., 2016), velocity (Milne et al., 2013; Brown et al., 2018), and now host galaxy mass and metallicity imply yet another physical difference must exist between optically-similar SNe Ia which strongly affects the UV. Further theoretical work is needed to compare against the multiwavelength and time-series data now available to better understand the diversity of these standard candles and how it might impact their use as cosmological distance indicators.
References
- Bravo & Badenes (2011) Bravo, E., & Badenes, C. 2011, MNRAS, 414, 1592
- Bravo et al. (2010) Bravo, E., Domínguez, I., Badenes, C., Piersanti, L., & Straniero, O. 2010, ApJL, 711, L66
- Brout et al. (2019) Brout, D., Scolnic, D., Kessler, R., et al. 2019, ApJ, 874, 150
- Brown et al. (2015) Brown, P. J., Baron, E., Milne, P., Roming, P. W. A., & Wang, L. 2015, ApJ, 809, 37
- Brown et al. (2016) Brown, P. J., Breeveld, A., Roming, P. W. A., & Siegel, M. 2016, AJ, 152, 102
- Brown et al. (2014) Brown, P. J., Breeveld, A. A., Holland, S., Kuin, P., & Pritchard, T. 2014, A&SS, 354, 89
- Brown et al. (2017) Brown, P. J., Landez, N. J., Milne, P. A., & Stritzinger, M. D. 2017, ApJ, 836, 232
- Brown et al. (2018) Brown, P. J., Perry, J. M., Beeny, B. A., Milne, P. A., & Wang, X. 2018, ArXiv e-prints, arXiv:1807.10391
- Brown et al. (2010) Brown, P. J., Roming, P. W. A., Milne, P., et al. 2010, ApJ, 721, 1608
- Brown et al. (2019) Brown, P. J., Hosseinzadeh, G., Jha, S. W., et al. 2019, ApJ, 877, 152
- Cardelli et al. (1989) Cardelli, J. A., Clayton, G. C., & Mathis, J. S. 1989, ApJ, 345, 245
- Childress et al. (2013) Childress, M., Aldering, G., Antilogus, P., et al. 2013, ApJ, 770, 108
- De et al. (2014) De, S., Timmes, F. X., Brown, E. F., et al. 2014, ApJ, 787, 149
- Foley & Kirshner (2013) Foley, R. J., & Kirshner, R. P. 2013, ApJL, 769, L1
- Foley et al. (2016) Foley, R. J., Pan, Y.-C., Brown, P., et al. 2016, MNRAS, 461, 1308
- Galbany et al. (2014) Galbany, L., Stanishev, V., Mourão, A. M., et al. 2014, A&A, 572, A38
- Galbany et al. (2016) —. 2016, A&A, 591, A48
- Gehrels et al. (2004) Gehrels, N., Chincarini, G., Giommi, P., et al. 2004, ApJ, 611, 1005
- Guillochon et al. (2017) Guillochon, J., Parrent, J., Kelley, L. Z., & Margutti, R. 2017, ApJ, 835, 64
- Hamuy et al. (1996) Hamuy, M., Phillips, M. M., Suntzeff, N. B., et al. 1996, AJ, 112, 2398
- Hayden et al. (2013) Hayden, B. T., Gupta, R. R., Garnavich, P. M., et al. 2013, ApJ, 764, 191
- Höflich et al. (2000) Höflich, P., Nomoto, K., Umeda, H., & Wheeler, J. C. 2000, ApJ, 528, 590
- Höflich et al. (1998) Höflich, P., Wheeler, J. C., & Thielemann, F. K. 1998, ApJ, 495, 617
- Hosseinzadeh et al. (2017) Hosseinzadeh, G., Sand, D. J., Valenti, S., et al. 2017, ApJ, 845, L11
- Kelly (2007) Kelly, B. C. 2007, ApJ, 665, 1489
- Kelly et al. (2010) Kelly, P. L., Hicken, M., Burke, D. L., Mandel, K. S., & Kirshner, R. P. 2010, ApJ, 715, 743
- Kim et al. (2014) Kim, A. G., Aldering, G., Antilogus, P., et al. 2014, ApJ, 784, 51
- Kuin et al. (2015) Kuin, N. P. M., Landsman, W., Breeveld, A. A., et al. 2015, ArXiv e-prints, arXiv:1501.02433
- Lampeitl et al. (2010) Lampeitl, H., Smith, M., Nichol, R. C., et al. 2010, ApJ, 722, 566
- Lentz et al. (2000) Lentz, E. J., Baron, E., Branch, D., Hauschildt, P. H., & Nugent, P. E. 2000, ApJ, 530, 966
- Mazzali & Podsiadlowski (2006) Mazzali, P. A., & Podsiadlowski, P. 2006, MNRAS, 369, L19
- Miles et al. (2016) Miles, B. J., van Rossum, D. R., Townsley, D. M., et al. 2016, ApJ, 824, 59
- Milne et al. (2013) Milne, P. A., Brown, P. J., Roming, P. W. A., Bufano, F., & Gehrels, N. 2013, ApJ, 779, 23
- Milne et al. (2015) Milne, P. A., Foley, R. J., Brown, P. J., & Narayan, G. 2015, ApJ, 803, 20
- Milne et al. (2010) Milne, P. A., Brown, P. J., Roming, P. W. A., et al. 2010, ApJ, 721, 1627
- Moreno-Raya et al. (2016) Moreno-Raya, M. E., Mollá, M., López-Sánchez, Á. R., et al. 2016, ApJ, 818, L19
- Muñoz-Vergara et al. (2019) Muñoz-Vergara, D., Firpo, V., Hägele, G. F., et al. 2019, Boletin de la Asociacion Argentina de Astronomia La Plata Argentina, 61, 207
- Pan et al. (2018) Pan, Y.-C., Foley, R. J., Filippenko, A. V., & Kuin, N. P. M. 2018, MNRAS, 479, 517
- Pan et al. (2019) Pan, Y. C., Foley, R. J., Jones, D. O., Filippenko, A. V., & Kuin, N. P. M. 2019, arXiv e-prints, arXiv:1906.09554
- Pettini & Pagel (2004) Pettini, M., & Pagel, B. E. J. 2004, MNRAS, 348, L59
- Phillips et al. (1999) Phillips, M. M., Lira, P., Suntzeff, N. B., et al. 1999, AJ, 118, 1766
- Prieto et al. (2008) Prieto, J. L., Stanek, K. Z., & Beacom, J. F. 2008, ApJ, 673, 999
- Riess et al. (1996) Riess, A. G., Press, W. H., & Kirshner, R. P. 1996, ApJ, 473, 88
- Rigault et al. (2013) Rigault, M., Copin, Y., Aldering, G., et al. 2013, A&A, 560, A66
- Roming et al. (2005) Roming, P. W. A., Kennedy, T. E., Mason, K. O., et al. 2005, Space Science Reviews, 120, 95
- Sauer et al. (2008) Sauer, D. N., Mazzali, P. A., Blondin, S., et al. 2008, MNRAS, 391, 1605
- Schlafly & Finkbeiner (2011) Schlafly, E. F., & Finkbeiner, D. P. 2011, ApJ, 737, 103
- Scolnic et al. (2018) Scolnic, D. M., Jones, D. O., Rest, A., et al. 2018, ApJ, 859, 101
- Smitka et al. (2016) Smitka, M. T., Brown, P. J., Kuin, P., & Suntzeff, N. B. 2016, PASP, 128, 034501
- Smitka et al. (2015) Smitka, M. T., Brown, P. J., Suntzeff, N. B., et al. 2015, ApJ, 813, 30
- Stoll et al. (2011) Stoll, R., Shappee, B., & Stanek, K. Z. 2011, The Astronomer’s Telegram, 3588, 1
- Timmes et al. (2003) Timmes, F. X., Brown, E. F., & Truran, J. W. 2003, ApJL, 590, L83
- Vílchez et al. (2019) Vílchez, J. M., Relaño, M., Kennicutt, R., et al. 2019, MNRAS, 483, 4968
- Walker et al. (2012) Walker, E. S., Hachinger, S., Mazzali, P. A., et al. 2012, MNRAS, 427, 103
- Wyse & Silk (1987) Wyse, R. F. G., & Silk, J. 1987, ApJ, 313, L11
- Zaritsky et al. (1994) Zaritsky, D., Kennicutt, Robert C., J., & Huchra, J. P. 1994, ApJ, 420, 87
- Zhou et al. (2019) Zhou, L., Liang, Y. C., Ge, J. Q., et al. 2019, arXiv e-prints, arXiv:1907.03574
| Host Parameter | Reddening | Color | Slope | Intercept | Kendall | Kendall | Pearson | Pearson | % of Fits |
|---|---|---|---|---|---|---|---|---|---|
| Correction | Ratio | Correlation | P-Value | Correlation | P-Value | with Negative | |||
| Coefficient | Coefficient | Slope | |||||||
| log (M) | P19 | u/b | 0.030.03 | 0.390.28 | 0.15 | 0.44 | 0.31 | 0.23 | 14 |
| log (M) | P19 | w1/b | 0.000.01 | 0.050.05 | 0.16 | 0.44 | 0.19 | 0.50 | 36 |
| log (M) | P19 | m2/b | -0.000.00 | 0.010.01 | -0.11 | 0.63 | -0.05 | 0.87 | 70 |
| 12 + log (O/H) | P19 | w1/b | 0.020.04 | -0.110.37 | 0.20 | 0.45 | 0.25 | 0.47 | 31 |
| 12 + log (O/H) | P19 | m2/b | 0.000.01 | -0.010.04 | 0.16 | 0.54 | 0.39 | 0.24 | 36 |
| log (M) | color | u/b | 0.030.03 | 0.450.30 | 0.18 | 0.35 | 0.32 | 0.21 | 15 |
| log (M) | color | w1/b | 0.000.01 | 0.050.05 | 0.11 | 0.63 | 0.26 | 0.36 | 21 |
| log (M) | color | m2/b | -0.00.00 | 0.010.01 | 0.05 | 0.85 | 0.05 | 0.86 | 58 |
| 12 + log (O/H) | color | u/b | 0.220.24 | -1.182.08 | 0.31 | 0.16 | 0.39 | 0.19 | 17 |
| 12 + log (O/H) | color | w1/b | 0.010.05 | 0.000.39 | 0.13 | 0.65 | 0.18 | 0.60 | 42 |
| 12 + log (O/H) | color | m2/b | 0.000.01 | -0.000.07 | 0.09 | 0.76 | 0.41 | 0.22 | 51 |