An all-optical technique enables instantaneous single-shot demodulation of images at high frequency
Abstract
High-frequency demodulation of wide area optical signals in a snapshot manner is a technological challenge that, if solved, could open tremendous perspectives in 3D imaging, free-space communications, or even ballistic photon imaging in highly scattering media. We present here a novel snapshot quadrature demodulation imaging technique, capable of estimating the amplitude and phase of light modulated from a single frame acquisition, without synchronization of emitter and receiver, and with the added capability of continuous frequency tuning. This all-optical setup relies on an electro-optic crystal that acts as a fast sinusoidal optical transmission gate and which, when inserted in an optimized optical architecture, allows for four quadrature image channels to be recorded simultaneously with any conventional camera. We report the design, experimental validation and examples of potential applications of such a wide-field quadrature demodulating system that allowed snapshot demodulation of images with good spatial resolution and continuous frequency selectivity, at modulation frequencies up to 500 kHz; no fundamental impediment in modulating/demodulating in the range 100-1000 MHz range is foreseen.
I Introduction
Lock-in detection is an ubiquitous measurement technique, where the signal of interest is imparted a periodic variation at the source to distinguish it from the random noise that it acquires on its path to the detector. Extremely weak signals may be thus extracted by selectively amplifying, at the detector, the component at the modulation frequency. In the field of optics, light intensity modulation/demodulation techniques have been employed, for example, in telemetry, free-space communications, bio-medical imaging and viewing through scattering media. The enhanced immunity to noise and the massively increased transmission bandwidth due to multiplexed modulation has been widely used in telemetry. On the other hand, a weakly modulated signal may be intentionally cloaked in noise, with several different messages being encoded at different frequencies. Despite the eventuality of an eavesdropper demodulating a message at a certain frequency, the presence of multiple, possibly contradictory messages at different frequencies still provides partial secrecy (or at least discretion) of the communication.
Another very important area where the modulation-demodulation technique plays a dominant role is in the imaging through complex disordered media. Optical inhomogeneities within the medium indeed cause random multiple scattering of photons, altering the normally ballistic transport of light into diffusive transport, which strongly degrades the image-bearing capabilities of the light, hence resulting in turbid medium, and poor visibility, as in the case of biological tissues or in fog. Imaging of objects hidden in such media can be achieved by the extraction of the ballistic photons, that constitute a very small fraction of the total photons reaching the detector, but which retain the information of the source (direction, state of polarization, spatial and temporal modulation) and can lead to direct imaging through a turbid medium. On the other hand, indirect imaging of embedded objects can be performed by estimation of optical inhomogeneities in the turbid medium from the detected scattered photons. As a result, imaging through complex disordered media has been addressed using various techniques ranging from the efficient but costly time-gated techniques ber93 ; sed11 , to the comparatively inexpensive polarization imaging ram98 ; emi96 ; fad14 and spatial modulation techniques Cuccia2009 . In this context, the temporal modulation-demodulation technique utilises the fact that the forward scattered ballistic light travels in a straight-line path within the medium, maintaining a phase relationship with the modulation of the source, while the scattered diffusive light has a statistical distribution of paths and hence loses the unique phase relation with the source, allowing its contribution to be filtered out for sufficiently high modulation frequencies. For instance, modulation frequencies in the range of 10-100 MHz would meet such requirement for transport applications (or for usual 3D range-imaging applications), whereas imaging in biological scattering tissues would require very high frequency operation in the GHz domain pan16 . As a result, modulation-based approaches in the radio-frequency (RF) range have been confined so far to point-wise detection configurations kim08 ; nit77 . Regarding two-dimensional ballistic-light imaging, existing techniques invariably require some form of processing at the receiver, either electronically, mechanically, or via software, increasing the complexity of the system, and often, the processing time. For example, electronic lock-in detection permits demodulation at one location at a time, necessitating a step-scan of the detector emi96 . Software based approaches obviate the need for a step scan, but the requirement of obtaining images in real-time restricts the length of the time-series that may be recorded for demodulation, thus limiting the frequency of use ram98 ; sud16 well beyond the 100 MHz-GHz range.
Clearly, rapid techniques providing wide-field demodulation imaging are greatly desirable as they would not only permit real-time applications like navigation, but would also open up possibilities for for 3D ranging and imaging, vibrometry, optical communications, and specialised scientific instrumentation. Such imaging at high frequencies would be a leap forward for imaging through turbid media, a field of interest that has bearing on vision through opaque scattering walls wan91 ; ber12 ; kat14 ; kan15 ; sud16 ; bad16 , medical diagnosis ben93 ; tro97 ; Boas2001 ; ban16 , food quality analysis lu16 , transport safety Watkins2000 ; hau07 ; fad14 , underwater vision sch04 and imaging through fog ram98 . Progressing from single-pixel lock-in detection to simultaneous demodulation over millions of pixels to achieve snapshot image demodulation would bring to the realm observation of spatially distributed and fast physical effects that remain otherwise undetectable. However, demodulation of light at radio frequencies and higher is known to present several practical challenges like phase synchronization, timing jitters, snapshot operation and difficulty in frequency tuning that have only been partially addressed by the few existing laboratory demonstrations of full-field demodulation, based on image intensifiers, Time-of-Flight (ToF) sensors, lidar systems pay08 ; net08 ; han12 ; li14 ; muf11 . While fast intensity-modulated light sources are easily available, full-field demodulation of images at high frequencies still awaits a viable solution. This calls for a radically new approach to modulation-demodulation imaging in order to overcome technological impediments to rapid, full-field imaging. Here we propose and demonstrate a technique of imaging where the demodulation at the receiver is performed optically to obtain two-dimensional images instantaneously from a recording of a single frame of an ordinary digital camera. This technique is equally applicable to communications, cryptography and ballistic light imaging. As evidenced below, it offers several advantages in addition to the benefit of providing snapshot images.
II Results
II.1 FAST-QUAD : Full-field All-optical Singleshot Technique for QUadrature Demodulation
We report here the first realization of an all-optical full-field instantaneous single-shot demodulation imaging technique - FAST-QUAD (Full-field All-optical Single-shot Technique for Quadrature Demodulation), compatible with high-frequency operation up to the RF range. This is achieved by performing the demodulation of the intensity-modulated light source(s) in the polarization-space at the receiver. For that purpose, we exploit the Pockel’s effect in an electro-optic crystal that introduces a phase difference between two orthogonal components of light that is proportional to an applied voltage. This effect occurs at very high speeds, with response times of a few picoseconds bor13 . As detailed below, suitable electrical excitation of the electro-optic crystal and orientation of birefringent/polarizing optical elements automatically resolves light into the quadrature components, and achieves the demodulation obviating the need for phase synchronization with the source. Final image integration on a standard camera is performed during an exposure time that is several orders of magnitude above the modulation period, and thus a single frame captured by the FAST-QUAD camera provides the demodulated full-field image.
Indeed, contrary to standard approaches that rely on temporal sampling of modulated intensity signals (through image intensifiers, or specific electronic chips such as ToF sensors), FAST-QUAD requires no discrete temporal sampling of the received data. Instead, lock-in demodulation is performed continuously in time and simultaneously over the full spatial extent of the image. This is achieved by transferring the well-known quadrature demodulation (lock-in) principle to the optical domain and in a massively spatially-multiplexed way in order to handle image demodulation.
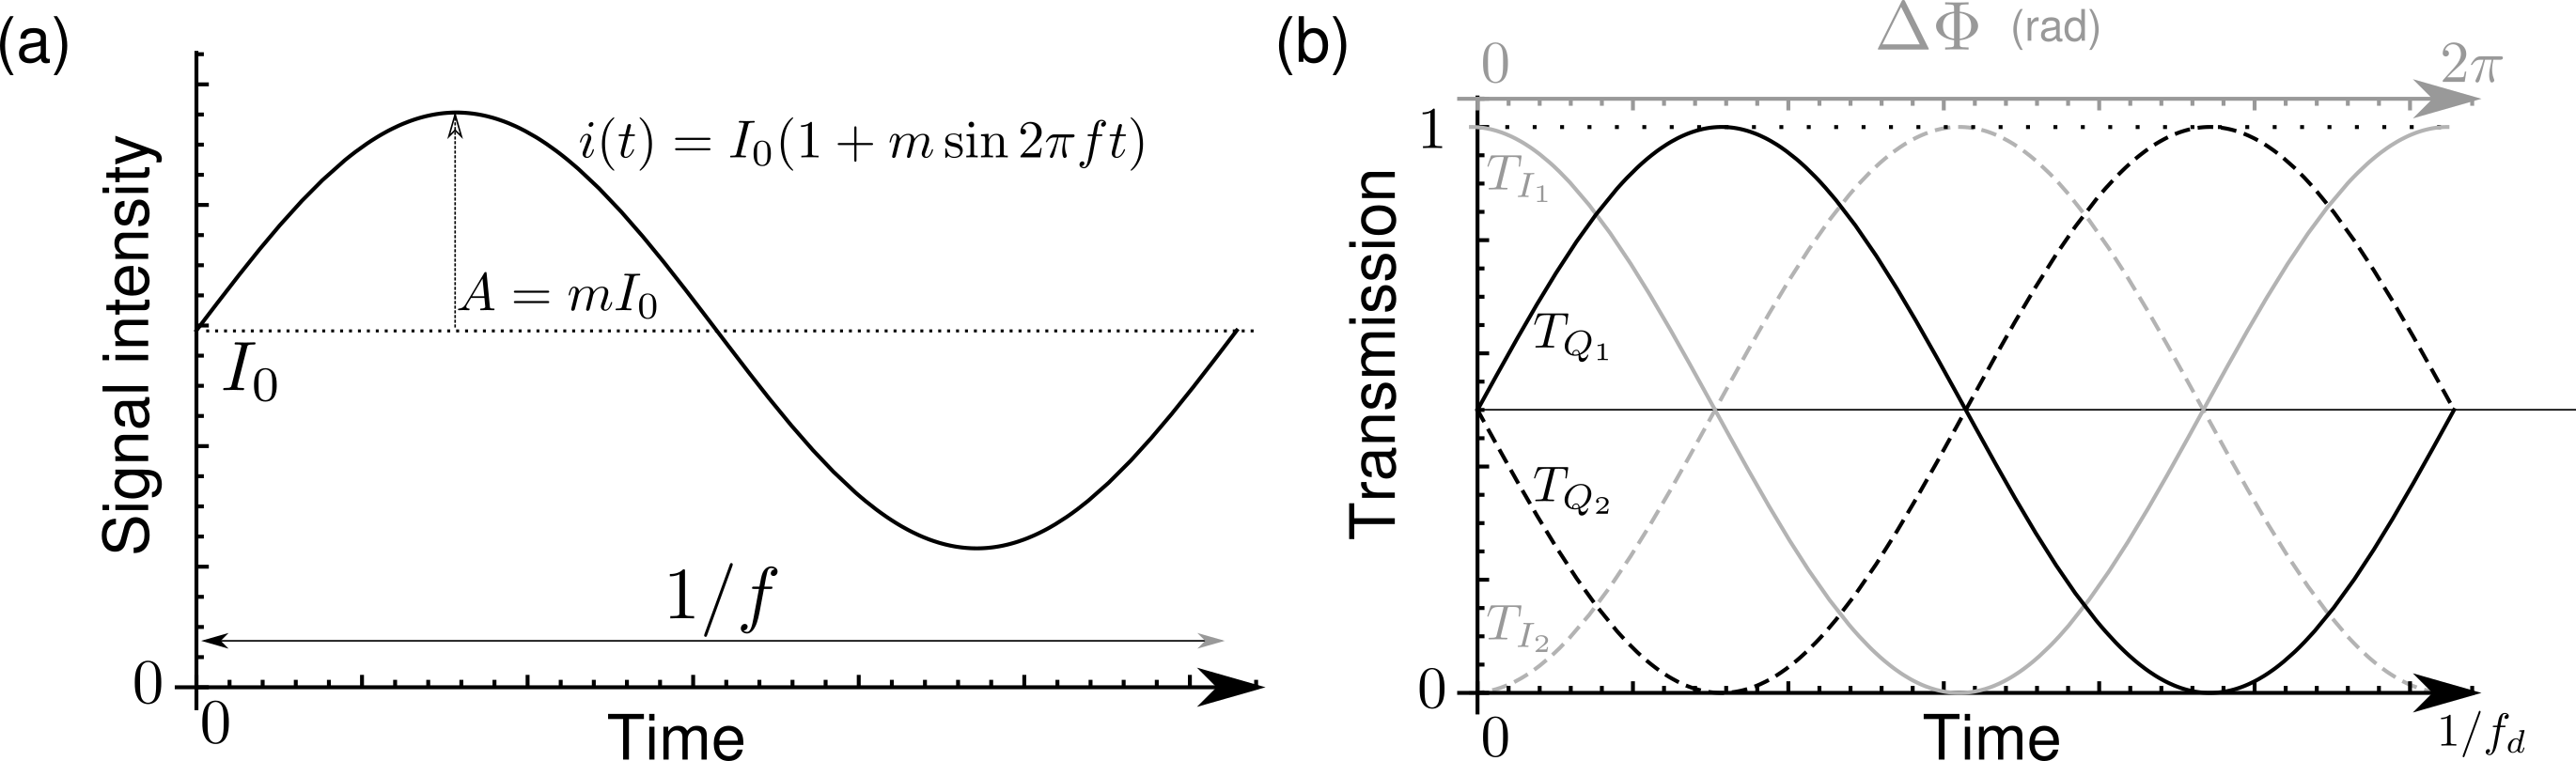
A classic electronic lock-in detector multiplies an incoming signal that is modulated at a frequency by a sinusoid at frequency generated by a local oscillator. The frequency and phase of this oscillator is tuned to obtain a coherent match with the weak incoming signal of interest. The product of the two is integrated over a length of time to average out all components except the one of interest. The phase matching step can be avoided when quadrature demodulation is performed, i.e, when the signal is demodulated by two local oscillators in quadrature (i.e., with a phase delay between each other) to obtain two demodulation channels ( and quadratures). Optically, the mathematical operation of multiplication of an incoming intensity-modulated light signal (or image) at a frequency with a local oscillator at can be achieved by passing the input light (or image) through an optical gate whose transmittivity is modulated sinusoidally at frequency . Contrary to electronics, optical quadrature lock-in detection requires 4 transmission gates () oscillating at , with phases separated by because the incoming light passes through optical transmission gates that non-zero transmittivity mean. This is shown schematically in Fig. 1 for transmissions (, , , , as represented in Fig. 1.b), these latter corresponding to four “quadratures” with respective phases , , and radians.
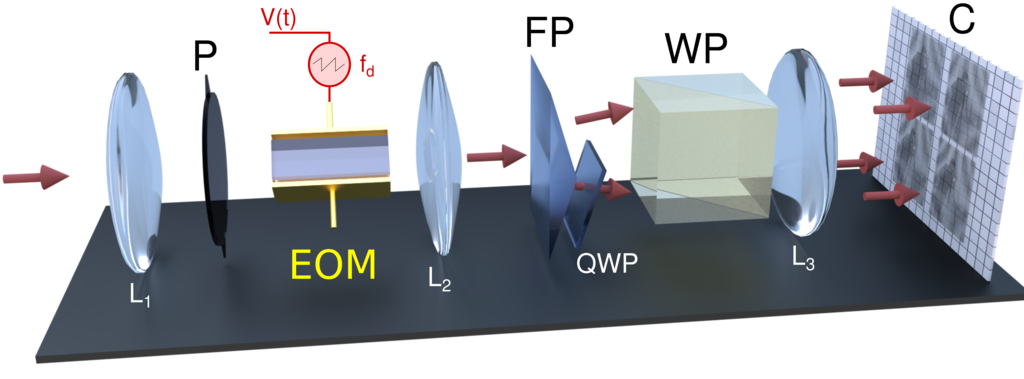
Such parallel and instantaneous demodulation is achieved by use of a suitably designed arrangement of birefringent elements at the input of a standard low frame-rate camera (CCD or CMOS). The specific optical architecture employed for this purpose is illustrated in Fig. 2. It comprises a polarizer (P), a quarter-wave plate (QWP) and splitting/polarizing prisms (FP, WP), and a single electro-optic (EO) crystal (e.g., Lithium Niobate (LiNbO3)) with eigenaxes oriented at from the input polarization axis imposed by the polarizer P. A periodic sawtooth electric field at frequency , with sufficient excursion to ensure perfect sinusoidal optical transmission, (i.e., allowing a radians excursion of the optical phase difference) is applied to the EO crystal. As a result, this architecture does not require any dephasing or splitting electronic circuit. The optical path difference arising in the QWP is advantageously converted into a phase delay between optical transmission curves and , whatever be the demodulation frequency , thereby offering huge tuning capabilities of the demodulation imaging setup. The integration stage employed in conventional electronic quadrature lock-in demodulation circuits is here simply and directly performed by acquiring a single frame on the standard camera (C) for a typical duration of several thousand modulation periods. The optical arrangement is so designed that it allows the four quadrature images (, , , ) to be simultaneously acquired on the camera (see Fig. 2).
Finally, at each pixel of the scene, the average (DC) intensity , as well as the amplitude and phase of the light component modulated at frequency can be retrieved from the four detected intensities, since
hence allowing instantaneous quadrature demodulation over the entire image from a single acquired frame.
II.2 Experimental demonstration
A prototype of a FAST-QUAD camera which implements the optical setup of Fig. 2 has been designed and built in order to validate and demonstrate the potentialities of the proposed full-field quadrature demodulation imaging approach. It includes a mm3 lithium niobate (LiNbO3) EO crystal and a low-frame rate high-dynamic range sCMOS camera (Andor NEO sCMOS, Mpixels, bits) and was able to be operated up to few hundreds of kHz so far, limited by the bandwidth of the high-voltage amplifier available in our laboratory. The technical considerations and design of the prototype are reported in Materials and methods. The data processing pipeline and calibration procedure developped to compensate for the mechanical and optical imperfections of this first prototype are given in Section 1 of Supplementary information.
The experimental validation reported below was performed with a green laser illumination ( nm), to limit the effect of the strong chromatic dispersion occuring in the optical components (especially EO crystal, prisms and QWP). A complete description of the imaging scenes considered in the remainder of this article is given in Section 2 of Supplementary information.
II.2.1 Proof-of-principle demonstration on an imaging scenario
Instantaenous full-field demodulation imaging using FAST-QUAD has first been validated on a simple imaging scenario where the source comprised a logo of the Institut Foton (see Fig. 3) that was homogeneously illuminated by light modulated at kHz.
The demodulation frequency on FAST-QUAD was first tuned to the exact modulation frequency by setting kHz, and the corresponding results are shown in the first row of Fig. 3. The average (DC) intensity map of the incoming signal is displayed on the left pannel, the amplitude map after demodulation in the central pannel and the phase map at the right. In this case, the modulation amplitude is well retrieved, with the amplitude map showing a good homogeneity throughout the FOV ( pixels), and an appreciable spatial resolution. As expected, the demodulated phase displayed in the right column leads to a fairly flat estimated phase map. The quality of the demodulated images demonstrates the efficiency of the calibration/processing algorithms developed to compensate for the imperfections of the optical setup.
The demodulation frequency was then slightly detuned by setting Hz, while maintaining the illumination intensity as illustrated in the left column of Fig. 3.b. In this case, the demodulated amplitude map in Fig. 3.b is almost dark, showing only a very low-contrast residual image of the logo. The phase map is of course not flat anymore, and would be expected to be irrelevant when the receiver is not tuned with the emitter’s frequency. The smooth estimated phase pattern observed here is due to a residual lack of correction of the phase mismatch across the isogyre pattern (see Materials and methods) that spreads across the raw images and which is corrected by calibration and post-processing. It was also checked that the demodulated amplitude was negligible when the scene was illuminated by unmodulated white light, as shown in Fig. 3.c, to simulate strong ambient illumination. These first results obtained at kHz hence demonstrate the ability of the FAST-QUAD to efficiently demodulate an image in a snapshot manner with a good image quality and resolution.
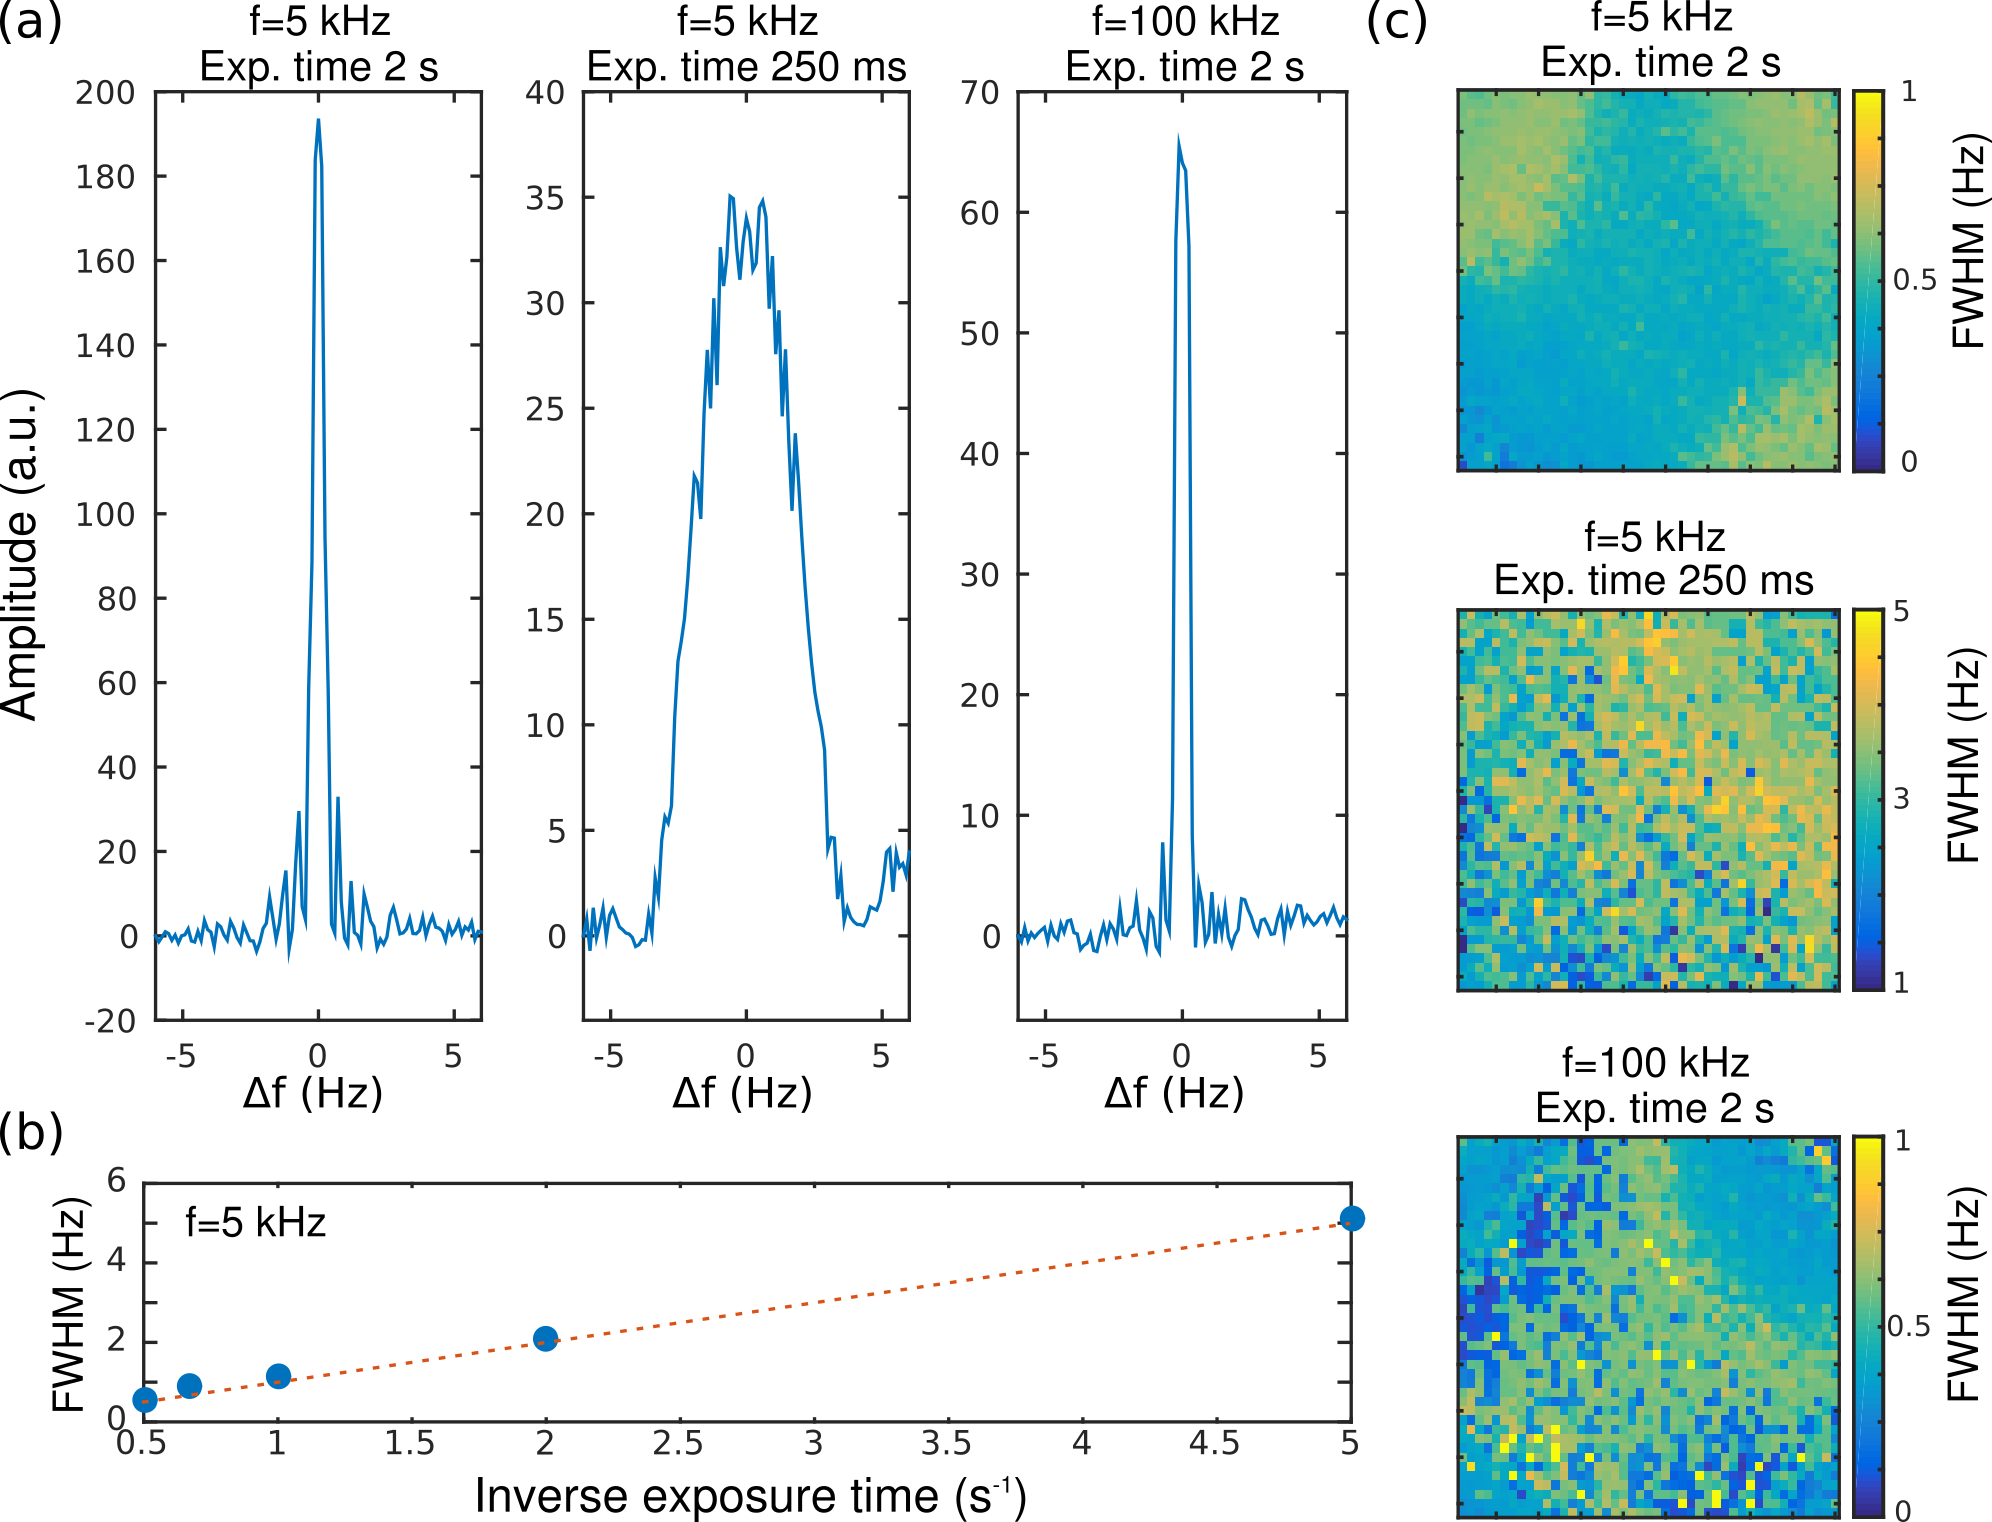
II.2.2 Evaluation of the frequency selectivity
The demodulation frequency of FAST-QUAD can be continuously and easily tuned. To explore the possibility of utilising this property to distinguish between images modulated at closely separated frequencies, we investigated the frequency selectivity of FAST-QUAD on a homogeneous scene. The average demodulated amplitude across the FOV was evaluated as a function of the frequency detuning . A demodulation bandwidth of Hz (FWHM) is obtained at kHz and kHz for a 2-s exposure time on the FAST-QUAD camera (Fig. 4.a); this increases to Hz (FWHM) when the exposure time is reduced to s. Similar to usual lock-in detection setups, the scaling of the selectivity with exposure time is an expected result which is confirmed by Fig. 4.b, where the FWHM of the demodulated amplitude is plotted as a function of the exposure time for kHz. Next, the uniformity of the frequency selectivity across the FOV of the camera is analyzed in Fig. 4.c, where the spatial evolution of the FWHM of the demodulated amplitude is displayed using an pixels binning. The selectivity of FAST-QUAD is found to be quite uniform across the FOV, although the homogeneity is degraded with this first prototype when the global demodulation efficiency decreases with higher modulation frequency or reduced exposure time.
III Discussion
The previous section has shown the real-time image demodulation of . We now illustrate two important potential applications of FAST-QUAD: the reduction of clutter and image encryption.
Frequency discrimination of several sources - the reduction of clutter:
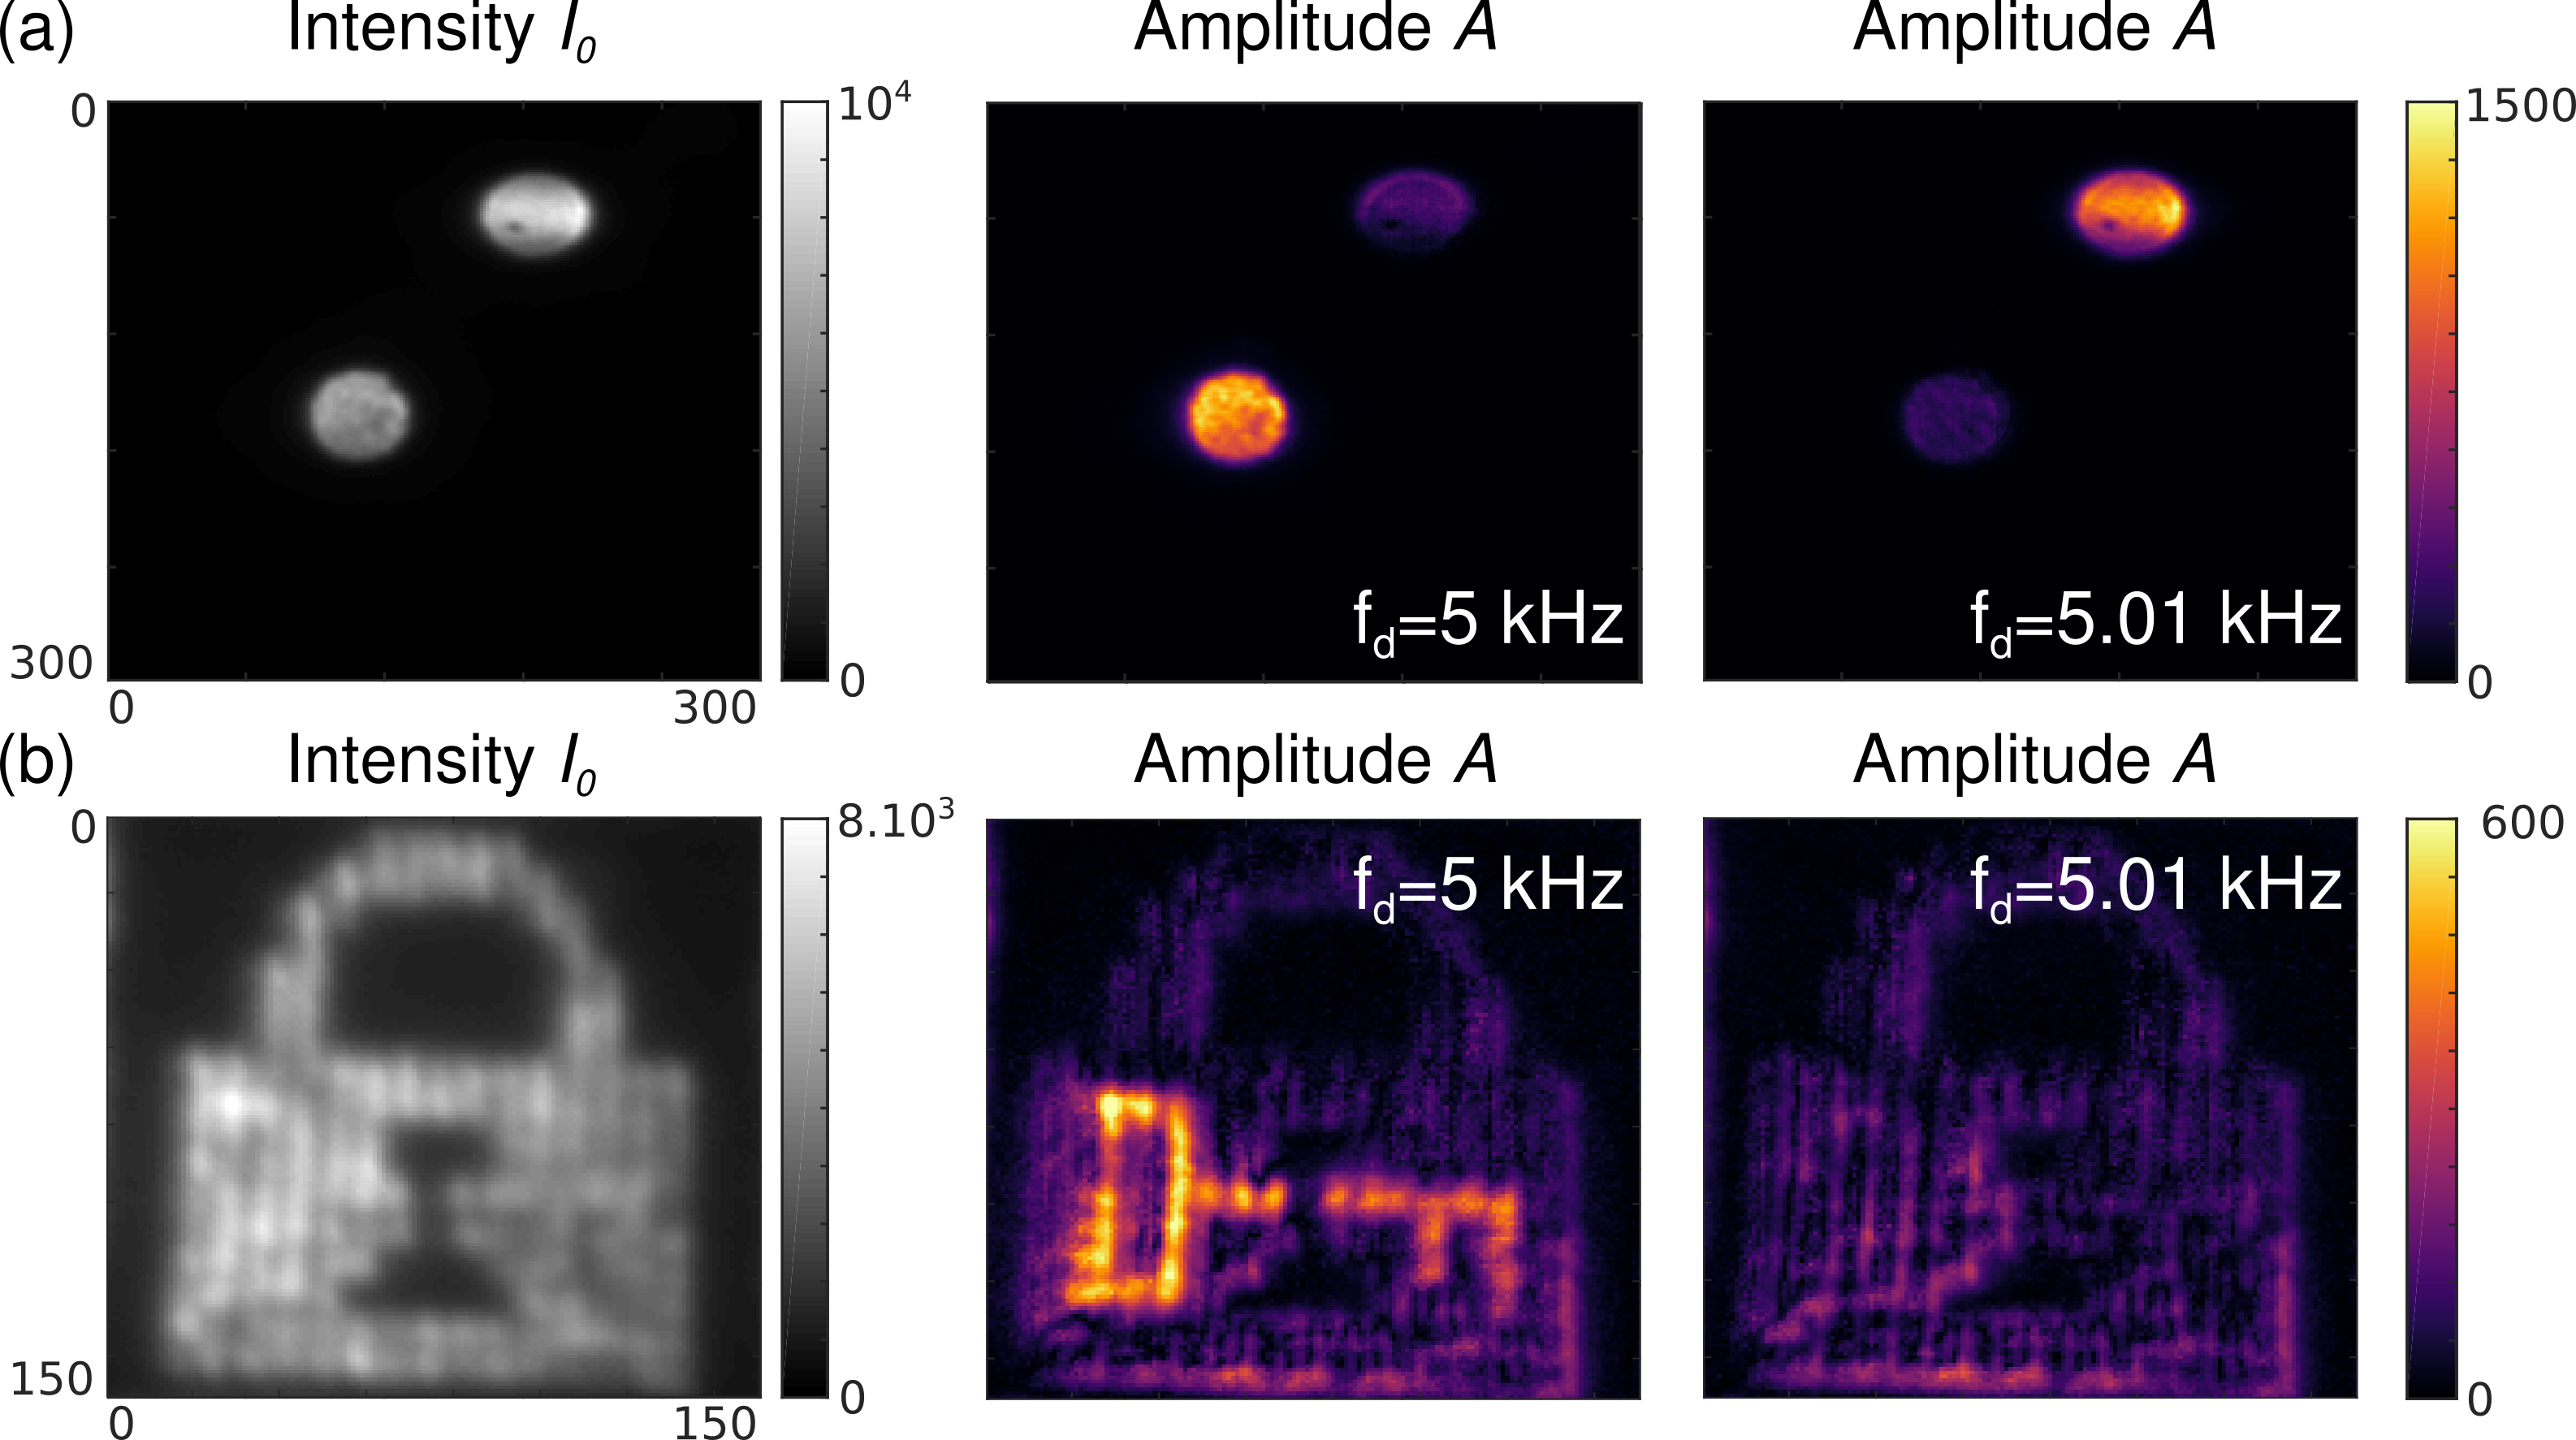
The imaging experiment presented in Fig. 6a, makes use of the continuous frequency discrimination capability of FAST-QUAD. Two objects (in our case, two disks) are illuminated by two independent intensity modulated sources with the same average intensity (see Fig. 5.a, left) but slightly different modulation frequencies ( kHz and kHz). Tuning the demodulation frequency to one or the other frequency immediately results in a snapshot ”filtered” image of the object modulated at that frequency in the amplitude map, demonstrating the frequency selectivity of FAST-QUAD (Fig. 5.a). Such discrimination capability opens up the possibility of using several sources at different modulation frequencies, permitting novel imaging applications like assigning distinct frequencies to different classes of emitters, e.g., vehicles, road signs, landing areas, etc., and viewing each class in a de-cluttered fashion, by demodulating at their specific modulation frequency. As it requires no synchronization between the source and the receiver, the technique can be employed in the presence of relative motion between the source and receiver. This could, for example, help de-clutter the view of a pilot as he approaches for landing, and could aid in road, rail and other forms of navigation.
Image encryption - Decoy image:
The second experiment, presented in Fig. 5.b, utilises the fact that FAST-QUAD provides frequency selectivity, and also requires no synchronization between the source and the receiver. It illustrates how a piece of secret information or an image (here, a picture of a key) could be embedded in decoy background (here, a picture of a lock) by the sender, and retrieved by the intended recipient equipped with FAST-QUAD, whereas it would go totally unnoticed by any other observer using a conventional camera. As the hidden object is intensity-modulated at high frequency (here, kHz) but with same average intensity as the unmodulated background, a conventional camera does not allow for its detection (see intensity map in Fig. 5.b (left)). On the other hand, a FAST-QUAD with the same exposure time makes it possible to detect the encrypted image efficiently (see amplitude maps in Fig. 5.b (center)), when is set to the frequency used by the sender, without need for phase synchronization. A mismatch in the frequencies fails to reveal the embedded image (Fig. 5.b (right)).
In conclusion, we have proposed and demonstrated a novel all-optical technique for instantaneous full-field demodulation of images from a single recorded frame of an ordinary digital camera. By means of illustrative examples, we demonstrate the potential of this approach which has numerous additional advantages like requiring no synchronization between source and observer, thereby permitting relative motion, continuous frequency tuning capability, compactness and portability. To the best of our knowledge, this proof-of-principle experiment is the first ever snapshot demodulation imaging in the DC to kHz frequency range, with the added capability of continuous frequency tuning.
These first encouraging results act as an incentive for achieving high-frequency snapshot quadrature demodulation imaging in the ’s MHz to ’s GHz range, which is no longer unrealistic. This would be a real breakthrough in the field of imaging in terms of applications, among which we can cite 3D imaging (potentially with range resolution below one millimeter), vibrometry, multiplexed free-space optical communications, automated vision, or spatially resolved lock-in detection at high-frequency. More importantly, this would also enable ballistic photons imaging through scattering media, with major applications in smart autonomous vehicles technologies and in biomedical diagnosis. Since the technique is based on the electro-optic effect (e.g., Pockel’s effect with typical response times on the picosecond scale bor13 ), the underlying concept of FAST-QUAD should remain valid even at those very high frequencies. Technological bottleneck to operation at high frequencies would primarily be the fast application of high voltage signals across the EO crystal. This calls for an optimized optical design to limit the size of the EO crystal used while ensuring good image quality and resolution. Another challenge will be the generation of high-frequency voltage ramps to allow for high-frequency operation. Lastly, conflicting requirements on the laser illumination linewidth imposed by good demodulation and speckle removal in the images will also be investigated in future developments.
Materials and methods
The sketch and photograph of the optical setup used in this first prototype of FAST-QUAD are given in Figs. 6.a and 6.b respectively. This prototype is based on the general design described in Fig. 2 of the main article, and as stated there, the central component of the prototype is an electro-optic (EO) crystal which introduces a controllable optical phase delay between two transverse components of the light beam propagated through it, when a voltage is applied across it. Assuming unpolarized incoming light with average intensity , and an ideal input polarizer (see Fig. 2 of the main article), the light entering the EO crystal has intensity and is vertically polarized, i.e., its Jones vector reads . The Jones matrix of the EO crystal whose eigenaxes are oriented at from the input polarization reads
whereas the action of an ideal Wollaston prism (oriented along the input polarizer ) can be modeled with the following Jones matrices of a vertical and an horizontal polarizer:
An ideal Fresnel bi-prism simply entails a splitting of the light intensity in half, with no effect on the beam polarization. Lastly, the QWP with its eigen-axes oriented at from the input polarization direction, has a Jones matrix equal to . As a result, classical Jones calculus following the path of the beams across the optical setup described in Fig. 6.a leads to theoretical intensity transmission functions for the four quadrature channels:
and for the ”Q”-quadratures:
which, on varying V, provide the transmission curves described in Fig. 1 of the main article, thereby allowing spatially multiplexed lock-in product demodulation of the four quadratures.
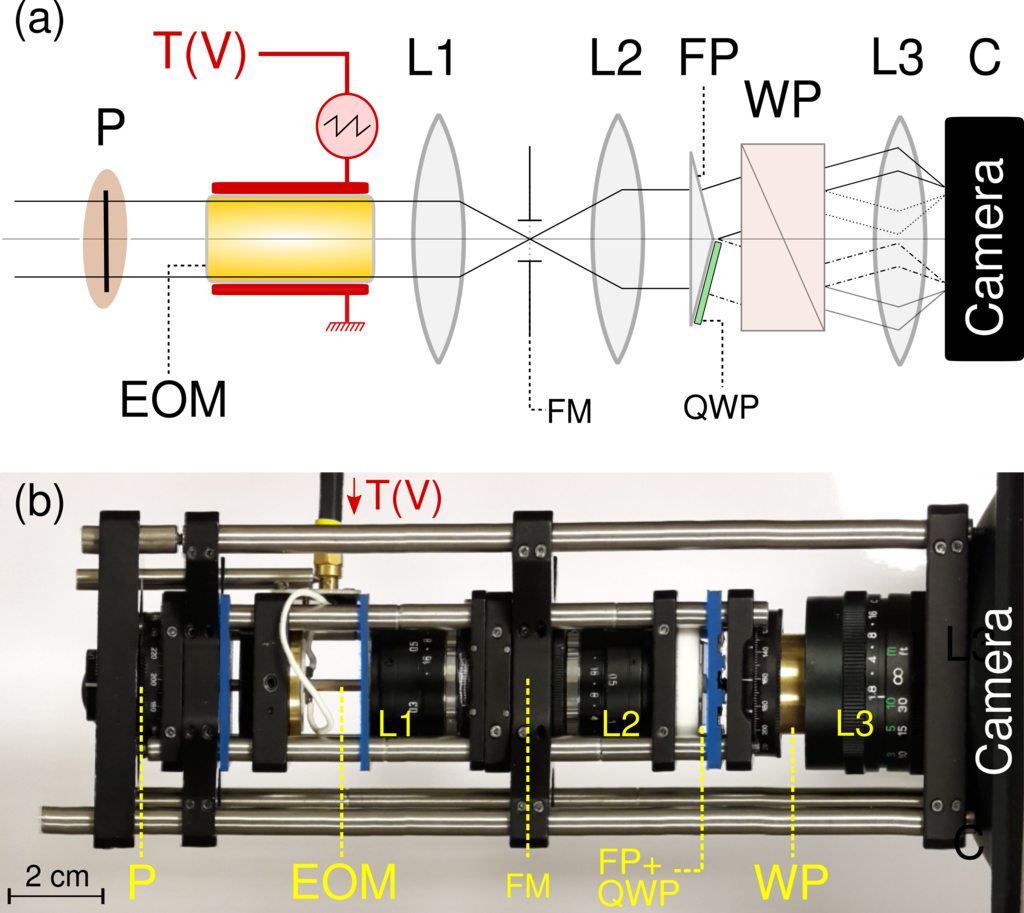
To attain an optical phase delay modulated at the demodulation frequency such that , i.e., the voltage applied across the EO crystal must be linearly modulated along a sawtooth waveform with sufficient amplitude . The well-known theory of EO crystals provides the relationship between and the optical phase difference. For instance, in the case of lithium niobate as used in this prototype, one has yar83 , where pm.V-1 and pm.V-1 correspond to (Pockel’s) electro-optic coefficients of LiNbO3 (approximate values in the visible range) weis85 . The ordinary, respectively extraordinary, optical refractive indices of LiNbO3 are and at nm weis85 . To limit the voltage amplitude to reasonable values (i.e., within the V range), we selected a LiNbO3 EO crystal (Moltec GmbH) of length mm and with a mm2 aperture section ( mm). A high-voltage sawtooth waveform (with peak-to-peak amplitude of V calibrated to provide exact maximum optical phase difference excursion ) has been applied on the electrodes of the EO crystal using a signal generator (Tektronix AFG3252C) and a high-voltage amplifier (New Focus 3211 High Voltage Amplifier, V, MHz bandwidth).
Due to the importance of the ratio of the length and thickness/breadth of the crystal, the best option in terms of FOV and resolution consisted of placing the EO crystal just after the input polarizer (Thorlabs, LPVISB050), before the image was focused by lens in an intermediate image plane where a field mask has been inserted to restrict the spatial extent of the image so that the 4 sub-images do not overlap at the camera (See Fig. 6). The light is re-collimated through objective lens and split with a Fresnel bi-prism (NewLight photonics, apex angle) and a Wollaston prism (Melles Griot, mm, splitting angle). Lenses , are two mm focal length, camera objective lenses, whereas is a mm, camera objective lens. As can be seen from Figs. 6.a and 6.b, the optical add-on offers relative compactness and ruggedness, which qualities could be further improved in future developments with an optimized optical and mechanical design.
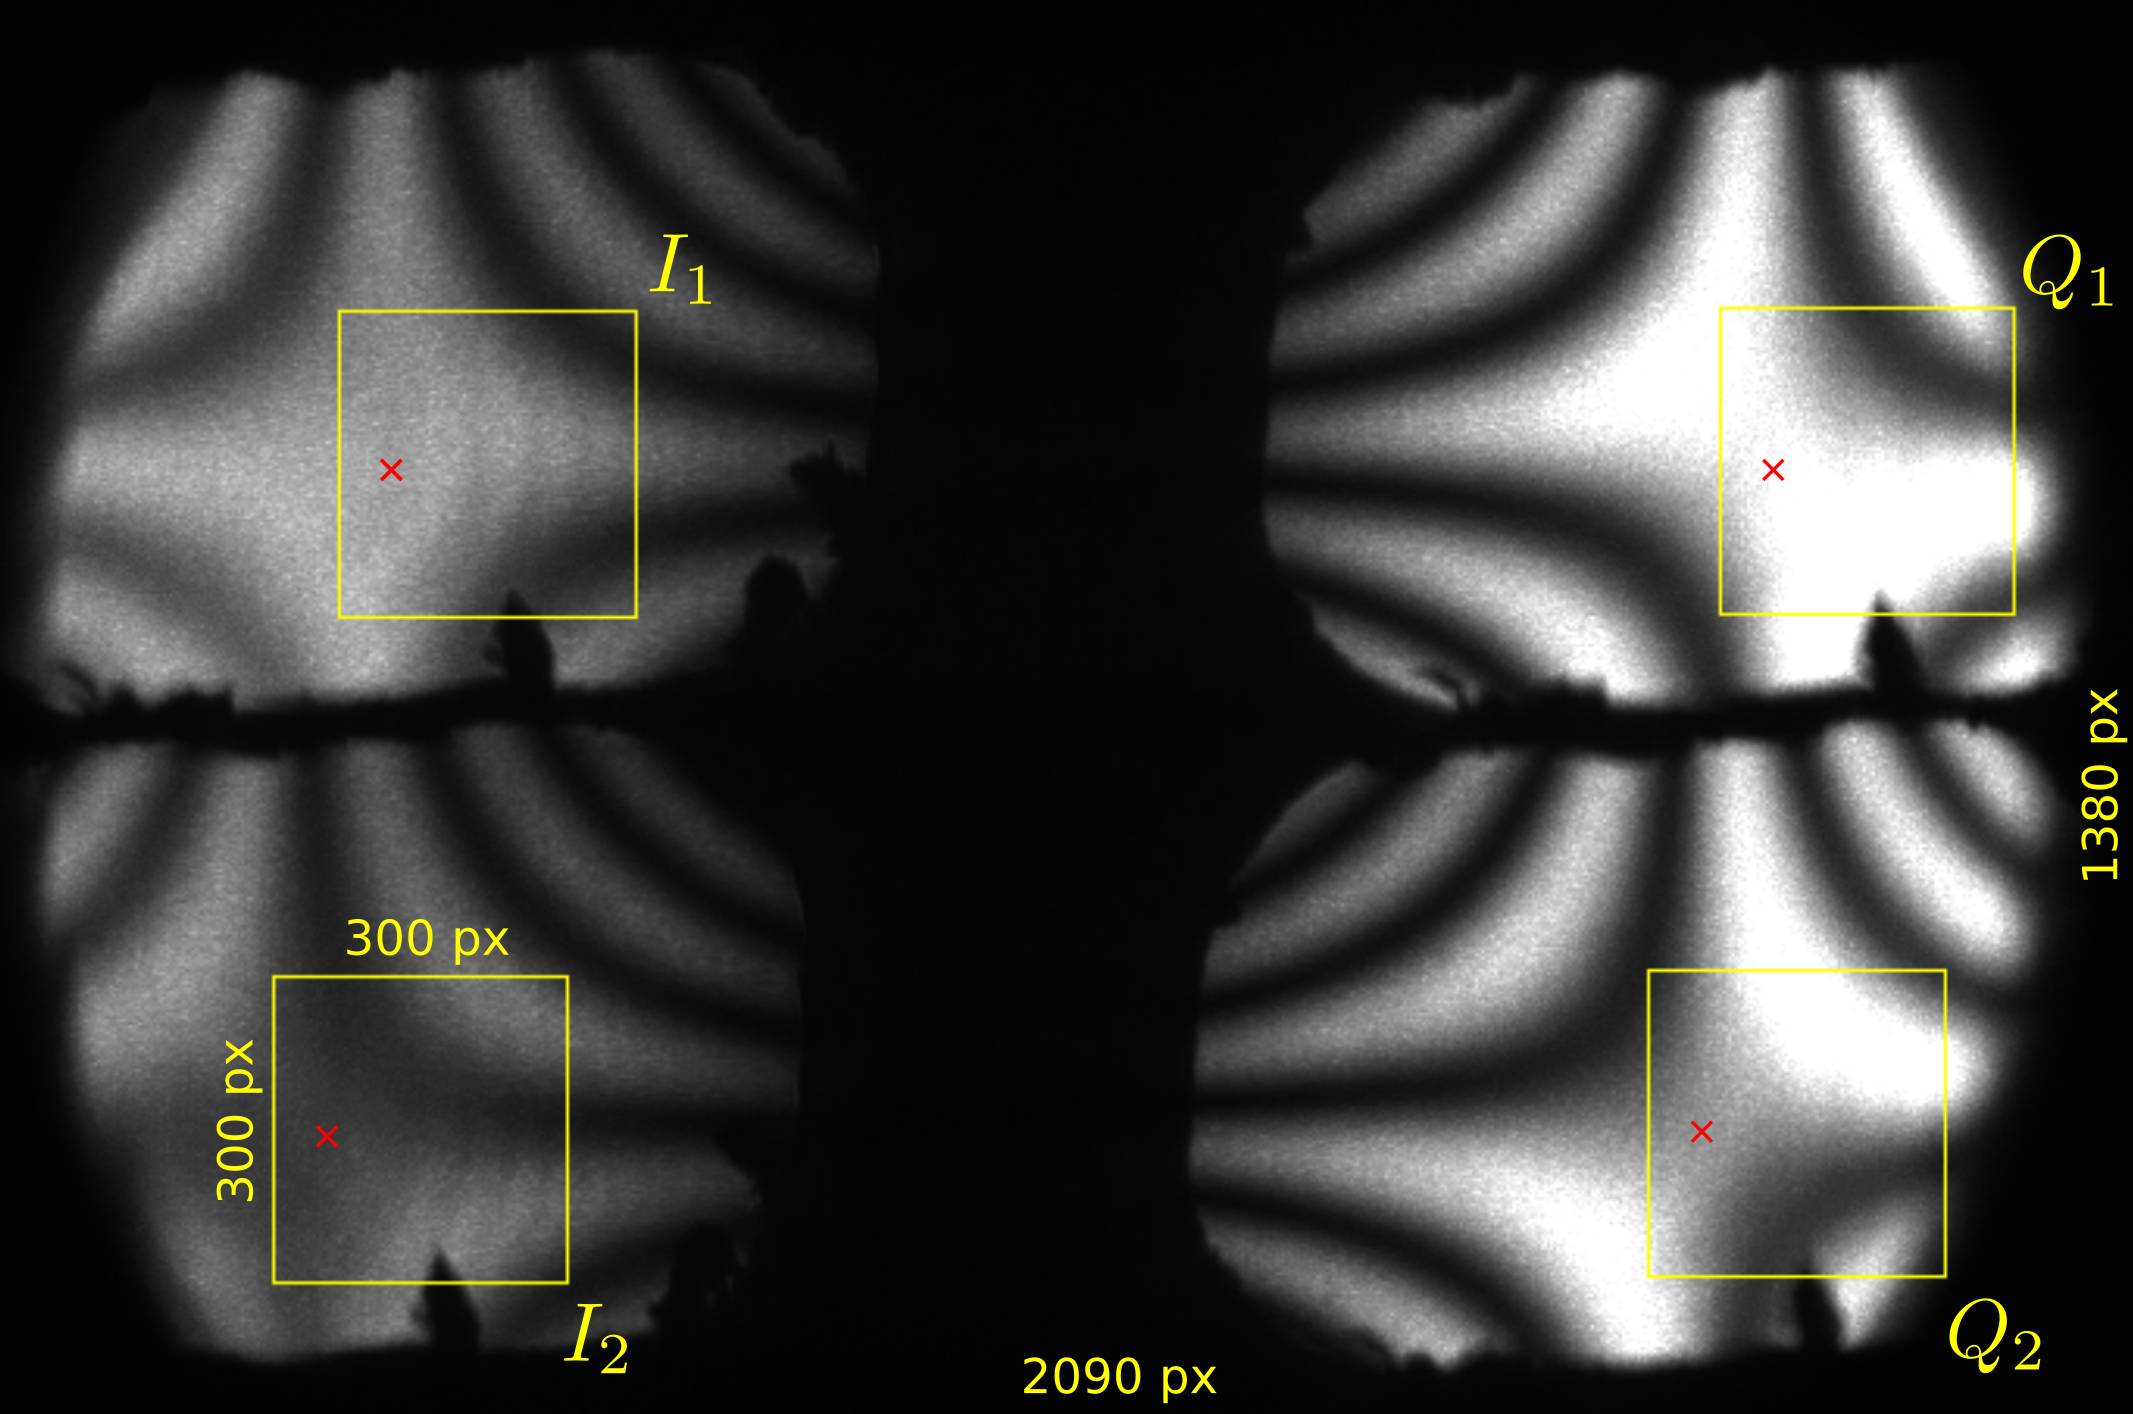
A narrow bandwidth optical illumination was used with this setup (green laser illumination at nm) to limit the detrimental effect on the image quality of the important chromatic dispersion occuring in optical components (especially EO crystal, prisms and QWP). As a consequence, the raw images acquired on the camera are spatially modulated across the field-of-view (FOV) with an interference pattern known as “isogyre”, where the fringes correspond to light paths in the crystal of equal optical phase delays (birefringence) bor13 . Such a pattern is clearly visible on the raw acquisition image example provided in Fig. 7, but pixel-wise, the four interference patterns obtained on the camera were found to be advantageously in quadrature. As a result, homogeneous demodulated images were efficiently retrieved by implementing proper calibration and processing of frames, as reported in Section 1 of Supplementary information.
Acknowledgements
The authors would like to thank L. Frein, S. Bouhier, C. Hamel and A. Carré for their technical help with the experiments. The authors thank the Indo-French Center for Promotion of Advanced Research (IFCPAR/CEFIPRA), New Delhi, for funding S. Panigrahi’s PhD and for supporting this research (RITFOLD project N∘ 4606).
FAST-QUAD - A full-field, all-optical, single-shot technique for quadrature demodulation of images at high frequency: supplementary information
Swapnesh Panigrahi,1 Julien Fade,1,∗ Romain Agaisse,1 Hema Ramachandran,2 and Mehdi Alouini1
1Univ Rennes, CNRS, Institut FOTON - UMR 6082, F-35000 Rennes, France
2Raman Research Institute, Sadashiv Nagar, Bangalore, 560080, India
∗Electronic address: julien.fade@univ-rennes1.fr
(Dated: )
I Calibration procedure and processing of the frames
I.1 General description of the calibration procedure and processing pipeline
Optimal operation of the FAST-QUAD camera required several calibration and processing steps to compensate for the mechanical and optical imperfections of this first prototype. The flowchart of the data processing involved to provide intensity, demodulated amplitude and phase maps from the raw image acquired is sketched in Fig. 1. Each processing step is based on calibration data obtained from preliminary experiments. Processing and calibration steps are briefly described here. Since FAST-QUAD relies on the snapshot acquisition of the four quadrature images on a single image sensor, a careful registration of these four sub-images is mandatory to provide final images with adequate resolution and to avoid estimation errors in the amplitude and phase maps. A calibration pattern is imaged with FAST-QUAD, allowing a first rough pixel-to-pixel registration to be performed, leading to the four ROIs depicted in Fig. 7 of the main article. However due to the optical aberrations that differ from one image channel to the other, it was necessary to implement a more precise image registration, involving: (a) estimation of the deformation maps during the calibration step on an appropriate calibration pattern (regular dotted grid); and (b) image interpolation of the , , images, so as to match the reference image . Full details on the calibration and interpolation procedures implemented are not reported here for the sake of conciseness, as they are strictly similar to the ones described in Ref. fad14 , developed during prior work in the context of a two-channel polarimetric camera.
Mainly due to imperfect mechanical alignment of the optical components (polarizer, EO crystal, QWP, Wollaston prism), and to unbalanced optical throughput in the beam-splitting components (Fresnel biprism and Wollaston prism), the four sub-images retrieved from the raw data acquired on the image sensor may have differences in average intensity at each pixel, even in the case of perfect image registration. Such intensity mismatch is easily compensated for by applying appropriate correction maps on each of the four quadrature images, after which step the average intensity image can be directly estimated from the four quadrature images by . The quadratures and (respectively, and ) have been checked to be in perfect opposite phase ( radians phase shift) and to have balanced optical throughput. As a result, two quadrature signals and are obtained by simple numerical subtraction. However, due to residual optical misalignments and experimental imperfections, the two signals retrieved appeared not to be perfectly in quadrature, which led us to implement a quadrature mismatch calibration/correction algorithm inspired from RADAR signal processing chu81 ; noo99 (The details of this quadrature mismatch calibration/correction algorithm is reported in Section 2 of Supplement 1).
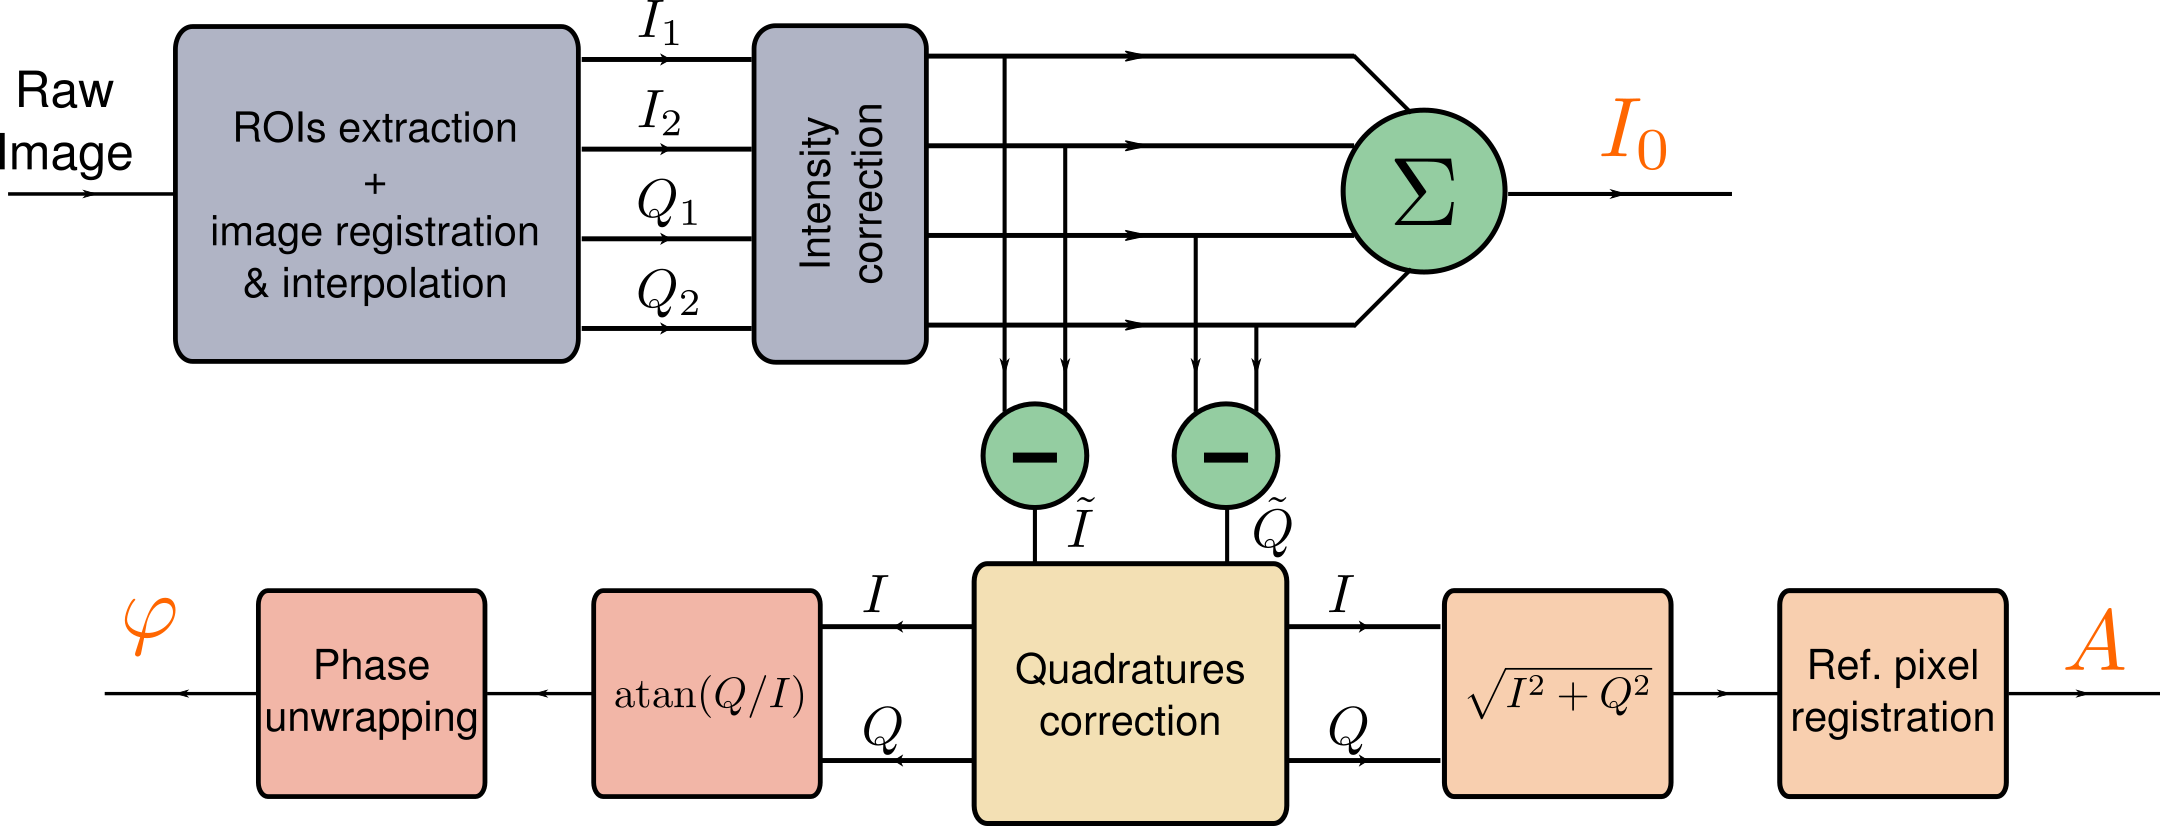
As sketched in Fig. 1, the corrected quadrature signals and eventually allow the amplitude map to be obtained after a final correction step, which is required to compensate for the possible spatial inhomogeneity of the demodulation efficiency across the FOV. Similarly, the estimated phase map is retrieved from the and signals, after a phase “unwrapping” step to compensate for the inhomogeneous phase distribution imprinted by the isogyre pattern. The inhomogeneity map and the phase “unwrapping” pattern are also calibrated from initial measurements on a homogeneous scene. The calibration procedure is not an easy task. Nevertheless, it has in principle to be performed once for a given imager.
I.2 Quadrature mismatch calibration and the imaging algorithm
Due to experimental imperfections, the raw quadrature images obtained from subtraction of two image channels, respectively and , have small deviation from being in quadrature phase. Moreover, a residual amplitude mismatch was also observed between the two raw quadrature images and . Such differences are clearly visible on the raw quadrature data displayed in Fig. 2.a below, where the temporal evolution of the quadrature signals and are plotted as a function of time for a reference pixel (denoted with symbol in Fig. 4 of the main article), while applying a slowly varying ( Hz) voltage ramp on the EO crystal (with exposure time ms, sampling period ms on an homogeneous scene).
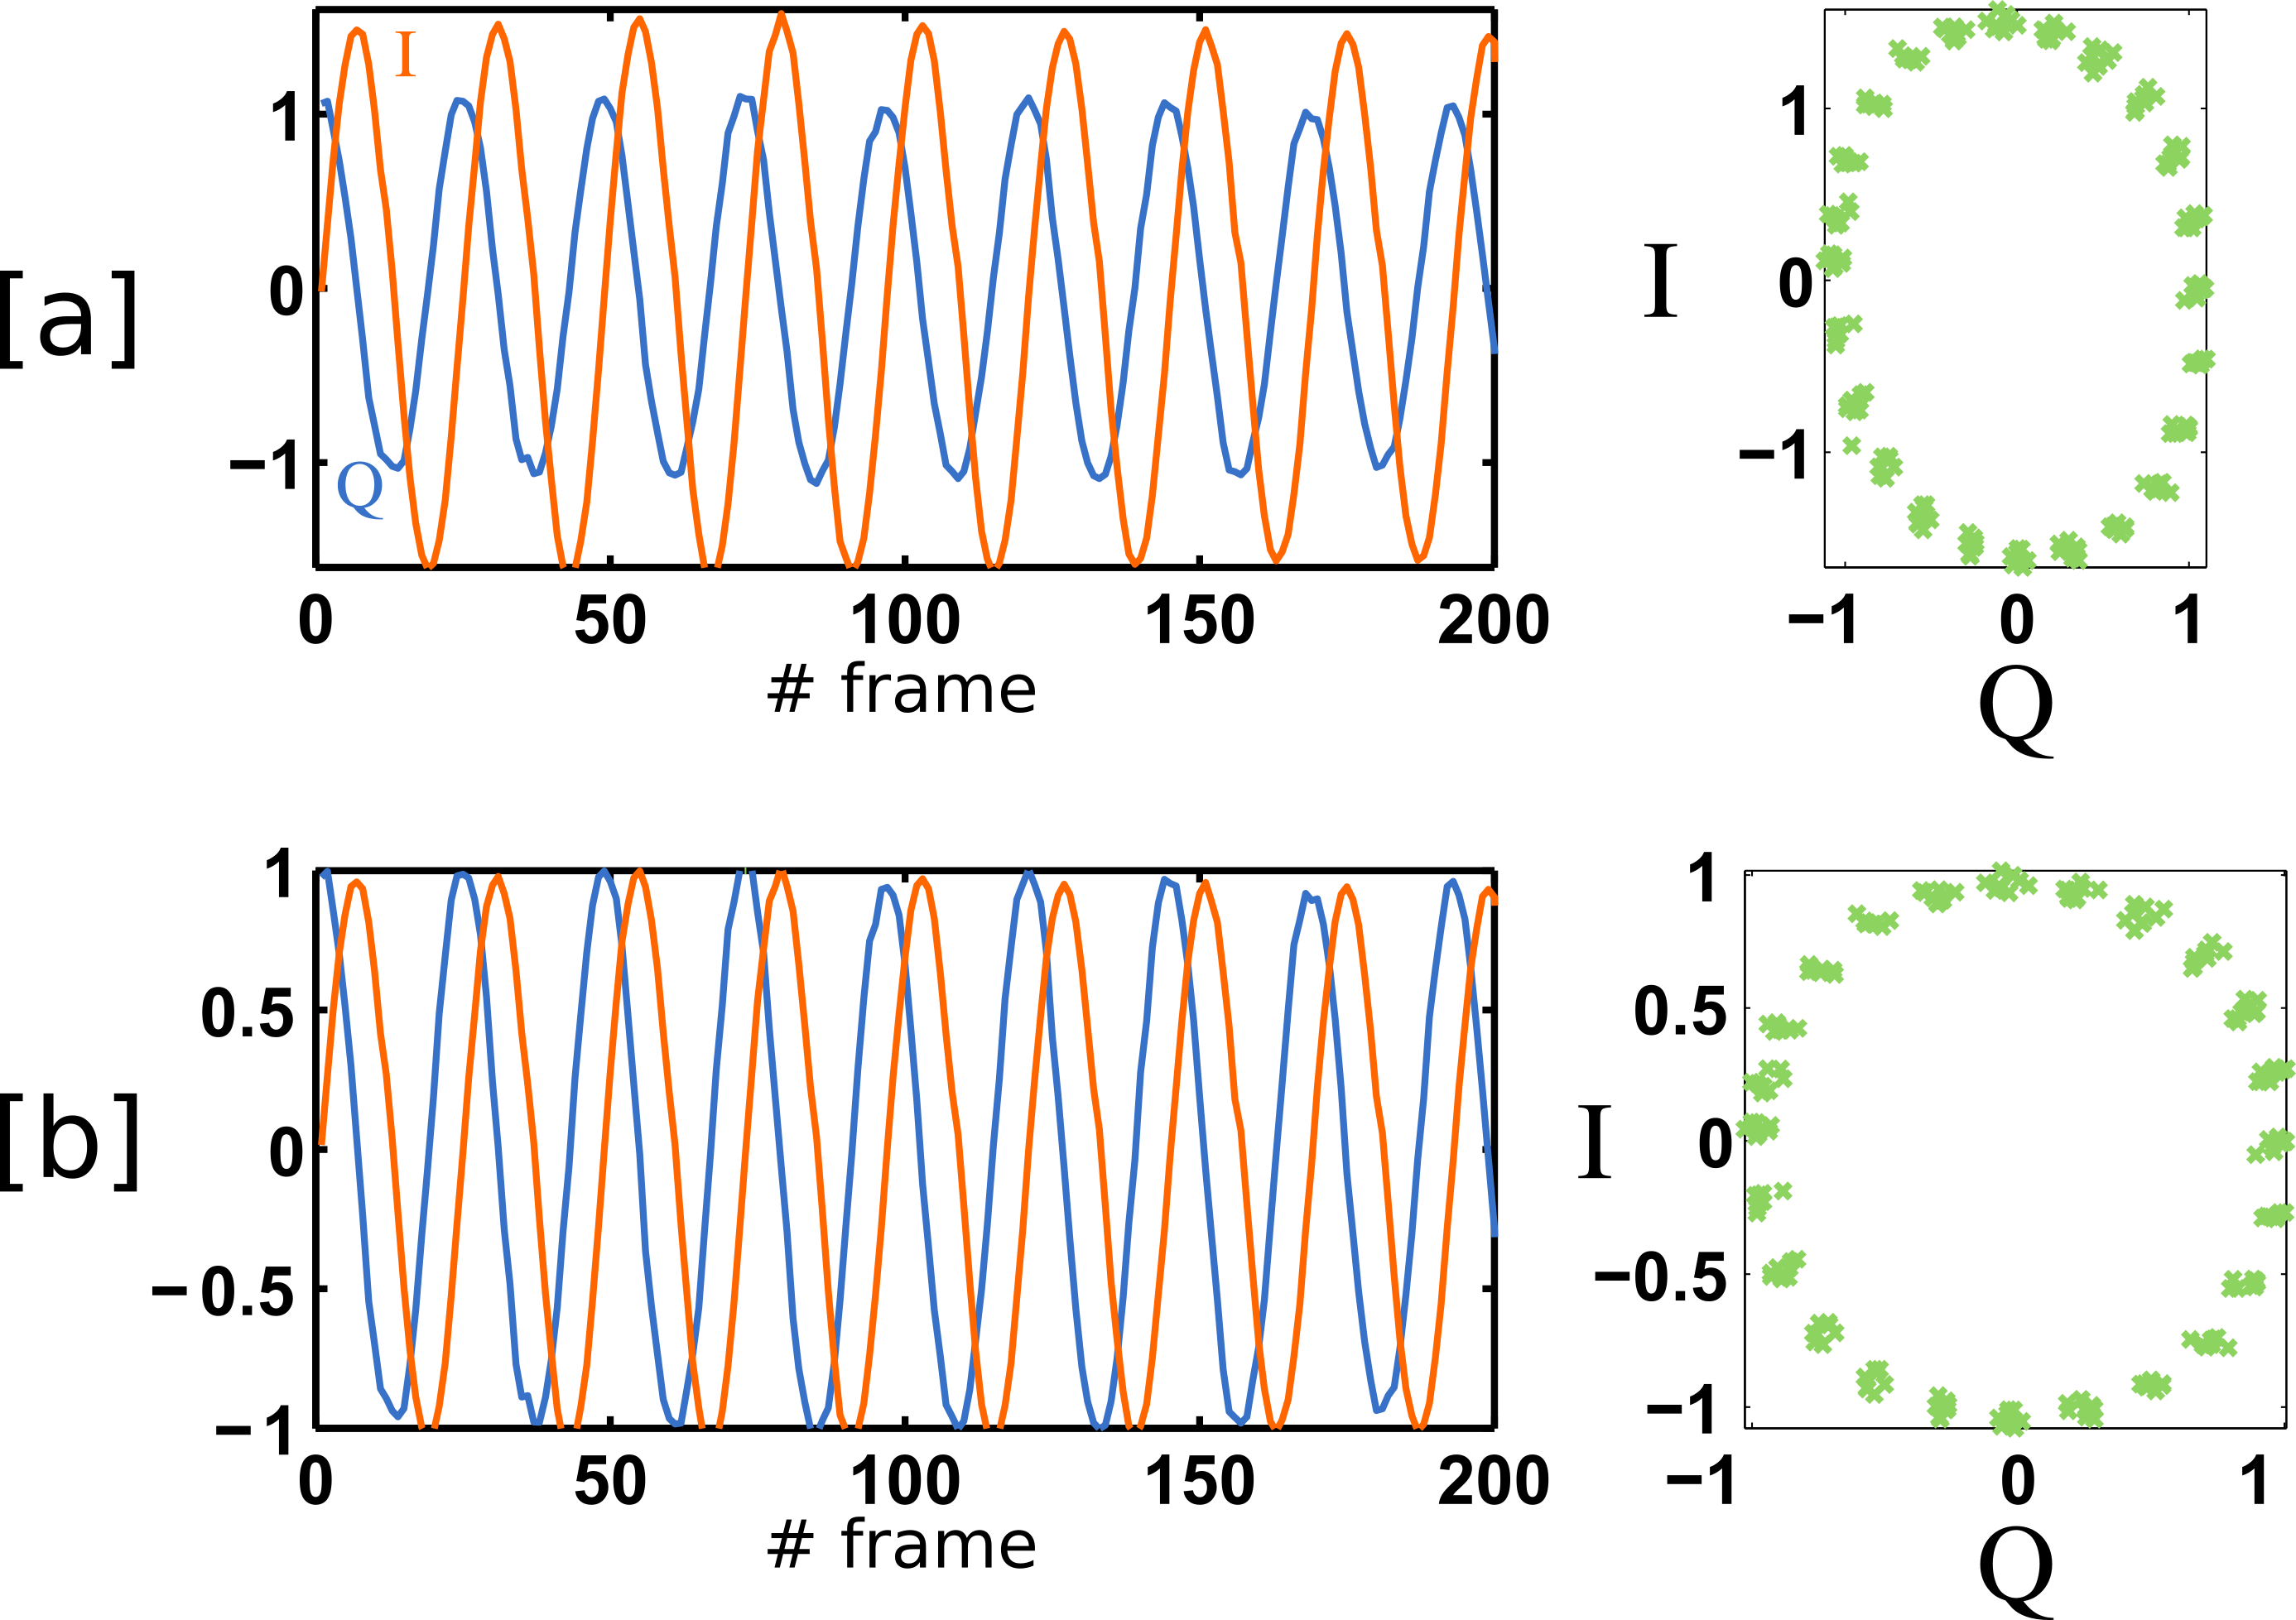
The experimental data in this case can be modeled by writing the two quadrature transmission functions at each pixel of the FOV as
| (1) |
where accounts for the amplitude mismatch between the two quadratures at pixel , whereas stands for phase deviation from perfect quadrature between and . It can be noted that a pixel-dependent common phase factor has been included in the above equation, which models the inhomogeneous phase distribution across the FOV, due to the isogyre pattern. As mentioned in Section 4 of the main article, this phase distribution is compensated in the last step of the frames processing during the phase “unwrapping” step to provide a correct estimated phase map. As a result, for the sake of clarity in the following description of the quadrature mismatch calibration and correction procedure, we will set without loss of generality.
The objective of the quadrature mismatch calibration described below is to estimate the amplitude mismatch map , as well as the phase quadrature mismatch across the FOV, i.e., at each pixel . Several calibration methods exist for correcting the intensity and phase of a quadrature demodulator, especially for their application in RADARs chu81 ; noo99 . We estimated the and maps from calibration, using a time-series image acquisition of raw frames, such as the one presented here in Fig. 2.a for the reference pixel marked with a red cross symbol in Fig. 4 of the main article. The images temporally sample the amplitude response of the two quadrature images and over approximately periods, with a spatially homogeneous constant (unmodulated) illumination on the FAST-QUAD prototype, while the voltage applied on the EO crystal was slowly varied ( Hz). Indeed, at a given pixel of the image, the transmission can be written as a matrix
| (2) |
whose covariance matrix yields
| (3) |
showing that and can be easily estimated from the calibration data. It can be noted that in the ideal case, the covariance matrix should be equal to the identity matrix, denoting perfect amplitude balancing and exact quadrature phase.
Thus, one can estimate a scaling and a rotation matrix at each pixel that can be applied to the observed data to balance the amplitudes and obtain perfect quadrature signals. To calibrate these correction matrices at each pixel, we follow a well-known method based on singular values decomposition (SVD) and similar to noo99 . Briefly, the SVD of matrix is computed as , and one can easily extract the real unitary matrix , as well as the two first singular values stored in the diagonal matrix (which is the sub-matrix of the matrix ). As shown in noo99 , it suffices to apply a correction matrix to the observed quadrature data to obtain corrected data . The efficiency of this correction algorithm can be checked in Fig. 2.b where the corrected quadratures and are displayed, showing equalized amplitude and perfect quadrature phase.
II Description of the scenes being imaged
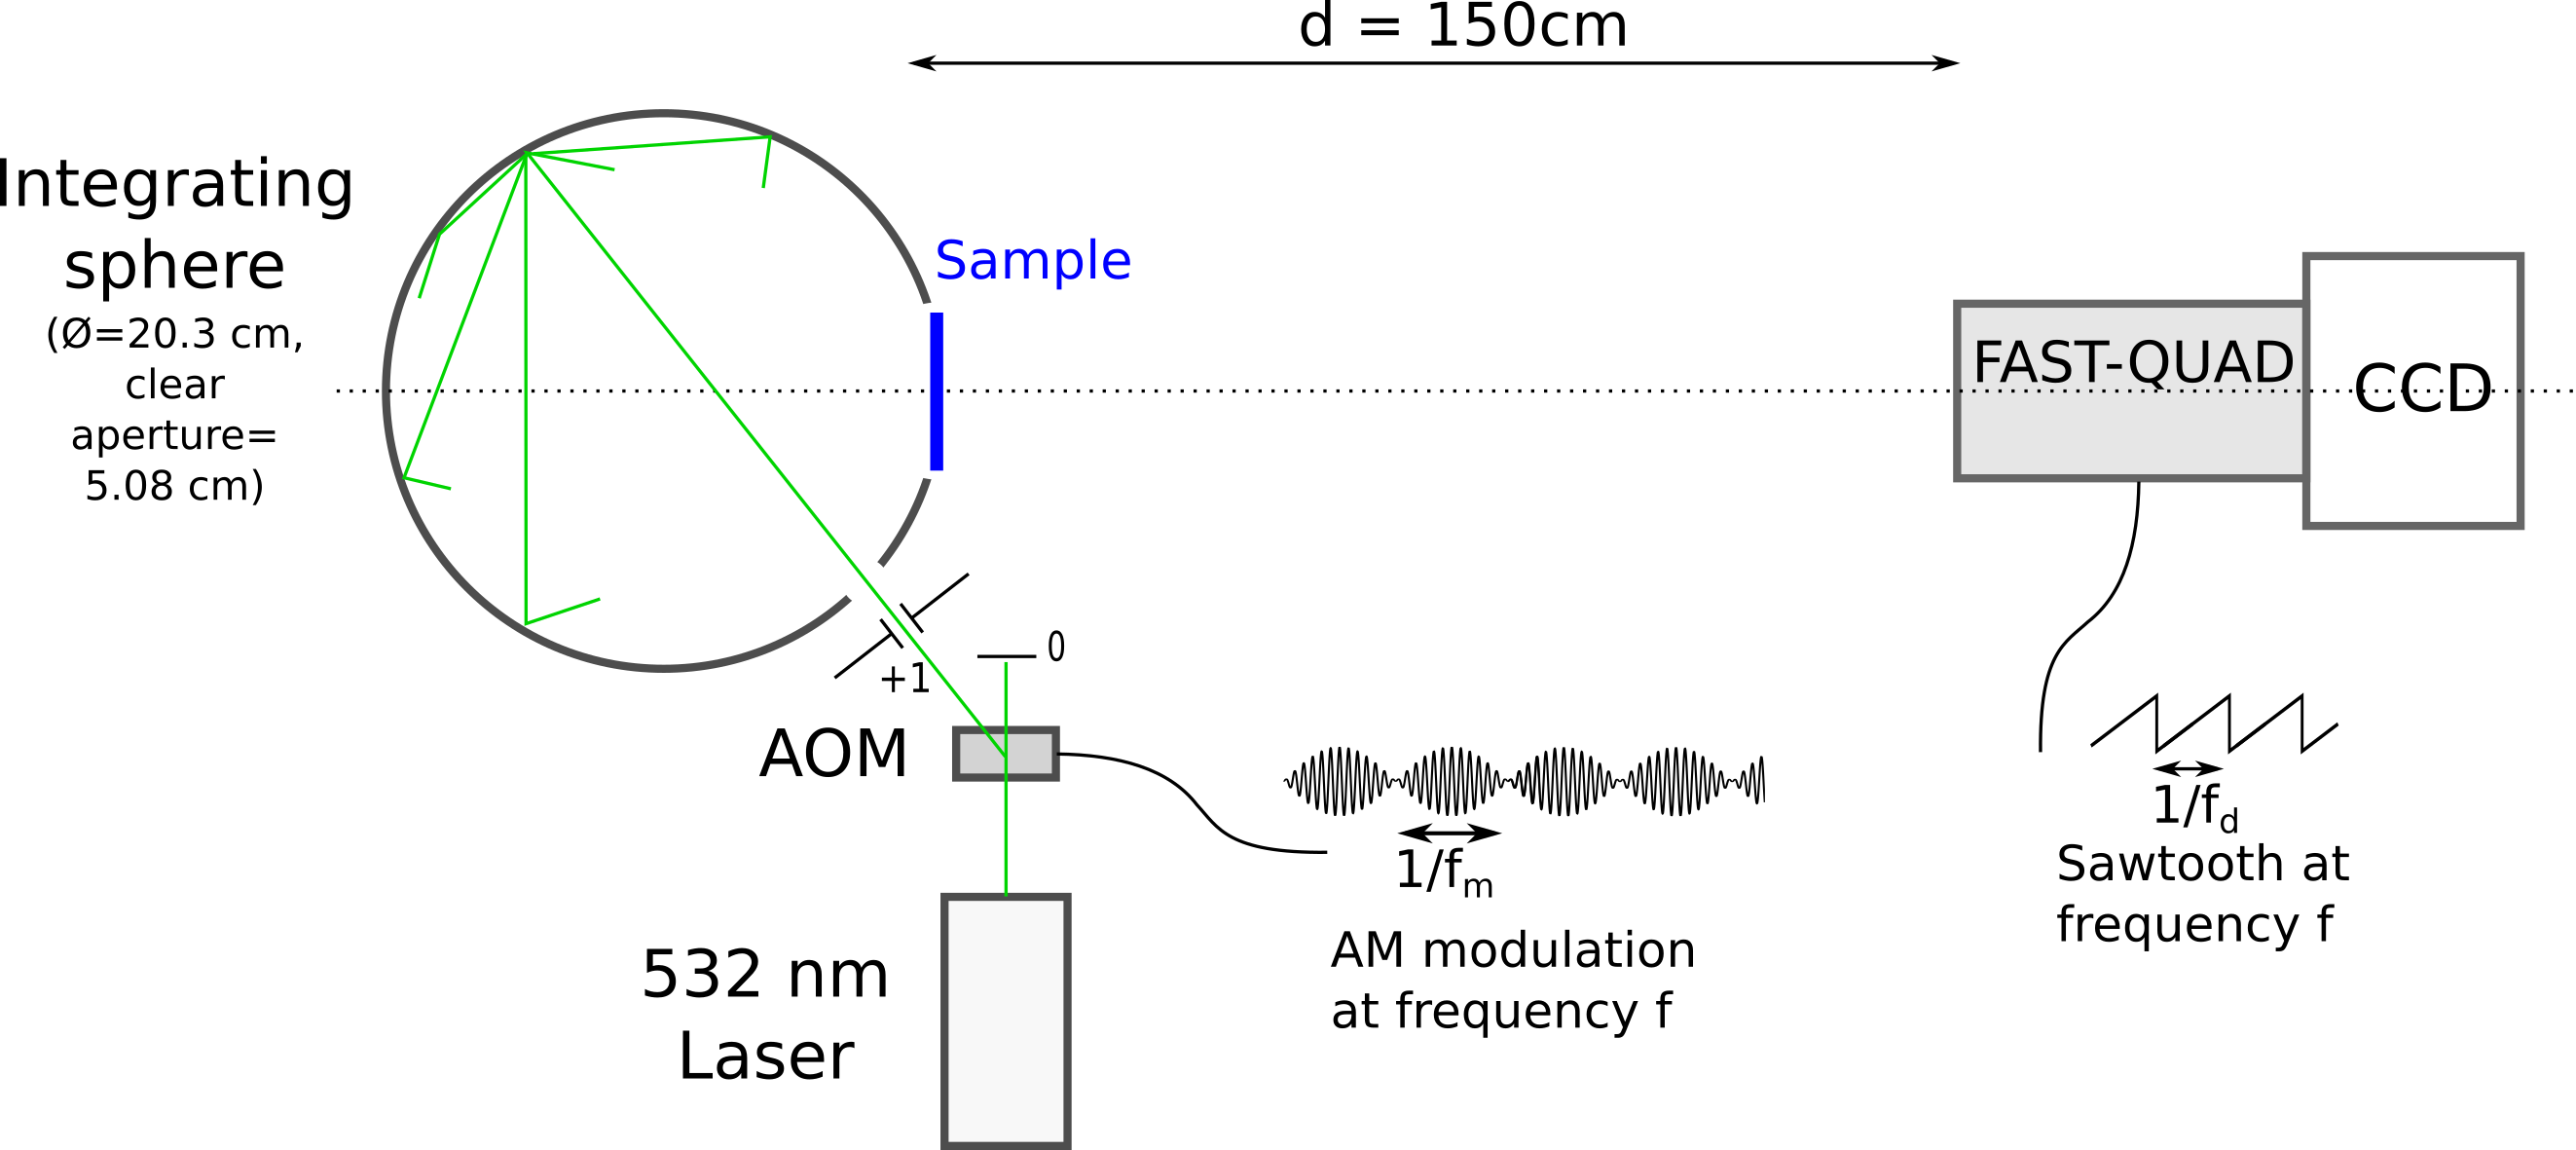
The scenes that were being imaged were illuminated with a nm (Coherent Verdi) green laser. Acousto-optic modulators (AOM) (AA Opto-Electronic, MT80-A1-VIS) were used to obtain intensity-modulated beams. Indeed, by supplying the AOMs with RF signals whose amplitude was modulated at frequency , the light diffracted in the first diffraction order shows an intensity modulation at frequency with modulation index %. A sketch of the illumination setup is given in Fig. 3 below. To obtain an image of an homogeneously illuminated scene, the modulated beam was directed into an inches diameter integrating sphere (Labsphere CSTM-US-800C-100R) which created a uniform illumination field across its main circular aperture of cm diameter. Note that during the experiments the sphere was mechanically connected to an electrodynamic shaker (with frequency far from the demodulation frequency, typ. 100 Hz) which created small vibrations of the sphere, thereby limiting the detrimental effect of speckle on the acquired images. To produce the images displayed in Fig. 6 of the main article, a cm mask of the Institut Foton’s logo was printed on a transparency film and positioned in front of the aperture of the integrating sphere. For the last experiments presented in Fig. 8 of the main article, the two collimated laser spots (modulated at distinct frequencies with two AOMs) directly illuminated a rotating white diffuser (paper) used in place of the integrating sphere to avoid speckle (Fig. 8.a). In Fig. 8.b, the collimated laser beams were used to illuminate white-dotted images of the lock (unmodulated) and key (modulation frequency 5 kHz), both printed on a transparency film. Two lenses were finally used to superimpose the final images of the lock and key on the rotating diffuser and create the scene of Fig. 8.b.
References
- (1) Roger Berg, Olof Jarlman, and Sune Svanberg. Medical transillumination imaging using short-pulse diode lasers. Applied optics, 32(4):574–579, 1993.
- (2) David Sedarsky, Edouard Berrocal, and Mark Linne. Quantitative image contrast enhancement in time-gated transillumination of scattering media. Optics express, 19(3):1866–1883, 2011.
- (3) Hema Ramachandran and Andal Narayanan. Two-dimensional imaging through turbid media using a continuous wave light source. Optics communications, 154(5):255–260, 1998.
- (4) Olivier Emile, Fabien Bretenaker, and Albert Le Floch. Rotating polarization imaging in turbid media. Optics letters, 21(20):1706–1708, 1996.
- (5) Julien Fade, Swapnesh Panigrahi, Anthony Carré, Ludovic Frein, Cyril Hamel, Fabien Bretenaker, Hema Ramachandran, and Mehdi Alouini. Long-range polarimetric imaging through fog. Applied optics, 53(18):3854–3865, 2014.
- (6) David J. Cuccia et al. Quantitation and mapping of tissue optical properties using modulated imaging. Journal of Biomedical Optics, 14:14 – 14 – 13, 2009.
- (7) Swapnesh Panigrahi, Julien Fade, Hema Ramachandran, and Mehdi Alouini. Theoretical optimal modulation frequencies for scattering parameter estimation and ballistic photon filtering in diffusing media. Optics express, 24(14):16066–16083, 2016.
- (8) Hyun Keol Kim, Uwe J. Netz, Jürgen Beuthan, and Andreas H. Hielscher. Optimal source-modulation frequencies for transport-theory-based optical tomography of small-tissue volumes. Optics express, 16(22):18082–18101, 2008.
- (9) David Nitzan, Alfred E. Brain, and Richard O. Duda. The measurement and use of registered reflectance and range data in scene analysis. Proceedings of the IEEE, 65(2):206–220, 1977.
- (10) Sriram Sudarsanam, James Mathew, Swapnesh Panigrahi, Julien Fade, Mehdi Alouini, and Hema Ramachandran. Real-time imaging through strongly scattering media: seeing through turbid media, instantly. Scientific reports, 6:25033, 2016.
- (11) L. Wang, P. P. Ho, C. Liu, G. Zhang, and R. R. Alfano. Ballistic 2-d imaging through scattering walls using an ultrafast optical kerr gate. Science, 253(5021):769–771, 1991.
- (12) Jacopo Bertolotti, Elbert G. van Putten, Christian Blum, Ad Lagendijk, Willem L. Vos, and Allard P. Mosk. Non-invasive imaging through opaque scattering layers. Nature, 491(7423):232, 2012.
- (13) Ori Katz, Pierre Heidmann, Mathias Fink, and Sylvain Gigan. Non-invasive single-shot imaging through scattering layers and around corners via speckle correlations. Nature photonics, 8(10):784, 2014.
- (14) Sungsam Kang, Seungwon Jeong, Wonjun Choi, Hakseok Ko, Taeseok D. Yang, Jang Ho Joo, Jae-Seung Lee, Yong-Sik Lim, Q-Han Park, and Wonshik Choi. Imaging deep within a scattering medium using collective accumulation of single-scattered waves. Nature photonics, 9(4):253, 2015.
- (15) Amaury Badon, Dayan Li, Geoffroy Lerosey, A. Claude Boccara, Mathias Fink, and Alexandre Aubry. Smart optical coherence tomography for ultra-deep imaging through highly scattering media. Science advances, 2(11):e1600370, 2016.
- (16) DA Benaron and DK Stevenson. Optical time-of-flight and absorbance imaging of biologic media. Science, 259(5100):1463–1466, 1993.
- (17) Bruce J. Tromberg, Olivier Coquoz, Joshua B. Fishkin, Tuan Pham, Eric R. Anderson, John Butler, Mitchell Cahn, Jeffrey D. Gross, Vasan Venugopalan, and David Pham. Non–invasive measurements of breast tissue optical properties using frequency–domain photon migration. Philosophical Transactions of the Royal Society of London B: Biological Sciences, 352(1354):661–668, 1997.
- (18) David A. Boas, Dana H. Brooks, Eric L. Miller, Charles A. Dimarzio, Misha Kilmer, Richard J. Gaudette, and Quan Zhang. Imaging the body with diffuse optical tomography. IEEE Signal Processing Magazine, 18(6):57–75, 2001.
- (19) H. Y. Ban, M. Schweiger, V. C. Kavuri, J. M. Cochran, L. Xie, D. R. Busch, J. Katrašnik, S. Pathak, S. H. Chung, K. Lee, et al. Heterodyne frequency-domain multispectral diffuse optical tomography of breast cancer in the parallel-plane transmission geometry. Medical physics, 43(7):4383–4395, 2016.
- (20) Renfu Lu. Light Scattering Technology for Food Property, Quality and Safety Assessment. CRC Press, 2016.
- (21) W. R. Watkins, D. H. Tofsted, V. G. CuQlock-Knopp, J. B. Jordan, and J. O. Merritt. Navigation through fog using stereoscopic active imaging. In Enhanced and Synthetic Vision 2000, volume SPIE-4023, pages 20–28, 2000.
- (22) Nicolas Hautière, Jean-Philippe Tarel, and Didier Aubert. Towards fog-free in-vehicle vision systems through contrast restoration. In Computer Vision and Pattern Recognition, 2007. CVPR’07. IEEE Conference on, pages 1–8. IEEE, 2007.
- (23) Y. Y. Schechner and N. Karpel. Clear underwater vision. In Proceedings of the 2004 IEEE Computer Society Conference on Computer Vision and Pattern Recognition, 2004. CVPR 2004., volume 1, pages I–I, 2004.
- (24) Andrew D. Payne, Adrian A. Dorrington, Michael J. Cree, and Dale A. Carnegie. Characterizing an image intensifier in a full-field range imaging system. IEEE Sensors journal, 8(11):1763–1770, 2008.
- (25) Uwe J. Netz, Jürgen Beuthan, and Andreas H. Hielscher. Multipixel system for gigahertz frequency-domain optical imaging of finger joints. Review of Scientific Instruments, 79(3):034301, 2008.
- (26) Miles Hansard, Seungkyu Lee, Ouk Choi, and Radu Horaud. Time-of-Flight Cameras: Principles, Methods and Applications. Springer Publishing Company, Incorporated, 2012.
- (27) Larry Li. Technical white paper: Time-of-flight camera – an introduction. Technical Report SLOA190B, Texas Instruments Dallas, Tex, USA, 2014.
- (28) Faisal Mufti and Robert Mahony. Statistical analysis of signal measurement in time-of-flight cameras. ISPRS journal of photogrammetry and remote sensing, 66(5):720–731, 2011.
- (29) Max Born and Emil Wolf. Principles of optics: electromagnetic theory of propagation, interference and diffraction of light. Elsevier, 2013.
- (30) Amnon Yariv and Pochi Yeh. Optical waves in crystal propagation and control of laser radiation. John Wiley and Sons, Inc., New York, NY, 1983.
- (31) R. S. Weis and T. K. Gaylord. Lithium niobate: summary of physical properties and crystal structure. Applied Physics A, 37(4):191–203, 1985.
- (32) F. E. Churchill, G. W. Ogar, and B. J. Thompson. The correction of i and q errors in a coherent processor. IEEE Transactions on Aerospace and Electronic Systems, 17(1):131–137, 1981.
- (33) David A Noon, I Dennis Longstaff, and Glen F Stickley. Wideband quadrature error correction (using svd) for stepped-frequency radar receivers. IEEE Transactions on Aerospace and Electronic Systems, 35(4):1444–1449, 1999.