figure \cftpagenumbersofftable
Development of Instruments for Space Exploration Using Meteorological-balloons
Abstract
Indian Centre for Space Physics is engaged in studying terrestrial and extra-terrestrial high energy phenomena from meteorological balloon borne platforms. A complete payload system with such balloons is at the most about five kilograms of weight. One has to adopt innovative and optimal design for various components of the experiment, so that the data can be procured at decent heights of km and at the same time, some scientific goals are achieved. In this paper, we mainly describe the instruments in detail and present their test and calibration results. We discuss, how we implemented and tested three major instruments, namely, a Geiger-Müller counter, a single crystal scintillator detector and a phoswich type scintillator detector for our missions. We also present some flight data of a few missions to demonstrate the capability of such experiments.
keywords:
X-ray detectors and instrumentation, Scintillator detectors, X-ray sources, Weather balloon-borne experiment*Ritabrata Sarkar, \linkableritabrata.s@gmail.com
1 Introduction
Traditionally, for balloon-borne astrophysical observations, large balloons of several million cubic meters are used (e.g., Ref. 1) with payloads of several thousand kilograms. These are typically equipped with ballasts and valves to have long flights of several days to several months duration. These also typically have, apart from the main instruments, accurate pointing instruments to acquire data from precise directions. In the other end of the spectrum, there are meteorological balloons which can carry generally ‘use and throw’ equipment totaling a few hundred grams for measuring atmospheric parameters up to a height of km on a daily basis.
With the advent of modern miniaturized instruments, it is now possible to explore space using light weight payloads. This aspect has been the major goal of research by Indian Centre for Space Physics (ICSP) which has systematically developed a paradigm to study various objects emitting high energy radiation in space from very light weight meteorological balloons [2, 3]. Being light weight, these balloons can carry at the most about five kilograms of payload which must contain not only the main measurement unit, but also the auxiliary instruments, power-supply, parachutes for re-entry etc. Thus a great deal of innovation is required to make these low-cost space missions a success. One of our motivations is to test cubesat and nanosat instruments prior to actually flying them to space. Being low cost, our procedure is affordable and is a great learning tool for college and university students.
The instruments in these experiments can be used to measure the intensity of ionizing radiations, particularly X-rays which is very useful for the study of Cosmic Rays (CRs), solar activity, X-ray background and accreting compact objects. It is also possible to detect the high energy Gamma-Ray Bursts (GRBs) in these kind of experiments. Apart from these extra-terrestrial events, Terrestrial Gamma-ray Flashes (TGFs) from the cloud formation region of the atmosphere are other types of interesting and yet to be understood events which can be recorded by the instruments.
In the present paper, we discuss in details the instrumentation in this new paradigm of exploring space with balloons of small size and limited capabilities. As discussed in Ref. 2, 3, the balloons we use conventionally are rubber weather balloons and often two balloons are tied-up together to fly a heavier payloads of up to kilogram reaching a ceiling altitude of about km. We also use plastic (polyethylene) balloons of about kg weight which can carry a combined payload of kg to a height of km. We do not use any pointing device and thus we adjust our launch window to observe the target object(s) for a significant period of time, unless we want to measure only the CRs. We also tag each photon event (along with its timing and spectral information) with concurrent attitude of the payload [3, 4]. This enables us to compute RA and DEC of the detector direction during the record of each photon in conjunction with the instantaneous GPS information of the payload. However, the actual directional information of the recorded photons are limited by the Field-of-View (FoV) of the collimator used in the detector which is independent of the detector direction. Depending on the science goal and experimental conditions, we have used different collimators with FoV varying between 6-15∘ and sometimes as wide as 40∘. The measurement of detector or payload direction is also subjected to instrumental and systematic errors which has been calculated as 0.3-1.8∘ depending on the rotational speed of the balloon. The other major part of the error comes in due to the slewing movement of the payload and the rate of data sampling for recording. We expect to improve this in future.
In the next Sec. 2 we briefly discuss the experimental aspects and mission strategies of this novel space exploration program. Subsequently, in Sec. 3, 4 and 5, we describe typical instruments which have been flown. Of course, many of these flights were dedicated to test the feasibility. For each instrument, we also present the electronic circuits used, the laboratory tests conducted before flying and an illustrative flight data of the corresponding detector. Finally, in Sec. 6, we summarize our results.
2 A Brief Mission Overview
A brief discussion of the experimental strategy with light-weight radiation detectors has been presented in Ref. 3. Study of correlation between cosmic rays and solar activities using multi-mission data has been carried out in Ref. 5. Presently, we discuss how each Mission is executed.
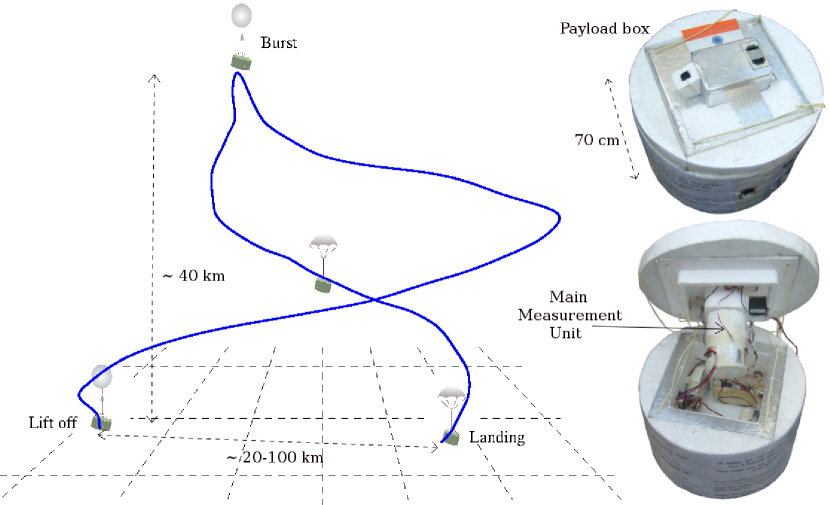
As already mentioned in the introduction, the major goal of these experiments is to measure several extraterrestrial and atmospheric radiation through light-weight radiation detectors onboard meteorological balloons. The payload used in this purpose contains the main detector for the radiation measurement using Geiger-Müller (GM) counters or scintillator detectors and ancillary equipment to supplement the data and help the mission operation. The carrier is usually one or two (depending on the payload weight) hydrogen filled rubber balloons or a plastic balloon capable of lifting payloads of 5 kg or less. The flight generally has no fixed cruising level (no ballasts used) and goes up to the maximum height till the balloon bursts and comes down with the help of a parachute (for rubber balloons) or using the torn balloon itself (in case of plastic balloons). The thermal shielding to the instruments is provided by using a styrofoam (thermocol) box, which also acts as the payload structure in which the instruments are embedded. Since unlike a rocket borne instrument, the frequency of the mechanical vibration during the entire flight is relatively low, this structure serves quite well, acting as a shock absorber during the entire flight. At the time of landing, the impact could be a bit severe. The payload box, along with additional shock absorber system made of simple hollow plastic cylinders placed at the bottom of the payload, absorbs the impact efficiently. Since a typical flight lasts for a few hours, the study of wind pattern is made carefully to ensure that the landing takes place within about a hundred kilometers of the launch site. Typically, we use two launching windows: the pre-monsoon window in April-May and the post-monsoon window in October-November [3]. A balloon flight trajectory along with a typical picture of the payload is shown in Fig. 1.
 |
To ensure cost-effectiveness of our Missions, one of the most important tasks in this type of missions is to recover the payload on landing. This is necessary both for retrieving the payload for further use in future missions and the experimental data which is stored onboard in data storage devices (using micro-SD cards), as currently we do not transmit the data during flight. The recovery of the payload relies on our accurate flight path prediction and the tracking device. The flight path and expected landing location is calculated ahead of time by giving appropriate weightage to the balloon flight simulator [6] results. We also modify the parachute or balloon lift in order to avoid any particular patch (water body, hills, jungles) of land for landing. The tracking device onboard the payload transmits live location (obtained by the GPS receiver onboard the payload) to the mobile ground stations on vehicle which follow the payload near the predicted landing location. As a backup, we also use an SMS alert system which transmits the payload location on landing to several payload recovery vehicles.
Since, we cannot afford to place a pointing device due to weight constraints, a very important issue is the determination of payload attitude. Apart for the omnidirectional measurements such as atmospheric radiation, the payload attitude information is crucial to know the incoming direction of the detected radiation. The attitude measurement instrument is a very light weight Inertial Measurement Unit (IMU) chip which measure and save the attitude data at detection of every photon. This data used during the offline data analysis. The details of the attitude measurement will be published in Ref. 4 (in preparation). However, to have a maximum exposure time of the source of interest in the detector we need to adjust the launch schedule and payload tilt angle (payload z-axis w.r.t. zenith) in such a way that the source approaches as close to the zenith as possible when the payload is near the maximum altitude. To avoid major corrections due to atmospheric absorption, we do not observe specific sources which are beyond from the zenith.
There is no pressure chamber to protect the detectors from the rarefied atmosphere at high altitude. However, we conduct extensive tests on the detectors in simulated pressure and temperature chambers in the laboratory, to study the effects on them under such extreme conditions. We measure the atmospheric pressure and temperatures inside the payload and outside using sensors in each of our flights. These atmospheric parameters up to very high altitude can be used in long term weather predictions. Additionally, in some of the experiments an optical sensor (sun-sensor) is implemented to verify if the sun is inside the FoV of the detector. This brief discussion highlights the key points of the overall experiment and in the following sections we present the main radiation measurement units in more detail.
3 The Geiger-Müller Counter
One of the simplest measurements one could do is to measure integrated radiation counts in the atmosphere. We present the results of miniature Geiger-Müller Counters (GMC) in one of our missions. GMCs have been traditionally used for such purpose [7]. Data from several experiments may be used to study the CR variation with time or location.
The count pulses produced in the GM counter, due to the interaction of the incident , or -rays (particles) are processed and stored in a micro-SD card. At the same time, we also acquire latitude, longitude, altitude and GPS time information from the GPS receiver. Hence, when the payload is launched, we detect high energy radiation counts mainly from the secondary cosmic rays, as a function of all the three coordinates. The detailed block diagram of the system is given in Fig. 2, along with the picture of the assembled detector featuring the GM tube which is used in the balloon flight experiment.
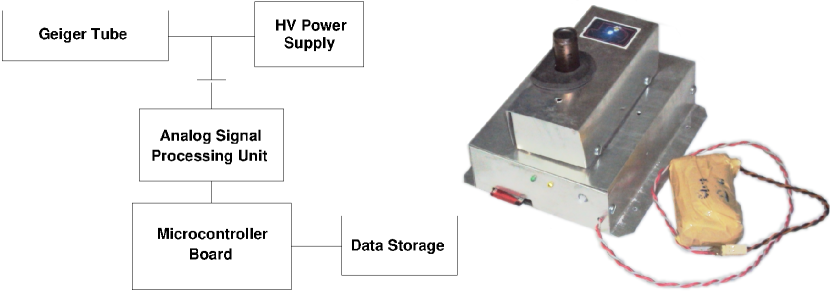 |
We used the GM counter (Model LND712) from LND, INC. The detailed dimensions and specifications of the detector can be found in the data sheet provided in Ref. 8. The dimension of the detector assembly shown in Fig. 2 is 151314 cm3. The overall dimension of the total payload box which embeds the detector assembly and other ancillary instruments is 251917 cm3 and weights about kg. A single kg category rubber balloon is enough to have the complete flight of about three hour duration.
3.1 High Voltage Power Supply
We generated 500 V required for the GM counter biasing from 5 V DC supply. The circuit consists of an oscillator followed by a voltage multiplier. We used a transformer coupling for producing a high voltage and then used a voltage doubler circuit to achieve our goal.
3.2 Readout System
The output signal from the GMC anode is taken through a suitable capacitance and is passed through a resistor-transistor logic circuit to convert the signal into pulse.
The output of the logical circuit is connected with a microcontroller as an interrupt signal. It counts the interrupt events per second and stores the raw format data in a micro-SD card. We use ATmega 32 microcontroller with 11 MHz crystal for the clock. The choice of microcontroller and the clock speed are sufficient for the radiation count rates we are interested in. A Real Time Clock (RTC) chip is used to generate an interrupt signal every s and the count rate is transferred to the micro-SD card along with the time stamp for record.
3.3 A sample result of atmospheric radiation counts
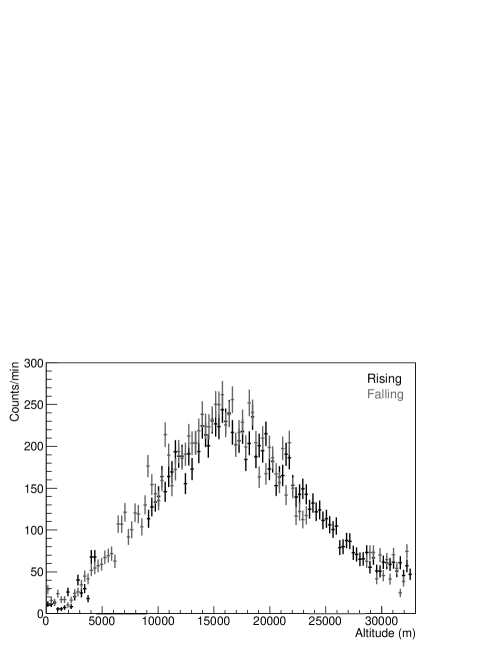
We flew the payload consisting the GM counter as the main measurement unit on several occasions to measure the integral radiation counts in the atmosphere at different heights. These atmospheric radiations are mainly due to the interaction of Galactic cosmic ray particles and solar energetic particles with the atmospheric nuclei. The window of the GM tube was directed upwards in the zenith direction and without any collimator. Thus, the detector provides an omnidirectional measurement of the atmospheric radiation. A result of our measurement made on 14th May, 2011 (Mission Id. D13) using the GM counter flown onboard a single rubber balloon is shown in Fig. 3, where the radiation count variation at different heights is plotted. The detected radiation count rate shows a maximum (Regener-Pfotzer maximum [9], hereafter RP-max) near 16 km during ascent and descent of the detector. The RP-max arises due to the balance between generation of secondary radiation from the cosmic ray interaction in the atmosphere and its subsequent diminution from absorption and decay process at different altitudes. The radiation count gradually diminishes with height above the RP-max. However, the atmospheric radiation strongly depends on solar activity, latitude etc. The long term variability of the atmospheric radiation and its anti-correlation with solar activity has been studied by us using scintillator detectors in similar experiments 5.
 |
4 Single Crystal Scintillator Detectors
For the purpose of X-ray and gamma-ray detection at different energies, from extraterrestrial sources and in the atmosphere, we use scintillator detectors mainly with Thallium doped Sodium Iodide (NaI(Tl)) crystal integrated with a Photo-Multiplier Tube (PMT) for the signal readout. These type of small X-ray detectors are particularly very useful for the study of solar activity which emits high intensity X-rays for which background noise is less severe. We used integrated detector units (Model 3M3/3 and 2M2/2) with scintillator crystals and PMTs made by Saint-Gobain Crystals [10].
4.1 Detector Specifications
In this integrated design, the PMT is optically coupled directly to the scintillator crystals. The scintillator is mounted in a container (usually aluminum), and the PMT is shielded with mu-metal. The scintillator container and mu-metal shield are hermetically sealed together to form a low-mass and light-tight housing for the detector. The crystal used in 3M3/3 model is cylindrical in shape and the size is 3” in diameter and height. The 2M2/2 model contains the crystal with the same shape except that the size is 2” in diameter and height. The weight of the detector including the PMT is 2100 g for 3M3/3 and 1500 g for 2M2/2. The dimension of the assembled detector is about 171740 cm3. The overall payload box has the dimension about 404070 cm3 and weights about 3 kg for 2M2/2 and 4 kg for 3M3/3 model. A double rubber balloon configuration or a single plastic balloon is enough to have a decent mission with these instruments 3.
4.2 Electronics for the Single Crystal Detectors
The PMT fitted with the scintillator crystal is provided with a bias voltage from the high voltage power supply. The signal readout system consists of an analog front-end circuit, a data processing/acquiring unit, a low voltage ( V and V) DC-DC converter unit and data storage unit. The overall signal readout scheme for the scintillator detector is shown in Fig. 4.
 |
The basic purpose of the electronics signal readout system are:
-
•
To generate a high voltage ( V or V for 3M3/3 or 2M2/2 respectively) for biasing the PMT and a low voltage ( V, V) for electronics.
-
•
To amplify or process the pulse generated from the detector for the signal processing.
-
•
To process the pulse signals and record the event data for post-facto analysis.
-
•
To work in space-like environment in a temperature range namely, C to C and qualification in the range from C to C and near vacuum condition without significant change in the performance.
The overall electronic circuit may be subdivided into: front-end electronics, power supply unit, digital signal processing unit and data storage unit which we discuss in more details subsequently.
4.2.1 Front-end electronics
The analog front-end circuit is responsible for processing the analog signal after getting a pulse signal from the detector. This includes: preamplifier, post-amplifier, triggering unit and the peak detector.
Preamplifier
To reproduce the pulses that appear on the anode of the PMT (which are of short duration and spiky) it is necessary to have a wide band amplifier with high open loop gain to process fast and low amplitude electrical pulses from PMT. It is accomplished by using a single high frequency operational amplifier (op-amp) in inverting amplifier configuration, since the polarity of the detector’s output is negative in current feedback mode. The operational characteristics of the preamplifier is summarized in Table 1.
| Input supply voltage | V |
| Rise time of the output pulse | s |
| Decay time of the output pulse | s |
| Polarity of the output | Unipolar |
| Voltage gain | |
| Saturation level | V |
Post-amplifier
The preamplifier output is further amplified in the post-amplifier without affecting the pulse shape (i.e. decay time). It also provides low impedance to the following processing and analyzing circuit. Since it is difficult for a single amplifier to cover a large dynamic energy range of the detector from keV to MeV, two different amplifiers with different voltage gains are provided. First amplifier (G1) covers the lower energy range of keV while the second amplifier (G2) covers energy range keV - MeV. The operational characteristics of the post-amplifier (G1) is given in Table 2. The G2 amplifier is basically a unity gain amplifier while the other features are same as G1.
The post-amplifiers have the following features:
-
•
The amplifier circuit is provided with V power supply for its operation.
-
•
The total power consumption in the front-end electronics is mW.
-
•
The gain and saturation level of the post-amplifier can adjusted according to the requirement.
-
•
The voltage gain depends only on passive components.
-
•
Band pass filters are provided to minimize the low and high frequency noise.
| Input supply voltage | V |
| Rise time of the output pulse | s |
| Decay time of the output pulse | s |
| Polarity of the output | Unipolar |
| Voltage gain of two stages | |
| Saturation level | V |
Triggering and peak detector circuits
The outputs from G1 amplifier is fed to the input of the triggering circuit. In the present experiment, we use two comparators: one for low ( keV) and another for high ( keV) energy. The low and high energies are distinguished by two different preset reference voltages while testing/calibration at the laboratory. Peak detectors are provided for the two amplifiers (G1 and G2) for analyzing separately.
4.2.2 Power supply distribution unit
Power supply distribution unit consists of high voltage and low voltage power supplies.
High voltage power supply
The main function of the HV supply is to bias the PMT (at +ve supply). The HV supply is adjusted such that the PMT gets a bias voltage of V for 2M2/2 and V for 3M3/3 detectors. We use EMCO F40 [11] as the high voltage module. Since a balloon borne payload reaches km above ground, at this near vacuum situation, using such a high voltage requires potting with a very good quality insulating material to prevent electrostatic discharge. A silicone elastomeric substrate from Dow Corning [12] has been used as a potting material.
Low voltage power supplies
The low voltage DC-DC power supply unit generates a voltage of V and V. The V is required for the analog front-end while the on board computing unit works with the V supply.
4.2.3 Digital data processing, acquisition and control unit.
We use a Mini2440 board (ARM9 family processor) [13] as the main board for the data acquisition. The system continuously monitors for the trigger interrupt signal (event) and when it is found, the computing unit processes the signal in the following way.
The system gathers detector Pulse Height (PH) data along with sub-second time stamp in a temporary buffer. After a pre-defined time interval all the accumulated events recorded in the buffer are transferred to the on board micro-SD card and the buffer is cleared. During the first part of , namely , data is procured and temporarily stored in the buffer. During the second part of , namely , the data is transferred to the micro-SD card. We chose this method, since it is faster to record the data in the buffer (RAM) rather that directly in the micro-SD card. Depending on the expected event rate, and vary. The whole processing cycle is shown in Fig. 5, 6, 8.
 |
Process1 (P1) in Fig. 6 describes the process of digitizing each event and storing into the temporary buffer memory (RAM). The analog PH signals from G1 and G2 are digitized using 10 bit ADC embedded in the processor (ARM9). However, to exclude the low energy noise information and the saturated events, we consider only the events in channel 100-1020. This PH information of the deposited energy along with the time stamp of the corresponding event and the digitized value from the sun sensor is packed together and stored the buffer. After storing in the temporary buffer, a reset pulse of s is issued from the computing unit to reset the event (discharging the peak-hold circuit at the peak detector) to allow a fresh event to be captured.
 |
The overall time sequence for the processing of a single event is shown in Fig. 7.
 |
In Process2 (P2), (flow chart in Fig. 8) the computing unit writes the content of the temporary buffer memory, acquired during the designated time interval for Process1, into a permanent storage i.e., an on-board micro-SD card. After the completion of the data transfer to the micro-SD card the control is goes back to P1.

4.2.4 Data format for storing
Writing to micro SD card requires the computing unit to access the card which is much more time consuming than accessing the RAM. We therefore optimize the data structure to reduce the data size so that the required CPU cycles to write the data in SD card is minimum. To reduce the number of bytes, the computing unit writes the data in hexadecimal format. The maximum possible outcome from the ADC is (0x3FF in hexadecimal) which requires bytes. To distinguish between the low channel energy data (G1) and high channel data (G2), an offset interval of is added to the high channel. Thus the maximum possible outcome for the high channel becomes + = (0xBCF in hexadecimal). Thus bytes can be allocated for energy data. The sun-sensor data from the ADC is binned into different levels. Thus each level is / = (0xE in hexadecimal) requiring only one byte. The division of a second is done based on the processor clock speed and resolution of the embedded timer hardware in the computing unit. The maximum value for such settings is which decreases to zero in one second. This requires bytes. One byte is used for a delimiter ‘:’ between energy and sun-sensor data. Finally a space is used as a delimiter between two events. Thus a total of bytes are required for storing an event in micro SD card. A pictorial representation of the packet format for a single event is given in Fig. 9.
4.3 Extracting Readable Data from the System
The hexadecimal data stored in the micro-SD card is first extracted with a Matlab [14] program to get the data in ASCII format. In the micro-SD card, to save CPU time cycles and storage space, the bytes are written in the raw format. The software program running in the ARM9 computing unit keeps track of the number of memory units that are being written to put the new data in new locations, thus preventing overwriting.
To extract the raw data stored in the blocks of the card, a low level access is required. To facilitate the data extraction and for redundancy, another on-board data storage card is used which stores minimal information of time stamp, memory address already used in the primary card with the raw data and the total number of events (low energy, high energy and total counts) in FAT format. This redundancy allows us to have a quick-look of the data.
4.4 Laboratory Tests
Before each Mission, we carry out several laboratory tests on the detector assembly for its health check and performance. The following standard functionality tests were conducted on the detector assembly.
-
•
Detector performance test under normal laboratory condition.
-
•
Energy-channel calibration and resolution of the detector.
-
•
Detector performance stability under the low pressure condition.
-
•
Detector performance under variable temperature to mimic ascend or descend of the payload.
In the following sections, we discuss briefly the tests performed on the detector assembly before each mission.
4.4.1 Tests under normal laboratory condition
The primary check on the detector performance is to test its behaviour under normal conditions and also tuning its input parameters, such as, HV settings, reference voltage values in the trigger circuit etc. for its optimum performance. We used radioactive sources, such as Eu152, Ba133, Cs137, Am241 for calibration.
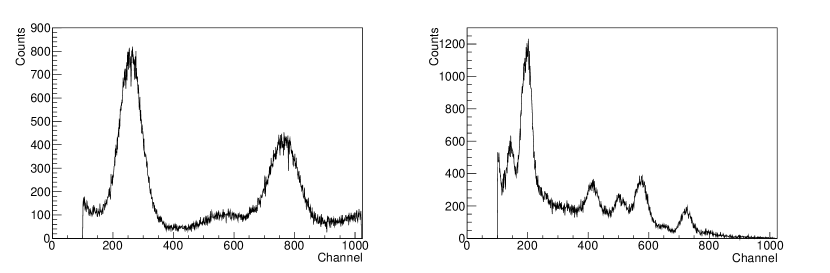
In Fig. 10, we show the pulse height spectrum in ADC channels for Eu152 radiation source, for both low energy and high energy channels. The applied bias voltage is so chosen that the gain of the system permits desired energy range within the measurable limit (output V). The gain parameters can be adjusted from the post amplifier section. An adjustment is made so that the minimum bias voltage can be obtained with highest resolution (at 59.5 keV of Am241 source). This spectrum shows different radiation lines, such as, two lines at and keV in the low energy spectrum and six lines at , , , , and keV for high energy spectrum.
 |
4.4.2 Calibration and resolution
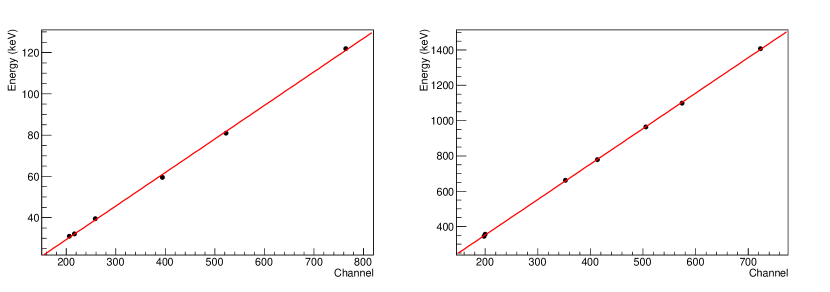
We used different emission lines at known energies from various radio active sources to calibrate the detector channels to convert the PH of the events into the photon energy. This channel-energy relation for low energy events in G1 and high energy events in G2 are shown in Fig. 11 and they respectively follow linear relations of the form and .
 |
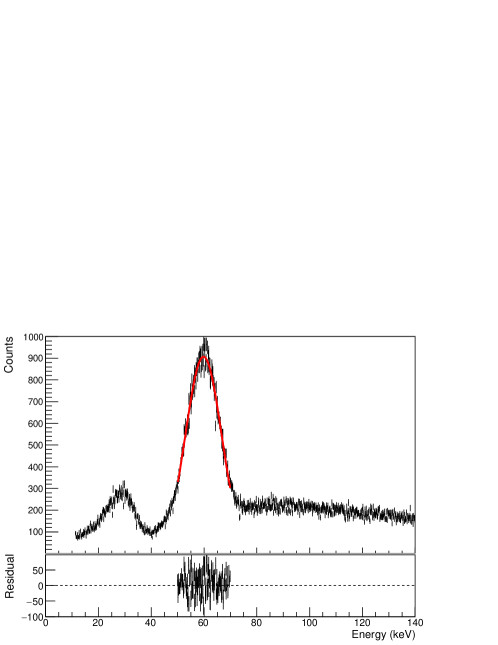
We calculated the resolution of the detector in a standard way at various energies by fitting the detected lines using Gaussian functions. The Full Width at Half Maximum (FWHM) and peak energy (Epeak) values were obtained from the fitting. For example, the resolution calculated for the detector at keV of Am241 source is 23.07% (FWHM/Epeak). The energy spectrum for this radiation source along with the Gaussian fit at the keV energy is shown in Fig. 12.
 |
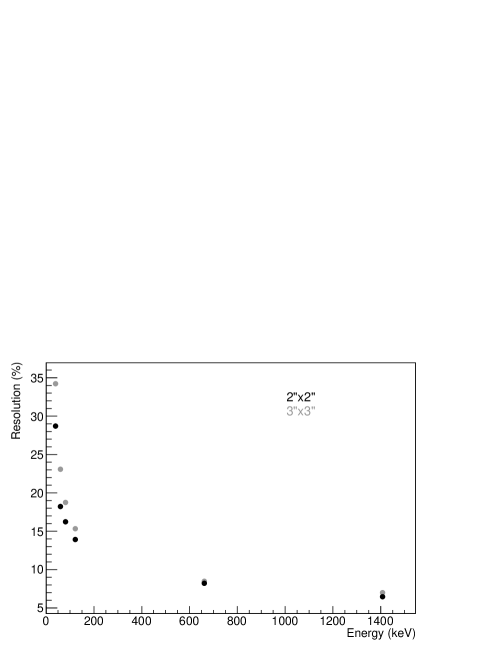
The resolutions of the and detectors obtained at various energies using the radiation source lines are given in Table 3 and plotted in Fig. 13 to show the variation.
| Energy (keV) | resolution (%) | resolution (%) |
|---|---|---|
 |
Stability of gain of the detector for long duration operations was also tested under normal laboratory conditions for all the detectors. The tests were satisfactory. This is explained in more details in Sec. 5.3.2.
After calibration of the detector, the energy spectrum with Eu152 radiation source is plotted Fig. 14.
 |
4.4.3 Test under low pressure condition
Due to the weight constraint on the payload, we cannot use a pressure vessel to keep the detector under constant pressure condition. So the detector is exposed to low pressure condition in the atmosphere up to km during the flight. We performed a test where the detector is kept in a pressure chamber which reduces the pressure gradually till mBar was reached which roughly corresponds to 55 km altitude in the atmosphere. All the single crystal and phoswich detectors under this test show that the gain is unaffected by the pressure variation. As an example, the test result is shown for phoswich detector in Fig. 25 in Sec. 5.3.3.
4.4.4 Test under temperature variation
We conducted tests on the detectors keeping them in a thermal chamber where the temperature was changed from the room temperature (about C) to C inside a low temperature test chamber. Due to the thermal insulation provided by the thermocol enclosure of our payload, the temperature inside the payload box is maintained well in this limit during the flight. This test also shows no significant effect on the detector gain or other parameters due to progressive changes in temperature.
4.5 Detection of solar radiation
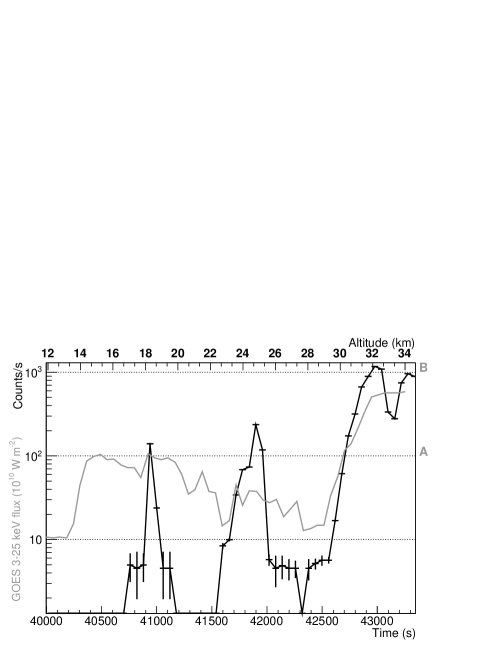
We used 2” and 3” diameter single crystal scintillator detectors onboard balloon flights in several missions, for the measurement of atmospheric radiation due to CR interaction and extraterrestrial radiations. For example, on 25th April, 2013 (Mission Id. D33), we used a 2” diameter scintillator detector onboard a carrier of two rubber balloons tied together, to measure solar radiation. During this epoch, the sun was in a highly active phase with frequent solar flares. The experiment was designed and scheduled in such a way that when the sun is closest to the zenith, the payload is also near its highest altitude, thereby increasing the solar exposure to the detector and enhancing the chance of flare detection. Figure 15 shows the 25-60 keV radiation counts in the detector during a part of the flight. The plot from the altitude of 12 km till the balloon burst is shown. We also plot the solar irradiation measured by the detector onboard GOES satellite [15] in 3-25 keV range (scaled up by 1010), for the sake of comparison. However, our data is influenced by several experimental and environmental effects which we state below.
During the time of experiment, the closest approach of sun to the zenith was 10∘. At the time of the highest payload altitude, the sun was at 12∘ from zenith. To be able to have the sun inside our FOV during the experiment we needed to tilt the payload axis by 12∘ w.r.t. the zenith. This optimizes the detector exposure to the sun during higher payload altitude. However, due to the free rotation of the payload, the relative position of the sun in detector FoV (40∘) changed (since detector axis is inclined at 12∘ with the rotation axis). So we expect a variation in solar exposure and hence intensity of detected solar radiation due to this rotational motion. This is evident from the altitude data in Figure 15 where a deep is seen due to non-detection even when the flare is on. This type of observations do not affect the spectrum very much, though corrections of the raw data is needed taking care of the attitude of the payload. Since the altitude of the payload in the atmosphere is varied with time, the residual atmosphere causing the attenuation of the solar radiation is also modified. The light curve of flares depends on the energy of the emitted photons. The major difference in the light curves detected by GOES and by this experiment is due to different energy ranges of the detectors. Thus, we see sharp peaks only when the radiation is of energy higher that the GOES range. We verified that the spectrum shifts towards lower energy with higher counts, as the balloon goes up. At lower altitude ( 14 to 16 km) we missed a part of the flare as seen in the GOES data. This is due to the strong atmospheric absorption. The detailed analysis of the data will be published elsewhere [16].
 |
5 The Phoswich Detector
To use an X-ray detector for the study of extra-solar sources where the intensity of the source radiation is relatively low, it is important to reduce the background counts in the detector. Only passive shielding for the detector is not always sufficient and hence phoswich technique is used [17] to reduce the background through anti-coincidence method using two different scintillator crystals of different pulse decay time. Energy depositions in different crystals by an event can be identified from the corresponding pulse shapes so that the partial energy deposition causing significant background in the primary crystal can be identified and eliminated.
A complete phoswich X-ray detector module includes a phoswich scintillator detector, an on-board computing unit, power supply, and large data storage capability. The entire system weighs only kg. Since it has a very flexible modular architecture, this payload can be reused after each flight and any of its units can be changed/replaced if needed. The dimension of the assembled detector is about 171731 cm3, while the overall dimension of the whole payload box is about 404070 cm3 and weights about 5.8 kg. This payload can be sent only by a kg category plastic balloon.
5.1 Detector Specifications
The heart of the module is a low-energy gamma-ray/hard X-ray detector system. The detector consists of thallium doped sodium iodide (NaI(Tl)) and sodium doped cesium iodide (CsI(Na)) scintillator crystals stacked together and viewed by a PMT. This assembly was produced by M/S Scionix Holland BV, The Netherlands [18].
The NaI(Tl) crystal is mm thick and mm in diameter and the CsI(Na) crystal is mm thick with the same diameter. The two crystals are and the PMT (diameter mm) is optically coupled to the CsI crystal through optically coupled and hermetically sealed with an entrance window on NaI side a light guide of mm thick. Both the crystals are used in X-ray astronomy as a special choice of scintillator (with to mole Tl and Na impurities) by virtue of their following properties:
-
1.
Relatively high effective atomic no. ( for NaI and for CsI crystal) and hence is a good absorber of hard X-ray
-
2.
Efficient optical light production ( nm wavelength emission from NaI and nm wavelength emission from CsI).
-
3.
In the current configuration of phoswich detector, the NaI(Tl) crystal is sensitive to X-ray photons of keV and the CsI(Na) crystal in the energy range of keV. This is because it resides below the NaI crystal which absorbs the photons below 100 keV. Both the crystals are sensitive to charged particle background.
The light signal from the CsI(Na) crystal has a different scintillation decay time ( ns) than that from the NaI(Tl) crystal ( ns) and hence this distinction may be used to eliminate the events with partial energy deposition in both crystals. The scintillator signals from both the crystals are used in anti-coincidence for the background rejection. The high energy gamma-ray and charged particles which deposit their energy partially in both the crystals are identified and eliminated by this method.
The interaction of X-ray photons of energy up to keV with NaI and CsI crystals is fully dominated by the photo-electric process and absorbed radiation (secondary electron-hole pair absorbed by the impurities) converts into light photons (due to the decay of the excited impurities). These photons eventually strike the photocathode of PMT (gain ) and are converted into narrow electrical pulse whose magnitude (pulse height) is proportional to the energy of the incident radiation. The energy resolution (FWHM) of the scintillator phoswich is expected to be keV and Pulse Height (PH) variation across the crystal will be less than . The radioactive isotopes Am241 ( keV), Eu152 ( keV, keV and keV), Ba133 ( keV and keV) and Cs137 ( keV and keV) are used for laboratory calibration of the detectors.
5.2 Detector Electronics and Readout System
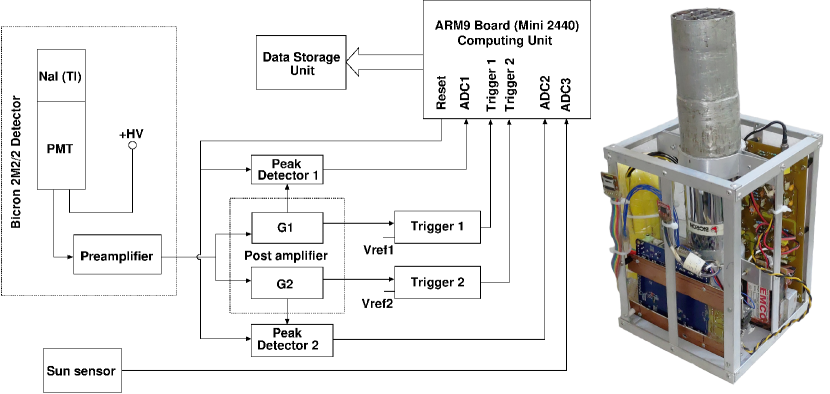
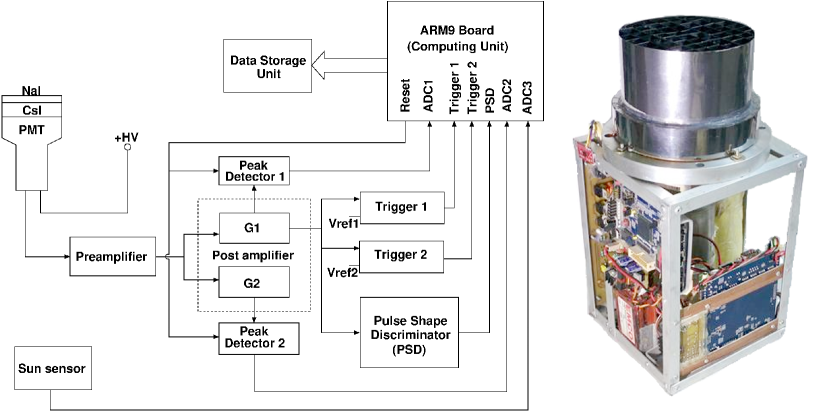
The schematic block diagram of the overall phoswich detector is given in Fig. 16 along with a picture of the assembled phoswich detector. The front-end electronics receives signals from the PMT. These signals are amplified, digitized and analyzed in the way discussed below.
 |
5.2.1 The front-end electronics
Signal pulses from the PMT are amplified in a preamplifier and two post amplifiers (G1 and G2). G1 covers energy range from keV and G2 from keV up to MeV. Due to different decay times of pulses in NaI and CsI crystals, a Pulse Shape Discriminator (PSD) technique is used to measure the width of the pulses giving the Pulse Shape (PS). An analog signal at the output of G1 originated from either crystal is used to measure the pulse shape. The width of the pulse at a certain fractional level of the signal peak voltage is measured using a counter. The output value of the counter is recorded as the pulse shape value of the event signal. The pulse height information is digitized using bits ADC embedded in the processor providing 1023 channels. The processing of an event in different stages and the corresponding time lapse is shown in Fig. 17.
 |
The data is stored into a buffer memory (RAM), for a preset time interval which depends on the experimental condition with expected maximum count rate. For example, if the experiment is done under high radiation environment, to limit the buffered memory, we must have a lower preset time. After that the buffered data is written on the data storage unit from the memory.
The key features of the phoswich electronics module are:
-
•
Amplify phoswich detector output pulses while retaining the original shape of the pulse. This is to measure both energy and shape of the pulse to allow identification of the origin of the pulse (i.e., NaI or CsI crystal).
-
•
Generate regulated power supply from the core power supply ( V, mAh battery backup) and provide appropriate Low Voltage DC (LVDC) to the electronics circuits and High Voltage DC (HVDC) to the PMT of the detector.
-
•
Work in space-like environment in a temperature range of C to C (inside the temperature shielding) and qualify in the range from C to C without significant change in the performance.
-
•
Optimize the power and space requirements resulting into less dimension and weight so as to be convenient for balloon borne programs.
5.2.2 Digital data processing, acquisition and control unit
The digital data processing and acquisition system works almost similar to that described for the single crystal detector in Sec. 4.2.3. The only difference in this case is to generate the PSD value to distinguish the origin of the events from different crystals from their decay properties. This difference is shown in Fig. 18. For this case, each event energy or digitized PH value is also associated with their corresponding PSD count value along with other components mentioned for the single crystal detector and packed together as a data packet unit to be stored in the temporary buffer.
 |
5.2.3 Data format for storing
The format of the event data used to write in the SD card is similar to that used in single crystal detector described in Sec. 4.2.4. But in this case, an extra bytes for the PSD information and an extra delimiter of byte between sub-second and PSD count data are required for each event. So we need a total of bytes to record an event data. The division of the data packet for one event is shown in Fig. 19.
The extraction of the data from the SD card is similar to that for the single crystal detector as discussed in detail in Sec. 4.3.
5.2.4 Power supplies for different units (DC-DC converters)
A high voltage DC-DC converter is used for generating bias voltage ( Volt) for the PMT. A low voltage DC-DC converter is used for the required supply voltage to drive the front-end electronics of the detector. The whole power needed by the detector is supplied from the on board mAh, V battery power system.
5.3 Laboratory Tests
We have conducted similar tests in laboratory as discussed in Sec. 4.4 for the phoswich detector, since both types of detectors are operational under similar conditions. The following functionality tests were conducted on the detector assembly.
-
•
Detector performance test under normal laboratory condition.
-
•
Energy-channel calibration and resolution of the detector.
-
•
Detector performance stability under low pressure condition.
-
•
Detector performance under variable temperature.
Here in the following sections we discuss briefly the tests performed on the detector assembly.
5.3.1 Tests under normal laboratory condition
We used calibrating sources as mentioned in Sec. 4.4.1. To discriminate the spectrum from different crystals of phoswich data, first the PSD data is plotted. The plot helps in distinguishing events coming from NaI(Tl) or CsI(Na) crystals. Fig. 20 shows a PSD plot of the data for the Am241 radiation source. We find two distinguishable peaks in the plot due to pulses in NaI and CsI with different decay times. The value at the minimum point near between the two peaks is taken as the PS cut value for separating events from two crystals during the analysis.
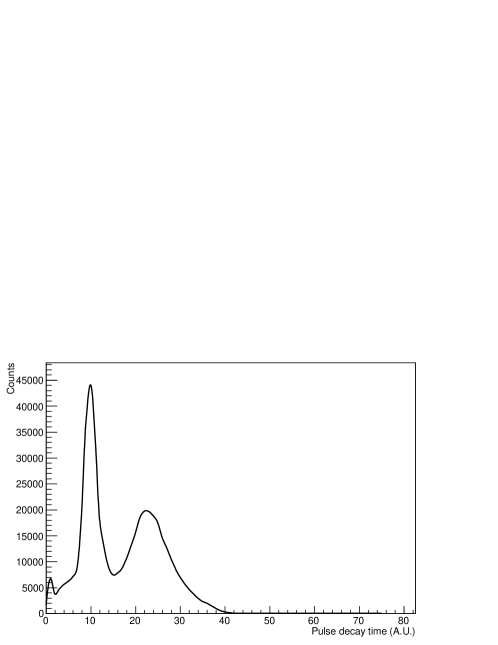 |
Fig. 21 shows the channel spectrum of the low energy data (from G1) for Am241 source. The applied bias voltage is so chosen that the gain of the system permits desired energy range within measurable limit (output V). The gain parameters can be adjusted from the post amplifier section. An adjustment is done so that the minimum bias voltage can be obtained with the highest resolution (at keV of Am241 source).
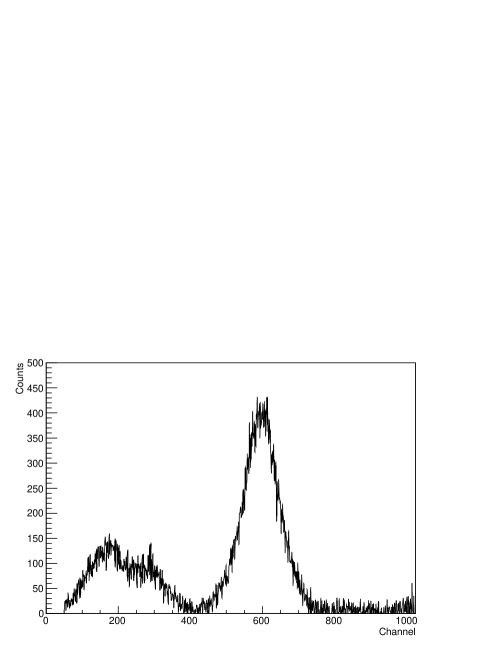 |
5.3.2 Calibration and resolution
The detector calibration provides the channel-energy relation for low energy events in NaI (G1) and high energy events (G2) are shown in Fig. 22. A linear fitting of the data gives gain factors of and keV/channel respectively and these relations are used to convert the PHs into energy deposition information.
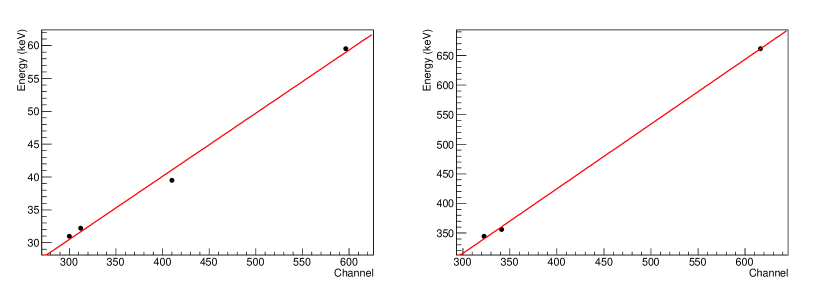 |
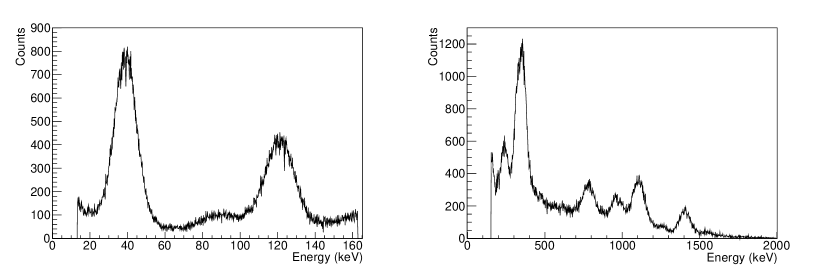
The energy spectrum of the detector for the radiation source Am241 using these calibration information are shown in Fig. 23 both for low and high energy.
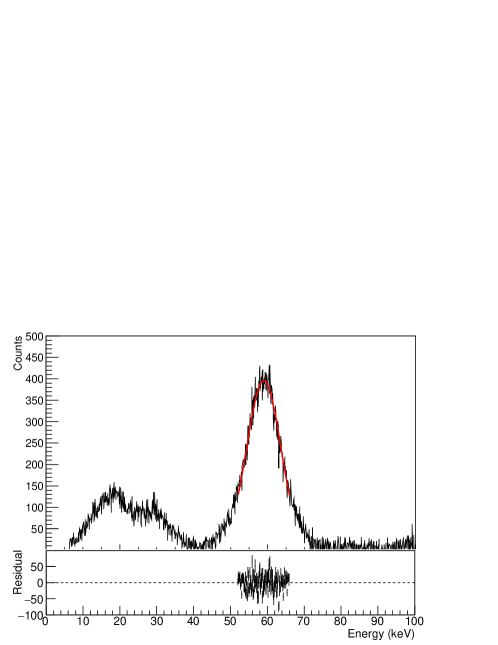 |
We calculated the resolution of the detector at various energies by fitting the detected lines using Gaussian function in a similar way as discussed in Sec. 4.4.2. For example, the resolution obtained for the detector at keV of Am241 source is calculated as . The energy spectrum in the detector showing the keV line fitted using a Gaussian is plotted in Fig. 23. These gain factors and resolutions achieved in our design is comparable to other similar detectors used for satellite borne space experiments like RT-2 [19] and BeppoSAX [20].
The gain stability of the detector for long duration operation was also tested under normal laboratory conditions and it was found to be satisfactory. For example, we show the dynamic energy spectra of the detector with time in Fig. 24 showing the peaks of Am241 radiation source for a long time of about ks. The 3 gain variation during this entire time, as measured w.r.t. the keV line peak, is only about 18.6% of the energy resolution at that energy.
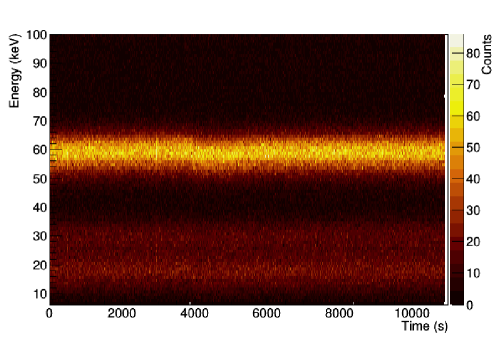 |
5.3.3 Test under low pressure and low temperature condition
As in the case of single crystal detector, the phoswich detectors were tested under very low pressure condition. We gradually reduced the pressure inside a pressure vessel containing the detector till mBar (equivalent to pressure at 55 km in the atmosphere) to see any effect of the pressure variation on the detector operation. Fig. 25 shows that the detector operation presented in the upper panel in terms of the dynamic channel spectrum is unaffected by the pressure changes shown in the lower panel.
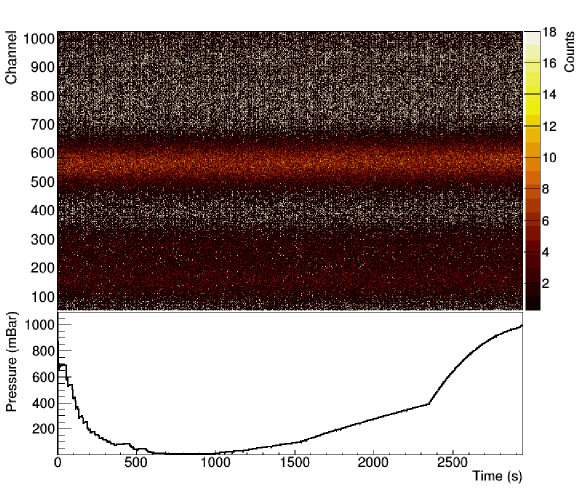 |
The phoswich detector also has been tested under low temperature as the single crystal detector to show no significant effect on the functionality of the detector.
5.4 Detection of Crab radiation by phoswich detector
We show, in Fig. 26, an example of the radiation measurement using phoswich detector during its flight onboard a plastic meteorological balloon on 7th May, 2017 (Mission Id. 102). The experiment was designed to measure radiations from the Crab pulsar. The closest approach of Crab to the zenith during the time of experiment was about 2∘. So, we scheduled the experiment in such a way that the payload reaches near its burst altitude when the Crab is near the zenith. In this way we can minimize the atmospheric absorption of the source radiation. The detector viewing direction was aligned with the payload rotation axis (i.e., zenith direction), so there was a small modulation due to the free rotation of the payload. The sensitivity of the detector is limited by the atmospheric background radiation and absorption of the source radiation in the atmosphere which is altitude dependant. From the previous background measurement experiment, we calculated the minimum sensitivity of the detector at 40 km and in the energy range of 20-60 keV is 200 mCrab [21]. There was no other source brighter than this inside the FoV (15∘) of the detector during the experiment, which was confirmed using other all sky monitor data onboard satellite (Swift/BAT [22]). So, the excess radiation which is well beyond 3 significance level at the peak from the background is indeed from Crab pulsar.
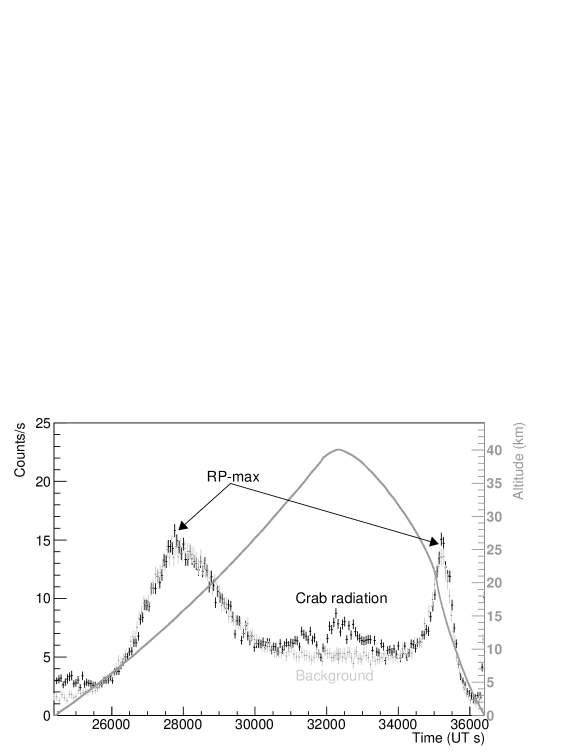 |
The detected radiation count rate in the selected energy range of 25-60 keV shows the RP-max near 15 km during ascent and descent. The origin of this radiation in the atmosphere has been discussed in Sec. 3.3 and in more detail in Ref. 5. The radiation excess near the highest altitude of the payload indicates the detection of radiation from the Crab. The sudden dip in the count rate near the maximum altitude is due to payload attitude change during the balloon burst. The Figure also shows the background counts in the absence of any significant astrophysical sources inside the FoV of the detector. This background data was taken from another mission (Mission Id. D96, on 15th October, 2016) with the same instrument. The timing information of the background counts were adjusted to compare with the source data, using payload altitude information of both missions. A more detailed experimental methodology and results of the temporal and spectral measurement of the Crab radiation in another similar experiment can be found in Ref. 21.
6 Summary
Balloon borne space exploration has become an accepted and efficient method to obtain high energy radiation from space for several decades. With the advent of miniaturized instruments, it has become possible to send payloads of mass less than 5-6 kg with the main science data measuring units, location and attitude measurement units as well as the power supply for the entire mission and still achieve significant science goals [2, 3, 16, 5]. Though these detectors are modest in size, the technology that is developed in course of these experiments, can be used to test any new detector concepts. These detectors can also be used to keep a regular monitoring of cosmic ray intensity, background etc. apart from the radiation study from astrophysical objects. In the present paper, we showed how even the normal payloads such as scintillator detectors or phoswich detectors which could have been flown to space with regular satellites or large balloons and rockets, may also be integrated into our low-mass and low-cost space exploration missions. We do not have pointing systems and do to transmit data to the ground. This led to innovate new procedures to ’tag’ every received photon with its directional information as obtained from the Inertial Measurement Unit (IMU) chipsets [4] and especially designed hardware to save data on board in micro-SD cards. Our present tagging is done with an accuracy of degree depending on the rotational speed of the balloon. Our logical circuit circumvents the need of more sophisticated electronics by simply writing the data on SD cards in regular time intervals during which data is not collected. Our data quality is decided by the shielding materials [21]. The test and evaluation procedure of every instrument is done very strictly. We also carry out calibration of these instruments in near space conditions by simulating in-flight pressure and temperature variations. The time-stamped and attitude tagged photons are analyzed keeping in mind different levels of atmospheric absorption at different altitudes [21]. These details are beyond the scope of this paper and will be presented elsewhere.
Disclosures
The authors have no relevant financial interests in the manuscript and no other potential conflicts of interest to disclose.
Acknowledgements.
The authors would like to thank Dr. S. Mondal, Mr. S. Chakraborty, Mr. S. Midya, Mr. H. Roy, Mr. R. C. Das and Mr. U. Sardar for their valuable helps in various forms during the mission operations and data collection. This work been done under partial financial support from the Science and Engineering Research Board (SERB, Department of Science and Technology, Government of India) project no. EMR/2016/003870. We also thank Ministry of Earth Sciences (Government of India) for partial financial support. Grant-in-aid from Department of Higher Education, Government of West Bengal is acknowledged by DB, SKC, RS and AB to carry out the research at ICSP.References
- [1] N. Yajima, N. Izutsu, T. Imamura, et al., Scientific Ballooning: Technology and Applications of Exploration Balloons Floating in the Stratosphere and the Atmospheres of Other Planets, Springer, Berlin (2009).
- [2] S. K. Chakrabarti, D. Bhowmick, S. Chakraborty, et al., “Study of properties of cosmic rays and solar x-ray flares by balloon borne experiments,” IJP 88, 333–341 (2014).
- [3] S. K. Chakrabarti, R. Sarkar, D. Bhowmick, et al., “Study of high energy phenomena from near space using low-cost meteorological balloons,” Exp. Astron. 43(3), 311–338 (2017).
- [4] R. Sarkar et al., “Payload attitude measurement using micro-electronic inertia-measurement unit for small balloon borne missions,” Exp. Astron. In Preparation (2019b).
- [5] R. Sarkar, S. K. Chakrabarti, P. S. Pal, et al., “Measurement of secondary cosmic ray intensity at regener-pfotzer height using low-cost weather balloons and its correlation with solar activity,” AdSpRes 60, 991–998 (2017).
- [6] “Cambridge university space flight landing predictor.” http://predict.habhub.org. Accessed: 19 Mar. 2019.
- [7] A. N. Charakhchyan, G. A. Bazilevskaya, Y. I. Stozhkov, et al., “Investigation of the long-term variations of cosmic ray latitude effect in the earth atmosphere,” in Proc. 14th ICRC, Munchen, Proc. SPIE 3, 1020–1024 (1975).
- [8] “Lnd, inc..” http://www.lndinc.com/products/geiger-mueller-tubes/712-2/. Accessed: 10 Mar. 2019.
- [9] E. Regener and G. Pfotzer, “Intensity of the cosmic ultra-radiation in the stratosphere with the tube-counter,” Nature 134, 325 (1934).
- [10] “Saint-gobain crystals.” https://www.crystals.saint-gobain.com/products/radiation-detection-products/standard-scintillation-product-list. Accessed: 15 Mar. 2019.
- [11] “Emco high voltage.” https://www.xppower.com/Product/F-Series. Accessed: 19 Mar. 2019.
- [12] “Dow corning.” https://consumer.dow.com/en-us/pdp.sylgard™184siliconeelastomerkit.01064291z.html. Accessed: 15 Mar. 2019.
- [13] “Friendly elec..” http://www.friendlyarm.com. Accessed: 15 Mar. 2019.
- [14] “Math works.” https://in.mathworks.com. Accessed: 19 Mar. 2019.
- [15] “Space weather prediction center.” http://www.swpc.noaa.gov. Accessed: 10 Oct. 2018.
- [16] S. K. Chakrabarti, R. Sarkar, and D. Bhowmick, “Observations of solar flares and compact x-ray sources using meteorological balloons,” Exp. Astron. In Preparation (2019).
- [17] L. E. Peterson, “Instrumental technique in x-ray astronomy,” Ann. Rev. Astron. Astrophys. 13, 423–509 (1975).
- [18] “Scionix holland bv..” https://www.scionix.nl. Accessed: 19 Mar. 2019.
- [19] D. Debnath, A. Nandi, A. R. Rao, et al., “Instruments of rt-2 experiment onboard coronas-photon and their test and evaluation i: ground calibration of rt-2/s and rt-2/g,” Exp. Astron. 29(1-2), 1–25 (2011).
- [20] F. Frontera, E. Costa, D. dal Fiume, et al., “The high energy instrument pds on-board the bepposax x–ray astronomy satellite,” A&A 122, 357–369 (1997).
- [21] R. Sarkar, S. K. Chakrabarti, D. Bhowmick, et al., “Detection of crab radiation with a meteorological balloon borne phoswich detector,” Exp. Astron. Accepted for publication (2019a).
- [22] H. A. Krimm, S. T. Holland, R. H. D. Corbet, et al., “The swift/bat hard x-ray transient monitor,” ApJSS 209, 14 (2013).