WIQA: A dataset for "What if…" reasoning over procedural text
Abstract
We introduce WIQA, the first large-scale dataset of "What if…" questions over procedural text. WIQA contains three parts: a collection of paragraphs each describing a process, e.g., beach erosion; a set of crowdsourced influence graphs for each paragraph, describing how one change affects another; and a large (40k) collection of "What if…?" multiple-choice questions derived from the graphs. For example, given a paragraph about beach erosion, would stormy weather result in more or less erosion (or have no effect)? The task is to answer the questions, given their associated paragraph. WIQA contains three kinds of questions: perturbations to steps mentioned in the paragraph; external (out-of-paragraph) perturbations requiring commonsense knowledge; and irrelevant (no effect) perturbations. We find that state-of-the-art models achieve 73.8% accuracy, well below the human performance of 96.3%. We analyze the challenges, in particular tracking chains of influences, and present the dataset as an open challenge to the community.
Procedural Text (simplified):
Erosion by the ocean:
1. Wind creates waves in the ocean.
2. The waves wash onto the beaches.
3. The waves hit rocks on the beach.
4. Tiny parts of the rock break off.
5. The rocks become smaller.
1 Introduction
Procedural text is common in language, but challenging to comprehend because it describes a dynamically changing world. While recent systems for procedural text comprehension can answer questions about what events happen, e.g., Bosselut et al. (2018); Henaff et al. (2017); Dalvi et al. (2018), the extent to which they understand the influences between those events remains unclear.
One important test of understanding is to predict what would happen if a process was perturbed in some way, requiring understanding and tracing the chain of influences through a paragraph. However, to date there is no dataset available to help develop this capability. We aim to fill this gap with WIQA111The dataset is available at http://data.allenai.org/wiqa/, the first large-scale dataset testing "What if…" reasoning over procedural text.
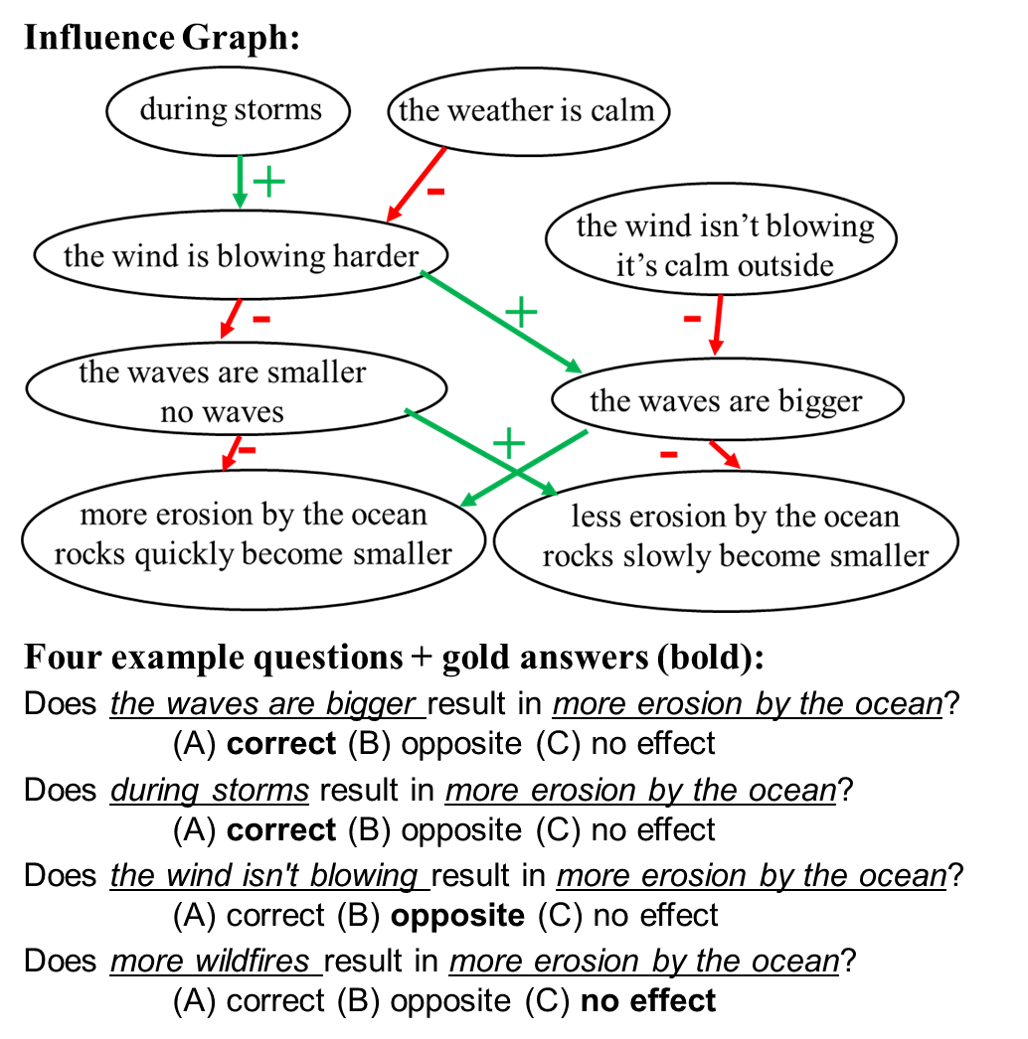
WIQA contains 40.7K questions, for 379 process paragraphs. To efficiently create the questions, crowdworkers created 2107 influence graphs (IGs) for the paragraphs, describing how one perturbation positively or negatively influences another (Figure 1). Questions were then derived from paths in the graphs, each asking how the change described in one node affects another. Each question is a templated, multiple choice (MC) question of the form Does changeX result in changeY? (A) Correct (B) Opposite (C) No effect, where Opposite indicates a negative influence between changeX and changeY. To bound the task, perturbations are typically qualitative (e.g., “the wind is blowing harder”), and possible effects are restricted to changes to entities and events mentioned in the paragraph (e.g., “the waves are bigger”). Perturbations themselves include in-paragraph, out-of-paragraph, and irrelevant (no effect) changes. The WIQA task is to answer the questions, given the paragraph (but not the IG).
We first describe the task and how the dataset was constructed, and then present results from baselines and strong BERT-based models. We find that the best model is still 23% behind human performance and the gap further widens with indirect and out-of-paragraph effects, illustrating that the dataset is hard. We present a detailed analysis showing WIQA is rich in linguistic and semantic phenomena. Our contributions are: (1) the new dataset (2) performance measures and an analysis of its challenges, to support research on counterfactual, textual reasoning over procedural text.
2 Related Work
While there are several NLP datasets now available for procedural text understanding, e.g., Kiddon et al. (2016); Dalvi et al. (2018); Weston et al. (2015), these have all targeted the task of tracking entity states throughout the text. WIQA takes the next step of asking how states might change if a perturbation was introduced.
Predicting the effects of qualitative change has been studied in the qualitative reasoning (QR) community, but primarily using formal models Forbus (1984); Weld and De Kleer (2013). Similarly, counterfactual reasoning has been studied in the logic community Lewis (2013), but again using formal frameworks. In contrast, WIQA treats the task as a mixture of reading comprehension and commonsense reasoning, creating a new NLP challenge.
3 Dataset Construction
To efficiently generate questions, we first asked crowdworkers to create influence graphs (IGs) for each paragraph. We then create questions from the IGs using paths in the IGs. We now describe this process.
Influence Graphs
An influence graph for a procedural text is an unweighted directed graph. Each vertex is labeled with one or more text strings, each describing a change to the original conditions described or assumed in , such that all those changes have the same influence on a connected node . Each edge is labeled with a polarity, + or -, indicating whether the influence is positive (causes/increases) or negative (prevents/ reduces).
Indirect effects can be found by traversing .
It is useful to distinguish two kinds of nodes:
1. Out-of-para nodes: denoting events or changes to entities/events not mentioned in the paragraph, e.g, “during storms” in Figure 1.
2. In-para nodes: denoting events or changes to entities/events mentioned in the paragraph, e.g, “the wind is blowing harder” in Figure 1.
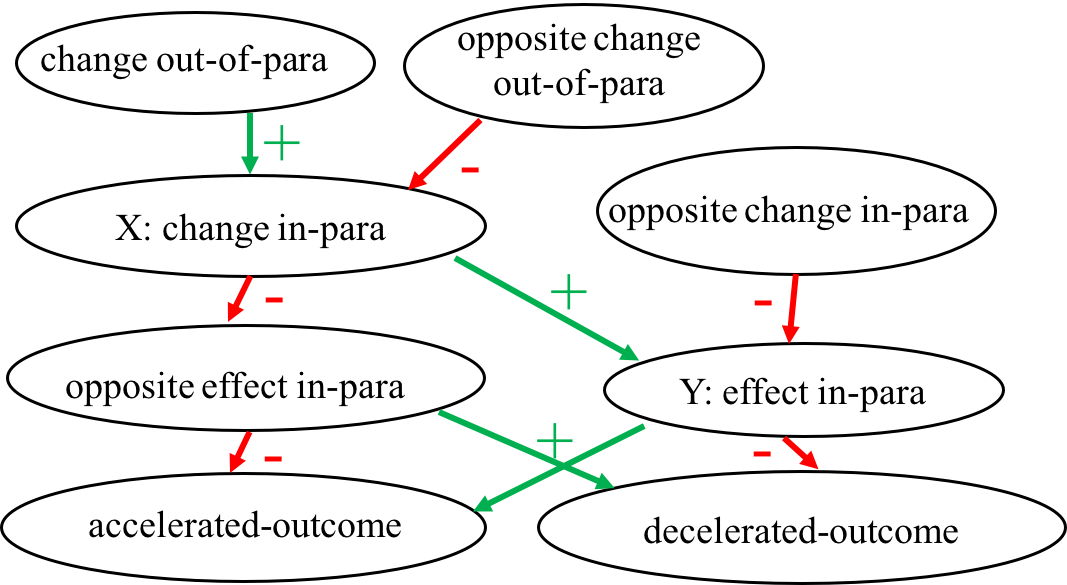
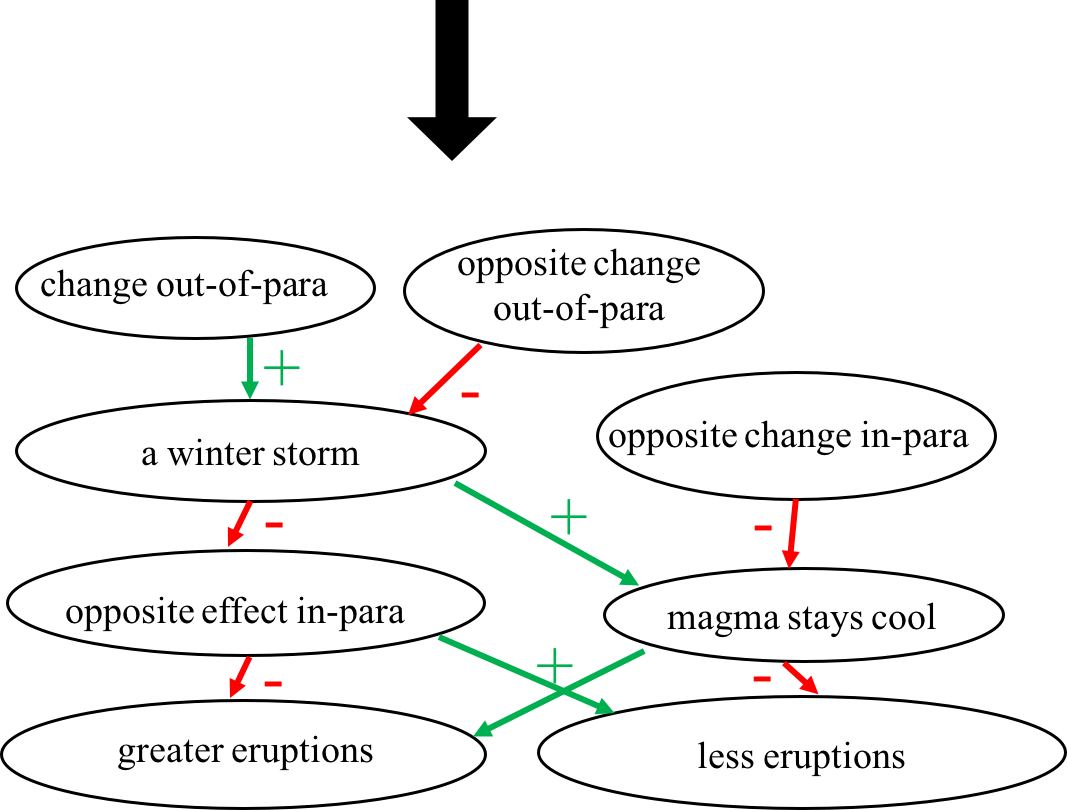
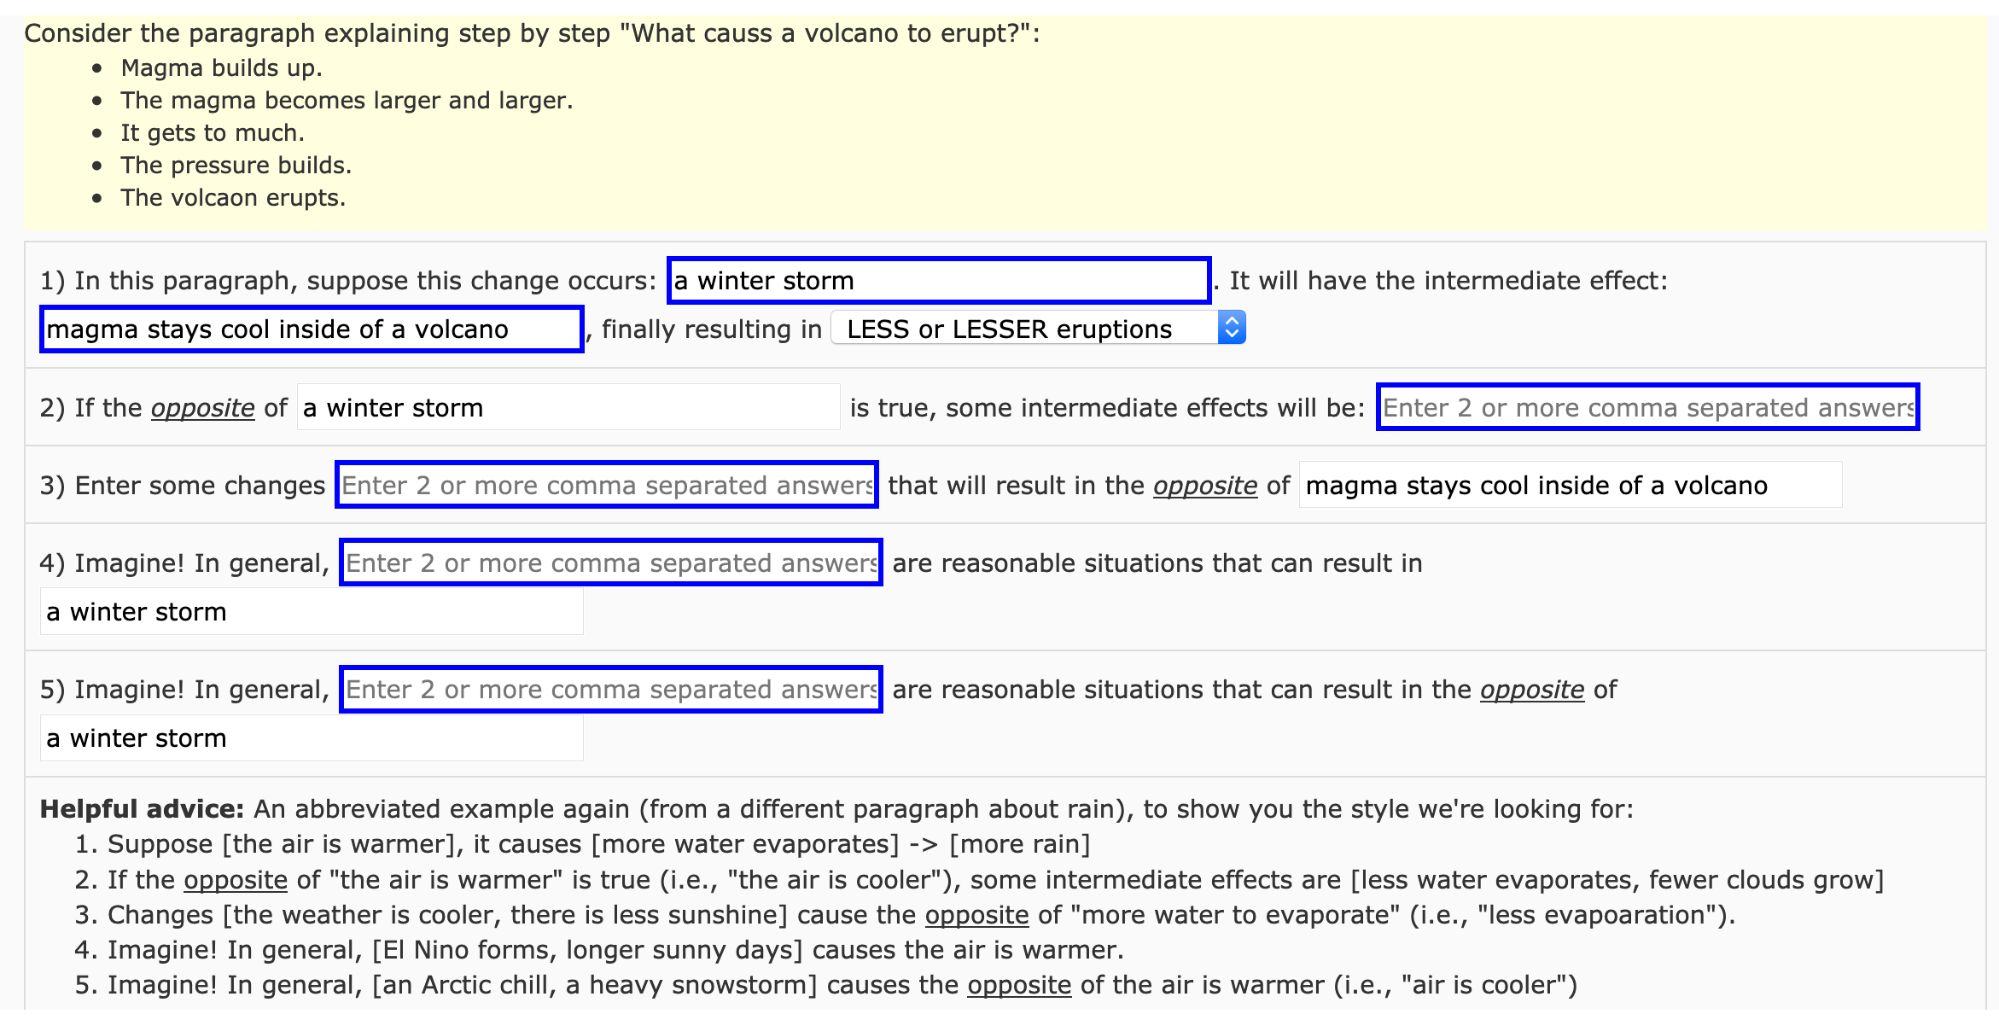
Acquiring influence graphs
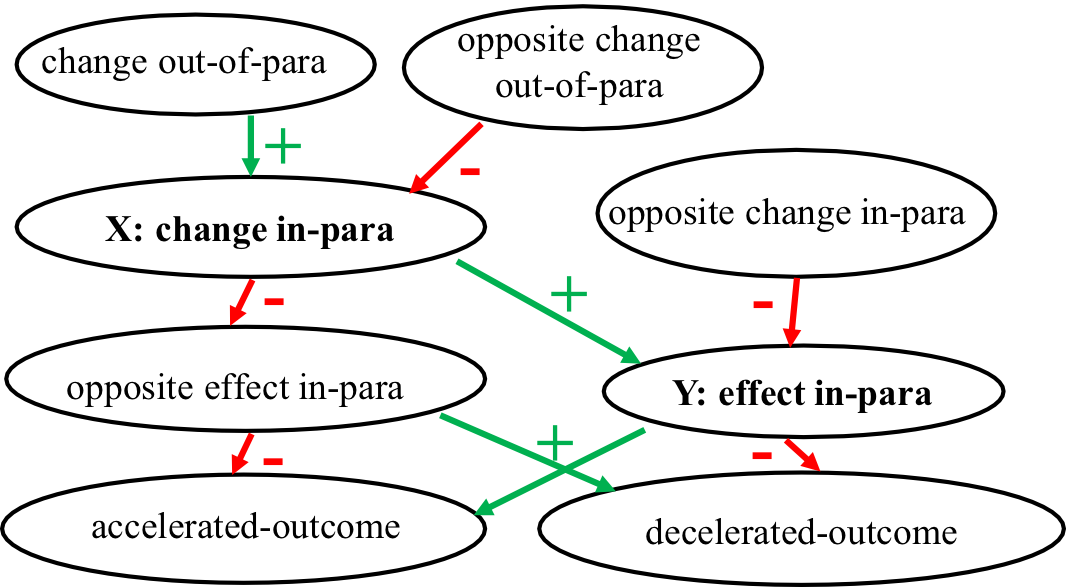
For a source of paragraphs, we used the 377 training set paragraphs from the ProPara dataset Tandon et al. (2018). (Multiple) influence graphs were then crowdsourced for each. To do this, we use an influence graph template, shown in Figure 2. Workers were asked to populate this (hidden) template using a sequence of five questions, where the later questions were automatically constructed from their answers to the earlier questions. The first question asks the worker to supply an X and Y in: “If [X] occurs, it will have the intermediate effect [Y] resulting in accelerated_outcome” (where the accelerated outcome phrase was pre-authored for each paragraph). For X and Y, workers were asked to describe a change in some property/phenomonon mentioned in the paragraph, e.g., if a paragraph sentence is “Wind creates waves.”, they may author an X saying “the wind is blowing harder” (Figure 1). (The alignment of X and , and whether X describes an increase or decrease of , denoted by , was also recorded.). This fills X and Y in Figure 2. Similar questions populate the remaining nodes (see Appendix). 2107 influence graphs were collected in this way.
Generating Questions from Graphs
Each path in a graph forms a “changeeffect?” question, whose answer is either “correct” or “opposite” depending on the product of the polarities of the traversed edges. Questions are labeled with the number of edges traversed (1 = "1-hop", etc.). We also distinguish in-para and out-of-para questions depending on the type of node they originated from. We then created a third category of question, whose answer is “no effect”, by selecting out-of-para changes from other paragraphs and asking for their effect on nodes in the current graph. Occasionally these changes did affect the selected node, resulting in an erroneous label of "no effect", but this was rare (and such cases were removed from the test partition, as we now describe).
Using a separate crowdsourcing task, questions in the test set were filtered to improve the test set quality. First, five workers independently answered each question, given the paragraph. The inter-annotator agreement between workers, using Krippendorff’s alpha, was moderately high (0.6). We then retained only questions with majority agreement (i.e., at least 3 out of 5 workers agreed), resulting in 88% of questions being retained.
Balancing the Dataset
From the (many) questions thus generated, we (randomly) selected a subset that approximately balanced the numbers of (a) in-para, out-of-para, and no-effect questions, and (b) questions with each answer (correct, opposite, no-effect), resulting in 40,695 questions. Train, dev, and test partitions do not share paragraphs about the same topic. Statistics are shown in Table 1.
Explanations
As each question is derived from a path in an IG, we can also generate explanations for each answer using that path. Although explanation is not part of the WIQA task, we create an explanation database to support a possible explanation task at a future date.
Consider a question “Does perturbation result in ?” with answer (as a shorthand for ), created from an IG path:
Here, , , and denote the polarities (+/-) of
the edges X, XY, and X in the IG respectively. (As described earlier, answer is
the product of the polarities ).
To define an explanation in terms of the paragraph’s sentences ,
we define the gold explanation as the structure:
where is the sentence corresponding to X,
is the sentence corresponding to Y,
and , , and denote the directions of influence (+/-, denoting {more,correct}/{less,opposite}).
As workers already annotated the alignment between X and
(similarly Y and ) we know and . Similarly,
as workers also annotated whether X describes an increase of decrease of , denoted by ,
we can straightforwardly compute the directions of influence:
{quoting}[vskip=0mm,leftmargin=2mm]
(in-paragraph influence222Paragraph sentences always describe correct, not opposite, influences on later sentences,
HENCE if is more/accelerated, will be too (similarly for less/decelerated).)
= the answer
We can similarly generate explanations for answers derived from 1-hop and 2-hop paths.
We generated a full database of explanations for all the questions with answer “correct” or “opposite” (For “no effect” answers, there is no explanation as there is by definition no path of influence). We then removed the (occasional) explanation where worker annotations were contradictory (e.g., ) or had no majority decision for an annotation. This database is available for a possible future explanation task (given question + paragraph, produce the answer + explanation).
| Count of | Train | Dev | Test | Total |
| Topics | 87 | 23 | 12 | 122 |
| Paragraphs | 261 | 77 | 41 | 379 |
| Influence graphs | 1453 | 424 | 230 | 2107 |
| Questions | 29808 | 6894 | 3993 | 40695 |
| # Questions | |||||
| Train | Dev | Test | Total | ||
| Question | in-para | 7303 | 1655 | 935 | 9893 |
| type | out-of-para | 12567 | 2941 | 1598 | 17108 |
| no-effect | 9936 | 2298 | 1460 | 13694 | |
| Total | 29808 | 6894 | 3993 | 40695 | |
| Number | #hops=1 | 6754 | 1510 | 835 | 9099 |
| of hops | #hops=2 | 8969 | 2145 | 1153 | 12267 |
| (in- & out- | #hops=3 | 4149 | 941 | 545 | 5635 |
| of-para qns) | Total | 19872 | 4596 | 2533 | 27001 |
4 Experiments
4.1 Models
We measured the performance of two baselines and three strong neural models on WIQA, to understand how it stresses these models:
-
Majority
predicts the most frequent label, correct, in the training dataset.
-
Polarity
is a rule-based baseline that assumes influences of the form “more X more Y" (similarly for “less”) are correct, hence “more X less Y” are opposite. A small lexicon of positive (“more”) and negative (“less”) words is used to assign the more/less polarities. A random class label is chosen when assignments cannot be made.
-
Adaboost
Freund and Schapire (1995) was used to make the 3-way classification using several bag-of-word features computed from change and effect.
-
Decomp-Attn
applies the Decomposable Attention (DA) model of Parikh et al. (2016) to our task. The original DA model computes entailment, i.e., the confidence that a premise entails (or contradicts) a hypothesis. We recast WIQA as an entailment task where cause-effect becomes premise-hypothesis, and (correct/opposite/no-effect) correspond to (entailment/contradiction/neutral). We retrain the DA model on WIQA using this mapping.
-
BERT
Devlin et al. (2018) is a pre-trained transformer-based language model that has achieved state of the art performance on many NLP tasks. We supply questions to BERT as [CLS] paragraph [SEP] question [SEP] answer-option for each of the three options. The [CLS] token is then projected to a single logit and fed through a softmax layer across the three options, using cross entropy loss, and the highest-scoring option selected. We fine-tune BERT on the WIQA training data in this way. We also measure an ablated version where the paragraph is omitted (train and test).
-
Human Performance
was estimated by having three people independently answering the same 100 questions (with paragraphs) drawn randomly from the test set. Krippendorff’s alpha (nominal metric) for these answers was 0.908 (high agreement) Krippendorff (1970).
5 Results and Analysis
5.1 Prediction Accuracy
| Question Type | in-para | out-of-para | no-effect | Total |
| # questions | 935 | 1598 | 1460 | 3993 |
| Majority | 45.46 | 49.47 | 0.55 | 30.66 |
| Polarity | 76.31 | 53.59 | 0.27 | 39.43 |
| Adaboost | 49.41 | 36.61 | 48.42 | 43.93 |
| Decomp-Attn | 56.31 | 48.56 | 73.42 | 59.48 |
| BERT (no para) | 60.32 | 43.74 | 84.18 | 62.41 |
| BERT | 79.68 | 56.13 | 89.38 | 73.80 |
| Human perf. | 96.33 |
The results (Table 2) provide several insights:
1. The dataset is hard. Our strongest model (73.8) is over 20 points behind human performance, suggesting WIQA poses significant challenges. Prediction of out-of-para effects is particularly challenging, 37 points behind human performance.
2. BERT already “knows” some change-effect knowledge. Even without the paragraph, and even though the test paragraphs are on topics unseen in training, BERT scores substantially above the baselines. This suggests BERT has some type of cause-effect information embedded in it.
3. Supplying the paragraph helps, resulting in 10 points higher score, illustrating that WIQA contains questions that require understanding of the paragraph. This suggests more sophisticated reading strategies may further improve results.
5.2 Predicting Indirect Effects
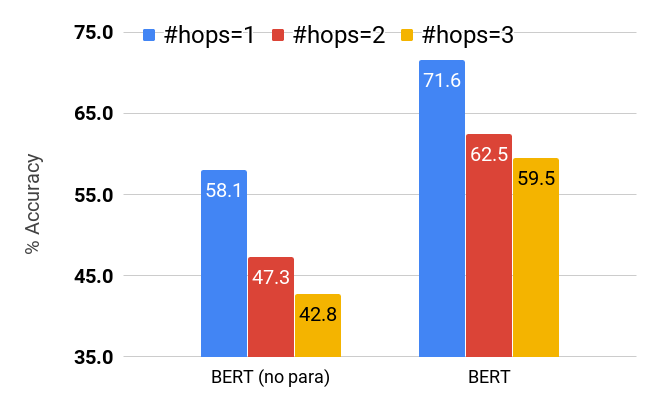
In-para and out-of-para questions were derived from chains of different lengths (“hops”) in the influence graphs. Figure 3 shows how performance varies with respect to those lengths, and shows that “indirect” (2/3-hop) effects are harder to predict than “direct” (1-hop) effects. For example, it is easier to predict “cloudy day” results in “less sunshine” (direct) than “less photosynthesis” (indirect). This suggests that some form of reasoning along influence chains may be needed to predict indirect effects reliably, as those effects are less likely to be explicitly stated in corpora and embedded in pre-trained language models.
5.3 Consistency
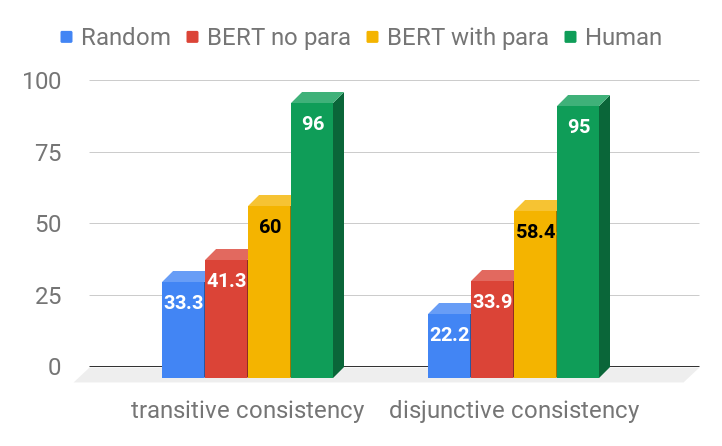
Are the models making consistent predictions? If a model predicts both XY and YZ are correct, it should, if it were consistent, also predict Z is correct. To measure a model’s transitivity consistency, for each influence graph, we measure how often its indirect predictions (2/3-hop) are consistent333 i.e., the polarity (+/-, for correct/opposite) of edge XZ = the product of the polarities of edges chaining from X to Z. As models can also predict “no effect”, random score is 1/3. with its 1-hop predictions. Similarly, we measure disjunctive consistency by how often its predictions for edges known to be opposite (eg XY and Xopp-effect-in-para in Fig 2) are indeed so444 Only edge pairs with labels +&-, or -&+, are disjunctively consistent (of 9 possible labelings), hence random is 2/9. . The results in Figure 4 illustrate that the models are far from consistent. This suggests that reasoning with global consistency constraints may improve results, e.g., Ning et al. (2017); Tandon et al. (2018).
5.4 Linguistic and Semantic Phenomena
We analyzed 200 descriptions of changes in 100 random questions, and observe the following challenging (overlapping) phenomena to handle:
1. Qualitative Language: 65% of the change statements are expressed qualitatively, using a broad vocabulary of comparatives (e.g., more, fewer, smaller, larger, cooler, slower, higher, harder, decreased, hotter) or their corresponding adjectives (small, cool, etc.). In addition, whether the change is a positive or negative influence on the process is context-dependent (“more X” can be positive or negative, depending on X, and sometimes depending on the paragraph topic itself).
2. Commonsense (45%): Exogenous influences are (by definition) not stated in the paragraph, and so require substantial commonsense to understand, e.g., that “heavy rainfall” (out of para) negatively influences “more wild fires” (in para); or that “overfishing” (out of para) negatively influences “fish lay eggs” (in para).
3. Lexical matching 15% of the in-para changes refer to paragraph entities using different terms, e.g., “insect” (para) “bee” (question), “becomes” “forms”, “removes” “expels”, complicating aligning questions with the paragraph.
4. Negation (6%): Negation occurs in about 6% of the changes, e.g., “drought does not occur”, “soil is not fertile”, “magma does not get larger”.
5. Juxtaposed polarities (3%): Sometimes positive- and negative-related terms are juxtaposed, (e.g., “much less”, “increased deforestation”, “less severe”) again challenging to process.
These all illustrate the diversity of linguistic and semantic challenges in WIQA.
6 Conclusion
An important test of understanding procedural text is whether the effects of perturbations to the process can be predicted. To that end, we have introduced WIQA, the first large-scale dataset for “what if” reasoning over text. While our experiments suggest language models have some built-in knowledge of influences, and some ability to identify influences in paragraphs, these capabilities are limited, producing predictions that are over 20 points worse than humans, often inconsistent, and particularly erroneous about indirect (multi-hop) effects. WIQA aims to improve this state of affairs, offering a new challenge and resource to the community. The dataset is available at http://data.allenai.org/wiqa/.
Acknowledgements
We are grateful to the AllenNLP and Beaker teams at AI2, and for the insightful discussions with other Aristo team members. Computations on beaker.org were supported in part by credits from Google Cloud.
References
- Bosselut et al. (2018) Antoine Bosselut, Omer Levy, Ari Holtzman, Corin Ennis, Dieter Fox, and Yejin Choi. 2018. Simulating action dynamics with neural process networks. 6th International Conference on Learning Representations (ICLR).
- Dalvi et al. (2018) Bhavana Dalvi, Lifu Huang, Niket Tandon, Wen-tau Yih, and Peter Clark. 2018. Tracking state changes in procedural text: A challenge dataset and models for process paragraph comprehension. In NAACL-HLT’18.
- Devlin et al. (2018) Jacob Devlin, Ming-Wei Chang, Kenton Lee, and Kristina Toutanova. 2018. Bert: Pre-training of deep bidirectional transformers for language understanding. CoRR, abs/1810.04805.
- Forbus (1984) Kenneth D. Forbus. 1984. Qualitative process theory. Artificial Intelligence, 24:85–168.
- Freund and Schapire (1995) Yoav Freund and Robert E. Schapire. 1995. A decision-theoretic generalization of on-line learning and an application to boosting. In EuroCOLT.
- Henaff et al. (2017) Mikael Henaff, Jason Weston, Arthur Szlam, Antoine Bordes, and Yann LeCun. 2017. Tracking the world state with recurrent entity networks. In ICLR.
- Kiddon et al. (2016) Chloé Kiddon, Luke S. Zettlemoyer, and Yejin Choi. 2016. Globally coherent text generation with neural checklist models. In EMNLP.
- Krippendorff (1970) Klaus Krippendorff. 1970. Estimating the reliability, systematic error and random error of interval data. Educational and Psychological Measurement, 30(1):61–70.
- Lewis (2013) David Lewis. 2013. Counterfactuals. John Wiley & Sons.
- Ning et al. (2017) Qiang Ning, Zhili Feng, and Dan Roth. 2017. A structured learning approach to temporal relation extraction. In EMNLP, pages 1027–1037.
- Parikh et al. (2016) Ankur Parikh, Oscar Täckström, Dipanjan Das, and Jakob Uszkoreit. 2016. A decomposable attention model for natural language inference. In Proceedings of the 2016 Conference on Empirical Methods in Natural Language Processing, pages 2249–2255, Austin, Texas. Association for Computational Linguistics.
- Tandon et al. (2018) Niket Tandon, Bhavana Dalvi Mishra, Joel Grus, Wen-tau Yih, Antoine Bosselut, and Peter Clark. 2018. Reasoning about actions and state changes by injecting commonsense knowledge. EMNLP’18, arXiv preprint arXiv:1808.10012.
- Weld and De Kleer (2013) Daniel S Weld and Johan De Kleer. 2013. Readings in qualitative reasoning about physical systems. Morgan Kaufmann.
- Weston et al. (2015) Jason Weston, Antoine Bordes, Sumit Chopra, Alexander M Rush, Bart van Merriënboer, Armand Joulin, and Tomas Mikolov. 2015. Towards AI-complete question answering: A set of prerequisite toy tasks. arXiv preprint arXiv:1502.05698.
Appendix A: Topicwise consistency
We study trends in topic-wise accuracy of models as they read more context information. Bert no-para model does not have access to any context or paragraph, except the language model’s background knowledge from Wikipedia. By reading the paragraph context Bert with-para model performs much better on certain topics such as Pollination, blood, mountain, evaporation but the impact of reading is much less on topics such as Igneous rocks, plant crops, solar eclipse, DNA replication. Topics such as blood are very popular on Wikipedia and distributed across several very different articles. These topics are harder for BERT as it requires additional paragraph context to understand the question.
| topic | BERT (no para) | BERT |
| igneous rock | 0.66 | 0.64 |
| plant crops | 0.61 | 0.61 |
| solar eclipse | 0.43 | 0.43 |
| frog | 0.59 | 0.62 |
| DNA replication | 0.58 | 0.63 |
| water cycle | 0.63 | 0.69 |
| fish | 0.5 | 0.57 |
| pumpkin | 0.61 | 0.69 |
| pollination | 0.62 | 0.75 |
| blood | 0.62 | 0.76 |
| mountain | 0.57 | 0.72 |
| evaporation | 0.42 | 0.67 |
Appendix B: Crowdsourcing Influence Graphs
We crowdsource influence graphs by getting the graphs constructed progressively, with the help of five questions stated in Figure 7. At first, the turkers see an empty graph in Figure 5.
When the annotators answer the first question (shown in Fig. 7), two nodes of the partial influence graph are filled (depicted in Fig. 6).
Once all the questions are answered, the influence graph will be ready. During the process of annotation, there are appropriate validations for quality control.
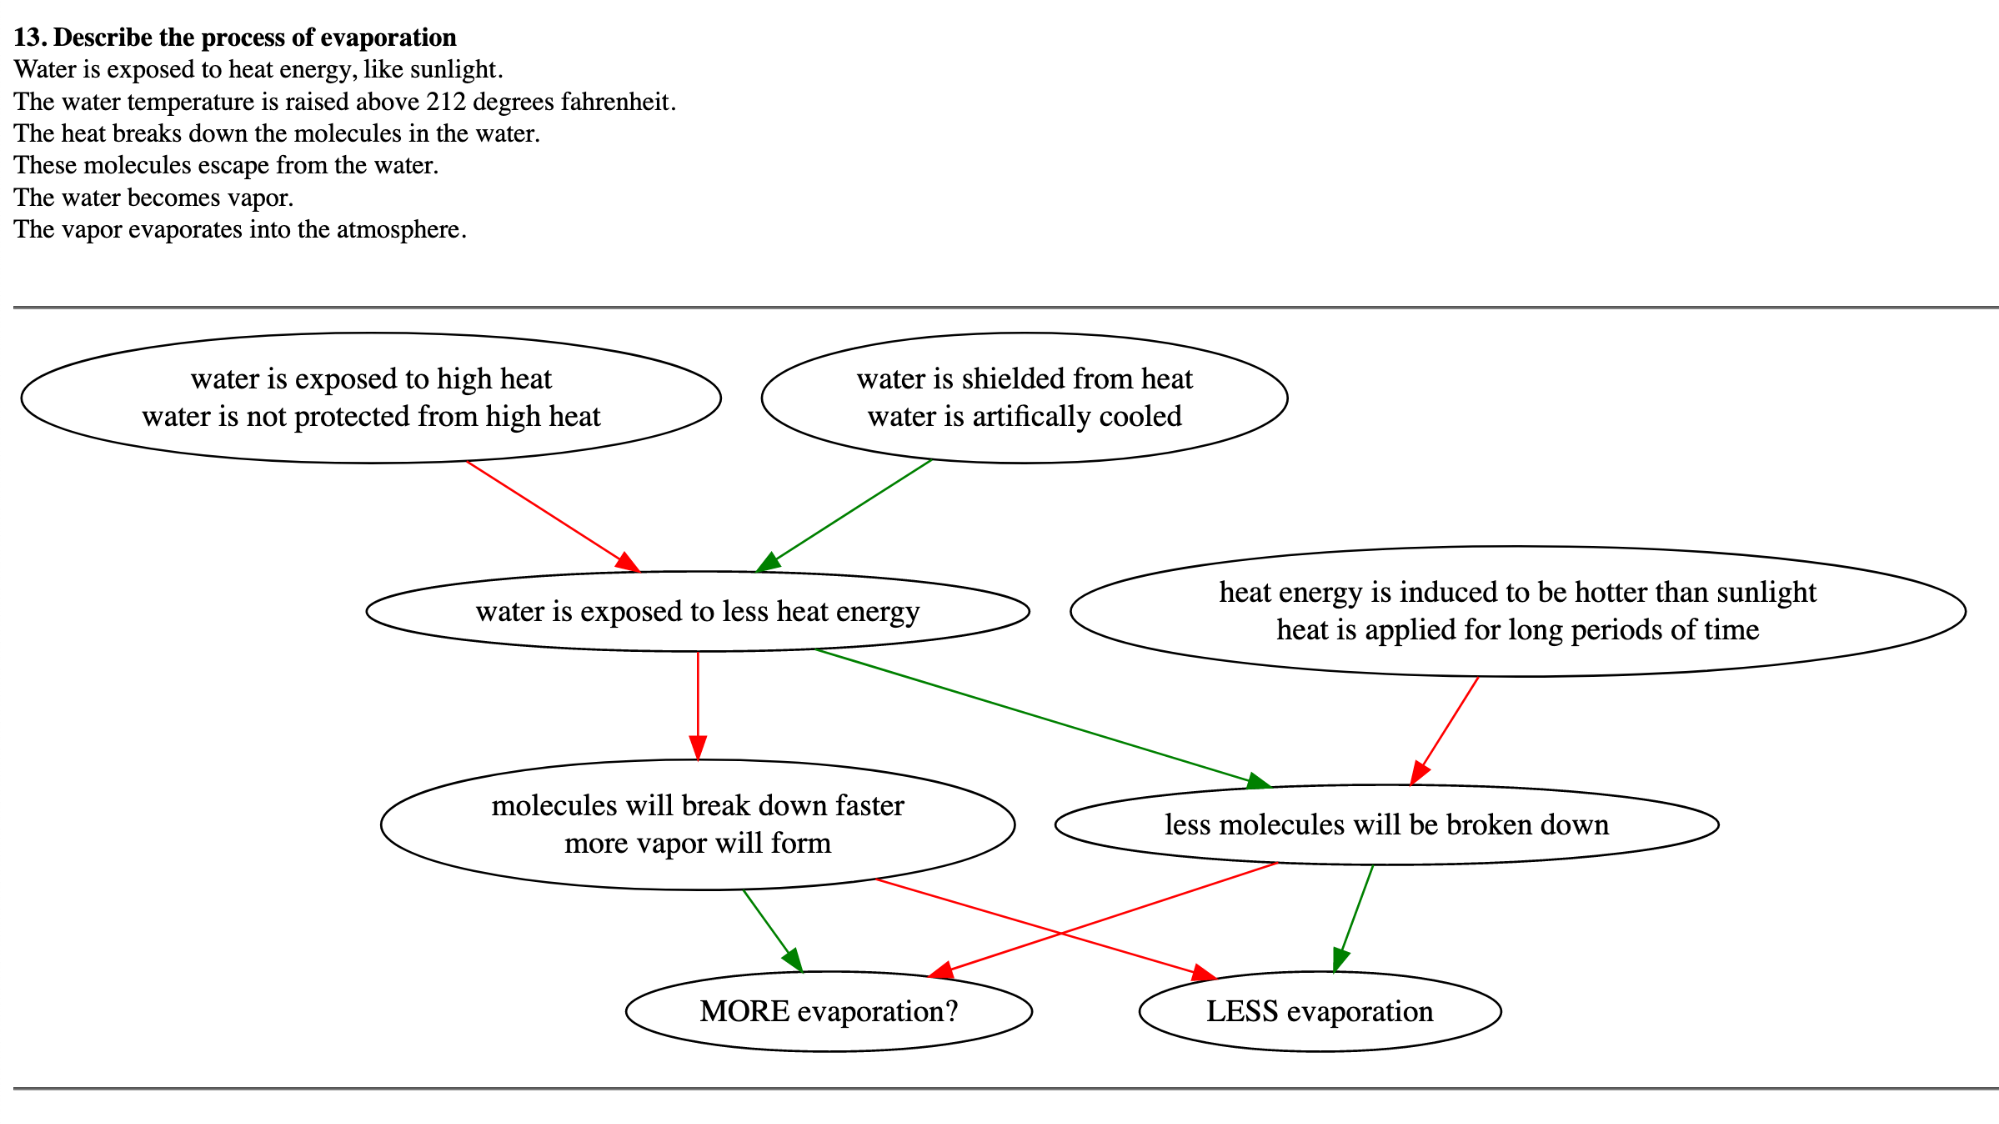
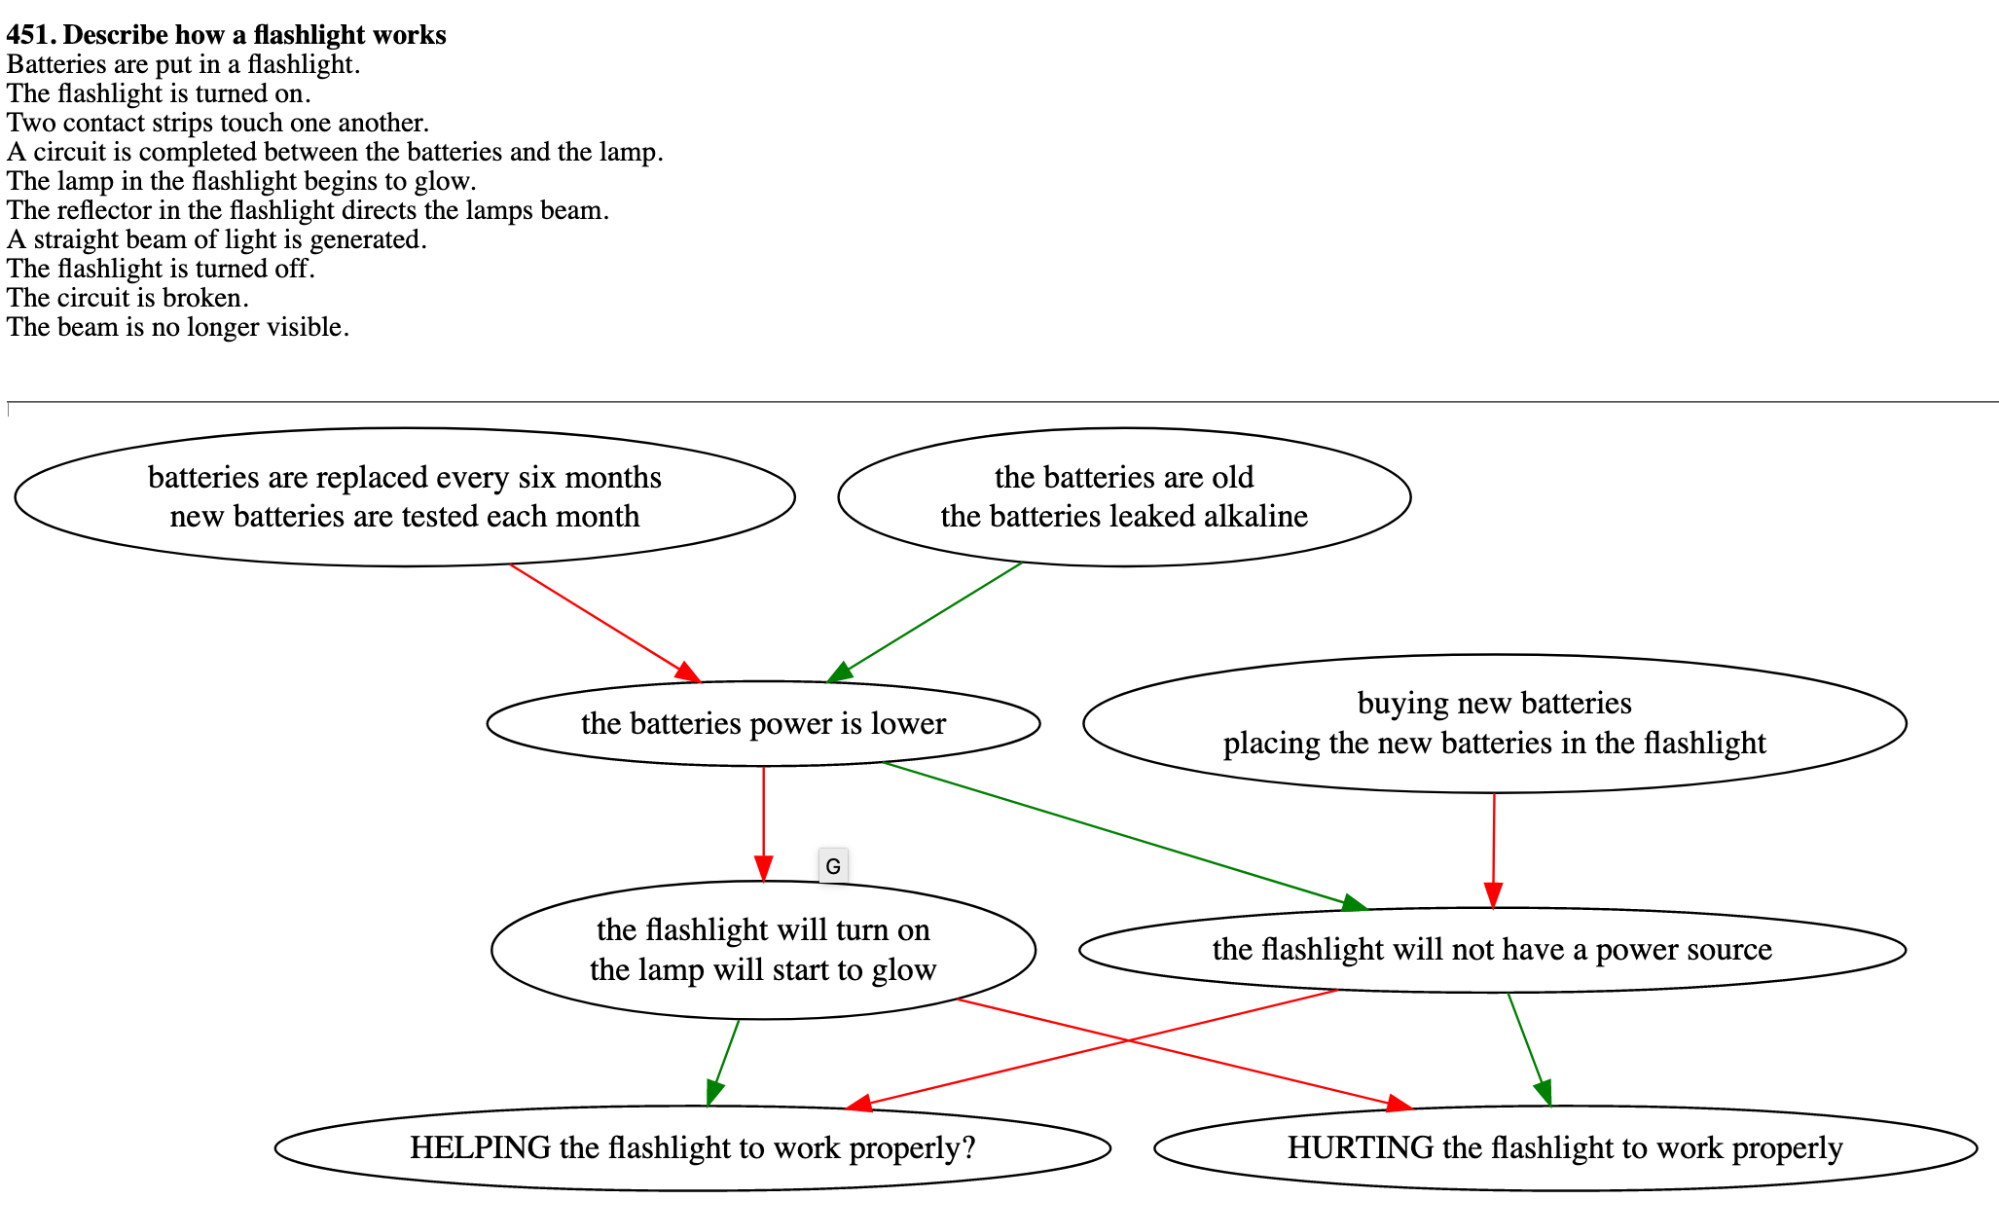
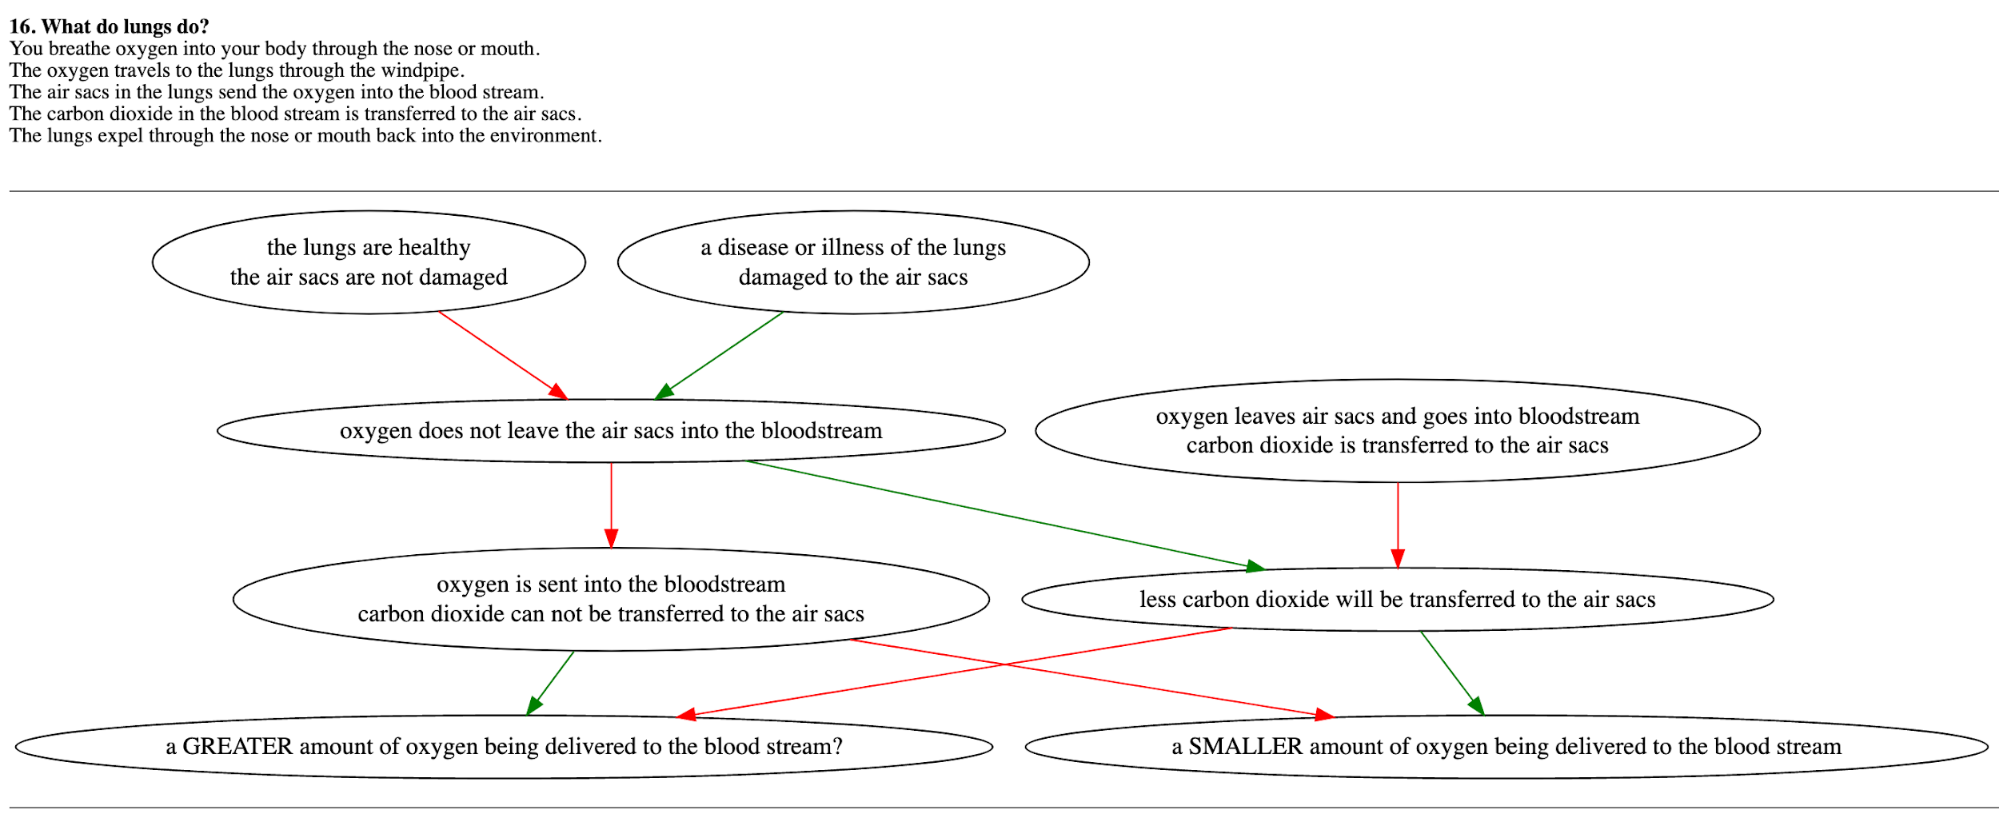
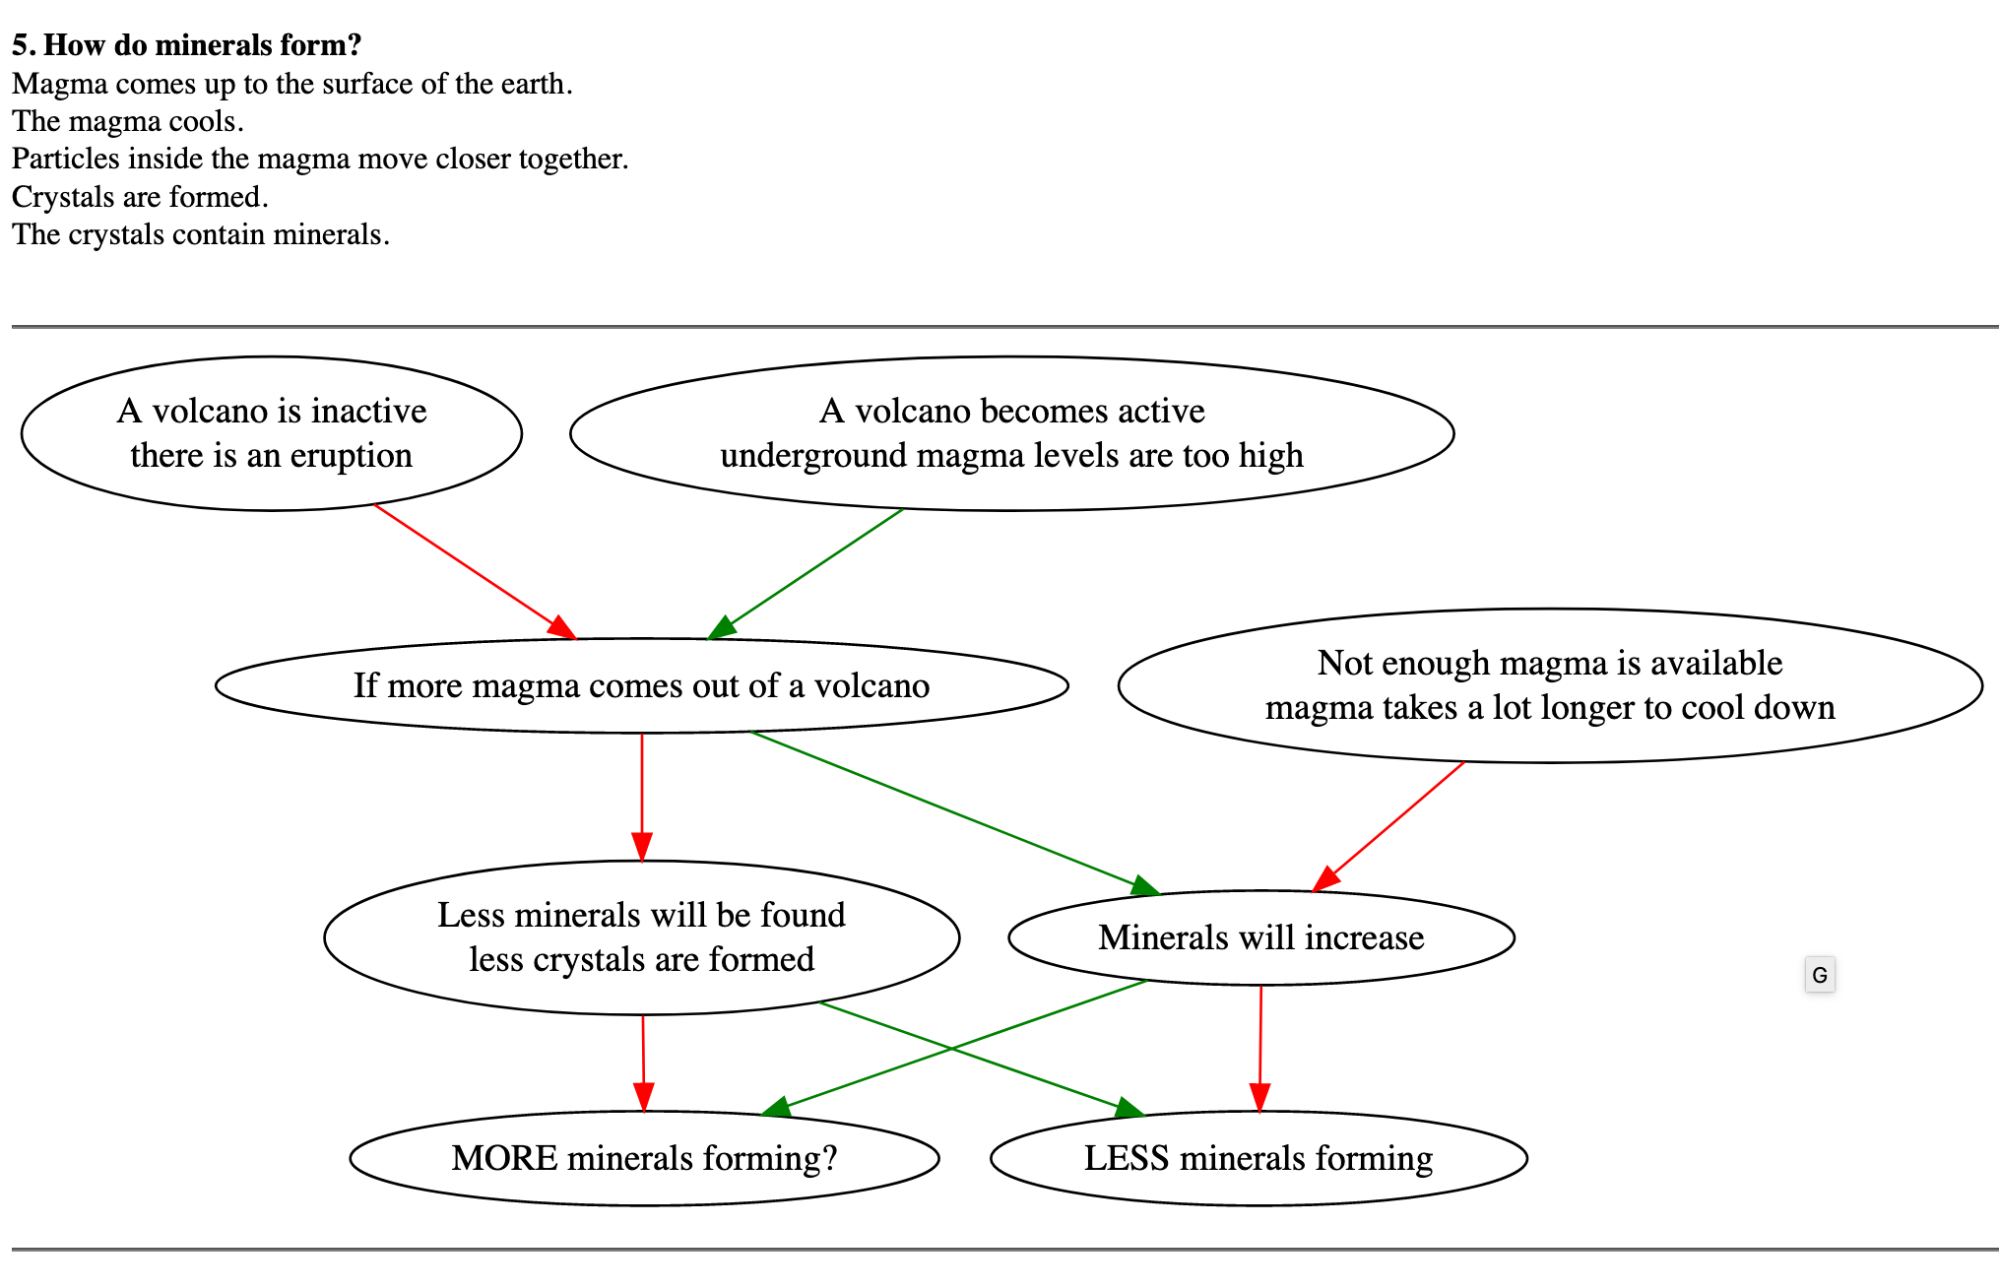
Appendix C: Sample Influence Graphs
To get an impression of our crowdsourced influence graph repository, we display four paragraphs (not hand picked) in Figures 8, 9, 10, 11. These range from natural process, to human body process and mechanical process.