Digital Beings as an option to study gut flora evolution and adaptation
Abstract
In this work, we introduce a computational model for the study of the host-bacteria interaction and the influence of the intestinal microbiota on the behavior and feeding pattern of an individual. The model is based on digital entities, which we’ve called Digital Beings (DBs), modeled using dynamic systems and genetic algorithms. We have successfully tested the use of the DBs by reproducing observation in previously made studies using rats and humans. Among these studies, we highlight those on how the bacteria in an individual’s stomach could influence their eating behavior and how a controlled and continuous diet can affect the longevity of a certain population. Our results point that the Digital Beings can be used as a tool for supporting the devising of experiments and corroborating with theoretical hypotheses, reducing the number of in vivo tests.
I Introduction
Food is strongly related to a given peoples’ history, society and religionkiple2000cambridge ; tannahill1988food , being a main feature in the definition of cultural identitykittler2011food ; montanari2006food . Thinking of feeding simply as one of the mechanism that sustains our metabolism is a very simplified and inaccurate model. Nowadays, with global growth of food related problems such as obesitywang2007obesity ; puhl2009stigma ; swinburn2011global , food intolerancenwaru2014prevalence and starvationgraham1993starvation , our relation to what we eat deserves a special attention of the scientific community. The understanding of this relation can be the key for a more sustainable and healthier future for humanity.
There is a popular conception that says: the food that we eat define us. Recent studies, however, have pointed to an extension of this conception by showing the important rule that gut flora represents in food craving and intolerancealcock2014eating ; rezzi2007human ; de2013intestinal . Also, it has already been shown that there is a relationship between gut flora and human mood or behaviorschroeder2007antidepressant ; bercik2011intestinal . Some studies also pointed that the systemic ingestion of a kind of food by a person can cause specific bacteria to develop as part of its gut flora, as it’s the case of seaweedhehemann2010transfer or other cellulose rich foodsde2010impact . The scientific community is now looking at food with a new perspective, focusing on the host-microbiota relationship mediated by it.
Comprehending this relationship can be very advantageous for the future of medicine, since a research front points towards a gut flora based therapy for obesitycastaner2018gut ; kallus2012intestinal , diabeteswen2008innate ; cani2008changes , bowel syndrometana2010altered , liver diseasesle2012intestinal ; schnabl2014interactions ; mouzaki2013intestinal and even depressionlotrich2011role ; bailey2011exposure , among many others that have already been tested. These therapies are usually done by means of the use of probiotics, prebiotics and antibiotics in order to modulate the population of a specific bacteria in the gut flora.
The majority of those studies are made in live specimens, usually rats, and then subsequently tested in humans. Others choose to work with in vitro tests before the in vivo ones. This is expected, since there is little theoretical support for the hypotheses and explanations in this field. Part of this can be related to the fact that it is a new, thus under development, area of research. The systems focused are very complex and show many interactions that are already being discovered and debated by the scientific community.
Now, computer science have been used as an important ally in understanding medicine and biology problems or systemsnasica2015amyloid ; hallet2015systematic ; portell2018microscale . Simulations have already been used to model bacterial development and complex interactions in ecologic systems, with highlight to studies using dynamical systemsgonze2018microbial ; bucci2016mdsine , game theorylambert2014bacteria and evolutionary algorithmsheilbuth2015estimation .
In this paper we propose a theoretical model that captures the main features of the actual proposed mechanisms of host-gut bacteria interactions. Our model combines two main features: The first is a dynamical system to simulate the bacteria-host relation inside a hypothetical host that we have called a Digital Being (DB). The second is an evolutionary algorithm that models the changes in a DB population which appear due to external pressure to which it is exposed. Our model was tested by comparing to previous results obtained from experiments on rats on previously published studies, regarding alimentary compulsion and lifespan. Our results show that the DB can be used efficiently as a platform to test hypotheses in this kind of study, giving theoretical feedback, reducing the overall costs and cutting down on the number of living animal subjects.
II Methodology
The proposed model that we studied is based on some basic assumptions on the nature of the host-microbiota system, which aims to represent the physical reality of the system:
-
1.
Three bacteria populations compose the DB (host) gut flora. The number of specimens for each kind of bacteria at a given moment shall be called , and .
-
2.
The DB diet is composed basically of three types of food, each of which favors individually one of the three kinds of bacteria. The proportion of the type of food associated to bacteria that the DB ingests at a given moment will be called . The same notation shall be used for the other two types of food.
-
3.
The host eats at regular intervals, such that we associate to each individual DB two characteristic times: (time interval at which the bacteria environment is food rich) and (time interval at which the bacteria environment is food poor).
-
4.
The bacteria populations decay over time naturally, with a half-life (the time needed for a given bacteria population to become halved) which we shall call for population . In the dynamical system, we shall make use of a set of constants, namely for population A, representing the decay rate of the bacteria population. The same notation shall be used for populations and .
-
5.
When exposed to a food rich environment, the populations of bacteria grow over time, with a doubling-time (the time needed for a given population to become twice what it was) we shall call for population . The growth rate is influenced linearly by the abundance of the respective bacteria’s given type of food (our values), with the proportionality constant given by the ’s in the dynamical system. The same notation shall be used for populations and .
-
6.
There is a mechanism through which the bacteria can influence the DB eating behavior. This process can be treated in many ways, and we shall use a simple set of constants (, and ) to regulate this mechanism. These constants also incorporate the interaction with any DB related agent other than the three bacteria we are working with, e.g. other bacteria populations, or even hypothetical diseases.
-
7.
Extinction or overpopulation of any type of bacteria will kill the host DB. We call extinction when a population fall under 0.1% of the initial average population (i.e., ) and overpopulation when a population gets bigger than a value 1000 times this initial average.
When considering a different system, different assumptions may have to be made. It is important to understand that these assumptions are in fact what we consider as hypotheses. If the simulations don’t behave exactly like the system that’s being simulated, it’s probably because one or more of the considerations we made are, in fact, wrong or that we forgot something important. This is one of the best payoffs given by numerical models: A wrong hypothesis usually means loss of implementation and processing time, coupled with the human effort made in putting the ideas into the model. If this hypothesis test had been done via an experiment, a wrong model could represent a larger cost, which usually comprehends human working time summed with laboratory materials and, sometimes, animal lives.
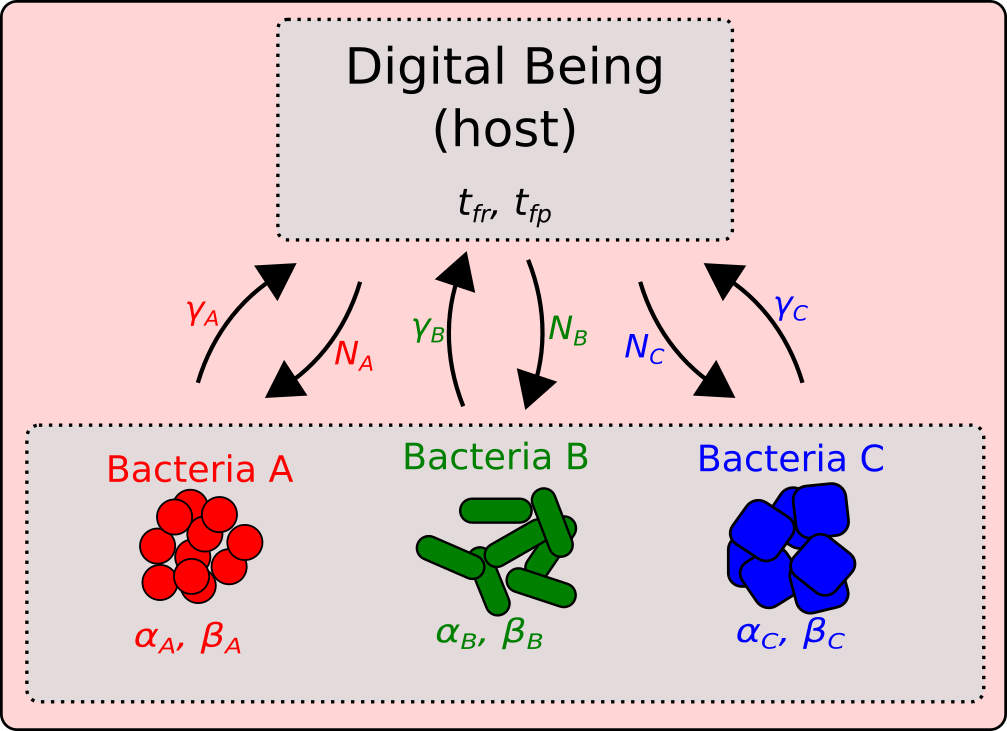
A graphic and schematic representation of all the constants we introduced in the model can be seen in figure 1. In modeling the life of one individual DB and its interactions with their gut flora, we first need to define the equations that represent the features presented as the assumptions. In order to make our set of time evolution equations easier, we calculate the following constant associated to our proposed values:
In which denotes the natural logarithm. The same equations are valid for populations and . The mechanism of food craving that responds to bacteria stimulus will be modeled by a simple proportional division, where the weight is the bacteria stimulus strength, which we are representing as our constants, multiplied by the bacteria population at the moment the meal starts. The food preferences of the DB is directly associated to the amount of food available to the bacteria in its gut flora, so it can be better represented by this variable. So, the food availability for bacteria will be modeled as the following example for population related food:
Where , and express the , and populations at the moment in which the respective DB meal will start. The same equations apply to populations and . Considering these variables previously defined, and our assumptions about the system studied, we can write the following set of time evolution equations for the DB bacteria populations, properly written for Euler integration:
At a first glance these equations seem independent of each other, but in fact we have six dynamic equations: Three for population evolution and three for food availability evolution. From this, one can derive a set of differential equations for the same problem, but we shall work with the equations as shown, which are more suitable for a direct numerical implementation. As convention, we choose as standard values and , where stands for arbitrary time unit, which we shall omit from now on.
For direct applications, the values have to be chosen in real world units. For example, one can express in CFU/mL and in seconds. Anyway, we will focus on the behavior of the DBs, not directly comparing the values with real world ones. That being said, we will present our variables as being dimensionless.
III Application and results
Let’s now apply the model to a test problem. First, we will show the evolution of the bacteria populations in the life cycle of a DB. For this, we choose arbitrary values for the ’s, ’s and ’s, as well as the DB initial bacteria population and feeding cycle. The set of values and the graphical behavior of the dynamical variables can be seen in fig. 2.
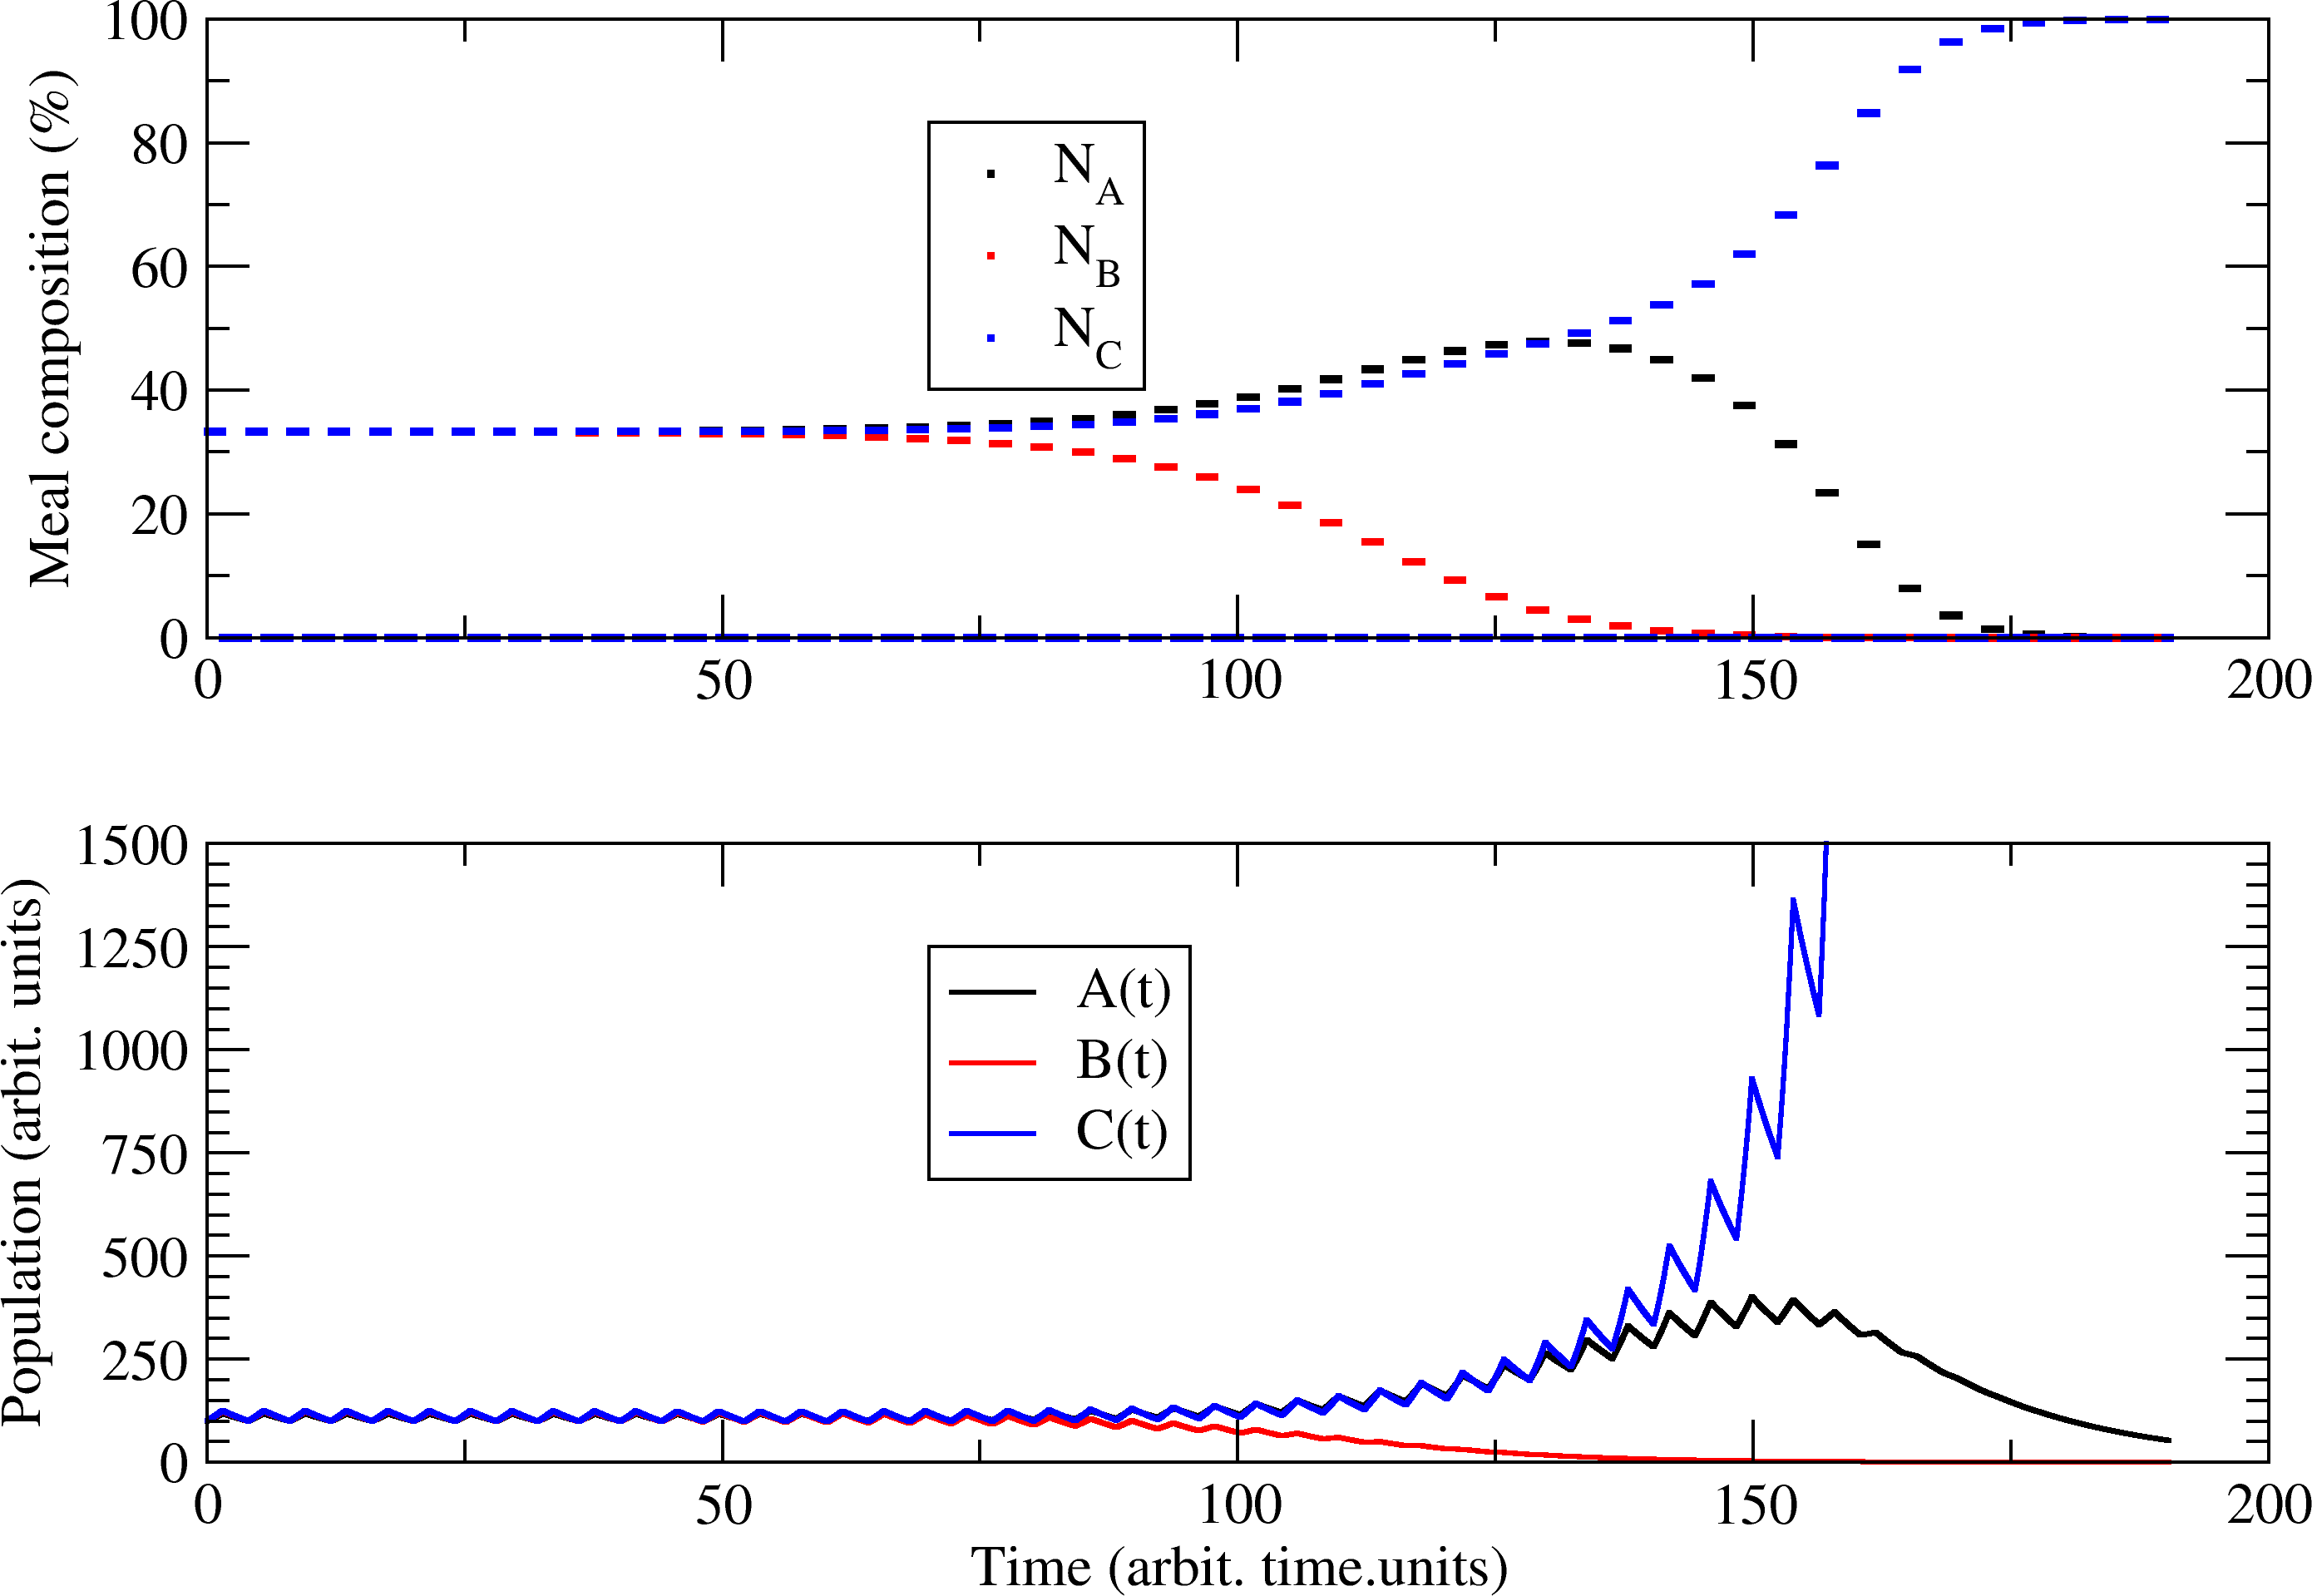
As the values were set such that bacteria C influences a little more in food preferences, the other species were rapidly suppressed by C, even with their larger population variation rates. It elucidates the already proposed idea that food preferences play a positive feedback cycle with bacteria population. However, as is a variable that derives from the host-bacteria relationship, it is natural to think that evolutionary processes can change this value in order to enlarge the lifespan of our DB.
To test the previous hypothesis, we set an evolutionary algorithm that starts with a random 1000 DBs population and evolves it, positively selecting the DBs that have survived the longer. Through 1000 generations, the 25% DBs with longer lifespans were chosen to generate asexually 4 offspring each. Normally, one feature of the DB son differs from its parent in as much as 2%, preserving all the other features identical. So, with a chance of 0.2%, we considered a total mutation of this random characteristic, assuming completely independent values from the ones in its DB parent. , and were set to be in a range from 10.0 to 50.0 in the first step of each generation. Also, , , , and .
The behavior of this DB population’s lifespan over the generations can be seen as the black line in fig. 3. The results successfully pointed that DB populations can evolve over time and adapt their relationship with bacteria. After 1000 generations, the evolution was really slow, and the population assumed a lifespan of .
Other possible hypothesis that can be tested at this point is that populations of individuals that are less susceptible to diet fluctuations, following a solid and constant diet over life, can evolve into larger lifespans than the one we observed previously. To test this, we repeated the evolutionary process described before, excluding the ’s and making for . The values are let to evolve, being always larger than 0.1 and preserving the relation .
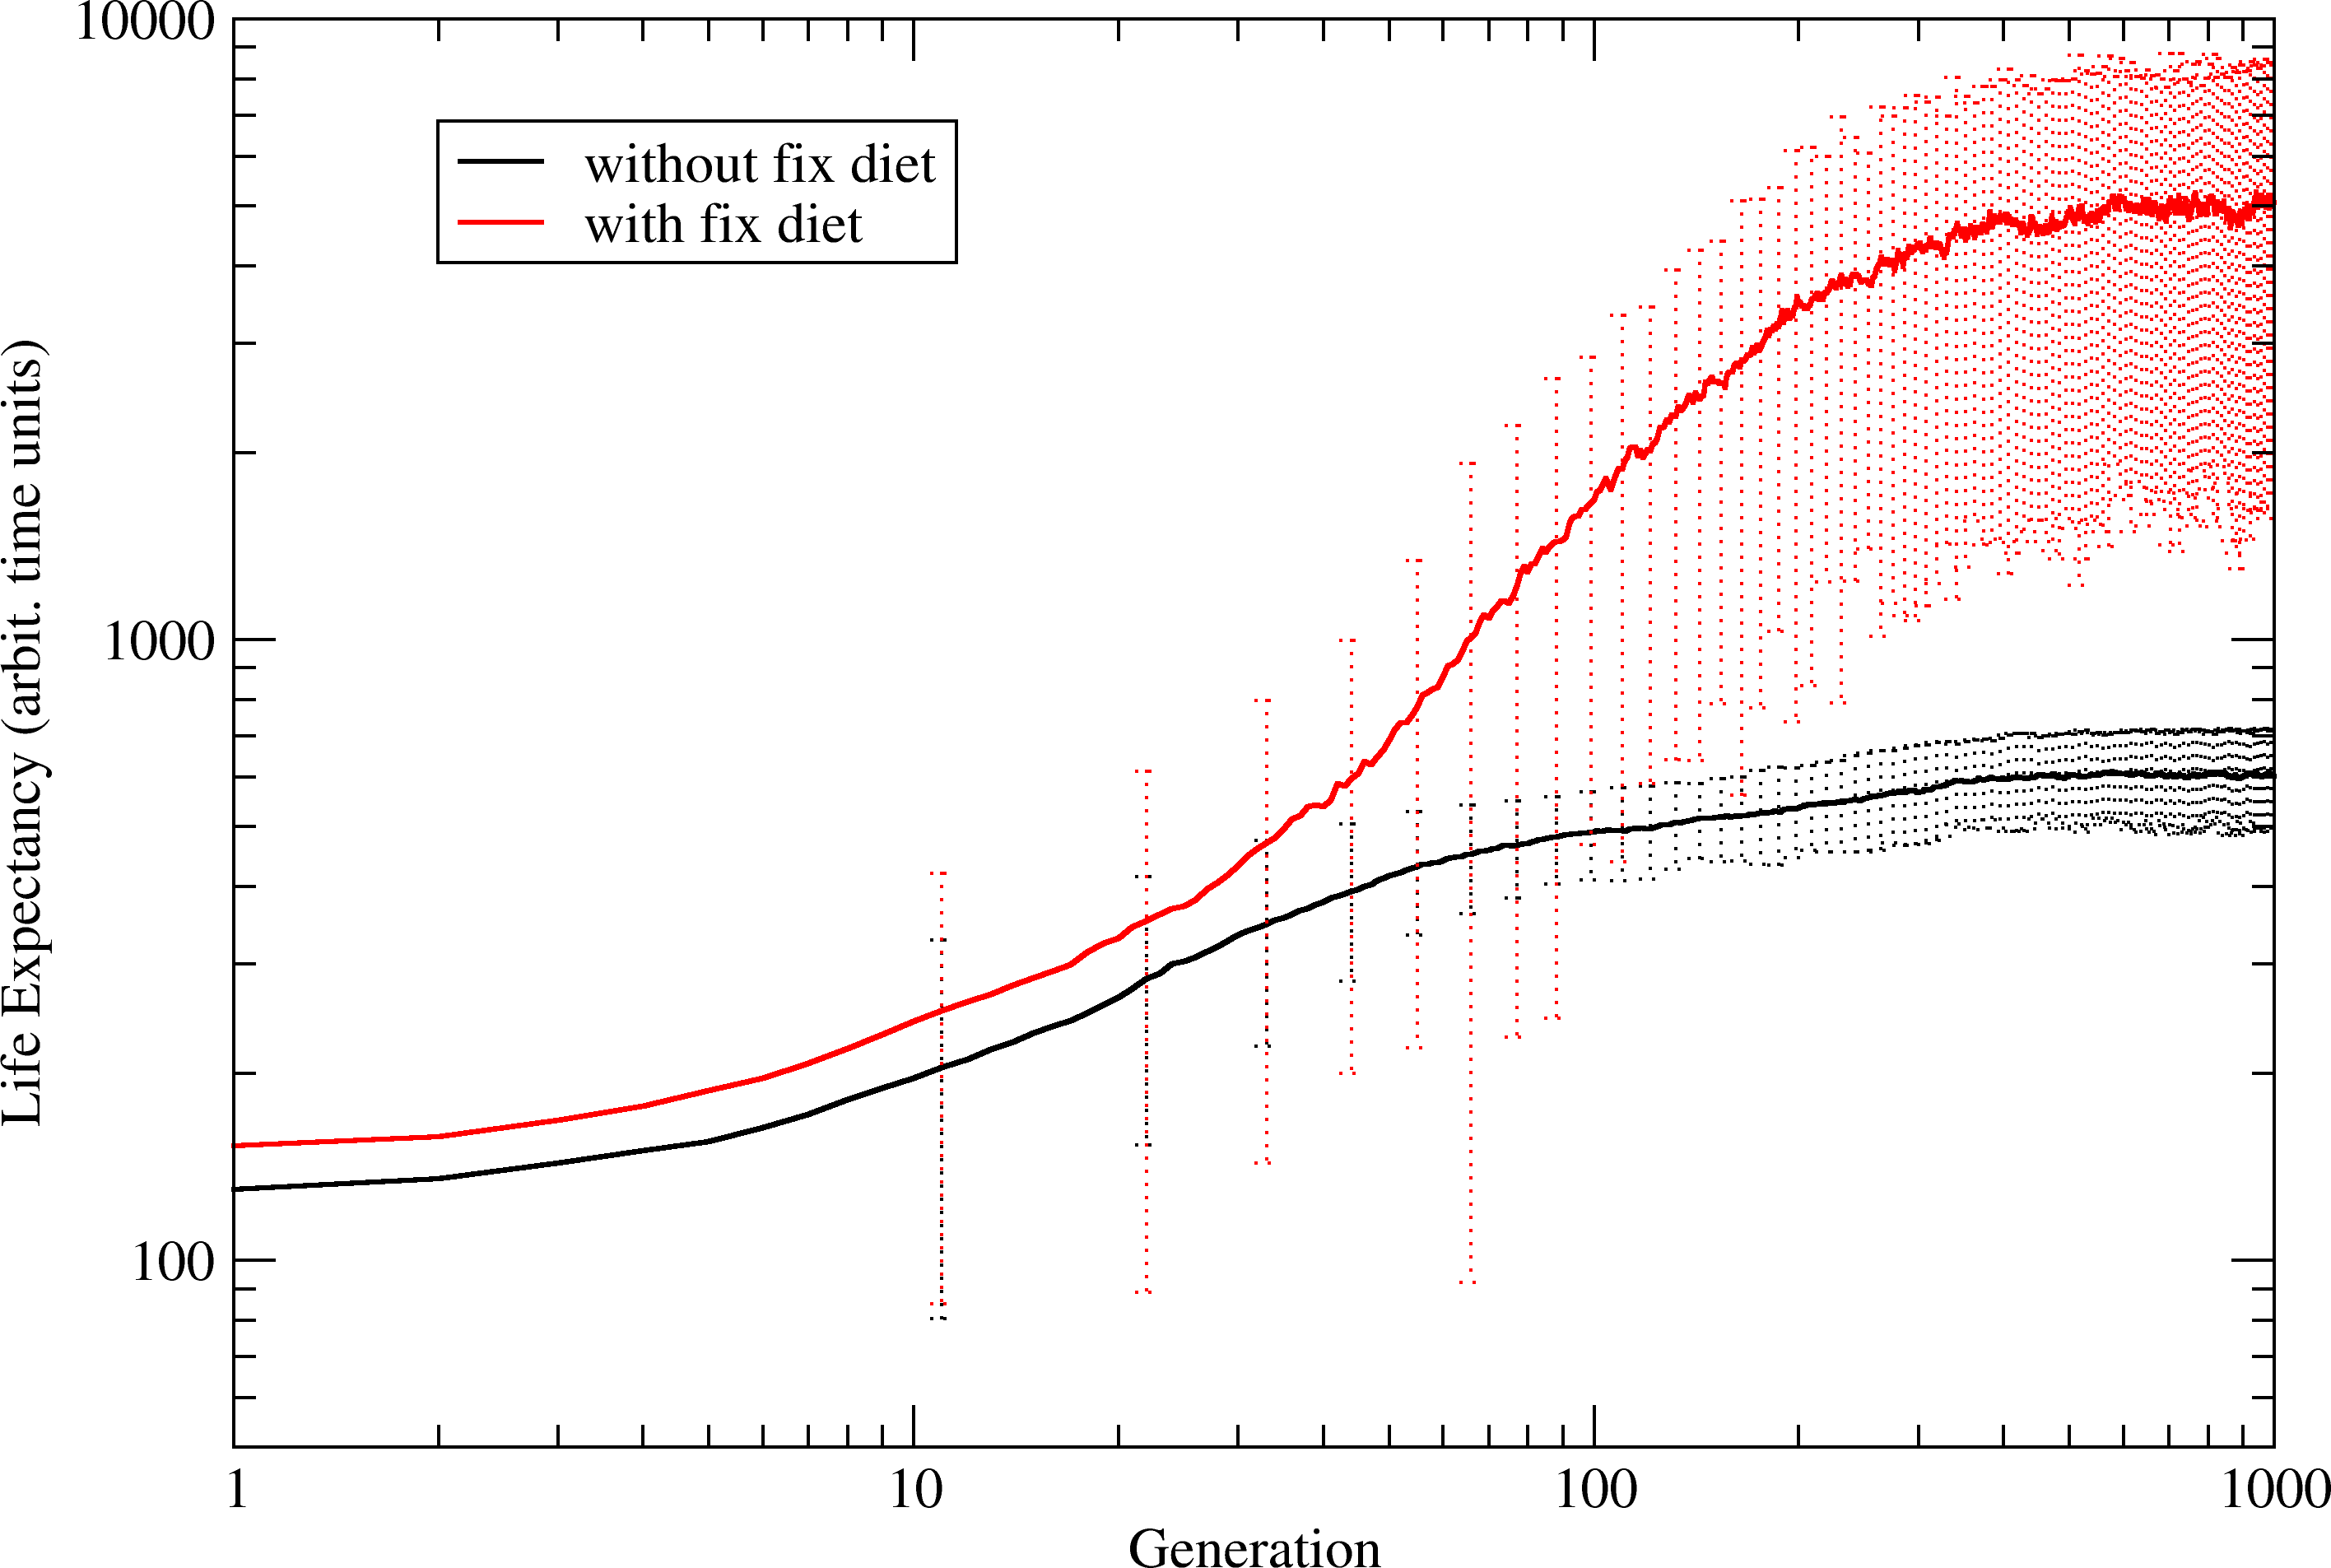
As can be seen again in fig. 3, the same behavior we saw before was repeated, but this time with an immediate gain in life span, which grows over the generations, stabilizing in a lifespan of . Our results point that DB populations that eat following controlled diets can evolve longer lifespan over generations than DBs from a population that follows an impulsive diet (in this case, generated by bacteria).
On the other hand, it revealed more than that: We observed that long lifespans seems to be a characteristic associated to fixed diets, which is only intensified in the evolutionary process. This can be exemplified when looking to the first random populations, which have a lifespan of eating a rigid diet, while eat a bacteria induced one. So, even confirming our hypothesis, we observed that the evolutionary process simply intensifies the effects that are already present when we compare both random initial populations.
IV Conclusions
Attending to the crescent attention that the host-microbiota relationship is gaining in the literature, our aim here was to give support to this important field of research. In this work, we presented a theoretical and computational tool to test hypotheses and study problems that arrive from the long and complex interactions between the gut flora and its host’s brain. We developed a model based on the dynamical systems’ description of a hypothetical specimen, which we called a Digital Being, and its relation with its gut flora. From the tests, we observed that the DBs indeed exhibit the food craving caused by host-bacteria interaction, and its susceptibility in the choice of the parameters .
Combining this model with an evolutionary algorithm, we were able to study the impact of this relationship through generations and see how the mutual adaptations develop. We performed tests over two controlled populations of DBs: One evolved with microbiota induced eating behaviors and other with a fixed diet followed over all its life. From these tests, we confirmed that the population with a fixed diet evolved to an approximately ten times larger lifespan than the population that is subject only to bacteria induced behavior. This confirmed our hypothesis that the evolutionary process can enhance the variables of the specimens in order to maximize lifespan, but also pointed that fixed diets usually induce longer lives in random populations, independent of evolution itself. The evolution only intensifies this difference. All these results are in good agreement and give new insights into previous works on the literaturealcock2014eating . As our aim in this work was just to show the efficiency of our methodology, we shall not delve further into this matter.
With this in mind, we are presenting our DB based model for bacteria-host interaction to the scientific community. Since DB simulations are very adaptable and can be written and run on average computers, we hope that it can become an useful tool to support researchers in biology and medicine, by giving them theoretical support and controlled conditions’ tests over proposed hypothesis, reducing costs and saving animal lives.
We, the authors, acknowledge to Capes, Fapemig, CNPq, Finep and UFJF for all the support provided on this work. We are also tankful to our colleagues from the Departamento de Física - UFJF, for the time spent in discussions that indirectly helped on this work.
References
- [1] Joe Alcock, Carlo C Maley, and C Athena Aktipis. Is eating behavior manipulated by the gastrointestinal microbiota? evolutionary pressures and potential mechanisms. Bioessays, 36(10):940–949, 2014.
- [2] Michael T Bailey, Scot E Dowd, Jeffrey D Galley, Amy R Hufnagle, Rebecca G Allen, and Mark Lyte. Exposure to a social stressor alters the structure of the intestinal microbiota: implications for stressor-induced immunomodulation. Brain, behavior, and immunity, 25(3):397–407, 2011.
- [3] Premysl Bercik, Emmanuel Denou, Josh Collins, Wendy Jackson, Jun Lu, Jennifer Jury, Yikang Deng, Patricia Blennerhassett, Joseph Macri, Kathy D McCoy, et al. The intestinal microbiota affect central levels of brain-derived neurotropic factor and behavior in mice. Gastroenterology, 141(2):599–609, 2011.
- [4] Vanni Bucci, Belinda Tzen, Ning Li, Matt Simmons, Takeshi Tanoue, Elijah Bogart, Luxue Deng, Vladimir Yeliseyev, Mary L Delaney, Qing Liu, et al. Mdsine: Microbial dynamical systems inference engine for microbiome time-series analyses. Genome biology, 17(1):121, 2016.
- [5] Patrice D Cani, Bibiloni Rodrigo, Claude Knauf, Aurélie Waget, Audrey M Neyrinck, Nathalie M Delzenne, and Rémy Burcelin. Changes in gut microbiota control metabolic endotoxemia-induced inflammation in high-fat diet-induced obesity and diabetes in mice. Diabetes, 2008.
- [6] Olga Castaner, Albert Goday, Yong-Moon Park, Seung-Hwan Lee, Faidon Magkos, Sue-Anne Toh Ee Shiow, and Helmut Schröder. The gut microbiome profile in obesity: A systematic review. International journal of endocrinology, 2018, 2018.
- [7] Carlotta De Filippo, Duccio Cavalieri, Monica Di Paola, Matteo Ramazzotti, Jean Baptiste Poullet, Sebastien Massart, Silvia Collini, Giuseppe Pieraccini, and Paolo Lionetti. Impact of diet in shaping gut microbiota revealed by a comparative study in children from europe and rural africa. Proceedings of the National Academy of Sciences, 107(33):14691–14696, 2010.
- [8] Carolina de Weerth, Susana Fuentes, Philippe Puylaert, and Willem M de Vos. Intestinal microbiota of infants with colic: development and specific signatures. Pediatrics, pages peds–2012, 2013.
- [9] Didier Gonze, Katharine Z Coyte, Leo Lahti, and Karoline Faust. Microbial communities as dynamical systems. Current opinion in microbiology, 44:41–49, 2018.
- [10] George G Graham. Starvation in the modern world. New England Journal of Medicine, 328(14):1058–1061, 1993.
- [11] Julie Hallet, Brice Gayet, Allan Tsung, Go Wakabayashi, Patrick Pessaux, and 2nd International Consensus Conference on Laparoscopic Liver Resection group. Systematic review of the use of pre-operative simulation and navigation for hepatectomy: current status and future perspectives. Journal of Hepato-Biliary-Pancreatic Sciences, 22(5):353–362, 2015.
- [12] Jan-Hendrik Hehemann, Gaëlle Correc, Tristan Barbeyron, William Helbert, Mirjam Czjzek, and Gurvan Michel. Transfer of carbohydrate-active enzymes from marine bacteria to japanese gut microbiota. Nature, 464(7290):908, 2010.
- [13] Nádia M Heilbuth, Valter R Linardi, Andrea S Monteiro, Roney A da Rocha, Luis A Mimim, and Vera L Santos. Estimation of kinetic parameters of phenol degradation by bacteria isolated from activated sludge using a genetic algorithm. Journal of Chemical Technology & Biotechnology, 90(11):2066–2075, 2015.
- [14] Samuel J Kallus and Lawrence J Brandt. The intestinal microbiota and obesity. Journal of clinical gastroenterology, 46(1):16–24, 2012.
- [15] Kenneth F Kiple and Kriemhild Coneè Ornelas. The Cambridge world history of food, volume 2. Cambridge University Press, 2000.
- [16] Pamela Goyan Kittler, Kathryn P Sucher, and Marcia Nelms. Food and culture. Cengage Learning, 2011.
- [17] Guillaume Lambert, Saurabh Vyawahare, and Robert H Austin. Bacteria and game theory: the rise and fall of cooperation in spatially heterogeneous environments. Interface focus, 4(4):20140029, 2014.
- [18] Tiphaine Le Roy, Marta Llopis, Patricia Lepage, Aurélia Bruneau, Sylvie Rabot, Claudia Bevilacqua, Patrice Martin, Catherine Philippe, Francine Walker, André Bado, et al. Intestinal microbiota determines development of non-alcoholic fatty liver disease in mice. Gut, pages gutjnl–2012, 2012.
- [19] Francis E Lotrich, Hani El-Gabalawy, Lyn C Guenther, and Carl F Ware. The role of inflammation in the pathophysiology of depression: different treatments and their effects. The Journal of Rheumatology Supplement, 88:48–54, 2011.
- [20] Massimo Montanari. Food is culture. Columbia University Press, 2006.
- [21] Marialena Mouzaki, Elena M Comelli, Bianca M Arendt, Julia Bonengel, Scott K Fung, Sandra E Fischer, Ian D McGilvray, and Johane P Allard. Intestinal microbiota in patients with nonalcoholic fatty liver disease. Hepatology, 58(1):120–127, 2013.
- [22] Jessica Nasica-Labouze, Phuong H Nguyen, Fabio Sterpone, Olivia Berthoumieu, Nicolae-Viorel Buchete, Sébastien Coté, Alfonso De Simone, Andrew J Doig, Peter Faller, Angel Garcia, et al. Amyloid protein and alzheimer’s disease: When computer simulations complement experimental studies. Chemical reviews, 115(9):3518–3563, 2015.
- [23] BI Nwaru, L Hickstein, SS Panesar, G Roberts, A Muraro, A Sheikh, EAACI Food Allergy, and Anaphylaxis Guidelines Group. Prevalence of common food allergies in europe: a systematic review and meta-analysis. Allergy, 69(8):992–1007, 2014.
- [24] Xavier Portell, Valérie Pot, Patricia Garnier, Wilfred Otten, and Philippe C Baveye. Microscale heterogeneity of the spatial distribution of organic matter can promote bacterial biodiversity in soils: Insights from computer simulations. Frontiers in microbiology, 9, 2018.
- [25] Rebecca M Puhl and Chelsea A Heuer. The stigma of obesity: a review and update. Obesity, 17(5):941–964, 2009.
- [26] Serge Rezzi, Ziad Ramadan, Francois-Pierre J Martin, Laurent B Fay, Peter Van Bladeren, John C Lindon, Jeremy K Nicholson, and Sunil Kochhar. Human metabolic phenotypes link directly to specific dietary preferences in healthy individuals. Journal of proteome research, 6(11):4469–4477, 2007.
- [27] Bernd Schnabl and David A Brenner. Interactions between the intestinal microbiome and liver diseases. Gastroenterology, 146(6):1513–1524, 2014.
- [28] Frederick A Schroeder, Cong Lily Lin, Wim E Crusio, and Schahram Akbarian. Antidepressant-like effects of the histone deacetylase inhibitor, sodium butyrate, in the mouse. Biological psychiatry, 62(1):55–64, 2007.
- [29] Boyd A Swinburn, Gary Sacks, Kevin D Hall, Klim McPherson, Diane T Finegood, Marjory L Moodie, and Steven L Gortmaker. The global obesity pandemic: shaped by global drivers and local environments. The Lancet, 378(9793):804–814, 2011.
- [30] C Tana, Y Umesaki, A Imaoka, T Handa, M Kanazawa, and S Fukudo. Altered profiles of intestinal microbiota and organic acids may be the origin of symptoms in irritable bowel syndrome. Neurogastroenterology & Motility, 22(5):512–e115, 2010.
- [31] Reay Tannahill. Food in history, volume 47. Penguin London, 1988.
- [32] Youfa Wang and May A Beydoun. The obesity epidemic in the united states—gender, age, socioeconomic, racial/ethnic, and geographic characteristics: a systematic review and meta-regression analysis. Epidemiologic reviews, 29(1):6–28, 2007.
- [33] Li Wen, Ruth E Ley, Pavel Yu Volchkov, Peter B Stranges, Lia Avanesyan, Austin C Stonebraker, Changyun Hu, F Susan Wong, Gregory L Szot, Jeffrey A Bluestone, et al. Innate immunity and intestinal microbiota in the development of type 1 diabetes. Nature, 455(7216):1109, 2008.
Appendix: Detailed Analysis
.1 Initial Populations
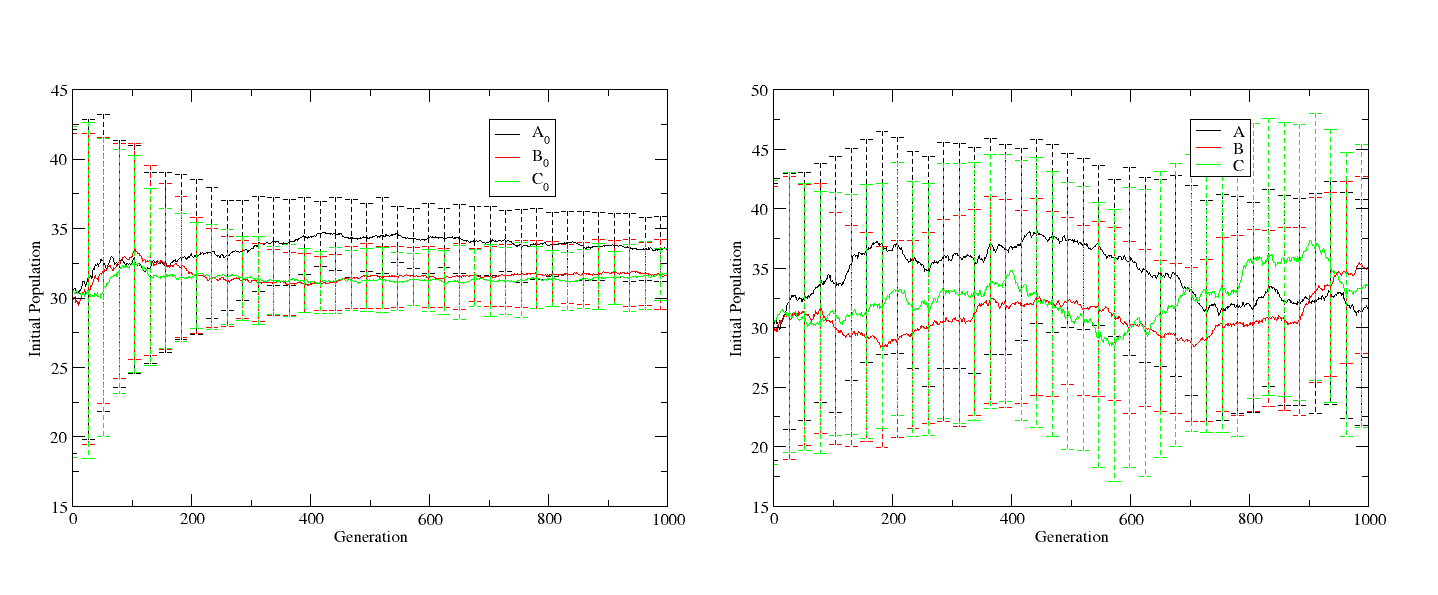
We begin our analysis with the initial population parameters. The graphs showing the evolution of their mean values, for both DB types, can be seen in Figure 4. From the diet DB graph, we see that even though the mean values change slightly over time, with no very significant changes observed, but the deviation are such that, in the end, it can be considered that no difference in the initial populations occur. For the standard DB, however, one of the bacteria attains a greater initial population, while the population of the other two evolve together with the same value. This difference in the evolution behavior may be related to a longer lifespan, but given that for the diet DBs, the ones with the longest lifespan, the change in the initial population is not significant, the influence should be minimal.
.2 Half-life Time
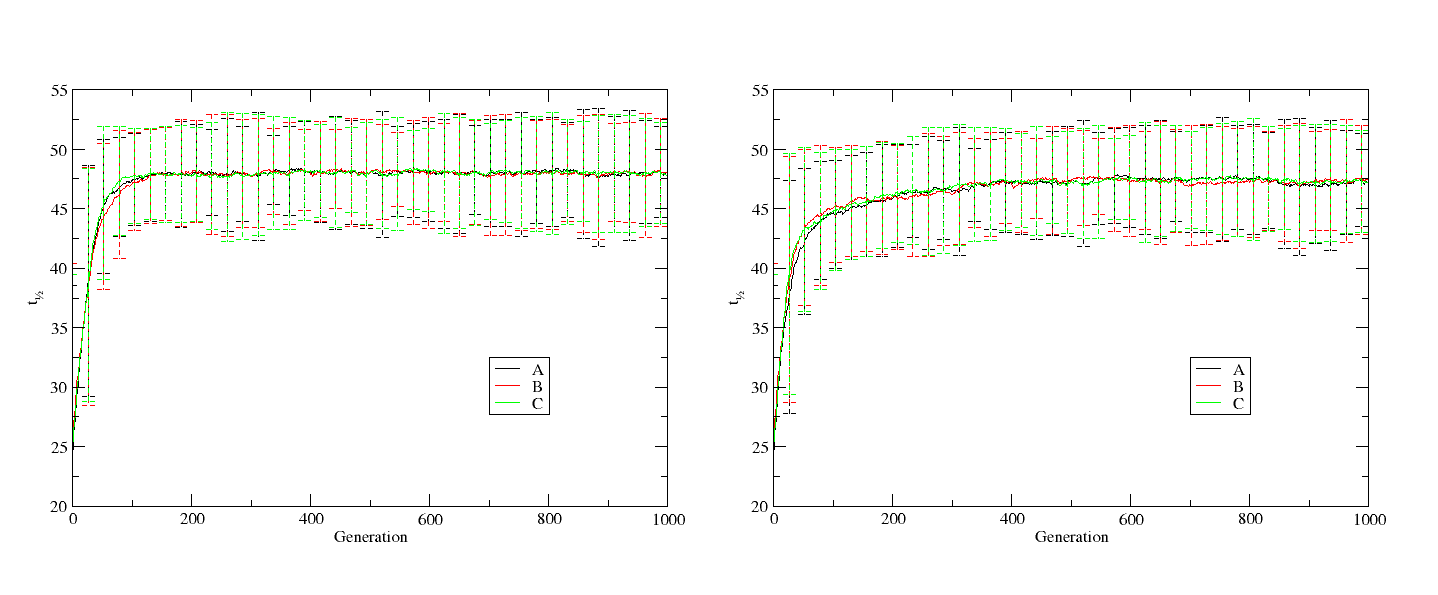
The next parameter is the the half-life time. This parameter is associated with the reduction of the bacteria populations throughout the dynamics, and thus pose an important parameter in the equilibrium of the gut flora in the Digital Beings. The graphs displaying the evolution can be seen in Figure 5.
The behavior observed in the evolution of this parameter is analogous for both types of DB. There is a significant increase that takes place still at the initial generations, in which the value of the parameter almost saturates the upper limit stipulated for the simulation, and is kept balanced throughout the rest of the evolution. This behavior happens for all three kinds of bacteria, and the value attained is also virtually the same. It indicates that this parameter is essential to the increase in the lifespan of the DBs, and higher values are most valued.
There is, however, a small difference between the standard and diet DB parameters. The increase in the value for the standard DB happens faster, whereas for the diet DB the parameter takes a longer time to reach it’s final value. This hints that the increase in the parameter for the diet DB happens in greater balance with changes in other parameters, and in the standard DB it is more independent.
.3 Doubling Time
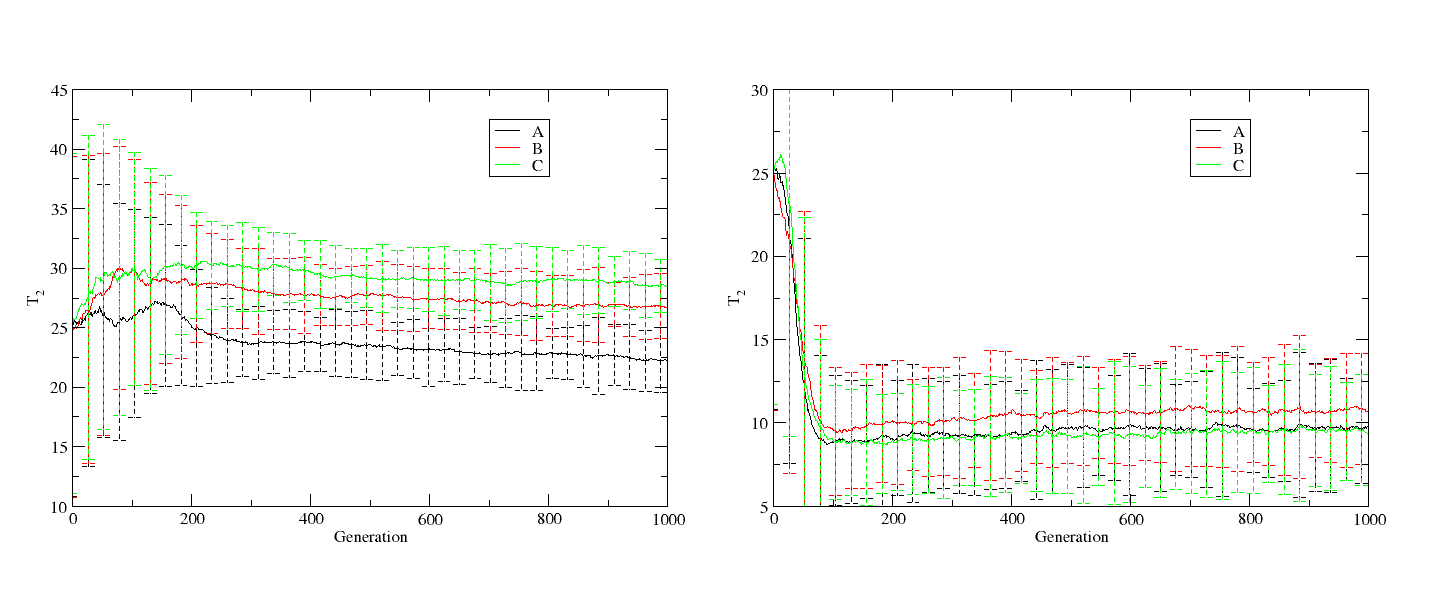
After looking at the half-life time, the question on the behavior of the doubling time naturally arrives. The doubling time dictates the growth rate of the bacteria in the gut flora, and together with the half-life time, help to maintain a population balance in the DBs bacteria numbers, being an important factor in the lifespan, remembering that the causes of death of the DBs are either overpopulation or disappearance of a given bacteria in its microbiota. The graphs presenting its evolution are shown in Figure 6. Unlike the half-life time, the behavior of the doubling time is completely different for each DB type.
The most striking detail is that the behavior of the doubling time, for the diet DBs, is similar to that of the half-life time, but now with a sudden reduction in the first generations, with a later slow evolution to its final value. This final value, however, is far from the lower limit imposed on the simulation, which is . Notice also that, albeit the mean value for one of the populations differ, when considering the standard deviation we see that they are substantially the same, and they evolve together for all populations.
For the standard DB, the difference is radical compared to the diet DB. The overall deviation in the values is significantly smaller, with two populations showing an overall increase in the value, with the same deviation compared to initial values. One of the populations achieve a different value – smaller – than the other two, even considering the deviation. Notice also that the values do not stabilize at a value, like the diet DB, but slowly change until the end of the evolution. The mean values form a pattern that shall be explored further in the conclusions.
.4 Full and Empty Stomach Time
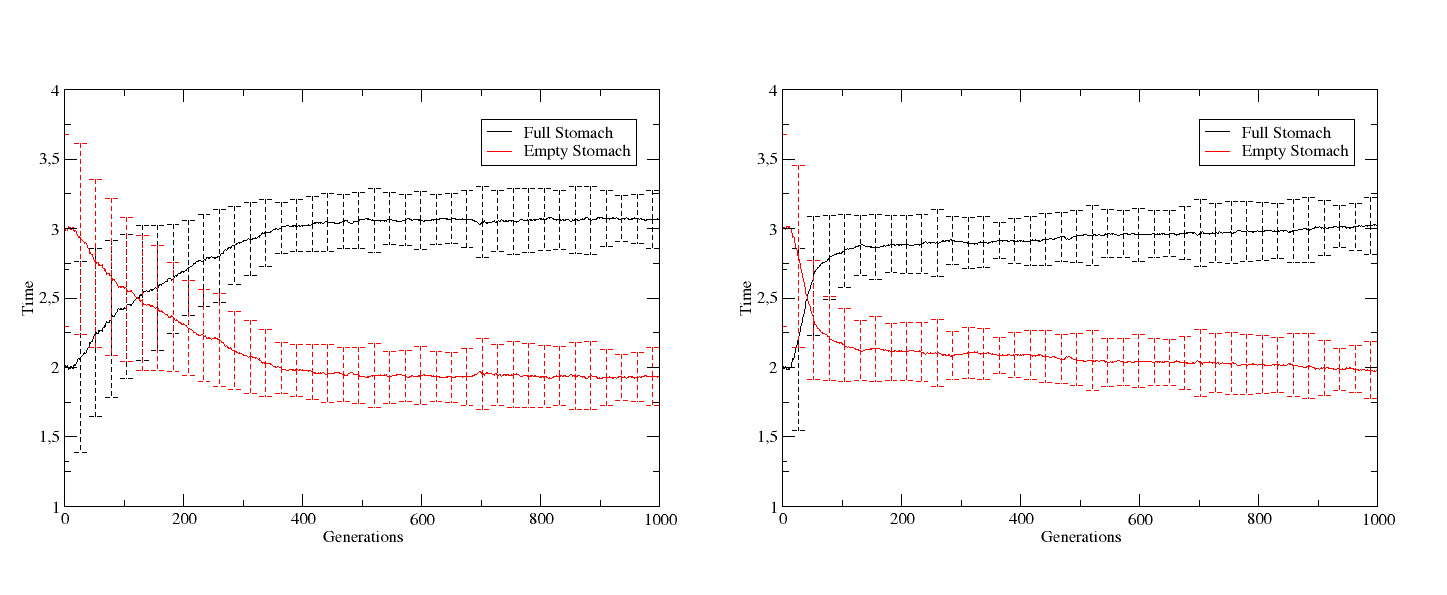
The doubling time determines the rate in which the number of bacteria increase, but they only proliferate when there is food on the DB’s stomach. Therefore, the amount of time in which the DB has, or not, food in its stomach is important. This characteristic is regulated by the full stomach time and empty stomach time parameters, and as such it is important to understand their evolution. The graphs showing their evolution are shown in Figure 7.
The same overall behavior is seen for both DB types: the empty and full stomach time values are reversed, remembering that the values are constrained by their sum. Nonetheless, the details of the evolution is different for each type of DB. For the diet DBs, the reversal happens more suddenly, but the subsequent change happens slowly, with the total reversal – the moment when one parameter assumes the initial value of the other – happening only at later generations. The value of the parameters also do not stabilize: there is a non-zero inclination in both curves.
For the standard DBs, the reversal is slower, taking a longer time to happen, but the total reversal of the parameters happens much faster than that of the diet DBs. After the total reversal, those parameters increase until a final value, at which they remain fixed throughout the rest of the evolution. Notice that again we see a pattern in which the diet DB’s parameters increase slower than the standard DB parameters. We shall delve further into this detail in the conclusions.
.5 Feeding Pattern
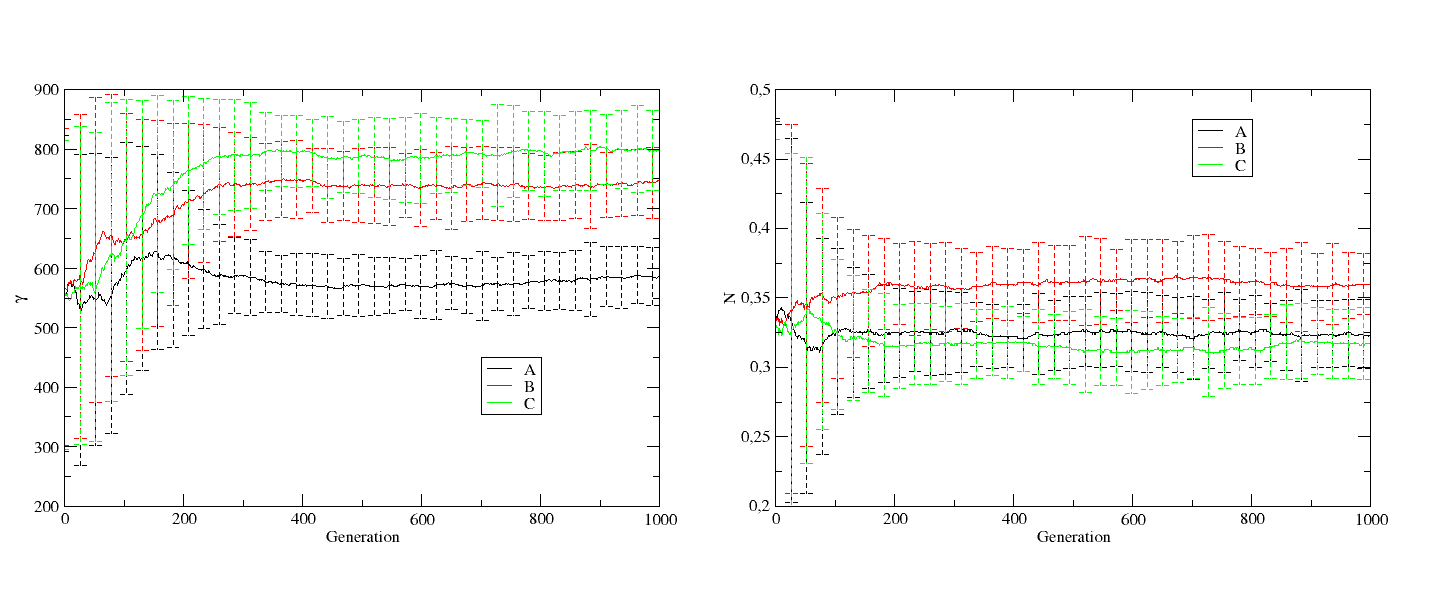
At last, the analysis is not complete without talking about the feeding pattern. It is the most important parameter, around which the entire study revolves, important to both the growth and decline of the bacteria populations, and the one that most deeply regulates it, without being a characteristic dependent on the bacteria alone. We now look at its evolution in dept.
The feeding pattern is governed by different parameters in the standard and diet DBs. In the former, the proportion of each kind of food that the DBs ingest throughout a generation varies during its entire life, and cannot be used as a representative of the generation’s feeding pattern. Nonetheless, these are influenced by the parameters, which represent the sensibility of the DB to the tastes of the bacteria. These parameters are dependent on the bacteria in their gut microbiota, and thus are fixed throughout an entire DB generation, therefore being the best parameter to represent the evolution of the feeding pattern for the standard DBs.
The diet DBs, as their name suggest, follow a strict diet, therefore their sensibility to the bacteria preferences is irrelevant (indeed, the parameters are zero for the diet DBs). Nonetheless, since their diet is fixed for each DB in a given generation, this diet itself represent their feeding pattern. In terms of the parameters used in the simulation, we are talking about the proportion of each kind of food that they ingest.
This difference in the parameters representing the feeding pattern is the main difference in the characterization of the DB types, and as mentioned before, is central to the study. The graphs showing the evolution of the feeding pattern, each type of DB with its relevant parameter, can be seen in Figure 8.
For the diet DBs, they develop a preference for the kind of food associated to one type of bacteria, represented by the greater amount of that kind of food ingested by the DBs. As for the other two, the difference is two slim that do not overcome the error bars, meaning that there is no significant change in interest between one another. The final pattern is a gap between two of the food preferences and the third one.
For the standard DBs, the scenario is different. We observe that the DBs develop a greater taste for the kind of food associated with two distinct bacteria populations, with this taste competing, as the difference in their values is no greater than their deviation. The taste for the food associated with the third bacteria is significantly smaller than the others, meaning it is less desired by the DBs. This is the opposite to the scenario seen for the diet DBs, in which we observe only one dominant bacteria, with the other two competing at smaller values.
This completely opposite result is one of a kind among the parameters, and is very important. Remembering that after the evolution the diet DBs can achieve lifespan values almost 10 times the greater values achieved by the standard DB, the difference shown in their feeding behavior poses the only factor with a significant enough difference to justify this result. None of the other parameters have shown a difference so drastic to justify the obtained results.
Appendix A Conclusions
Throughout the text we analyzed the evolution of all the main parameters of our models, in order to compare their behavior for both the standard and the diet Digital Beings, and to obtain their relation to the increase in lifespan for the DBs. First we note that none of the bacteria had any special advantage over the others, thus what is relevant in the observed results aren’t the numbers or the characteristic for every bacteria, but the overall pattern and behavior shown by the parameters.
From the analysis, we observed that the initial population doesn’t seem to have a strong influence in he increase in lifespan, given the fact that its variation was slight, and in the diet DB scenario no significant variation was seen whatsoever. In order to have a long lifespan, the bacteria in the DB’s gut must take a long time to die, as evidenced by the spike in their half-life time values, and no bacteria must take longer to die than the other. Besides, they can’t take too long to multiply, as shown by the evolution of the doubling time parameter: the shorter the time they take to multiply, the longer the DBs are expected to live, as evidenced in the diet DB parameter.
Coupled to that, it is clear that the DBs must spend most of their time with a ful stomach, and a lesser time with an empty stomach, in order to allow for the bacteria population to stabilize. Most importantly, however, its the feeding pattern, which governs all of the above. There was a total opposition on the patterns, and from the diet DB pattern there’s a hint that, for a longer lifespan, only one bacteria preference should be allowed.
These results were drawn by considering the parameters one by one. The biggest, and most interesting results, however, are obtained when we look at the evolution of the parameters as a whole, and compare the outcomes. By doing hat, we see that not only a longer half-life time and a smaller doubling time contributes to a longer lifespan, but a combination of both represent the optimal condition for the longest lifespans. On top of that, but the doubling time pattern is directly associated to that of the feeding pattern: the bacteria who receives the most amount of food is the one that takes longer to multiply, and vice-versa. This can be seen clearly when comparing both the pattern in the doubling time graphs with those on the feeding pattern graphs. One more feature that we can observe is that a longer adaptation time among the parameters seem to be key in allowing the hosts to have a longer lifespan. This longer adaptation time can be seen in the half-life time, doubling time and full and empty stomach time parameters for the diet DBs, whereas the change in the standard DB generations is faster. These characteristics combined form the structure for a long-lived Digital Being.
Nonetheless, it is important to note that these results are only valid for the single simulation we presented in the text. The genetic algorithm rely on probabilities and chance, this means that it is not deterministic. Take, for instance, the fact that even thought no bacteria had any advantage over the others, they presented different behaviors. This means that if we were to do another run of the simulation, we could expect completely different results as outputs. Thus, for the study we made, the results presented above are relevant, but if we were trying to define the reasons and characteristics that undermine the long-living characteristic of a population, we wouldn’t have enough data. If one wished to do such a study, an statistical study comparing many evolution trajectories and extracting their key characteristics would prove extremely significant, granting more general results and information, and providing a deeper insight on the mechanisms governing the interaction between the lifespan and the gut microbiota of a living being.