SN2018kzr: a rapidly declining transient from the destruction of a white dwarf
Abstract
We present SN2018kzr, the fastest declining supernova-like transient, second only to the kilonova, AT2017gfo. SN2018kzr is characterized by a peak magnitude of , peak bolometric luminosity of erg s-1 and a rapid decline rate of mag d in the band. The bolometric luminosity evolves too quickly to be explained by pure 56Ni heating, necessitating the inclusion of an alternative powering source. Incorporating the spin-down of a magnetized neutron star adequately describes the lightcurve and we estimate a small ejecta mass of M⊙. Our spectral modelling suggests the ejecta is composed of intermediate mass elements including O, Si and Mg and trace amounts of Fe-peak elements, which disfavours a binary neutron star merger. We discuss three explosion scenarios for SN2018kzr, given the low ejecta mass, intermediate mass element composition and the high likelihood of additional powering - core collapse of an ultra-stripped progenitor, the accretion induced collapse of a white dwarf and the merger of a white dwarf and neutron star. The requirement for an alternative input energy source favours either the accretion induced collapse with magnetar powering or a white dwarf - neutron star merger with energy from disk wind shocks.
1 Introduction
Within the already diverse range of explosive transients known to exist is a subset of rapidly evolving objects commonly referred to as fast transients. The definition of ‘fast’ has changed over time as more of these objects have been discovered, but in general they display rise and fall times much shorter than for a typical supernova, appearing and fading from view in a matter of weeks. Naturally, to exhibit a more rapid evolution than a typical supernova, a different explosion scenario is needed to explain the event beyond the standard single progenitor scenarios studied. Examples of fast transients include Type Iax objects such as SN2002cx (Li et al., 2003), .Ia candidates including SN2002bj and SN2010X (Poznanski et al., 2010; Kasliwal et al., 2010), Ca-rich Type I supernovae like SN2005E (Perets et al., 2010; Valenti et al., 2014) and other fast fading transients interesting in their own right like SN2005ek (Drout et al., 2013), iPTF14gqr (De et al., 2018), iPTF16asu (Whitesides et al., 2017) and KSN2015K (Rest et al., 2018). Events such as these tend to be rarer in occurrence, making up only a small fraction of the normal supernova rate. The fastest transients yet have been discovered in recent years, with the best examples being those of AT2018cow (Prentice et al., 2018) and the more recently discovered SN2019bkc (Chen et al., 2019). The fastest optical transient known is, of course, the kilonova AT2017gfo (Abbott et al., 2017; Andreoni et al., 2017; Arcavi et al., 2017; Coulter et al., 2017; Chornock et al., 2017; Cowperthwaite et al., 2017; Drout et al., 2017; Evans et al., 2017; Kasliwal et al., 2017; Lipunov et al., 2017; Nicholl et al., 2017; Tanvir et al., 2017; Pian et al., 2017; Troja et al., 2017; Smartt et al., 2017; Utsumi et al., 2017; Valenti et al., 2017), the result of the radioactive decay of heavy r-process elements synthesised in the merger of two neutron stars (Kasen et al., 2017; Metzger, 2017). Modern survey telescopes, with their nightly cadences and wide fields-of-view, are uncovering an increasing number of fast transients like these every year.
Here we report photometric and spectroscopic observations of SN2018kzr, which was independently discovered by the ATLAS survey (Tonry et al., 2018) and the Zwicky Transient Facility (ZTF, Bellm et al., 2019), along with modelling of the bolometric lightcurve and early spectra, and a discussion of plausible explosion scenarios of this object. Throughout this letter we adopt cosmology of , and and assume a foreground reddening of (NED) alongside the Cardelli et al. (1989) extinction law with . All phases are measured with respect to the ZTF discovery epoch, MJD 58480.422, unless otherwise stated.
2 Observations
2.1 Discovery
SN2018kzr was independently discovered by both ZTF (as ZTF18adaykvg) and ATLAS (as ATLAS18bchu) within 2 hours of each other on the night of 2018 December 28. ZTF discovered it on MJD 58480.422 at (Fremling, 2018) and it was ingested into the public alerts broker lasair (Smith et al., 2019), while ATLAS detected it in a 30 second image on MJD 58480.499 with magnitude . ATLAS has the closest non-detection in time, with four images taken at a midpoint of MJD 58478.520 (1.902 days) and a combined 3 upper limit of . The rapid rise triggered an ePESSTO (Smartt et al., 2015) classification spectrum on MJD 58482.317 (+1.895 days) and again on MJD 58483.247 (+2.825 days, Razza et al., 2018; Pineda et al., 2018), which suggested a preliminary Type Ic classification. It is coincident (06 offset) with the blue, , galaxy SDSS J082853.50+010638.6.

2.2 Photometry
Observations were made over a period of two weeks, during which time the transient faded rapidly (see Table 1). Ground-based photometry was collected as part of the GREAT survey (Chen et al., 2018) using GROND (Greiner et al., 2008), along with photometry from the Liverpool Telescope (LT) and photometry from the New Technology Telescope (NTT). As the transient faded rapidly and was coincident with its host galaxy (Figure 1), difference imaging was essential for all epochs which we carried out using hotpants (Becker, 2015). The reference epochs used for the GROND, LT and NTT images are listed in Table 1. Photometry was measured with point-spread-function fitting on the difference images, with the image zero-points set from Pan-STARRS1 reference stars in the field (Chambers et al., 2016; Magnier et al., 2016).
Eight epochs of UV imaging were taken with Swift. Due to its fast fading, it was only recovered in four epochs in , and three in and . The Swift data are presented in Table 2. These magnitudes have not been host subtracted as host contributions were negligible in the exposures.
A strikingly rapid decline was measured across all the bands at rates mag d, mag d, mag d, mag d, all measured over the nine night period for which GROND was observing. This is faster than SN2019bkc, it declining at a rate of mag d (Chen et al., 2019), which had been the fastest declining supernova-like transient until now. The red bands ( and ) are similar to the kilonova AT2017gfo (see Figure 2). There appears to be no significant near-infrared flux in the GROND images after image subtraction so we do not consider them further here.

2.3 Spectroscopy
A total of twelve spectra were taken beginning on MJD 58482.317 (+1.895 days) with the aforementioned initial NTT:EFOSC2 classification spectrum from ePESSTO. A second NTT:EFOSC2 spectrum was taken on MJD 58483.247 (+2.825 days) along with a third NTT:EFOSC2 spectrum on MJD 58484.172 (+3.750 days) with a broader wavelength coverage ( Å as opposed to the former Å). On MJD 58487, three optical to near-infrared spectra were taken by SALT:RSS, VLT:Xshooter and Gemini:GMOS-N, along with a Keck:LRIS spectrum on the subsequent night. A second Gemini:GMOS-N spectrum was taken on MJD 58489.437 (+9.015 days). Another NTT:EFOSC2 spectrum was obtained on MJD 58490.316 (+9.894 days) but was of a very low signal-to-noise, showing no identifiable emission or absorption features. One more Keck:LRIS spectrum was taken on MJD 58494.356 (+14.136 days) showing faint emission most notably around 8500 Å. The final spectrum taken was a VLT:Xshooter spectrum from MJD 58525.119 (+44.697 days) which showed narrow nebular emission lines from the host galaxy but no detectable flux from SN2018kzr. The [O ii] doublet 3726.03, 3926.47 was resolved into two components and a double Gaussian with full width at half maximum Å was fit to the profiles. The [O iii] 5006.84 line was also detected and the mean of all three centroids gave . For the cosmology we adopt, this equates to a luminosity distance of Mpc. This VLT:Xshooter spectrum was also used to subtract host continuum flux from the later-time spectra (those from MJD 58487 onward).
3 Data Analysis
3.1 Lightcurve modelling and comparison
Using the photometry (Table 1, Figure 2), a bolometric lightcurve was constructed with superol (Nicholl, 2018), which integrates under blackbody fits to the spectral energy distribution estimated at each epoch of observation (Figure 3). Based on the Arnett formalism, we may constrain the ejecta mass expected from the opacity, photospheric velocity of the ejecta and an estimate of the rise time of the bolometric lightcurve. Supposing an opacity of , velocity of the order of and a rise time days, we anticipate an ejecta mass M⊙.
For parameter estimation we have fitted two different powering models, and a combination of both, to the bolometric lightcurve using the formalism and methods described in Inserra et al. (2013). The powering sources were 56Ni radioactivity and energy from the spin-down of a magnetic neutron star. In addition we also compare our measured lightcurve to published models of rapidly evolving transients. Figure 3 shows the model comparisons, illustrating that the rapid decline rate cannot be fit with a radioactively powered model. To produce a peak luminosity of erg s-1 a mass of 0.17 M⊙ is required if 56Ni is the sole powering source:
| (1) |
Following equation 1, semi-analytical solutions for such a pure 56Ni model are unable to adequately fit the decline rate as shown in Figure 3. We show our formal ‘best fit’ model for 56Ni only powering which has an ejecta mass of 0.28 M⊙ assuming an opacity of and 56Ni mass of 0.07 M⊙. Such an ejecta mass has a 5 day rise to peak, a blackbody temperature of K and would require a velocity of around . This is simply the best fit to the data from a reduced statistic. Such a model could be scaled up to fit the peak with a significantly higher mass of 56Ni, but declines much too slowly to match the observed data.
The core collapse of an ultra-stripped He star model of Tauris et al. (2013) has been previously applied to rapidly declining transients such as SN2005ek (Drout et al., 2013). The progenitor transfers material to a compact companion and experiences iron core collapse while only just above the Chandrasekhar limit. As can be seen in Figure 3, even this ultra-stripped model, with M⊙ and M⊙, does not decline rapidly enough to describe SN2018kzr. We discuss this explosion scenario in more depth in Section 4.
To further illustrate that rapidly declining models that are 56Ni powered are inconsistent with the observed data, we show a set of thermonuclear explosion models for low mass carbon-oxygen (CO) white dwarfs (WDs) from Sim et al. (2012) in the right panel of Figure 3. The Sim et al. (2012) models have a CO core which accretes a sufficiently large helium layer prior to the ignition of core nuclear burning such that the He layer itself instigates a detonation. This primary detonation extends into the CO core wherein a secondary detonation may occur - the Edge-Lit Double Detonation (ELDD) scenario. The primary detonation may, however, be the only detonation to occur, giving the He-layer Detonation (HeD) scenario. Two sets of models are presented for each scenario, one being the nominated standard system (Model S) with a core mass of M⊙ and envelope mass of M⊙, and another being a specific low mass system (Model L) where the core mass is reduced to M⊙. The helium shell detonation models (.Ia models) of Shen et al. (2010) are also either too faint, too slowly evolving or too red (see Section 3.2) to be viable explanations. From this, we disfavour a low mass, thermonuclear explosion, or any type of radioactively powered explosion where the dominant component is 56Ni as the explosion scenario for SN2018kzr. We also disfavour powering from other radioactive isotopes, such as 48Cr or 52Fe, which may have a shorter lifetime than 56Ni (Dessart et al., 2014). The energy release per unit mass from the decay of these isotopes is notably lower than that of 56Ni which would necessitate a larger quantity of each be synthesized compared to the amount of 56Ni synthesized in order to explain the lightcurve evolution of this object.
An extra powering source is therefore required, and hence we move to testing a model with additional energy from a central engine. We employ a magnetar spin-down component as conceived by Kasen & Bildsten (2010) and Woosley (2010) and further generalised for lightcurve fitting by Inserra et al. (2013)111 https://bitbucket.org/andersjerkstrand/lcmodels/src/master/. Our model supplements 56Ni decay with powering from the magnetar’s rotational kinetic energy as it spins down. These models assume an explosion energy of erg, a magnetar radiation opacity of 0.01 and an electromagnetic radiation opacity of 0.1 . We choose this latter opacity as it is within the limit allowed for electron scattering, assuming it is not influenced by line contributions. We first considered only the magnetar spin-down component in the absence of 56Ni powering and found a reasonable fit which implied an ejecta mass of 0.1 M⊙, along with an initial magnetar spin period of ms and magnetic field of G. This fit is shown in Figure 3. In general, it adequately describes the rapid decline of SN2018kzr but falls below the luminosity of the final data point on the lightcurve. For these fit parameters the spin-down timescale for a magnetar would be approximately 7 days. Hence, given the lifetime of SN2018kzr the input magnetar energy would only decline by a factor of a few. However, the output magnetar energy declines by a factor of nearly 100 in this time, implying the rapid evolution is driven by declining trapping of the magnetar radiation.
It is possible to add a small quantity of 56Ni to the magnetar model to slow the decline in the tail of the lightcurve and enable a better fit to the late lightcurve. We observe that 0.02 M⊙ of 56Ni is required to cause a noticeable change in the fit profile, but that this is insufficient for the fit the encompass the final data point. Further increases in 56Ni produce less physically plausible fits as the 56Ni fraction begins to tend to unity. Furthermore, the bolometric luminosity at this point is uncertain by 0.2 dex. Scaling the +14.136 day Keck:LRIS spectrum to the photometry at +16.792 days and integrating the spectral flux gives a luminosity dex indicating the data may not significantly discrepant from the model. Both the magnetar only and magnetar supplemented by 56Ni heating models favour an ejecta temperature in the range of K and photospheric velocity of c at time when the bolometric lightcurve is at peak.

. Right panel: The bolometric lightcurve of SN2018kzr in comparison to several fast evolving thermonuclear progenitor models detailed in Sim et al. (2012).
3.2 Spectral analysis and modelling
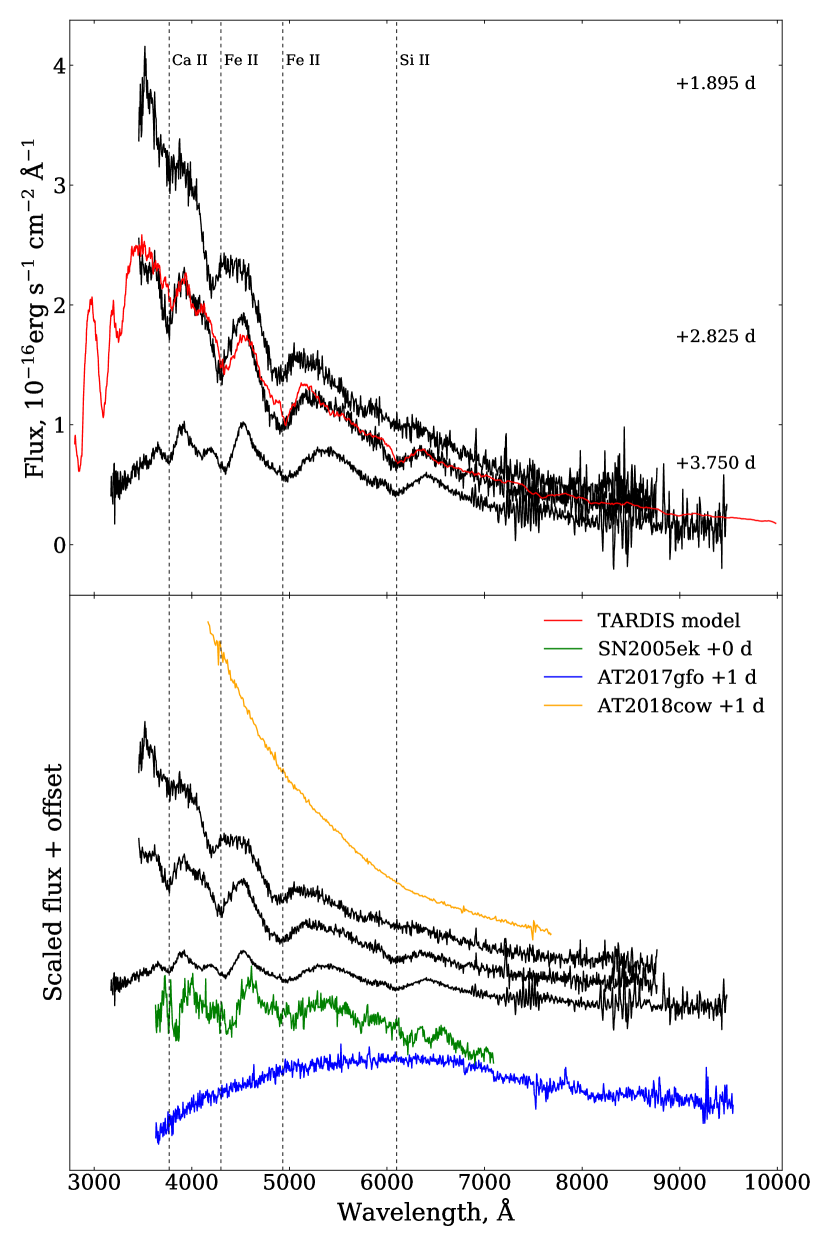
Our early spectra were modelled with TARDIS (Kerzendorf & Sim, 2014) and a model fit is shown in Figure 4 for the NTT:EFOSC2 +2.825 day spectrum. There are four strong absorption features with minima at , , , and Å which are reproduced in our model by Ca ii, Fe ii and Si ii, with a model velocity of .
The model is primarily composed of O (%), with significant amounts of intermediate mass elements, primarily Si and Mg (% each), along with some Fe group elements. To reproduce the Fe ii features in our observed spectra we require % of the total ejecta mass to be Fe in our model. We previously found that 20% of the ejecta being 56Ni is required to impact the lightcurve fit, but for this composition if as much of the of the ejecta is 56Ni it begins to present significantly in the spectral model fit. Hence, we disfavour a large amount of 56Ni in the ejecta.
The temperature, ejecta mass and luminosity required for the spectral fit in Figure 4 are consistent with the lightcurve model, with some minor discrepancies. The model spectrum is 7 days after explosion, whereas the lightcurve fit implies this spectrum should be days after explosion. This may imply the ejecta is not in homologous expansion and given the simplicity of our magnetar model for the lightcurve, where the hydrodynamics of the pulsar wind bubble is not numerically modelled, we do not consider this a serious physical inconsistency. The ejecta velocity implied by the lightcurve modelling stands at a factor of three greater than that by the spectral modelling. This is likely the result of a longer rise time than is assumed by the lightcurve model, a non-homologous expansion of material or the ejecta being non-spherical. Further quantitative modelling of all spectra and a more detailed description of the radiative transfer will be presented in a companion paper (Gillanders et al. in prep).
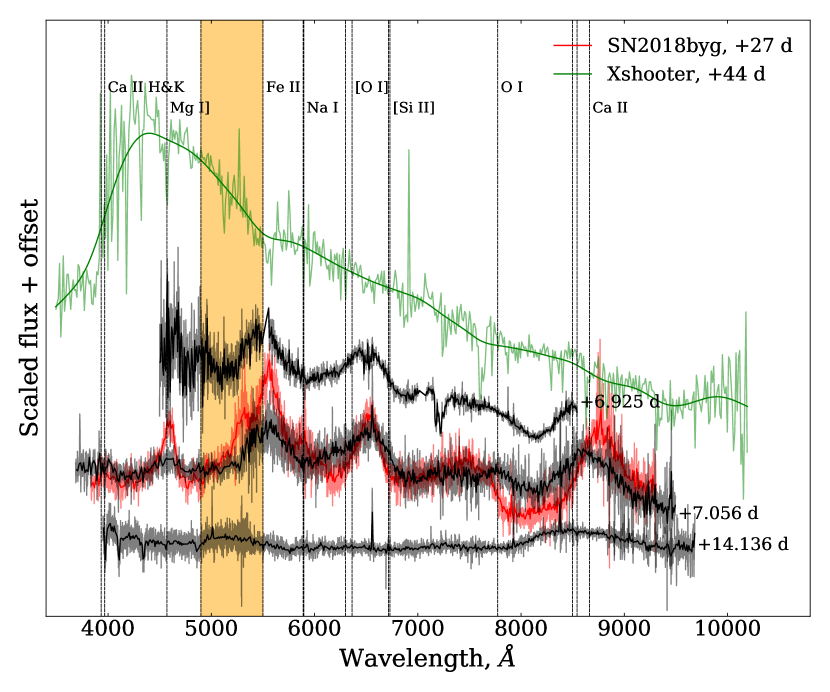
In Figure 5, we show the two spectra taken at approximately +7 days from Gemini:GMOS-N and Keck:LRIS (see Table 3) as well as the Keck:LRIS spectrum from +14.136 days. As the transient faded rapidly, contamination from the host galaxy became significant at these epochs. The VLT:Xshooter spectrum from +44.697 days, which is purely host flux, was smoothed and subtracted from the spectra. The spectra were scaled and subtracted such that the final host subtracted spectra matched the difference image photometry through synthetic photometry in the bands. The flux levels are not reliable below Å due to the strong host flux at these wavelengths. There is a remarkable similarity between the Keck:LRIS +7.056 day spectrum of SN2018kzr and a SN2018byg spectrum taken +27 days from its band maximum. SN2018byg, discussed by De et al. (2019), has been presented as the result of a double detonation of a CO WD surrounded by a He shell, much like the models presented by Sim et al. (2012). The spectra around peak for SN2018byg are noted by De et al. (2019) to show line blanketing from Fe group elements indicative of a large Fe mass in the outermost layers of the ejecta. The features at and Å are weaker in the spectrum of SN2018kzr. De et al. (2018) attribute the features to Ca ii and Ti ii in SN2018byg. At this stage, SN2018kzr is entering the nebular phase and further analysis of the ionic species producing these features will be discussed in Gillanders et al. (in prep.).
By +14 days, the and Å features have disappeared, leaving a strong and broad feature centred on Å. The obvious candidate is the Ca ii triplet, however the centroid of the feature is Å ( ) offset from its rest wavelength position.
4 Explosion mechanism and scenario
Our data show SN2018kzr is the fastest declining supernova-like transient apart from the kilonova, AT2017gfo. We rule out a NS-NS merger for SN2018kzr due to the TARDIS spectroscopic model composition which is predominantly intermediate mass elements including O, Mg, Si and Ca, along with a small fraction of Fe. The lightcurve and spectra cannot be explained only through radioactive powering by 56Ni and we instead favour a magnetar powering mechanism. This powering mechanism provides a model which is quantitatively a good fit to the data with an ejecta mass of M⊙, and a neutron star with period ms and magnetic field of G. We disfavour any He-detonation or thermonuclear model due to the fast and luminous light curve, which is physically inconsistent with 56Ni powering. Three possible progenitor scenarios and explosion mechanisms are worth considering that have previously been investigated and predict low mass ejecta with intermediate mass elements and an alternative power source to radioactive decay. These are an ultra-stripped core collapse of a massive star, accretion induced collapse (AIC) of an oxygen-neon (ONe) WD, and a WD-NS merger.
Ultra-stripped core collapse model: The ultra-stripped core collapse model has a He star with total mass before explosion which is only just above the Chandrasekhar limit (e.g. M⊙, Tauris et al., 2015), due to mass-loss from a common envelope phase and accretion onto a neutron star companion in a tight orbit. The models of Tauris et al. (2013) have successfully reproduced rapidly declining transients such as SN2005ek (Drout et al., 2013, which we show in the left panel of Figure 3 for illustrative purposes). However, such an explosion scenario is unlikely to produce as rapidly rotating a remnant as we present here. For a given He star, the largest component of angular momentum will be held in the envelope rather than the core. Rapid stripping of the envelope via mass transfer to a compact companion does not normally facilitate redistribution of angular momentum to the core. This is supported by multi-dimensional simulations of Müller et al. (2018) which lead to slowly spinning progenitors, far from the 25 ms rotation rate required to provide the observed luminosity.
Accretion induced collapse of a white dwarf: The accretion induced collapse of an ONe WD has been predicted to lead to a rapidly rotating neutron star in which magnetic fields may be large (up to G, Dessart et al., 2007). These simulations predict a magnetically enhanced explosion leaving behind a rapidly rotating millisecond pulsar, along with an ejection of M⊙ of material with only traces of 56Ni. The He star + ONe WD binary simulations of Brooks et al. (2017) show that the accretion from a He star companion can lead to an outer layer structure on the ONe WD which is composed of O, Ne, Si and Mg. The M⊙ WD grows, reaching close to the Chandrasekhar limit, which triggers electron capture in the core resulting in AIC. The composition of the WD calculated by Brooks et al. (2017) is compatible with our estimates from the spectral models. However several simulations have predicted significantly heavier elements should characterise the ejecta of AIC events. Metzger et al. (2009) and Darbha et al. (2010) predict a composition rich in Fe-group elements, while the Dessart et al. (2007) simulations produce ejecta with a low electron fraction and a composition dominated by elements heavier than Fe. It appears none of these models produce the intermediate mass element composition apparent in our spectra.
White dwarf - neutron star mergers: The WD-NS merger scenario involves the production of an accretion disc following the tidal disruption of a sufficiently massive WD as it inspirals with a NS companion. The disc will be comprised of WD material, provided the WD has mass M⊙(Margalit & Metzger, 2016), and the temperature and mid-plane density are predicted to be high enough to support burning of WD material to higher mass elements (Metzger, 2012). For a CO WD, the ejecta may contain the intermediate mass elements observed in SN2018kzr (O, Si, Mg) in addition to M⊙ of 56Ni (Metzger, 2012). This 56Ni can only power a faint optical transient of peak luminosity erg s-1. However, high velocity winds from the disk can produce shocks which thermalise the kinetic energy of the winds to power characteristic luminosities of erg s-1(Margalit & Metzger, 2016). Interestingly the timescale of the powering falls off as . This is similar to the magnetar powering function () and hence would likely result in a similar lightcurve. Schwab et al. (2016) suggest another possible channel to produce a rapidly rotating neutron star remnant is through the merger of two WDs, potentially avoiding thermonuclear runaway and creating a massive, rapidly rotating WD that will likely collapse (Gvaramadze et al., 2019).
Of these scenarios, we disfavour the ultra-stripped core collapse scenario, owing predominantly to the fact that it would not accommodate such a rapidly rotating neutron star as we are suggesting here. We instead favour the AIC or WD-NS merger scenarios as they are consistent with an ejecta mass of M⊙ and the requirement from our bolometric lightcurve modelling that the powering mechanism be supplemented by an additional component, likely a rapidly rotating magnetar.. Our spectral modelling indicates a composition of primarily intermediate mass elements. In the case of AIC, it is unlikely that this would be observed based on current models (Dessart et al., 2007; Metzger et al., 2009; Darbha et al., 2010), however such a composition is plausible for a WD-NS merger (Metzger, 2012).
Acknowledgements
Based in part on observations collected at the European Organisation for Astronomical Research in the Southern Hemisphere, Chile as part of the extended Public ESO Spectroscopic Survey for Transient Objects (ePESSTO), program 199.D-0143, the SALT Large Science Programme on transients (2018-2-LSP-001), MNiSW DIR/WK/2016/07, GROND support through DFG grant HA 1850/28-1. ATLAS is supported primarily through NASA grant NN12AR55G, 80NSSC18K1575. This research made use of TARDIS supported by the Google Summer of Code, ESA’s Summer of Code in Space program. Funding acknowledgments: STFC ST/P000312/1 (SJS, SAS); Alexander von Humboldt Foundation (TWC); ERC and H2020 MSC grants [615929, 725161, 758638] (AGY, CPG, KM, LG); ISF GW excellence center, IMOS, BSF Transformative program, Benoziyo Endowment Fund for the Advancement of Science, Deloro Institute, Veronika A. Rabl Physics Discretionary Fund, Paul and Tina Gardner and the WIS-CIT, Helen and Martin Kimmel Award (AGY); RAS Research Fellowship (MN), Polish NCN MAESTRO grant 2014/14/A/ST9/00121 (MG), IC120009 ‘Millennium Institute of Astrophysics’ of the Iniciativa Científica Milenio del Ministerio Economía, Fomento y Turismo de Chile and CONICYT PAI/INDUSTRIA 79090016 (OR); NRF South Africa (DAHB) lasair is supported by STFC grants ST/N002512/1 and ST/N002520/1.
denotes that these are AB magnitudes in the ATLAS and filters respectively.
c denotes magnitudes obtained via aperture photometry, as opposed to PSF photometry, due to trailing in the input images.
| Date | MJD | Phase | Instrument | ||||
| 20181223 12:23:02 | 58475.516 | 4.906 | 19.0 | ZTF | |||
| 20181224 12:11:31 | 58476.508 | 3.914 | 18.90a | ATLAS | |||
| 20181226 12:28:48 | 58478.520 | 1.902 | 19.80a | ATLAS | |||
| 20181228 10:07:48 | 58480.422 | 0.000 | 18.58 0.11 | ZTF | |||
| 20181228 10:34:01 | 58480.440 | 0.018 | 18.54 0.11 | ZTF | |||
| 20181228 11:26:59 | 58480.477 | 0.055 | 18.14 0.08 | ZTF | |||
| 20181228 11:36:22 | 58480.484 | 0.062 | 18.25 0.09 | ZTF | |||
| 20181228 11:58:04 | 58480.499 | 0.077 | 18.75 0.14a | ATLAS | |||
| 20181228 12:11:05 | 58480.508 | 0.086 | 18.62 0.13a | ATLAS | |||
| 20181228 12:25:10 | 58480.517 | 0.095 | 18.76 0.14a | ATLAS | |||
| 20181228 12:38:46 | 58480.527 | 0.105 | 18.52 0.11a | ATLAS | |||
| 20181229 10:24:06 | 58481.433 | 1.011 | 18.54 0.08 | ZTF | |||
| 20181229 11:28:27 | 58481.478 | 1.056 | 18.62 0.11 | ZTF | |||
| 20181230 12:02:52 | 58482.502 | 2.080 | 18.68 0.16a | ATLAS | |||
| 20181230 12:15:50 | 58482.511 | 2.089 | 18.58 0.66a | ATLAS | |||
| 20181230 12:21:36 | 58482.515 | 2.093 | 17.83 0.55a | ATLAS | |||
| 20181230 12:40:19 | 58482.528 | 2.106 | 18.70 0.35a | ATLAS | |||
| 20181231 06:34:28 | 58483.274 | 2.852 | 18.83 0.01c | 18.88 0.01c | 19.07 0.02c | 19.08 0.04c | GROND |
| 20190101 03:40:23 | 58484.153 | 3.731 | 19.66 0.09 | 19.33 0.05 | 19.46 0.02 | 19.62 0.02 | GROND |
| 20190101 04:19:27 | 58484.180 | 3.758 | 18.92 0.03 | 18.68 0.04 | 18.43 0.03 | LCOGT | |
| 20190102 00:33:32 | 58485.023 | 4.601 | 20.49 0.06 | 19.75 0.12 | 19.74 0.10 | 20.06 0.16 | IO:O |
| 20190103 05:32:53 | 58486.231 | 5.809 | 21.37 0.03 | 20.52 0.01 | 20.58 0.03 | 20.28 0.02 | GROND |
| 20190103 09:10:04 | 58486.382 | 5.960 | 20.34 0.22 | P60 | |||
| 20190103 12:04:56 | 58486.503 | 6.081 | 20.51b | ATLAS | |||
| 20190104 00:51:08 | 58487.036 | 6.614 | 22.02 0.06 | 20.98 0.19 | 20.96 0.06 | 20.88 0.10 | IO:O |
| 20190104 07:42:01 | 58487.321 | 6.899 | 22.04 0.05 | 21.41 0.02 | 21.35 0.02 | 20.96 0.02 | GROND |
| 20190105 01:04:36 | 58488.045 | 7.623 | 22.24 0.09 | 21.78 0.17 | 21.53 0.11 | 20.93 0.20 | IO:O |
| 20190105 07:56:24 | 58488.331 | 7.909 | 22.72 0.05 | 22.33 0.03 | 22.25 0.06 | 21.63 0.04 | GROND |
| 20190106 00:17:30 | 58489.012 | 8.590 | 22.82 0.09 | 22.11 0.20 | 21.87 0.11 | 21.28 0.12 | IO:O |
| 20190107 07:09:55 | 58490.299 | 9.877 | 22.91 0.03 | 22.72 0.06 | 22.98 0.08 | 21.98 0.06 | GROND |
| 20190108 07:21:57 | 58491.307 | 10.885 | 23.14 0.05 | 22.94 0.05 | 22.61 0.07 | 22.06 0.05 | GROND |
| 20190109 07:10:43 | 58492.299 | 11.877 | 23.32 0.07 | 23.25 0.07 | 21.84 | GROND | |
| 20190114 05:08:34 | 58497.214 | 16.792 | 23.74 0.07 | 23.83 0.08 | 23.20 0.05 | EFOSC2 | |
| 20190127 07:11:23 | 58510.300 | 29.878 | 24.44 | 24.94 | 24.11 | EFOSC2 | |
| 20190205 03:08:28 | 58519.131 | 38.709 | ref | ref | ref | ref | GROND |
| 20190307 02:20:35 | 58549.098 | 68.676 | ref | ref | ref | EFOSC2 | |
| 20190426 20:27:41 | 58599.853 | 119.431 | ref | ref | ref | ref | IO:O |
| SDSS DR15 | Host | Model | 20.58 0.05 | 20.37 0.05 | 20.25 0.08 | 20.35 0.32 | SDSS |
| SDSS DR15 | Host | Petrosian | 20.64 0.13 | 20.40 0.09 | 20.17 0.19 | - | SDSS |
| PS1 3 | Host | Kron | 21.39 0.08 | 20.64 0.10 | 20.48 0.06 | 21.17 0.29 | PS1 |
| PS1 3 | Host | Aperture | 21.43 0.08 | 20.62 0.08 | 20.59 0.05 | 21.07 0.17 | PS1 |
| Date | MJD | Phase | ||||||
|---|---|---|---|---|---|---|---|---|
| 20190101 15:54:43 | 58484.663 | 4.241 | 21.55 0.31 | 21.31 0.35 | 19.85 0.36 | 19.41 0.49 | ||
| 20190102 05:35:31 | 58485.233 | 4.811 | 21.20 0.33 | 20.29 0.35 | ||||
| 20190102 17:48:28 | 58485.742 | 5.320 | 23.15 1.74 | 21.77 0.34 | 21.35 0.45 | 21.34 1.19 | ||
| 20190102 19:24:57 | 58485.809 | 5.387 | 21.73 0.34 | |||||
| 20190103 15:33:07 | 58486.648 | 6.226 | 21.79 0.26 | |||||
| 20190103 19:43:40 | 58486.822 | 6.400 | 22.14 0.19 | 21.83 0.18 | 21.83 0.21 | |||
| 20190104 23:36:57 | 58487.984 | 7.562 | ||||||
| 20190105 22:53:45 | 58488.954 | 8.532 | 21.50 0.27 |
a denotes the resolution is for the Grism#11 with EFOSC2.
b denotes the resolution is for the Grism#16 with EFOSC2.
c denotes the spectra are of low signal, being observed either in poor conditions or with the transient not centred in the slit.
| Date | MJD | Phase | Telescope | Instrument | Spectral Range | Spectral Resolution |
|---|---|---|---|---|---|---|
| 20181230 07:36:05 | 58482.317 | 1.895 | NTT | EFOSC2 | 3700 - 9300 Å | 355 |
| 20181231 05:56:13 | 58483.247 | 2.825 | NTT | EFOSC2 | 3700 - 9300 Å | 355 |
| 20190101 04:06:59 | 58484.172 | 3.750 | NTT | EFOSC2 | 3400 - 10300 Å | 390a, 595b |
| 20190104 05:45:10 | 58487.240 | 6.818c | VLT | Xshooter | 3100 - 10300 Å | 3300 |
| 20190104 08:19:41 | 58487.347 | 6.925 | Gemini | GMOS-N | 4200 - 9000 Å | 1918 |
| 20190104 11:27:55 | 58487.478 | 7.056 | Keck | LRIS | 3000 - 10300 Å | 1050 |
| 20190104 15:17:01 | 58487.637 | 7.215 | SALT | RSS | 3600 - 8300 Å | 1277 |
| 20190106 10:29:17 | 58489.437 | 9.015c | Gemini | GMOS-N | 4200 - 9000 Å | 1918 |
| 20190107 07:35:21 | 58490.316 | 9.894c | NTT | EFOSC2 | 3700 - 9300 Å | 355 |
| 20190111 08:33:05 | 58494.356 | 14.136 | Keck | LRIS | 3000 - 10300 Å | 1050 |
| 20190211 02:50:46 | 58525.119 | 44.697 | VLT | Xshooter | 3700 - 20700 Å | 3300 |
References
- Abbott et al. (2017) Abbott, B. P., Abbott, R., Abbott, T. D., et al. 2017, Physical Review Letters, 119, 161101
- Andreoni et al. (2017) Andreoni, I., Ackley, K., Cooke, J., et al. 2017, PASA, 34, e069
- Arcavi et al. (2017) Arcavi, I., Hosseinzadeh, G., Howell, D. A., et al. 2017, Nature, 551, 64
- Becker (2015) Becker, A. 2015, HOTPANTS: High Order Transform of PSF ANd Template Subtraction, , , ascl:1504.004
- Bellm et al. (2019) Bellm, E. C., Kulkarni, S. R., Graham, M. J., et al. 2019, PASP, 131, 018002
- Brooks et al. (2017) Brooks, J., Schwab, J., Bildsten, L., Quataert, E., & Paxton, B. 2017, ApJ, 843, 151
- Cardelli et al. (1989) Cardelli, J. A., Clayton, G. C., & Mathis, J. S. 1989, ApJ, 345, 245
- Chambers et al. (2016) Chambers, K. C., Magnier, E. A., Metcalfe, N., et al. 2016, ArXiv e-prints, arXiv:1612.05560
- Chen et al. (2019) Chen, P., Dong, S., Stritzinger, M. D., et al. 2019, arXiv e-prints, arXiv:1905.02205
- Chen et al. (2018) Chen, T. W., Inserra, C., Fraser, M., et al. 2018, ApJ, 867, L31
- Chornock et al. (2017) Chornock, R., Berger, E., Kasen, D., et al. 2017, ApJ, 848, L19
- Coulter et al. (2017) Coulter, D. A., Foley, R. J., Kilpatrick, C. D., et al. 2017, Science, 358, 1556
- Cowperthwaite et al. (2017) Cowperthwaite, P. S., Berger, E., Villar, V. A., et al. 2017, ApJ, 848, L17
- Darbha et al. (2010) Darbha, S., Metzger, B. D., Quataert, E., et al. 2010, MNRAS, 409, 846
- De et al. (2018) De, K., Kasliwal, M. M., Ofek, E. O., et al. 2018, Science, 362, 201
- De et al. (2019) De, K., Kasliwal, M. M., Polin, A., et al. 2019, ApJ, 873, L18
- Dessart et al. (2007) Dessart, L., Burrows, A., Livne, E., & Ott, C. D. 2007, ApJ, 669, 585
- Dessart et al. (2014) Dessart, L., Hillier, D. J., Blondin, S., & Khokhlov, A. 2014, MNRAS, 441, 3249
- Drout et al. (2013) Drout, M. R., Soderberg, A. M., Mazzali, P. A., et al. 2013, ApJ, 774, 58
- Drout et al. (2017) Drout, M. R., Piro, A. L., Shappee, B. J., et al. 2017, Science, 358, 1570
- Evans et al. (2017) Evans, P. A., Cenko, S. B., Kennea, J. A., et al. 2017, Science, 358, 1565
- Fremling (2018) Fremling, C. 2018, Transient Name Server Discovery Report, 1996
- Greiner et al. (2008) Greiner, J., Bornemann, W., Clemens, C., et al. 2008, PASP, 120, 405
- Gvaramadze et al. (2019) Gvaramadze, V. V., Gräfener, G., Langer, N., et al. 2019, Nature, 569, 684
- Inserra et al. (2013) Inserra, C., Smartt, S. J., Jerkstrand, A., et al. 2013, ApJ, 770, 128
- Kasen & Bildsten (2010) Kasen, D., & Bildsten, L. 2010, ApJ, 717, 245
- Kasen et al. (2017) Kasen, D., Metzger, B., Barnes, J., Quataert, E., & Ramirez-Ruiz, E. 2017, Nature, 551, 80
- Kasliwal et al. (2010) Kasliwal, M. M., Kulkarni, S. R., Gal-Yam, A., et al. 2010, ApJ, 723, L98
- Kasliwal et al. (2017) Kasliwal, M. M., Nakar, E., Singer, L. P., et al. 2017, Science, 358, 1559
- Kerzendorf & Sim (2014) Kerzendorf, W. E., & Sim, S. A. 2014, MNRAS, 440, 387
- Li et al. (2003) Li, W., Filippenko, A. V., Chornock, R., et al. 2003, PASP, 115, 453
- Lipunov et al. (2017) Lipunov, V. M., Gorbovskoy, E., Kornilov, V. G., et al. 2017, ApJ, 850, L1
- Magnier et al. (2016) Magnier, E. A., Schlafly, E. F., Finkbeiner, D. P., et al. 2016, ArXiv e-prints, arXiv:1612.05242
- Margalit & Metzger (2016) Margalit, B., & Metzger, B. D. 2016, MNRAS, 461, 1154
- Metzger (2012) Metzger, B. D. 2012, MNRAS, 419, 827
- Metzger (2017) —. 2017, Living Reviews in Relativity, 20, 3
- Metzger et al. (2009) Metzger, B. D., Piro, A. L., & Quataert, E. 2009, MNRAS, 396, 1659
- Müller et al. (2018) Müller, B., Gay, D. W., Heger, A., Tauris, T. M., & Sim, S. A. 2018, MNRAS, 479, 3675
- Nicholl (2018) Nicholl, M. 2018, Research Notes of the American Astronomical Society, 2, 230
- Nicholl et al. (2017) Nicholl, M., Berger, E., Kasen, D., et al. 2017, ApJ, 848, L18
- Perets et al. (2010) Perets, H. B., Gal-Yam, A., Mazzali, P. A., et al. 2010, Nature, 465, 322
- Pian et al. (2017) Pian, E., D’Avanzo, P., Benetti, S., et al. 2017, Nature, 551, 67
- Pineda et al. (2018) Pineda, J., Razza, A., Gromadzki, M., et al. 2018, The Astronomer’s Telegram, 12347
- Poznanski et al. (2010) Poznanski, D., Chornock, R., Nugent, P. E., et al. 2010, Science, 327, 58
- Prentice et al. (2018) Prentice, S. J., Maguire, K., Smartt, S. J., et al. 2018, ApJ, 865, L3
- Razza et al. (2018) Razza, A., Pineda, J., Gromadzki, M., et al. 2018, The Astronomer’s Telegram, 12342
- Rest et al. (2018) Rest, A., Garnavich, P. M., Khatami, D., et al. 2018, Nature Astronomy, 2, 307
- Schwab et al. (2016) Schwab, J., Quataert, E., & Kasen, D. 2016, MNRAS, 463, 3461
- Shen et al. (2010) Shen, K. J., Kasen, D., Weinberg, N. N., Bildsten, L., & Scannapieco, E. 2010, ApJ, 715, 767
- Sim et al. (2012) Sim, S. A., Fink, M., Kromer, M., et al. 2012, MNRAS, 420, 3003
- Smartt et al. (2015) Smartt, S. J., Valenti, S., Fraser, M., et al. 2015, A&A, 579, A40
- Smartt et al. (2017) Smartt, S. J., Chen, T.-W., Jerkstrand, A., et al. 2017, Nature, 551, 75
- Smith et al. (2019) Smith, K. W., Williams, R. D., Young, D. R., et al. 2019, Research Notes of the American Astronomical Society, 3, 26
- Tanvir et al. (2017) Tanvir, N. R., Levan, A. J., González-Fernández, C., et al. 2017, ApJ, 848, L27
- Tauris et al. (2013) Tauris, T. M., Langer, N., Moriya, T. J., et al. 2013, ApJ, 778, L23
- Tauris et al. (2015) Tauris, T. M., Langer, N., & Podsiadlowski, P. 2015, MNRAS, 451, 2123
- Tonry et al. (2018) Tonry, J. L., Denneau, L., Heinze, A. N., et al. 2018, ArXiv e-prints, arXiv:1802.00879
- Troja et al. (2017) Troja, E., Piro, L., van Eerten, H., et al. 2017, Nature, 551, 71
- Utsumi et al. (2017) Utsumi, Y., Tanaka, M., Tominaga, N., et al. 2017, PASJ, 69, 101
- Valenti et al. (2014) Valenti, S., Yuan, F., Taubenberger, S., et al. 2014, MNRAS, 437, 1519
- Valenti et al. (2017) Valenti, S., David, Sand, J., et al. 2017, ApJ, 848, L24
- Whitesides et al. (2017) Whitesides, L., Lunnan, R., Kasliwal, M. M., et al. 2017, ApJ, 851, 107
- Woosley (2010) Woosley, S. E. 2010, ApJ, 719, L204