The galaxy stellar mass function from
CCSNe with improved photo- techniques
Abstract
In Sedgwick et al. (2019) we introduced and utilised a method to combat surface brightness and mass biases in galaxy sample selection, using core-collapse supernovae (CCSNe) as pointers towards their host galaxies, in order to: (i) search for low-surface brightness galaxies (LSBGs); (ii) assess the contributions of galaxies at a given mass to the star-formation-rate density (SFRD); and (iii) infer from this, using estimates of specific star-formation (SF) rate, the form of the SF-galaxy stellar mass function (GSMF). A CCSN-selection of SF-galaxies allows a probe of the form of the SFRD and GSMF deep into the dwarf galaxy mass regime. In the present work, we give improved constraints on our estimates of the SFRD and star-forming GSMF, in light of improved photometric redshift estimates required for estimates of galaxy stellar mass. The results are consistent with a power-law increase to SF-galaxy number density down to our low stellar mass limit of M⊙. No deviation from the high-mass version of the surface brightness – mass relation is found in the dwarf mass regime. These findings imply no truncation to galaxy formation processes at least down to M⊙.
keywords:
galaxies: luminosity function, mass function, galaxies: star formation, galaxies: distances and redshifts, supernovae: general, methods: statistical1 Introduction
The galaxy stellar mass function (GSMF) is a crucial probe of galaxy formation and evolution processes. Constraining present-epoch number densities of dwarf galaxies over a unit cosmological volume is of particular interest to present-day extra-galactic astronomy, as predictions of these densities from both semi-analytical and hydro-dynamical simulations (Moore et al., 1999; Schaye et al., 2015; Genel et al., 2014) are particularly sensitive to the input cosmology and feedback prescriptions.
We discuss in Sedgwick et al. (2019, henceforth, S19a) that the ‘sub-structure problem’, or the the persistent under-abundance of observed dwarf galaxies relative to predicted numbers from simulations invoking -CDM, may arise due to surface brightness biases in observational galaxy samples. As low-mass galaxies are typically fainter in surface brightness, they are more likely to be missed by source detection pipelines, and the observed dwarf population is expected to be incomplete.
S19a presented a method designed to mitigate against these surface brightness biases using a sample of core-collapse supernovae (CCSNe) from the SDSS-II Supernova Survey (Sako et al., 2018) as star-forming (SF) galaxy selection tools. CCSNe peak at luminosities of up to . They can be of higher luminosity than their host galaxies, and so can be used as pointers to their hosts. Whilst most of the 2456 SN-hosts were previously known to galaxy surveys, 140 dwarf galaxies were found for the first time at the locations of the SNe, in IAC Stripe 82 legacy images (henceforth, ‘Stripe 82’; Fliri & Trujillo, 2016).
From estimates of redshifts, host galaxy stellar masses (), CCSN selection, and associated uncertainties, CCSN-rates as a function of mass were derived. This yields one of the most direct measurements of cosmic SF-rate density (SFRD). From SFRD as a function of mass, an assumption for specific-SFR (sSFR) leads to estimates of the form of the GSMF of SF galaxies. A CCSN-selection of galaxies enables a probe of the GSMF deep into the dwarf regime of mass.
These results rely on an accurate calculation of galaxy stellar masses from photometry and redshifts. A large fraction of the low surface brightness galaxies (LSBGs) in the S19a sample possess only photometric measurements. We therefore rely on photometric redshift (photo-) techniques when estimating galaxy stellar masses for the majority of the low-surface brightness galaxy sample.
S19a introduced and utilised zMedIC as a simple but useful photo- estimator relying on SDSS photometry and a training set of Stripe 82 galaxies with spectroscopy. In the present work, we use ‘scaled flux matching’ as an alternative photo- method in order to test for the effects on constraints of CCSN-rates and galaxy number densities in the dwarf regime. Significant improvements to galaxy stellar mass estimates arising from photo- method developments could help yield important insights into galaxy evolution.
2 Updated Methodology
This section outlines improvements to the methodology presented in S19a for the calculation of galaxy photo-’s and their associated uncertainties.
2.1 Photometric redshifts using ‘scaled flux matching’
CCSN hosts were identified in Stripe 82 data (Fliri & Trujillo, 2016) as discussed in Section 1 and in greater detail in S19a. For SN hosts lacking spectroscopy from either the host galaxy or from the SN itself, we require a photo-. We first formed a reference sample using galaxies from the IAC Stripe 82 catalogue that have a match to a spectroscopic redshift (spec-) within .
The photo-’s for the SN-host and other Stripe 82 galaxies were obtained by scaled flux matching (SFM). The is an empirical method that specifically works in linear flux space (unlike e.g. Beck et al. 2016 that uses colours and magnitudes) and requires a matching set of galaxies with reliable spec-’s. The matching set were chosen to have the SDSS flag zwarning , , reasonable S/N and reasonable measured colours for the redshift range. (S/N in and bands, and S/N in and bands, colours in the range , , , .) The matching set consisted of 103 376 galaxies out of a total sample of 117 690 (Stripe 82 catalogue with SDSS redshifts and SN hosts, removing duplicates).
For each source (), the fluxes were fitted to matching-set galaxy () fluxes with defined as:
| (1) |
where is the best-fit normalisation and the summation is over all the photometric bands (). The photometric errors were taken to be the linear flux errors from SExtractor added in quadrature to fractional errors: for and for the -band. Note aperture fluxes with radius were used.
The reliability weight of the match is then given by:
| (2) |
where is the bin weight assigned to galaxy of the matching set. This was obtained by binning by 0.002 in (over the range 0.002–0.8) and with galaxies in a bin given a weight of with a maximum weight of 1/25. Note also that is set to zero where and refer to the same galaxy for calibration purposes.
The weighted mean of , for the best-estimate photo-, is given by:
| (3) |
where is the appropriate quantity to use when dealing with redshift measurements and errors (Baldry, 2018). The initial estimate of the uncertainty (or the nominal error) is given by:
| (4) |
which is the weighted standard deviation multiplied by a correction factor to obtain the sample standard deviation, and is the effective number of measurements for reliability weights.
2.2 An improved assessment of photo- systematics
S19a presents in detail the methodology used to assess photo- uncertainties for the CCSN-host galaxy sample, but in brief, we sub-divided the matching set of galaxies by photo- into bins of width 0.025, before determining the spec- distribution for each bin. This yields a set of redshift probability density functions (PDFs) which can be drawn from a Monte Carlo (MC) technique for a given photo- input, in order to calculate galaxy stellar masses and volume-limit the sample () for each iteration. A benefit of this technique is that it can account for any systematic offsets between photo- and spec-, and PDFs need not be Gaussian.
A shortcoming of the technique is that it does not account for errors on a galaxy-by-galaxy basis. To mitigate against this problem we modify our method as follows:
-
1.
For each photo- bin, we rank galaxies by their nominal error estimated from the SFM technique.
-
2.
We then determine the spec- distributions using galaxies from the 0th to 20th percentile, and from the 80th to 100th percentile. We denote the distributions as and , respectively, which are normalised to integrate to unity.
-
3.
If a galaxy () has a mean nominal SFM redshift error at the ()th percentile of the SFM error-ranked spectroscopic sample, then the PDF, , used as the galaxy’s input into the MC-technique is given by:
| (5) |
This improvement to the method accounts for changes in photo- vs spec- space with the SFM nominal error.
3 Results & Discussion
3.1 Improved constraints on CCSN-rate densities
and the star-forming galaxy stellar mass function
Improved estimates of photo-’s and their uncertainties are in particular crucial for the constraining of CCSN-rates, star-formation-rates, and star-forming galaxy number densities of low stellar mass galaxies. This is firstly because high surface brightness objects, and therefore typically higher stellar mass objects are more typically the focus of spectroscopic analyses, and secondly because only 27 of 140 low-surface-brightness SN-host galaxies discovered in S19a have associated spectroscopy (those which do use SN spec-).
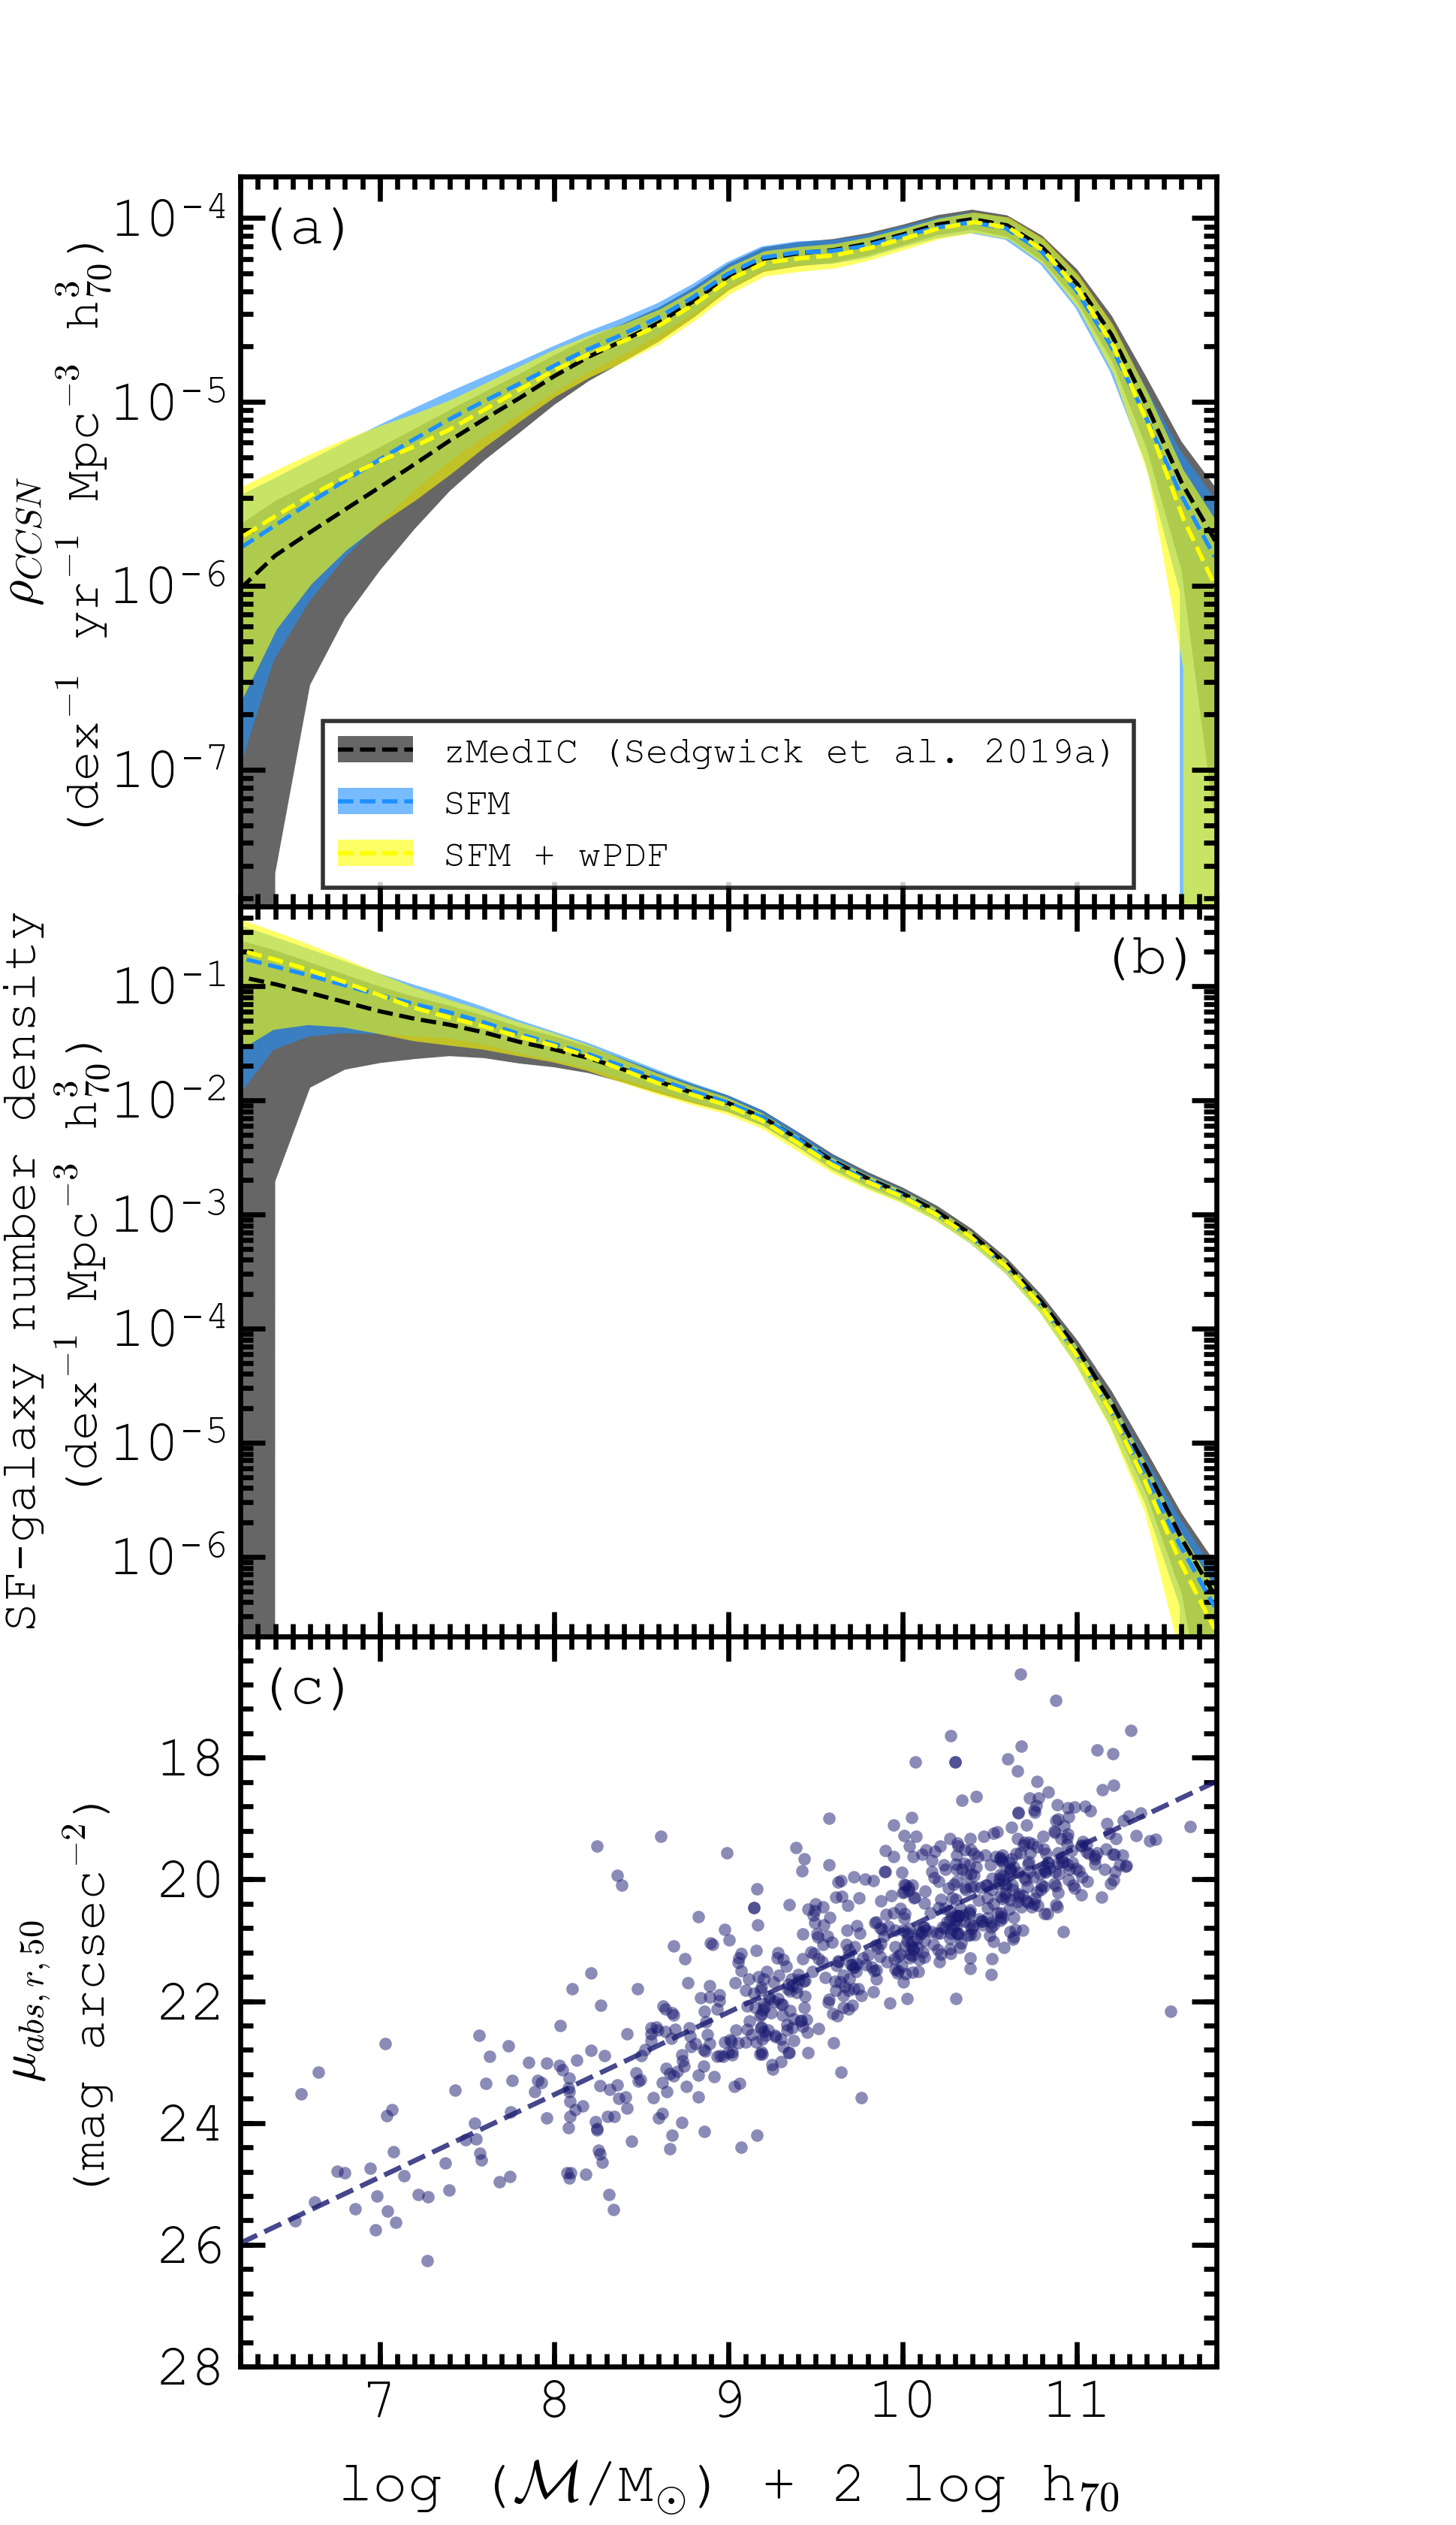
Using different photo- implementations, we calculate CCSN-rate densities as a function of galaxy stellar mass (corrected for the SN survey flux-limit; see S19a). These results are shown in the top-panel of Figure 1. All errors shown are the quadrature sum of MC + Poisson + cosmic variance errors. The result presented in S19a using the zMedIC photo- method is shown in black. Using SFM to derive photo-’s, shown in blue, the uncertainties on CCSN-rates in the dwarf galaxy regime of mass are significantly reduced. A slight increase to mean estimates of CCSN-rates in each bin over MC iterations is found below masses of . Accounting for nominal redshift error estimates from the SFM method, as discussed in Section 2.2, we note an additional reduction to CCSN-rate density uncertainties at low masses, shown in yellow (SFM + wPDF). This result gives further evidence for a power-law decrease to volumetric CCSN-rate densities with decreasing galaxy stellar mass. We are also able to probe 0.2 dex lower in galaxy stellar mass using the SFM technique compared to zMedIC.
Using the assumption of a constant sSFR, we use volume-integrated CCSN-rate estimates as a function of mass to estimate the SF-GSMF. Binned CCSN statistics are divided by their host galaxy mass.
Values are then normalised to the Baldry et al. (2012) SF-galaxy number densities over the range to yield estimates of the SF-GSMF from CCSNe, shown in the middle panel of Figure 1.
We highlight once more the significant improvement to constraints of densities in the dwarf galaxy mass regime when moving from zMedIC (shown in black) to SFM (shown in blue), with the fractional error on the number density a factor of smaller at . We suggest this improvement is due to the fact that zMedIC requires a single relationship between galaxy colours and redshift whereas SFM is flexible to spectral variety in the galaxy population and does not require a knowledge of the optimal parameterisation of colour versus redshift.
We show, in yellow, further constraints using the SFM + wPDF approach. Whilst these additional improvements are less significant, the lower limit on the number density is a factor of higher at our low mass limit of . The trend is consistent with a power-law rise to SF-galaxy number densities continuing deep into the dwarf regime of mass.
This lack of deviation from a power law below implies there is no evidence for any truncation to galaxy formation processes down to at least . In Section 3.2, we discuss further implications for galaxy formation processes in light of trends of galaxy surface brightness with stellar mass.
3.2 The galaxy surface brightness – stellar mass relation
Star-forming galaxies exhibit a well-established trend of surface brightness with stellar mass (see, e.g. Baldry et al., 2012), indicating that surface brightness scales with stellar mass. A break from this relation with decreasing mass could imply that star-formation is constrained by different processes below a certain mass.
The effective absolute -band surface brightness of a CCSN host galaxy is computed using Equation 6, where denotes the area in arcsec2 enclosing half the total galaxy flux, is the Galactic extinction-corrected -band auto apparent magnitude from SExtractor, is the k-correction using the prescription of Chilingarian et al. (2010), and the final term is the cosmic surface-brightness-dimming correction.
| (6) |
The bottom panel of Figure 1 shows the observed trend of effective surface brightness vs galaxy stellar mass. Shown are all galaxies hosting SNe classified as CCSNe or ‘Unknown’ by Sako et al. (2018) which have a mean redshift from the STYwPDF method of over 1000 MC iterations. We use the mean galaxy stellar mass over these iterations. We observe that the surface brightness vs mass relation is linear for the full range of galaxy masses, with the regression line taking the form . This result implies no phase change in galaxy evolution or star-formation processes down to , in concordance with our GSMF results of Section 3.1.
3.3 Summary & Conclusions
We have presented the ‘scaled flux matching’ technique for the calculation of photo-’s, along with developments to the photo- methodology of Sedgwick et al. (2019) designed to improve the assessment of photo- systematics. A coupling of these developments applied to the methodology of S19a produces improved galaxy stellar mass estimates of CCSN host galaxies, leading to tighter constraints on trends of volumetric CCSN-rates, star-formation-rates and star-forming galaxy number densities with stellar mass.
These results put constraints on CCSN-rates at low galaxy masses, which can be used to trace volumetric low-mass-galaxy star-formation-rates. Estimates of the form of the star-forming GSMF show evidence for a power law rise to star-forming galaxy number densities with decreasing galaxy stellar mass, with no evidence of a down turn in galaxy number densities towards lower masses. This result helps to relieve tension between the observed numbers of dwarf galaxies and those predicted from simulations invoking -CDM, and implies a lack of truncation to galaxy formation processes down to at least . Further evidence for this conclusion is found from trends of surface brightness with galaxy stellar mass, with no break from the higher mass relation observed down to the low-mass limits of this study.
Future high-cadence surveys with increased time-span, area and surface brightness depth will greatly increase the size of CCSN-selected galaxy samples and lead to the detection of vast numbers of dwarf galaxies. Using expectations for these parameters with LSST (Ivezić & the LSST Science Collaboration, 2013), and comparing with the specifications and CCSN yield of the SDSS-II Supernova Survey (Sako et al., 2018), LSST may be expected to identify times more CCSNe in a year for a 5000 deg2 coverage in rolling cadence regions. The present work’s results suggest that a similar study with LSST would yield CCSNe yr-1 in star-forming galaxies with masses of , statistics which would undoubtedly give important insights into dwarf galaxy evolution. The co-adding of images is crucial for low-surface brightness host identification. Based on expected exposure times per visit, we estimate that only 25 LSST images per SN region will be required to match the depth of IAC Stripe 82 legacy imaging. Further co-added imaging will bolster prospects for LSBG detection, helping to probe the form the GSMF to ever lower masses, giving crucial insights into galaxy formation and evolution processes deep into the dwarf regime.
References
- Baldry et al. (2012) Baldry, I. K. et al. 2012, MNRAS, 421, 621
- Baldry (2018) Baldry, I. K. 2018, arXiv:1812.05135
- Beck et al. (2016) Beck, R. et al. 2016, MNRAS, 460, 1371
- Chilingarian et al. (2010) Chilingarian, I. V., Melchior, A.-L & Zolotukhin, I. Y. 2010, MNRAS, 405, 1409
- Fliri & Trujillo (2016) Fliri, J. & Trujillo, I. 2016, MNRAS, 456, 1359
- Genel et al. (2014) Genel, S. et al. 2014, MNRAS, 445, 175
- Ivezić & the LSST Science Collaboration (2013) Ivezić, Ž & the LSST Science Collaboration 2013, LSST Science Requirements Document.
- Moore et al. (1999) Moore, B. et al. 1999, ApJ, 524, L19
- Sako et al. (2018) Sako, M. et al. 2018, PASP, 130, 064002
- Sedgwick et al. (2019) Sedgwick, T. M. et al. 2019, MNRAS, 484, 5278 (S19a)
- Schaye et al. (2015) Schaye, J. et al. 2015, MNRAS, 446, 521