Equity2Vec: End-to-end Deep Learning Framework for Cross-sectional Asset Pricing
Abstract.
Pricing assets has attracted significant attention from the financial technology community. We observe that the existing solutions overlook the cross-sectional effects and not fully leveraged the heterogeneous data sets, leading to sub-optimal performance.
To this end, we propose an end-to-end deep learning framework to price the assets. Our framework possesses two main properties: 1) We propose Equity2Vec, a graph-based component that effectively captures both long-term and evolving cross-sectional interactions. 2) The framework simultaneously leverages all the available heterogeneous alpha sources including technical indicators, financial news signals, and cross-sectional signals. Experimental results on datasets from the real-world stock market show that our approach outperforms the existing state-of-the-art approaches. Furthermore, market trading simulations demonstrate that our framework monetizes the signals effectively.
1. Introduction
It is widely acknowledged that forecasting stock prices is a difficult task. Most traditional efforts rely on time series analysis models, such as Autoregressive models (42), Kalman Filters (58), and technical analysis (39; 59; 60). Deep neural networks, especially recurrent neural networks (RNN) (32; 73; 14; 24; 83; 67; 13) recently emerged as an effective solution for stock prediction tasks. Such lines of work have significantly increased in popularity in recent years, mostly fueled by the fact that a large collection of high-quality financial data sets have become available.
We observe two fundamental limitations in the prior works: 1. Cross-sectional effects are not properly leveraged. Most existing approaches treat each stock independently and overlook the cross-sectional effect. The cross-sectional effect posits the fact that the information from one stock may influence/impact another stock’s price change in both static and dynamic aspects. Statically, the stocks that share the same intrinsic properties may move synchronously. For instance, when Twitter goes up, Facebook is more likely to go up because they are in the same sector (social media advertising). Dynamically, stock relation is also temporally evolving. For example, in early 2021, AMC theatres, GameStop, and BlackBerry suddenly exhibit co-movement driven by investors on social media who are buying up these stocks.
2. Heterogeneous data sets are not leveraged to their fullest extent. Most models use only one type of data (i.e., either textual information or “technical factors” (56; 32; 57; 81; 63) in numeric form). The latter is derived from prices and traded volumes. It remains open to building a model that leverages heterogeneous data sources. This model needs to reconcile and aggregate information from different data sources.
An efficient stock embedding scheme that addresses the first limitation must determine: 1) what data source includes the co-movement information, 2) how to extract the cross-sectional signals from the data source, and 3) how to incorporate both the static and dynamic stock relations into the stock embedding. We propose Equity2Vec that answers the three questions.
Ideally, the stock representation should reflect comprehensive relations such as sector, supply chain, value, growth, business cycles, volatility, and analysts’ confidence towards the stock. One possible way is to collect such information manually from experts and analysts, but it is inefficient and costly. Further, there are no widely agreed upon standard approaches to converts people’s opinions into stock representations. Since millions of investors, analysts, and financial experts share opinions, events, comments, and transactions about stocks in the news, we consider using news as a data source to learn stock representations.
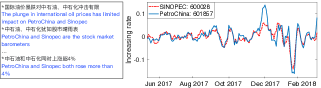
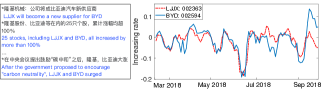
Next, we make two key observations by analyzing news on stocks. When two stocks are frequently co-mentioned, 1) they are likely to share common characteristics such as sector and supply-chain relation, 2) their prices tend to have a similar trend. For example, the co-mentioned stocks in Figure 1 (a) are in the same sector (energy), while Figure 1 (b) shows they have a supply-chain relationship (i.e., LJJX is a supplier of BYD). In both cases, the prices of these co-mentioned stocks often move synchronously and most often in the same direction. Based on our observations, we use news co-mention111Through the statistic analysis of real-world online media, a piece of news refers to stocks on average. to learn the stock representation.
Moreover, Equity2Vec extracts the long-term (static) and evolving (dynamic) stock relations by the following approach. To capture the long-term relation, we build a global stock co-occurrence matrix (64) (see Figure 3 ( )) with a long observation window. We extract the stocks’ long-term representations via matrix factorization of the co-occurrence matrix. To learn the evolving relation, we build a stock graph that reflects the dynamic neighboring relations, where Equity2Vec propagates the embedding of a stock to its neighbors to capture the cross-sectional information of the stocks effectively.
To leverage the heterogeneous data sources (i.e., second limitation of prior works), we propose a framework that integrates the learned stock embeddings, news signals, and technical factors into a neural network model to make the final prediction. We perform extensive experiments on real-world data that contains more than 3,600 stocks in the Chinese stock market from 2009 to 2018. The experimental results demonstrate the effectiveness of stock representations extracted by Equity2Vec outperforms existing state-of-the-art works. The market trading simulation illustrates that Equity2Vec along with the proposed framework increases profit significantly.
In summary, this paper makes the following contributions:
-
•
We propose Equity2Vec that incorporates news into stock embeddings. To the best of our knowledge, Equity2Vec is the first work that mines the stock representation from the news co-mention. Moreover, Equity2Vec captures both long-term (static) and evolving (dynamic) relations between stocks.
-
•
We forecast stock prices using multiple categories of signals (i.e., heterogeneous data sets), including cross-sectional embeddings, technical signals, and financial news signals.
-
•
Extensive experiments on real-world data sets confirm the efficacy of our approach, comparing favorably to state-of-the-art methods.
2. Preliminaries and Framework overview
Problem setting. Given a universe of stocks , the stock price trend is log return for a given stock on day where denotes the open price of stock on day . We formulate the task of predicting the future price trend as a regression problem. The response is the future return , and denotes the vector of features associated with stock on day . The historical features up to time are defined as . We aim to learn the function .
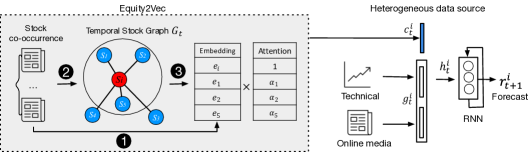
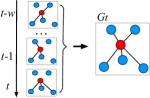
Framework Overview. Figure 2 shows our overall framework, which includes the Equity2Vec component and the heterogeneous data source component. The Equity2Vec component first learns the stocks’ long-term relations from the global stock co-occurrence matrix, and then extracts the static stock embedding as ( ). Then, at time , we build the temporal graph dynamically based on the local stock co-occurrence matrix to capture the evolving relations ( ). Within graph , each solid circle represents a stock. Stocks close to one another are likely to be associated with a similar moving trend. Finally, our approach obtains the final stock representation by propagating its neighbors’ basic embedding via an attention mechanism ( ).
In the heterogeneous data source component, we integrate the stock embedding () with dynamic input () (generated from technical factors and online textual data), and denote the heterogeneous output as . Finally, the RNN model forecasts future return based on the input .
3. Equity2Vec from news
We propose Equity2Vec, which mines the stock embeddings from the news, since such data comprises a valuable knowledge repository with rich relation information between stocks from the crowd of financial experts/journalists. Our approach is inspired by the observation (as depicted in Figure 1) that stocks frequently co-mentioned by the same news are likely to share similar properties and exhibit co-movements in their price trends. We formulate the stock co-occurrence matrix, and use matrix factorization to extract the static stock representation in Section 3.1. To explicitly leverage the cross-sectional signals and circumvent the challenge that the relations between stocks are evolving, we build a temporal stock graph and fine-tune the stock representations by dynamically infusing neighbors latent representations (Section 3.2).
3.1. Capturing long-term stock relations
We now focus on learning the long-term relation, and discuss how to address the dynamic relations in the next subsection.
Co-occurrence Matrix. We build a stock co-occurrence matrix by counting the stock co-occurrence within each news. We prefer the stock co-occurrence matrix instead of the entire news and stock matrix for the following two reasons: (1) The size of the stock co-occurrence matrix only depends on the number of stocks, and is much smaller than the news and stock matrix. (2) We only care about the stock representation, which thus renders news representations as not necessary. We use the global co-occurrence matrix to obtain static representations that reflect the essential relations between stocks in the long term.
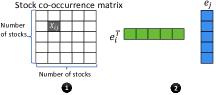
Formally, suppose we have stocks and denotes the stock co-occurrence matrix. Figure 3 ( ) shows , counting the number of articles that mention both and before testing phase. We associate a vector to represent the stock ’s static representation, where is the dimension of the stock representation. In this way, the similarity between stock and stock can be formulated as the inner product of and , given by .
Matrix Factorization. Figure 3 ( ) shows that we adopt matrix factorization (40; 76) to learn the embedding of the stocks. Here, matrix factorization works as a collaborative filtering method. The idea behind matrix factorization is to learn the latent representation where stocks near each other will likely obtain similar embeddings. Given the co-occurrence matrix reflects the similarity between stocks, we obtain the latent representation of stocks through fitting the training data by optimizing the objective function
| (1) |
In reality, there could exist prior bias of stocks as the prior preference of financial journalists/experts. Hence, we use and as the bias of stock and stock and introduce them to the objective function,
| (2) |
where and is the regularization term that prevents overfitting.
3.2. Capturing evolving stock relations
The latent representation learned from the above global occurrence matrix reflects the static stock relations. Motivated by the fact that the stock relations are changing over time and cross-asset signals are beneficial towards stock price prediction, we further fine-tune the stock representation by building a temporal stock graph and infusing the neighbors’ embedding dynamically.
Temporal stock graph. As shown in Figure 3, the construction of consists of two steps. (1) Construct the stock graph using the co-occurrence matrix. Assume is the stock graph at time , where is the set of stocks. if and only if and are co-mentioned by the news collected at time . The edge eight over and is the number of co-occurrences across all news on date . (2) Due to insufficient number of news about specific stocks in time , we maintain a sliding window ( is a hyper-parameter) to collect a sequence of stock graphs and then construct by taking an exponential moving average of , where we assign a nearby graph a larger weight.
Propagation of neighbors’ embedding via a stock attention mechanism. Given the temporal graph () identifies the dynamic stock structure, it is crucial to appropriately update the stock representation by infusing the current neighbors’ embedding. Motivated by the fact that not all the neighbors contribute to the current stock trend, we filter out the stocks that are too far away from the current stock (See Section 6 for more details). Specifically, for stock , we focus on the nearest neighbors when sorting by the edge weight (which reflects the magnitude of the co-occurrence), where is a hyper-parameter. Formally, let denote the set of nearest neighbors of in at time .
We introduce an attention mechanism (74) to infuse the neighbors embedding weighted by an assigned attention value. In this way, we reward the stocks offering more forecasting power by assigning them larger attention values.
| (3) |
| (4) |
where denotes the fine-tuned stock representation for stock at time , and is the attention weight on the embedding , which is given by
| (5) |
The weights define which neighboring stocks are more significant. measures the compatibility between embeddings and , and is parameterized by a feed-forward network with a single hidden layer, which is jointly trained with other parts of the model. We let have the following functional form
| (6) |
where and are weight matrices, and is the bias vector (74), obtained during model training via backpropagation.
4. Leverage heterogeneous data sources
In this section, we show how to integrate heterogeneous data sources for making forecasts, and how we gather different sources of signals.
4.1. Sequential modeling
Finally, we integrate the stock embedding from Equity2Vec with stock dynamic features into the neural net model to predict the future return. The stock dynamic input is given by , which stems from technical factors and news data. We overlay the stock vector with as an input. Specifically, let be the hidden state at time for stock
| (7) |
where [, ] denotes a direct concatenation.
Keeping in mind that stock trends are highly influenced by a variety of time-series market signals, it is intuitive to take the historical features of a stock as the most influential input to predict its future trend. Therefore, we use Recurrent Neural Networks (55; 69) as the neural net model. LSTM is a variant of the recurrent net, which is capable of learning long-term dependencies. The final output is given by
| (8) |
where denotes the parameters from LSTM.
Temporal attention layer. Since a stock’s historical data contributes to its price trend unequally, we adopt the attention mechanism at the temporal level. We consider
| (9) |
where is the attention weight for prior date indicating the importance of the date. We then compute the weighted sum to incorporate the sequential data and temporal attention.
Assume we have trading days and stocks. We use the mean squared error as the loss function for gradient descent, given by
| (10) |
Alg. 1 describes our entire algorithmic training pipeline. Specifically, Lines 2 & 3 show the procedure to extract long-term relations, and Lines 7-11 show the steps to extract the evolving relation.
4.2. Gathering difference sources of alphas
Financial studies have attributed stock movements to three types of market information, i.e., cross-sectional signals, numerical technical indicators, and news features. To the best of our knowledge, the proposed framework is the first one that fuses technical factors, financial news and stock embedding together for stock predictions.
Stock graph: leveraging cross-sectional signals. Trading on cross-sectional signals (i.e., when Google goes up, Facebook is more likely to go up) is remarkably difficult because we need to examine all possible relations. We leverage news articles that mention multiple stocks to detect correlations between stock prices. Detecting co-movements by news appears to be much more effective than existing methods. Our Equity2Vec learns both long-term and evolving relations.
Technical factors: hand-built features are more effective. We note that features extracted by deep learning (15; 46) are often less effective than features (technical factors) crafted by financial professionals (11). Thus, we overlay an LSTM over technical factors, so that we can simultaneously leverage expertise from financial professionals, and also extract serial correlations from deep learning models.
Financail news Advancing development of Natural Language Processing techniques has inspired increasing efforts on stock trend prediction by automatically analyzing stock-related articles (32; 10; 2). We pre-trained Word2vec (53; 54) on the news corpus from the training data set to produce word embeddings. We average all the word vectors in a piece of news to represent the news vector. For a given date and stock , we compute the daily news vector by extracting the news related to stock and averaging the news vectors within date .
5. Evaluation Methodology
We now evaluate the methodology proposed. We focus on the Chinese market, whose value is the second largest in the world.
5.1. Data Collection
Chinese Equity Market. Our data set consists of daily prices and trading volumes of approximately 3,600 stocks between 2009 and 2018. We consider the universe with all the stocks except for the very illiquid ones. We use open prices (at 9:30 am) to compute the daily returns, and we focus on predicting the next 5-day returns. The last three years of the period are out-of-sample.
Technical Factors. We manually build 337 technical factors based on the previous studies (27; 11; 35; 3; 65). “Technical factor” is a broad term encompassing indicators constructed directly from data related to trading activities. Specifically, all these factors are derived from price and dollar volume by mathematical calculation. Table 1 shows a set of popular technical factors.
News Dataset. We crawled all the financial news between 2009/01/01 and 2018/08/30 from a major Chinese news website Sina222https://finance.sina.com.cn. It has a total number of 2.6 million articles. Each article can refer to one or multiple stocks. On average, a piece of news refers to 2.94 stocks. We link each of the collected news articles to a specific stock if the news mentions the stock in the title or content. The timestamps of news published online are usually unreliable (the dates are reliable, but the hour or minute information is usually inaccurate). We use news signals on the next trading day or later to avoid look-ahead issues.
5.2. Experimental settings
Training and Testing Data. We use three years of data for training, one year of data for validation, and one year for testing. The model is re-trained every testing year. For example, the training set starts from Jan 1, 2012 to Dec 31, 2014. The corresponding validation period is from Jan 15, 2015, to Dec 16, 2015. We use the validation set to tune the hyperparameters and build the model. Then we use the trained model to forecast returns of equity in the same universe from Jan 1, 2016 to Dec 31, 2016, where we set 10 trading days as the “gap”. We set a “gap” between training and validation periods, and validation periods and testing periods to avoid look-ahead issues. The model is then re-trained by using data in the second training period (2013 to 2015) to make forecast on the second testing year.
Parameter Setting. We use the standard grid search to select the hyper-parameters in our experiments. We build the global co-occurrence matrix in Section 3.1 by using all the news before the first day of the testing year. To learn the stocks’ embedding, we tune the dimension of stocks’ representation within {32, 64, 128, 256}. We explore the number of LSTM cell within {2, 5, 10, 20}. We greedily search the number of neighbors for the stock graph from no neighbors to all the neighbors. The sliding window for temporal graph is tuned within {2, 5, 10, 20, 60}. In addition, we tune the learning rate within {0.001, 0.01} with the Adam optimizer (38), and set the batch size within {128, 256}.
Evaluation Metrics. We evaluate our performance in terms of correlation, -statistic, and PnL.
Correlation. Unlike the other regression tasks, correlation (5) is a preferable metric in stock price prediction compared to MSE since the direction instead of magnitude is more crucial for forecasting return.
Significance test (-statistics). The use of -statistics estimators (62) can account for the serial and cross-sectional correlations. Recall that is a vector of responses and is the forecast of a model to be evaluated. We examine whether the signals are correlated with the responses, i.e., for each we run the regression model , and test whether we can reject the null hypothesis that the series for all . Note that the noises in the regression model are serially correlated, and thus we use the Newey-West (62) estimator to adjust for serial correlation issues.
PnL. Profit & Loss (PnL) is a standard performance measure used in trading. PnL captures the total profit or loss of a portfolio over a specified period. The PnL of all forecasts made on day is given by
| (11) |
5.3. Baselines for comparison
To test our proposed deep learning framework, we compare our model against state-of-art baselines, as described below. For all the baselines, we use the validation data set to configure the hyper-parameters.
SFM (83). SFM is designed for stock prediction. It decomposes the hidden states of an LSTM (67) network into multiple frequencies by using Discrete Fourier Transform (DFT) in order for the model to capture signals at different horizons.
HAN (32). This work introduces a so-called hybrid attention technique that translates news into signals. HAN uses Word2Vec to transfer news into vectors, and uses RNN as the modeling method.
AlphaStock (75). AlphaStock integrates deep attention networks reinforcement learning with the optimization of the Sharpe Ratio. For each stock, AlphaStock uses LSTM (68) with attention on hidden states to extract the stock representation. Next, it relies on CAAN, a self-attention layer, to capture the inter-relations among stocks. We implement LSTM with basic CAAN, and change the forecast into returns, instead of winning scores.
Vector Autoregression. We include a standard linear vector autoregression (VAR) (61). VAR is a typical stock forecast baseline. Formally, it assumes , where denotes the features of all stocks, and denotes the future return of all stocks in the universe.
ARRR (81). ARRR is a new regularization technique designed to address the overfitting issue in vector autoregression under the high-dimensional setting. Stock prediction is one of its applications. Specifically, ARRR involves two SVD steps; the first SVD is for estimating the precision matrix of the features, and the second SVD is for solving the matrix denoising problem.
6. Performance and Discussion
In this section, we discuss our overall performance, analyze the effectiveness of -nearest neighbors, the learned stock embedding, and market trading simulation results.
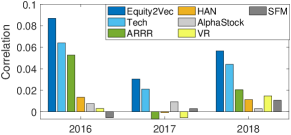
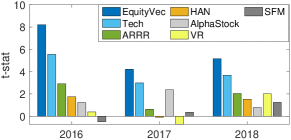
Overall Performance on Correlation and -statistic. Figure 4 and Figure 4 report the comprehensive analysis on all compared methods, for each testing year in terms of both correlation and -statistic. The results confirm that our Equity2Vec method consistently outperforms all other baselines, for each testing year and across all metrics.
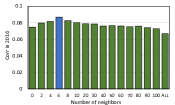
Impact of Different Number of Neighbors. We investigate the number of neighbors against the correlation metric. Figure 5(a) shows that with the increase of , the out-of-sample correlation first increases and then decreases. This indicates the performance gains from our choices on -nearest neighbors graph in Section 3.2.
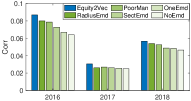
Effect of Learned Stock Representation. To demonstrate the effects of learned stock representations for stock prediction, we investigate the performance of Equity2Vec by replacing the learned stock representations with the following representations:
-
•
NoEmd: Remove the Equity2Vec module.
-
•
PoorMan: Remove the influence from neighbors.
-
•
SectEmd: Replace the embedding with the aggregated embedding from the same sector.
-
•
OneEmd: Replace the embedding with the embedding from all the neighbors.
-
•
RadiusEmd: Instead of using -nearest neighbors, we also used the radius to select neighbors and the radius is a hyper-parameter.
As shown in Figure. 5(b), Equity2Vec achieves better performance than the above five baselines. We have the following observations: (1) Comparing with NoEmd proves the effectiveness of the information aggregated through stock embedding. (2) Comparing with PoorMan and OneEmd enables us to confirm the efficacy of learning evolving relations from -nearest neighbors. (3) Comparing with SectEmd shows that Equity2Vec not just capture merely the sector information. (4) The RadiusEmbd is our variation and also achieved competitive results.
Market Trading Simulation. To further evaluate our method’s effectiveness, we conduct a back-testing by simulating the stock trading for three out-of-sample years. We simulate investments on our signals in two ways:(i) Long-short portfolio. (ii) Long-index portfolio: Long-only minus the market index. We conduct the trading in the daily granularity and select the stocks from the top 20% strongest forecast signals. The position of each stock is proportional to the signal (i.e., the dollar position of -th stock is proportional to our forecast ). The holding period is 5 days. 333Short is implementable in the Chinese market only under particular circumstances, e.g., through brokers in Hong Kong under special arrangements. By allowing short-selling, we can execute on negative forecasts to understand the overall forecasting quality.
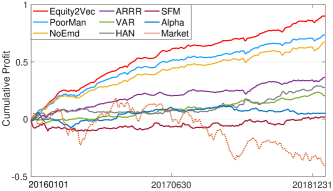
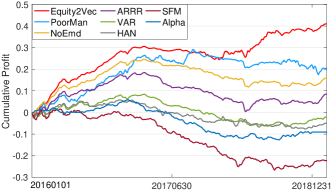
Figure. 6 shows the cumulative PnL for our approach and baselines. We can see that our signals are consistently better than other baselines in both Long-short and Long-index portfolios, suggesting that our method generates stronger and more robust signals for trading.
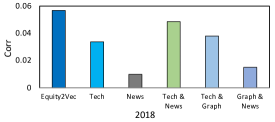
Ablation study To test the effectiveness of different parts of the Equity2Vec, we conduct an ablation study that excludes components and measures the out-of-sample correlation in the year 2018. The results are shown in Figure 7. We draw two main conclusions from these results. (i) Each component has a substantial impact on the performance: the results validate the inclusion of each component in our method. (ii) Effect of cross-categorical learning: the model using graph achieves higher performance than the baselines without it, thus illustrating its ability to capture and leverage latent stock interactions.
7. Interpretation Analysis
In this section, we assess the interpretability for stock relationships, temporal weights in LSTM, and news as follows.
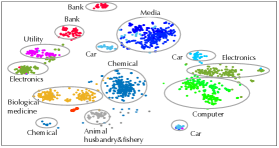
Visualizing Learned Stock Embedding. As depicted in Figure 8, we use t-SNE (52) on our final stock representation to assess the interpretation of the universe of stocks. Each dot represents a stock, and the color denotes the largest sector from Barra (16) associated with the given stock, while the text annotations represent the detailed stock categories. It shows that our Equity2Vec learns the interpretable stock representations that are well aligned with the Barra sectors.
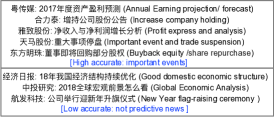
News Interpretation. To understand the news predictive ability, we track back the news from two groups in the test dataset. We focus the samples within the smallest and the samples within the largest errors based on Equation 10. We extract the corresponding news and show the detailed results in Figure 9. We focus on the demonstrative news from these two groups of samples. One can see that the news in the high accuracy group contains significant events with predictive ability, while the news in the low accuracy group mainly has no apparent influence on the stock forecast.
Temporal Attention Explanation. Next, we show the overall attention weights from the testing data set in Table 2 when we use the past 5 days’ historical data. The hyperparameter 5 is set by the performance in the validation dataset. The recent days have larger weights indicating the recent days play more significant roles in the prediction.
| -5day | -4day | -3day | -2day | -1day | |
| Weights | 0.0055 | 0.0265 | 0.1662 | 0.3064 | 0.4954 |
8. Related work
Forecasting future prices of equities has been extensively studied (82; 7; 25; 4; 37; 30; 6; 41; 18; 31; 26; 8; 75; 19; 33; 21; 29; 13; 20; 9; 28; 8; 14; 83; 32; 36; 43). A wide range of practical machine learning (75; 78; 32; 47; 50; 79) techniques such as deep learning, boosting tree, and non-parametric methods are introduced to forecast asset prices. Most have examined how the fundamental characteristics, such as the book/market ratio, capital, and momentum of the issuing firm could affect the price of the asset over the long term, or how various events or macroeconomic factors could cause price changes (12; 66; 37). The studies have tended to use “low-frequency” models because the response horizon is in the order of months (e.g., how a stock’s price changes after 3 months). Linear statistical models need to be used because the data sets are remarkably small, e.g., each asset is associated with only a few data points (e.g., each month corresponds to a data point). “Mid-frequency” models with one or multiple days of forecasting horizon had been studied more extensively in the private sectors. It has been observed that trading activities (e.g., price/volume changes) have a heavier impact on an equity’s short term price movement than fundamental factors so significant effort was devoted to understanding the prediction powers of “technical” factors such as volatility or trading volume changes (75; 8; 19) for empirical asset pricing. Because we can collect a more reasonable amount of data (e.g., one trading day results in one data point), using machine learning techniques to extract interactions becomes possible. Recent years have witnessed explosive development of mid-frequency ML models from both finance and computer science.
“High-frequency” models investigate price changes over an even shorter time horizon (e.g., next 10-second return). The price changes in this horizon are usually driven by the market microstructure (the dynamics of the bid-ask queues). Here, the modeling challenge is more on the computational side. It is often remarkably to fit an ML model properly with an abundant amount of data. So a significant fraction of effort focuses on speeding up the system, which resembles typical system and architecture research (80; 51; 34; 48; 45; 49).
Our work examines the mid-frequency models and focus on recent work using machine learning to forecast asset prices.
Linear Model. Empirical asset pricing (e.g., estimating the “true price” or forecasting the future price) is an important area in Finance (4). Linear regression has been a dominating methodology to forecast equity returns, especially for intraday tradings (30; 6; 41; 18). Because these linear models usually use a large number of features, regularizations are usually needed (33; 37; 61; 81). For example, recently researchers examined regularization for “ultra-high dimensional” setting, in which the number of features could be significantly larger than the number of observations (81).
Deep Learning. There are two major approaches to forecast equity returns. Approach 1. ANN as a blackbox for standard “factors.” First, “factors” that are known to be correlated with returns are constructed. These factors can be viewed as features constructed by financial experts. Second, the factors are fed into standard ANN black boxes so that non-linear models are learned (see e.g., (31; 26) and references therein). Little effort is made to optimize ANN’s architecture or algorithm. Approach 2. Forecasting the price time-series. This approach views the price, trading volume, and other statistics representing trading activities as time series and designs specialized deep learning models to extract signals from the time series. Little feature engineering is done for these models. See e.g., (20; 67; 15; 46; 70; 44). Approach 1 represents the line of thought that feature engineering is critical in building machine learning models, whereas Approach 2 represents the mindset that deep learning can automatically extract features so effort on feature engineering should be avoided. The co-movement effect is often ignored by the previous studies. Only a few works on stock predictions have explored this effect (8; 75; 19). However, (8) relies on non-public dataset and learns the relations in a static way. (19) consider only consider the relation to a particular type (sector and supply chain) and ignore the other relations, such as stocks affected by the same event. (75) has unsatisfying performance (even in their own reports on experiments) and only consider the co-movements of historical prices.
News. NLP-based techniques (77) are developed to correlate news with the movement of stock prices. Earlier works use matrix factorization approaches (see e.g., (56; 72)) whereas more recent approaches use deep learning methods (14; 32; 10; 2). These methods exclusively use the news to predict equity returns, and they do not consider any other “factors” that can impact the stock prices.
Factor Model (Cross-sectional Returns). The movement of two or more stocks usually can be explained by a small subset of factors. For example, and often co-move because their return can be explained by the technical factors. The so-called “factor model” (e.g., (17; 71; 83; 81)) can effectively capture the co-movement of prices but these methods usually rely on PCA/SVD techniques and are not computationally scalable.
Comparison. 1. Comparing to existing linear models. Our method is more effective at extract non-linear signals. 2. Comparing to existing DL models. We find that we need both careful feature engineering and optimizing DL techniques to use technical factors in the most effective manner, moreover, we do not restrict the stock relation into a particular type and learn the evolving relations. 3. Comparing with News/NLP-based techniques. We do not exclusively rely on the news. Instead, we explicitly model the interaction between news and other factors so that our model avoids low quality signals (e.g., news-based signals could be essentially trading momentum), and 4. Comparing with factor models. A key innovation of our model is the introduction of Equity2Vec component. This component models the interaction between stocks and circumvents SVD computation on large matrices.
9. Conclusion and future work
This paper presents a novel approach to answer two research questions. (i) How can we interpret the relationship between stocks? (ii) How can we leverage heterogeneous data sources to extract high-quality forecasting power? Through extensive evaluation against the state-of-art baselines, we confirm that our method achieves superior performance. Meanwhile, the results from different trading simulators demonstrate that we can effectively monetize the signals. In addition, we interpret the stock relationships highlighting they align well with the sectors defined by commercial risk models, extract important technical factors, and explain what kind of news has more predictive power.
We identify several potential future directions. First, it is worth exploring more effective features from social media such as financial discussion forums. As individual investors often engage in insightful discussions on finance topics and stock movements, the large volume of such discussions could indicate potential upcoming major events. Second, the proposed Equity2Vec can generalized to other problems, such as mining the relations between futures.
10. Acknowledgement
We thank anonymous reviewers for helpful comments and suggestions. Christopher G. Brinton was supported in part by the Charles Koch Foundation. Qiong Wu, Zheng Zhang and Zhenming Liu are supported by NSF grants NSF-2008557, NSF-1835821, and NSF-1755769. Mihai Cucuringu and Andrea Pizzoferrato acknowledge support from The Alan Turing Institute EPSRC grant EP/N510129/1. Andrea Pizzoferrato also acknowledges support from the National Group of Mathematical Physics (GNFM-INdAM), and by the EPSRC grant EP/P002625/1. The authors acknowledge William & Mary Research Computing for providing computational resources and technical support that have contributed to the results reported within this paper.
References
- (1)
- Akita et al. (2016) Ryo Akita, Akira Yoshihara, Takashi Matsubara, and Kuniaki Uehara. 2016. Deep learning for stock prediction using numerical and textual information. In ICIS.
- Amihud (2002) Yakov Amihud. 2002. Illiquidity and stock returns: cross-section and time-series effects. Journal of financial markets (2002).
- Bali et al. (2016) Turan G Bali, Robert F Engle, and Scott Murray. 2016. Empirical asset pricing: The cross section of stock returns. John Wiley & Sons.
- Benesty et al. (2009) Jacob Benesty, Jingdong Chen, Yiteng Huang, and Israel Cohen. 2009. Pearson correlation coefficient. In Noise reduction in speech processing. Springer, 1–4.
- Cakici et al. (2017) Nusret Cakici, Kalok Chan, and Kudret Topyan. 2017. Cross-sectional stock return predictability in China. The European Journal of Finance (2017).
- Campbell et al. (1997) John Y Campbell, John J Champbell, John W Campbell, Andrew W Lo, Andrew W Lo, and A Craig MacKinlay. 1997. The econometrics of financial markets. princeton University press.
- Chen et al. (2019b) Chi Chen, Li Zhao, Jiang Bian, et al. 2019b. Investment behaviors can tell what inside: Exploring stock intrinsic properties for stock trend prediction. In KDD.
- Chen et al. (2019a) Luyang Chen, Markus Pelger, and Jason Zhu. 2019a. Deep learning in asset pricing. Available at SSRN 3350138 (2019).
- Chiong et al. (2018) Raymond Chiong, Zongwen Fan, Zhongyi Hu, Marc TP Adam, Bernhard Lutz, and Dirk Neumann. 2018. A sentiment analysis-based machine learning approach for financial market prediction via news disclosures. In Proceedings of the Genetic and Evolutionary Computation Conference Companion. 278–279.
- Colby and Meyers (1988) Robert W Colby and Thomas A Meyers. 1988. The encyclopedia of technical market indicators. Dow Jones-Irwin Homewood, IL.
- Das et al. (1998) Somnath Das, Carolyn B Levine, and Konduru Sivaramakrishnan. 1998. Earnings predictability and bias in analysts’ earnings forecasts. Accounting Review (1998).
- De Prado (2018) Marcos Lopez De Prado. 2018. Advances in financial machine learning. John Wiley & Sons.
- Ding et al. (2015) Xiao Ding, Yue Zhang, Ting Liu, and Junwen Duan. 2015. Deep learning for event-driven stock prediction. In IJCAI.
- Doering et al. ([n.d.]) Jonathan Doering, Michael Fairbank, and Sheri Markose. [n.d.]. Convolutional neural networks applied to high-frequency market microstructure forecasting. In CEEC.
- Fabozzi and Markowitz (2011) Frank J Fabozzi and Harry M Markowitz. 2011. The theory and practice of investment management: Asset Allocation, Valuation, Portfolio Construction, and Strategies.
- Fama and French (1992) Eugene F Fama and Kenneth R French. 1992. The Cross-Section of Expected Stock Returns. Journal of Finance (1992).
- Fama and French (2016) Eugene F Fama and Kenneth R French. 2016. Dissecting anomalies with a five-factor model. The Review of Financial Studies 29, 1 (2016), 69–103.
- Feng et al. (2019) Fuli Feng, Xiangnan He, Xiang Wang, Cheng Luo, Yiqun Liu, and Tat-Seng Chua. 2019. Temporal relational ranking for stock prediction. TOIS (2019).
- Feng et al. (2018) Guanhao Feng, Nicholas G Polson, and Jianeng Xu. 2018. Deep learning in asset pricing. arXiv preprint (2018).
- Friedman et al. (2001) Jerome Friedman, Trevor Hastie, and Robert Tibshirani. 2001. The elements of statistical learning.
- Fu et al. (2013) Tak-Chung Fu, Chi-Pang Chung, and Fu-Lai Chung. 2013. Adopting genetic algorithms for technical analysis and portfolio management. Computers & Mathematics with Applications 66, 10 (2013), 1743–1757.
- Gencay and Stengos (1998) Ramazan Gencay and Thanasis Stengos. 1998. Moving average rules, volume and the predictability of security returns with feedforward networks. Journal of Forecasting (1998).
- Göçken et al. (2016) Mustafa Göçken, Mehmet Özçalıcı, Aslı Boru, and Ayşe Tuğba Dosdoğru. 2016. Integrating metaheuristics and artificial neural networks for improved stock price prediction. Expert Systems with Applications 44 (2016), 320–331.
- Grinold and Kahn (2000) Richard C Grinold and Ronald N Kahn. 2000. Active portfolio management. (2000).
- Gu et al. (2018) Shihao Gu, Bryan Kelly, and Dacheng Xiu. 2018. Empirical asset pricing via machine learning. Technical Report.
- Gu et al. (2020) Shihao Gu, Bryan Kelly, and Dacheng Xiu. 2020. Empirical asset pricing via machine learning. The Review of Financial Studies (2020).
- Gu et al. (2019) Shihao Gu, Bryan T Kelly, and Dacheng Xiu. 2019. Autoencoder asset pricing models. Available at SSRN (2019).
- Han et al. (2018) Yufeng Han, Ai He, David Rapach, and Guofu Zhou. 2018. What Firm Characteristics Drive US Stock Returns? Available at SSRN 3185335 (2018).
- Harvey et al. (2016) Campbell R Harvey, Yan Liu, and Heqing Zhu. 2016. … and the cross-section of expected returns. The Review of Financial Studies 29, 1 (2016), 5–68.
- Heaton et al. (2017) JB Heaton, NG Polson, and Jan Hendrik Witte. 2017. Deep learning for finance: deep portfolios. Applied Stochastic Models in Business and Industry (2017).
- Hu et al. (2018) Ziniu Hu, Weiqing Liu, et al. 2018. Listening to chaotic whispers: A deep learning framework for news-oriented stock trend prediction. In WSDM.
- Huang et al. (2019) Dashan Huang, Jiaen Li, and Guofu Zhou. 2019. Shrinking factor dimension: A reduced-rank approach. Available at SSRN 3205697 (2019).
- Ibrahim et al. (2019) Mohamed Assem Ibrahim, Hongyuan Liu, Onur Kayiran, and Adwait Jog. 2019. Analyzing and leveraging remote-core bandwidth for enhanced performance in GPUs. In PACT. IEEE.
- Kakushadze (2016) Zura Kakushadze. 2016. 101 formulaic alphas. Wilmott (2016).
- Ke et al. (2019) Guolin Ke, Zhenhui Xu, et al. 2019. DeepGBM: A deep learning framework distilled by GBDT for online prediction tasks. In KDD.
- Kelly et al. (2019) Bryan T Kelly, Seth Pruitt, et al. 2019. Characteristics are covariances: A unified model of risk and return. JFE (2019).
- Kingma and Ba (2014) Diederik P Kingma and Jimmy Ba. 2014. Adam: A method for stochastic optimization. arXiv preprint arXiv:1412.6980 (2014).
- Kirkpatrick II and Dahlquist (2010) Charles D Kirkpatrick II and Julie A Dahlquist. 2010. Technical analysis: the complete resource for financial market technicians. FT press.
- Koren et al. (2009) Yehuda Koren, Robert Bell, and Chris Volinsky. 2009. Matrix factorization techniques for recommender systems. Computer 42, 8 (2009), 30–37.
- Kozak et al. (2020) Serhiy Kozak, Stefan Nagel, and Shrihari Santosh. 2020. Shrinking the cross-section. Journal of Financial Economics 135, 2 (2020), 271–292.
- Li et al. (2016) Lili Li, Shan Leng, Jun Yang, and Mei Yu. 2016. Stock Market Autoregressive Dynamics: A Multinational Comparative Study with Quantile Regression. Mathematical Problems in Engineering 2016 (2016).
- Li et al. (2019) Zhige Li, Derek Yang, Li Zhao, Jiang Bian, Tao Qin, and Tie-Yan Liu. 2019. Individualized indicator for all: Stock-wise technical indicator optimization with stock embedding. In KDD.
- Lim et al. (2019) Bryan Lim, Stefan Zohren, and Stephen Roberts. 2019. Enhancing time-series momentum strategies using deep neural networks. The Journal of Financial Data Science 1, 4 (2019), 19–38.
- Lin et al. (2018) Huanxin Lin, Cho-Li Wang, and Hongyuan Liu. 2018. On-GPU thread-data remapping for branch divergence reduction. TACO (2018).
- Lin et al. (2017) Tao Lin, Tian Guo, and Karl Aberer. 2017. Hybrid neural networks for learning the trend in time series. In IJCAI.
- Liu et al. (2019) Ao Liu, Qiong Wu, Zhenming Liu, and Lirong Xia. 2019. Near-Neighbor Methods in Random Preference Completion. In AAAI.
- Liu et al. (2018) Hongyuan Liu, Mohamed Ibrahim, Onur Kayiran, Sreepathi Pai, and Adwait Jog. 2018. Architectural support for efficient large-scale automata processing. In MICRO. IEEE.
- Liu et al. (2016) Hongyuan Liu, King Tin Lam, Huanxin Lin, Cho-Li Wang, and Junchao Ma. 2016. Lightweight Dependency Checking for Parallelizing Loops with Non-Deterministic Dependency on GPU. In ICPADS. IEEE.
- Liu et al. (2021) Hongyuan Liu, Bogdan Nicolae, Sheng Di, Franck Cappello, and Adwait Jog. 2021. Accelerating DNN Architecture Search at Scale Using Selective Weight Transfer. In Proceedings of the IEEE International Conference on Cluster Computing.
- Liu et al. (2020) Hongyuan Liu, Sreepathi Pai, and Adwait Jog. 2020. Why gpus are slow at executing NFAs and how to make them faster. In ASPLOS.
- Maaten and Hinton (2008) Laurens van der Maaten and Geoffrey Hinton. 2008. Visualizing data using t-SNE. Journal of machine learning research 9, Nov (2008), 2579–2605.
- Mikolov et al. (2013) Tomas Mikolov, Kai Chen, Greg Corrado, and Jeffrey Dean. 2013. Efficient estimation of word representations in vector space. arXiv preprint (2013).
- Mikolov et al. (2015) Tomas Mikolov, Kai Chen, Gregory S Corrado, and Jeffrey A Dean. 2015. Computing numeric representations of words in a high-dimensional space.
- Mikolov et al. (2010) Tomáš Mikolov, Martin Karafiát, Lukáš Burget, Jan Černockỳ, and Sanjeev Khudanpur. 2010. Recurrent neural network based language model. In Eleventh annual conference of the international speech communication association.
- Ming et al. (2014) Felix Ming, Fai Wong, Zhenming Liu, and Mung Chiang. 2014. Stock market prediction from WSJ: text mining via sparse matrix factorization. In ICDM.
- Mittermayer and Knolmayer (2006) Marc-Andre Mittermayer and Gerhard F Knolmayer. 2006. Newscats: A news categorization and trading system. In ICDM’06. Ieee, 1002–1007.
- Musoff and Zarchan (2009) Howard Musoff and Paul Zarchan. 2009. Fundamentals of Kalman filtering: a practical approach. American Institute of Aeronautics and Astronautics.
- Neely (1997) Christopher J Neely. 1997. Technical analysis in the foreign exchange market: a layman’s guide. Review-Federal Reserve Bank of St. Louis 79, 5 (1997), 23.
- Neely and Weller (2011) Christopher J Neely and Paul A Weller. 2011. Technical analysis in the foreign exchange market. Federal Reserve Bank of St. Louis Working Paper No (2011).
- Negahban and Wainwright (2011) Sahand Negahban and Martin J Wainwright. 2011. Estimation of (near) low-rank matrices with noise and high-dimensional scaling. ANN STAT (2011).
- Newey and West (1986) Whitney K Newey and Kenneth D West. 1986. A simple, positive semi-definite, heteroskedasticity and autocorrelation consistent covariance matrix. Technical Report.
- Patel et al. (2015) Jigar Patel, Sahil Shah, Priyank Thakkar, and Ketan Kotecha. 2015. Predicting stock market index using fusion of machine learning techniques. Expert Systems with Applications 42, 4 (2015), 2162–2172.
- Pennington et al. (2014) Jeffrey Pennington, Richard Socher, and Christopher D Manning. 2014. Glove: Global vectors for word representation. In EMNLP.
- Posner (2014) Richard A Posner. 2014. Economic analysis of law.
- Pritamani and Singal (2001) Mahesh Pritamani and Vijay Singal. 2001. Return predictability following large price changes and information releases. Journal of Banking & Finance (2001).
- Rather et al. (2015) Akhter Mohiuddin Rather, Arun Agarwal, and VN Sastry. 2015. Recurrent neural network and a hybrid model for prediction of stock returns. EXPERT SYST APPL (2015).
- Sak et al. (2014) Hasim Sak, Andrew W Senior, and Françoise Beaufays. 2014. Long short-term memory recurrent neural network architectures for large scale acoustic modeling. (2014).
- Schuster and Paliwal (1997) Mike Schuster and Kuldip K Paliwal. 1997. Bidirectional recurrent neural networks. IEEE Transactions on Signal Processing (1997).
- Sezer et al. (2020) Omer Berat Sezer, Mehmet Ugur Gudelek, and Ahmet Murat Ozbayoglu. 2020. Financial time series forecasting with deep learning: A systematic literature review: 2005–2019. Applied Soft Computing 90 (2020), 106181.
- Stock and Watson (2011) James H Stock and Mark Watson. 2011. Dynamic factor models. Oxford Handbooks Online (2011).
- Sun et al. (2016) Andrew Sun, Michael Lachanski, and Frank J Fabozzi. 2016. Trade the tweet: Social media text mining and sparse matrix factorization for stock market prediction. International Review of Financial Analysis 48 (2016), 272–281.
- Ticknor (2013) Jonathan L Ticknor. 2013. A Bayesian regularized artificial neural network for stock market forecasting. Expert Systems with Applications (2013).
- Vaswani et al. (2017) Ashish Vaswani, Noam Shazeer, Niki Parmar, Jakob Uszkoreit, Llion Jones, Aidan N Gomez, Łukasz Kaiser, and Illia Polosukhin. 2017. Attention is all you need. In Advances in neural information processing systems. 5998–6008.
- Wang et al. (2019) Jingyuan Wang, Yang Zhang, Ke Tang, Junjie Wu, and Zhang Xiong. 2019. AlphaStock: A Buying-Winners-and-Selling-Losers Investment Strategy using Interpretable Deep Reinforcement Attention Networks. In KDD.
- Wang et al. (2021) Qihan Wang, Wei Niu, et al. 2021. HEALS: A Parallel eALS Recommendation System on CPU/GPU Heterogeneous Platforms. In 2021 HiPC.
- Wu et al. (2021) Qiong Wu, Adam Hare, Sirui Wang, Yuwei Tu, Zhenming Liu, Christopher G Brinton, and Yanhua Li. 2021. BATS: A Spectral Biclustering Approach to Single Document Topic Modeling and Segmentation. TIST (2021).
- Wu et al. (2019) Qiong Wu, Wen-Ling Hsu, Tan Xu, Zhenming Liu, George Ma, Guy Jacobson, and Shuai Zhao. 2019. Speaking with Actions - Learning Customer Journey Behavior. In ICSC.
- Wu et al. (2015) Qiong Wu, Lucas CK Hui, Cheuk Yu Yeung, and Tat Wing Chim. 2015. Early car collision prediction in VANET. In ICCVE.
- Wu and Liu (2021) Qiong Wu and Zhenming Liu. 2021. Rosella: A Self-Driving Distributed Scheduler for Heterogeneous Clusters. In MSN.
- Wu et al. (2020) Qiong Wu, Felix M.F. Wong, Yanhua Li, Zhenming Liu, and Varun Kanade. 2020. Adaptive Reduced Rank Regression. In Advances in Neural Information Processing Systems (NeurIPS.
- Wüthrich et al. (1998) Beat Wüthrich, D Permunetilleke, et al. 1998. Daily prediction of major stock indices from textual www data. Hkie transactions (1998).
- Zhang et al. (2017) Liheng Zhang, Charu Aggarwal, and Guo-Jun Qi. 2017. Stock price prediction via discovering multi-frequency trading patterns. In KDD.