Bright C2H emission in protoplanetary disks in Lupus: high volatile C/O¿1 ratios
Abstract
Context. Recent ALMA surveys in different star-forming regions have shown that CO emission in protoplanetary disks is much fainter than expected. Accordingly, CO-based gas masses and gas/dust ratios are orders of magnitude lower than previously thought. This may be explained either as fast gas dispersal, or as chemical evolution and locking up of volatiles in larger bodies leading to the low observed CO fluxes. The latter processes lead to enhanced C/O ratios in the gas, which may be reflected in enhanced abundances of carbon-bearing molecules like C2H.
Aims. The goal of this work is to employ C2H observations to understand whether low CO fluxes are caused by volatile depletion, or by fast gas dissipation.
Methods. We present ALMA Cycle 4 C2H (, , and ) observations of a subsample of nine sources in the Lupus star-forming region. The integrated C2H emission is determined and compared to previous CO isotopologue observations and physical-chemical model predictions.
Results. Seven out of nine disks are detected in C2H, whose line emission is almost as bright as 13CO. All detections are significantly brighter than the typical sensitivity of the observations, hinting at a bimodal distribution of the C2H line intensities. This conclusion is strengthened when our observations are compared with additional C2H observations of other disks. When compared with physical-chemical models run with DALI, the observed C2H fluxes can be reproduced only if some level of volatile carbon and oxygen depletion is allowed and [C]/[O]¿1 in the gas. Models with reduced gas/dust ratios near unity fail instead to reproduce the observed C2H line luminosity. A steeper than linear correlation between C2H and CN emission line is found for the Lupus disks. This is linked to the fact that C2H emission lines are affected more strongly by [C]/[O] variations than CN lines. Ring-like structures are detected both in C2H and in continuum emission but, as for CN, they do not seem to be connected. Sz 71 shows ring shaped emission in both C2H and CN with the location of the peak intensity coinciding, within our 30 au resolution.
Conclusions. Our new ALMA C2H observations favour volatile carbon and oxygen depletion rather than fast gas dispersal to explain the faint CO observations for most of the disks. This result has implications for disk-evolution and planet-formation theories, as disk gas masses may be larger than expected if CO is considered to be the main carbon carrier in the gas phase.
Key Words.:
1 Introduction
Protoplanetary disks are studied since decades and thousands of exoplanets have been discovered and characterised in the last 20 years. Yet, how disks evolve and lead to the formation of such planets is unclear. In particular, disk parameters, such as their surface density distribution and their vertical structure, and even more fundamental properties such as their total mass and the gas-to-dust mass ratio, are poorly constrained by observations.
Large mm-sized grains located in the disk midplane, which account for the bulk of the dust mass, are usually traced by their thermal continuum emission at (sub-)mm wavelengths. However, significant assumptions on the dust opacity, on its temperature, and on the optical depth of the continuum emission have to be made, in order to obtain the total dust mass (see e.g, Andrews et al., 2013; Testi et al., 2014; Pascucci et al., 2016; Tripathi et al., 2017; Ansdell et al., 2018).
The bulk of the gas is typically traced by carbon monoxide’s (CO) less abundant isotopologue emission through pure rotational lines, which originate in the warm molecular layer of the disk. Being the second most abundant molecule after molecular hydrogen (H2), and having a well known and relatively simple chemistry, CO is typically used to trace the bulk of the gas in disks. More precisely, 13CO and C18O emission is less optically thick and best suited to get information about the column densities and to derive the disk total mass (van Zadelhoff et al., 2001; Williams & Best, 2014). Freeze-out and isotope-selective photodissociation, the main processes governing the abundance of CO in disks, are implemented with various levels of detail in different physical-chemical disk models (e.g., Visser et al., 2009; Williams & Best, 2014; Miotello et al., 2014; Woitke et al., 2016) and properly considered in the data analysis. Additionally, a big assumption regarding the disk volatile [C]/[H] ratio is needed to convert CO mass to H2 mass; typically the [C]/[H] = value of the diffuse ISM is used and presumed constant throughout the disk, which results in CO locking up the bulk of the volatile elemental carbon with respect to hydrogen.
Thanks to the advent of the Atacama Large Millimeter/submillimeter Array (ALMA), large surveys of protoplanetary disks in different star forming regions have been carried out to study the gas and dust components simultaneously (Ansdell et al., 2016, 2017; Barenfeld et al., 2016; Eisner et al., 2016; Pascucci et al., 2016). A result that is common to these surveys is that CO emission from disks is fainter than expected (Miotello et al., 2017; Long et al., 2017). This may be interpreted as lack of gas due to fast disk dispersal, or as lack of volatile carbon that leads to faint CO lines (Favre et al., 2013; Ansdell et al., 2016; Schwarz et al., 2016; Miotello et al., 2017). The second interpretation is in line with previous studies where HD-based mass measurements of a few bright disks (TW Hya, DM Tau and GM Aur) were found to be incompatible with much smaller CO-based disk masses, that assume a normal ISM volatile carbon abundance (Bergin et al., 2013; Favre et al., 2013; McClure et al., 2016). In particular, it was shown that the TW Hya disk needs to be depleted in volatile carbon by one to two orders of magnitude in order to reproduce the HD and CO isotopologue line emission (Favre et al., 2013; Kama et al., 2016; Trapman et al., 2017). Furthermore, in order to reproduce hydrocarbon observations, more precisely C2H emission, volatile oxygen needs to be depleted too and by a larger amount than carbon, in order to get to carbon-to-oxygen ratios ([C]/[O]) larger than one (Kastner et al., 2015; Kama et al., 2016; Bergin et al., 2016). Pre-ALMA observations of C2H were carried out by Dutrey et al. (1997) for DM Tau and GG Ta, by Henning et al. (2010) for MWC 480, LkCa 15 and DM Tau, and by Kastner et al. (2015) for TW Hya. ALMA C2H data have been published for TW Hya, DM Tau, IM Lup and V4046 Sgr.(Bergin et al., 2016; Cleeves et al., 2018; Kastner et al., 2018). Similarly to TW Hya and DM Tau, volatile carbon and oxygen abundances have been constrained in the IM Lup disk based on the detection of C2H and found to be depleted (Cleeves et al., 2018). During revision of this manuscript, Bergner et al. (2019) have published a survey of C2H observations of 14 disks observed with ALMA spanning a range of ages, stellar luminosities, and stellar masses, which cover some of the sources mentioned above.
More generally, it is known that volatile oxygen must be depleted thanks to the weak/non-detections of H2O lines observed by the Herschel Space Observatory (Hogerheijde et al., 2011; Du et al., 2017). This implies that volatile oxygen is locked up in larger bodies in the midplane that do not circulate to larger disk heights where the water would be photodesorbed. Carbon depletion may be caused by two different processes. Similarly to oxygen, carbon may be locked up in larger bodies and sequestered in the midplane (Krijt et al., 2018). Another option is chemical transformation of carbon, most notably into CO2, CH3OH and hydrocarbons (Eistrup et al., 2016, 2018; Yu et al., 2017a, b; Bosman et al., 2017, 2018; Schwarz et al., 2018).
If [C]/[O]¿1, some carbon is left free from CO and is available to create more complex molecules, such as hydrocarbons. Moreover, if the process of volatile depletion happens by incorporating carbon and oxygen in larger grains which settle to the midplane and drift inwards, the disk regions where this happens would be more exposed to UV radiation. High carbon-to-oxygen ratios combined with strong UV irradiation are the right conditions to boost hydrocarbon emission (Bergin et al., 2016). If the faint CO lines found in protoplanetary disks are due to high levels of volatile depletion rather than to low gas-to-dust ratios, this should be reflected in strong hydrocarbons – for instance C2H – fluxes.
To address these questions, new Cycle 4 ALMA C2H line emission data have been observed in a subsample of disks in the Lupus star-forming region and are presented in Sec. 2. The main results, shown in Sec. 3, are discussed in Sec. 4 where C2H line emission is linked to the volatile [C]/[O] ratio in disks.
| Target | RA | Dec | 1(a) | 2(a) | log 2(a) | 3(b) | 3(b) | 4(c) | |
|---|---|---|---|---|---|---|---|---|---|
| [J2000] | [J2000] | [mJy km s-1] | [mJy] | [mJy km s-1] | [pc] | ||||
| Sz 98 | 16:08:22.481 | -39:04:46.812 | 0.67 | 1.53 | -0.71 | 110157 | 237.290.51 | 506120 | 156.2 |
| Sz 71 | 15:46:44.716 | -34:30:36.057 | 0.41 | 0.33 | -2.17 | 110146 | 166.040.37 | 1298107 | 155.9 |
| J16070854-3914075 | 16:07:08.539 | -39:14:07.885 | - | - | - | 64755 | 92.070.49 | 1232173 | 175.8 |
| Sz 114 | 16:09:01.836 | -39:05:12.790 | 0.19 | 0.21 | -2.68 | 38332 | 96.410.50 | 71650 | 162.2 |
| MY Lup | 16:00:44.503 | -41:55:31.271 | 1.09 | 0.85 | -1.00 | 28421 | 176.810.56 | 87454 | 156.6 |
| J16090141-3925119 | 16:09:01.405 | -39:25:12.345 | 0.2 | 0.07 | -1.5 | 20046 | 17.500.68 | 163789 | 164.3 |
| Sz 129 | 15:59:16.458 | -41:57:10.662 | 0.78 | 0.43 | -1.13 | 10716 | 181.120.52 | 63680 | 161.7 |
| J16070384-3911113 | 16:07:03.825 | -39:11:11.756 | - | 0.003 | -5.40 | ¡16.1(d) | 4.520.55 | 124298 | 150.0 |
| Sz 68 | 15:45:12.848 | -34:17:30.986 | - | 5.42 | 1.18 | ¡5.3(d) | 150.370.46 | 915131 | 154.2 |
2 Observations
Observations of ten protoplanetary disks in the Lupus star-forming region were acquired with ALMA in Cycle 4, under the project code 2017.1.00495.S (PI: Miotello A.). The targets were selected among the brightest Lupus disks in continuum emission as those detected in CO isotopologues and in CN (Ansdell et al., 2018; van Terwisga et al., 2018) and with CO-based gas-to-dust ratios ranging from 100 to 0.1 (see Table 1). Six sources, J16011549-4152351, J16070854-3914075, MY Lup, Sz 114, Sz 71 and Sz 98, were observed on 2017 July 12 with 49 antennas (16.7-2700 m baselines) using J1517-2422 and J1610-3958 as calibrators. Four targets, J16070384-3911113, J16090141-3925119, Sz 129 andSz 68, were observed on 2017 July 15 with 42 antennas (18.6-1500 m baselines) using J1427-4206 and J1610-3958 as calibrators. The typical integration time was approximatively 20 minutes on source. We estimate a flux calibration error of 10% based on variations in the flux calibrators.
The spectral setup included five windows covering C2H, c-C3H2, SO, H13CO+, and H2CO lines, and one spectral window devoted to the continuum emission centred on 246 GHz. Here, together with the continuum data, we present only the C2H ( and ) line observations, whose spectral window was centred on GHz, with bandwidth of 117 MHz, channel width of 0.14 MHz, and velocity resolution of 0.16 km s-1. Only two hyperfine components ( and ) of the C2H () line are covered. No clear detection of the other molecules is found in any of the targeted sources.
From the pipeline calibrated data we performed (only phase and not amplitude) self-calibration using each source’s continuum emission. The data were imaged using the clean task in CASA version 4.7.2 using natural weighting and the achieved beam size is 0.2 0.3 arcseconds. Images are presented in Fig. 1. The typical achieved rms is between 5 and 10 mJy km s-1. Integrated fluxes, with the achieved rms are reported for each source in Table 1, together with 13CO integrated fluxes and continuum flux densities, taken from Ansdell et al. (2016).
Similarly to what was found in the 12CO data, the C2H emission in J16011549-4152351 is completely contaminated by the foreground cloud. Therefore, it is impossible to extract any meaningful information on the disk’s hydrocarbon emission. For this reason J16011549-4152351 is excluded from the analysis presented in this paper.
3 Results
3.1 Integrated fluxes
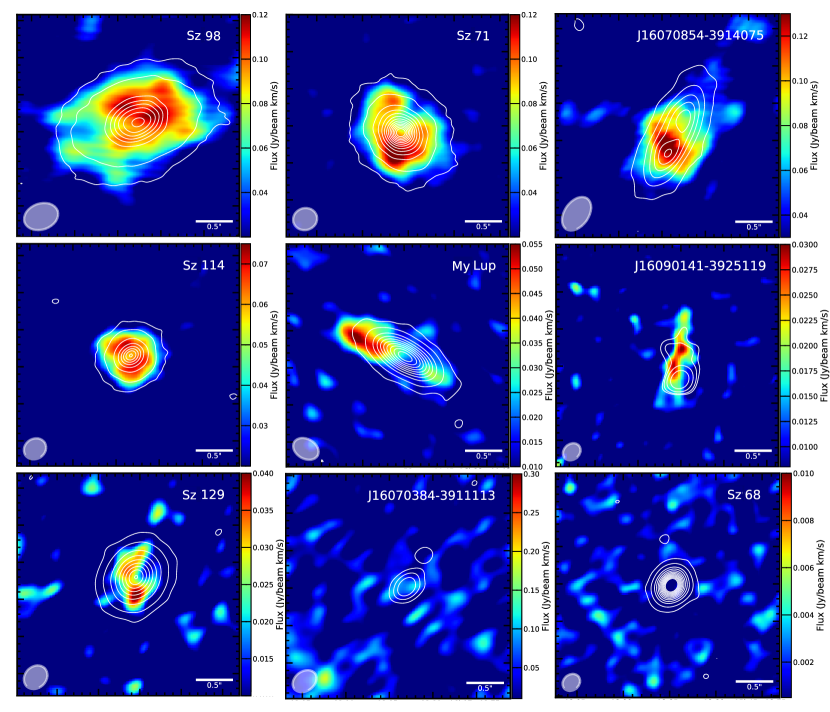
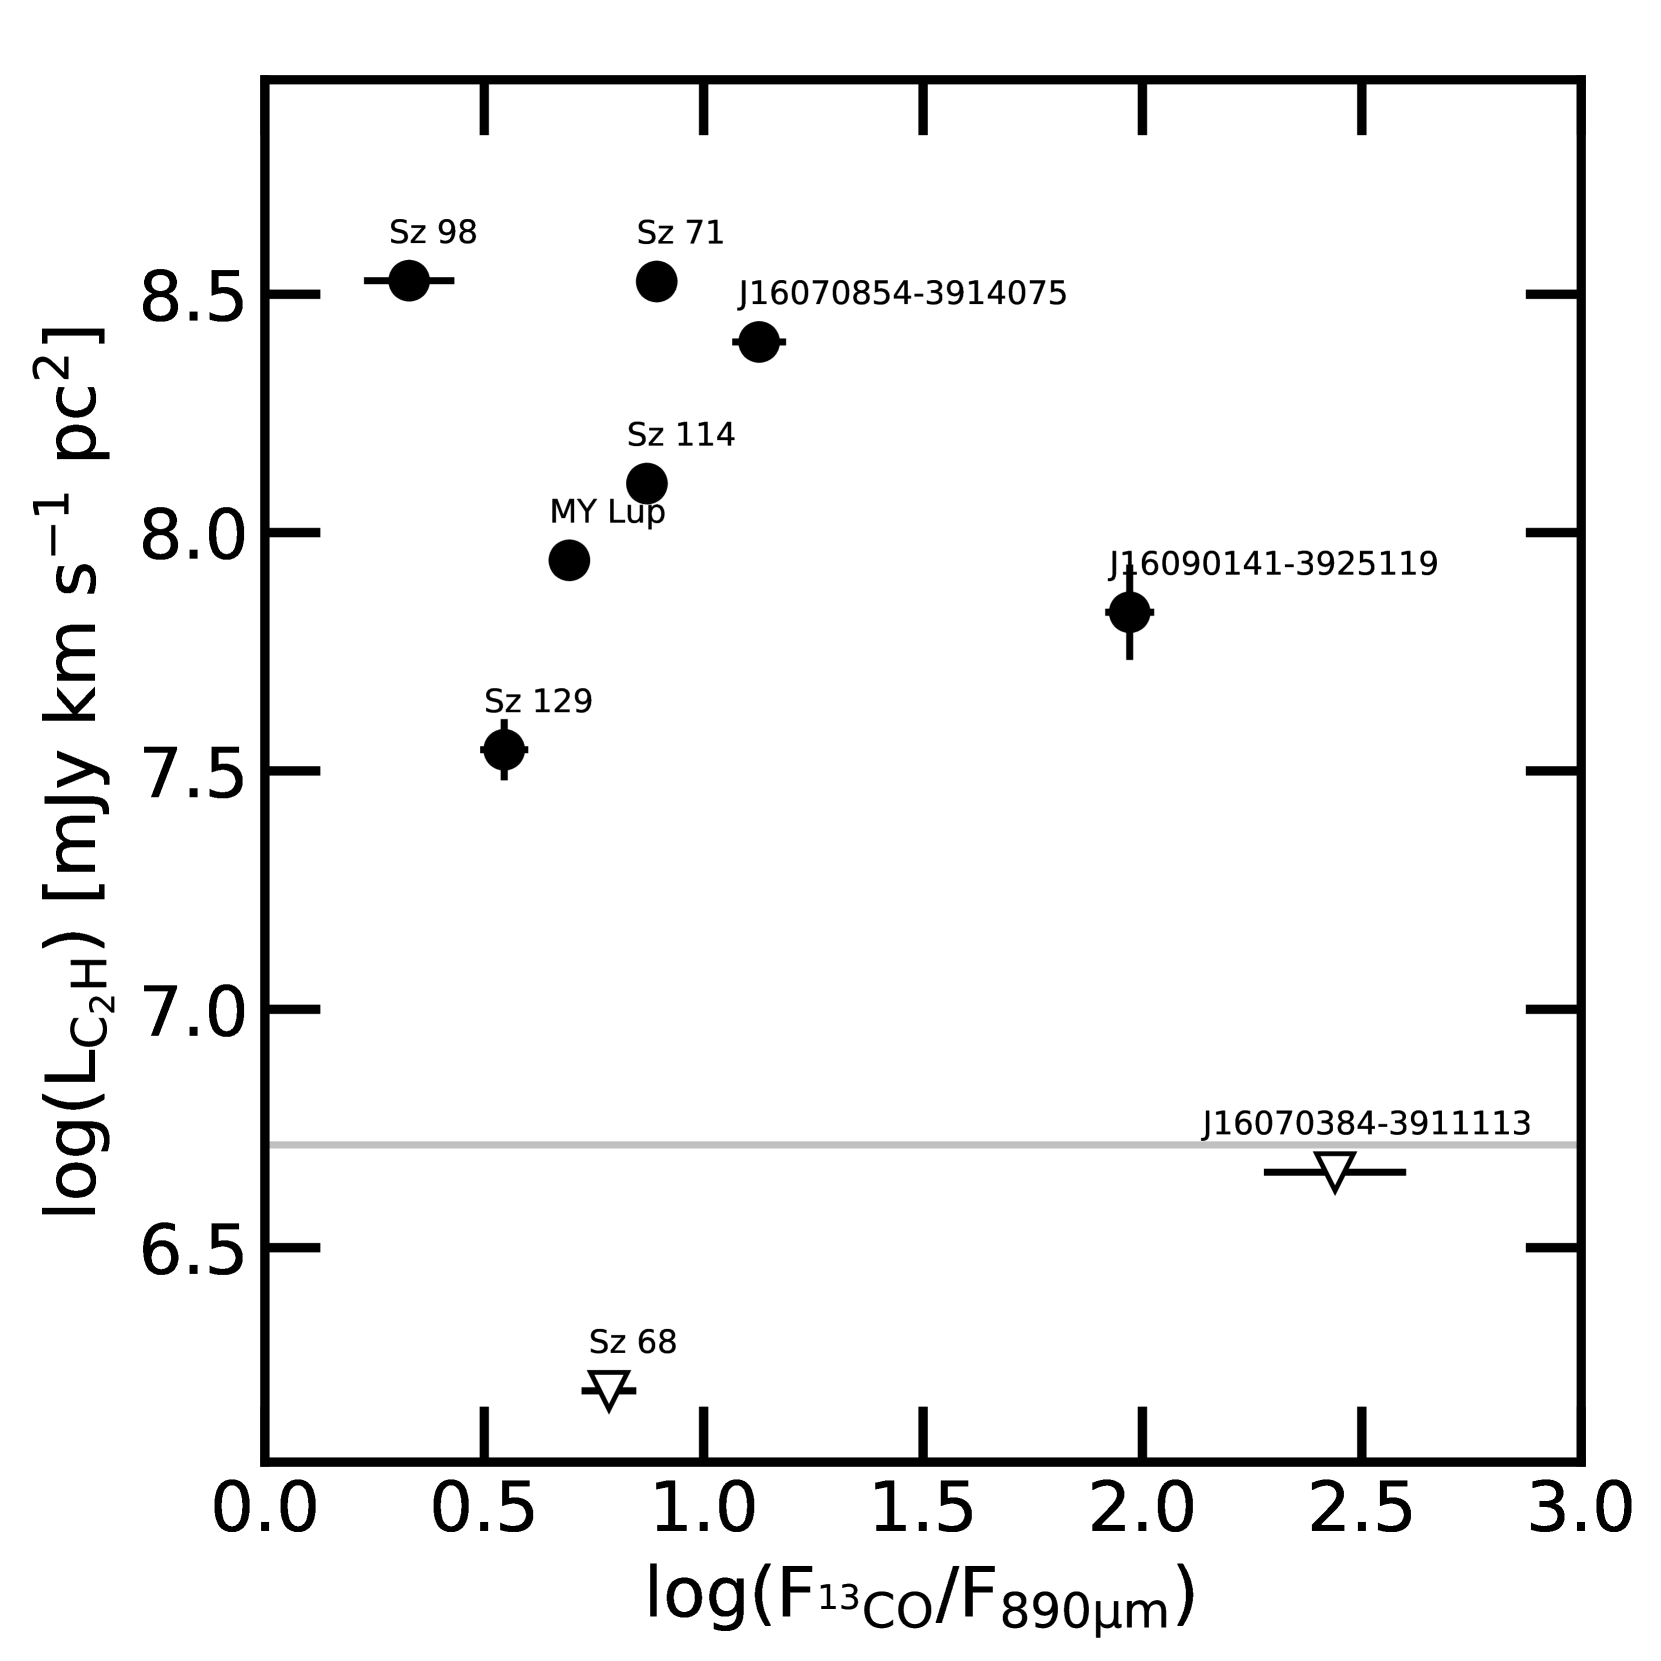
Seven out of nine disks in our sample are detected in C2H emission, which is generally bright, of the same order of 13CO emission (see Table 1). The moment 0 maps of the C2H line emission in our targets are presented in Figure 1. These maps are obtained by integrating the emission from all channels where signal was detected. The disk integrated C2H fluxes (reported in Table 1) are measured on the image plane, using an aperture synthesis method on the moment 0 maps, similar to that used by Ansdell et al. (2016). The line luminosity is obtained by multiplying the integrated flux by , where is the distance of the target in parsecs as measured by GAIA (see Table 1, Gaia Collaboration et al., 2018). The C2H integrated line luminosity is plotted in Fig. 2 against 13CO over continuum at 890 m fluxes, where the continuum total flux density is integrated over a band width of 1 km s-1 for convenience (Table 1, Ansdell et al., 2016). The 13CO-to-continuum flux ratio can be used as an observational proxy of the gas/dust mass ratio, under the assumption that CO is the main carbon carrier in the disk warm layer. The typical sensitivity calculated at 162 pc, the distance of Sz129 which is our lowest detection, is shown by the grey solid line. A bimodal distribution is observed: either C2H emission is strongly detected at more than a 5 level, or such molecule is not detected. A possible interpretation of this behaviour is discussed in Sec. 4. C2H emission is likely optically thin for the observed sources in Lupus, as later discussed.
3.2 Ring-like structures
ALMA is revolutionising the field of planet-formation by showing that disks often present substructures, almost always in the shape of cavities (e.g., van der Marel et al., 2016), rings and gaps (see Long et al., 2018; Andrews et al., 2018, and references therein). Such structures, seen in continuum emission, are possibly related to perturbations of the disk gas surface density distribution, due to the presence of forming planets, or to different suites of instabilities (e.g., Johansen et al., 2009; Bai & Stone, 2014; Flock et al., 2015). Rings have also been detected in molecular line emission, but are of a different nature (see e.g., Bergin et al., 2016; Cazzoletti et al., 2018; van Terwisga et al., 2018). The cause of such rings varies for different molecules, but is related to chemistry, rather than a physical perturbation of the disk structure. Rings seen in DCO+ and N2H+ are, for example, possibly linked to the location ice rings, such as that caused by the CO snow-surface (e.g., Mathews et al., 2013; Öberg et al., 2015; van ’t Hoff et al., 2017). In other cases, such as for CN and for C2H, there is no relation with the snow lines (Bergin et al., 2016; Cazzoletti et al., 2018; van Terwisga et al., 2018). The link between the structures seen in the continuum and in different gas tracers is being investigated with current and upcoming observations.
Ring-like structures are detected both in continuum emission at 1.2 mm and in C2H line emission also in our sample. Thanks to the much higher sensitivity than the Ansdell et al. (2016) data, our ALMA observations allowed us to detect continuum emission at 1.2 mm at high signal-to-noise ratios. The continuum maps of the nine disks presented here are shown by the white contours in Figure 1. On the image plane, only Sz 98 shows the presence of a ring in continuum emission located at 90 au, as already hinted at by the modelling on the -plane by Tazzari et al. (2017) and by van Terwisga et al. (2018) (see Fig. 1). Sz 71, Sz 114, and Sz 129 are also included in the ALMA large program ”DSHARP” (Andrews et al., 2018) and, when observed at such high angular resolution, they show ring and gap structures in the outer disks (Huang et al., 2018).
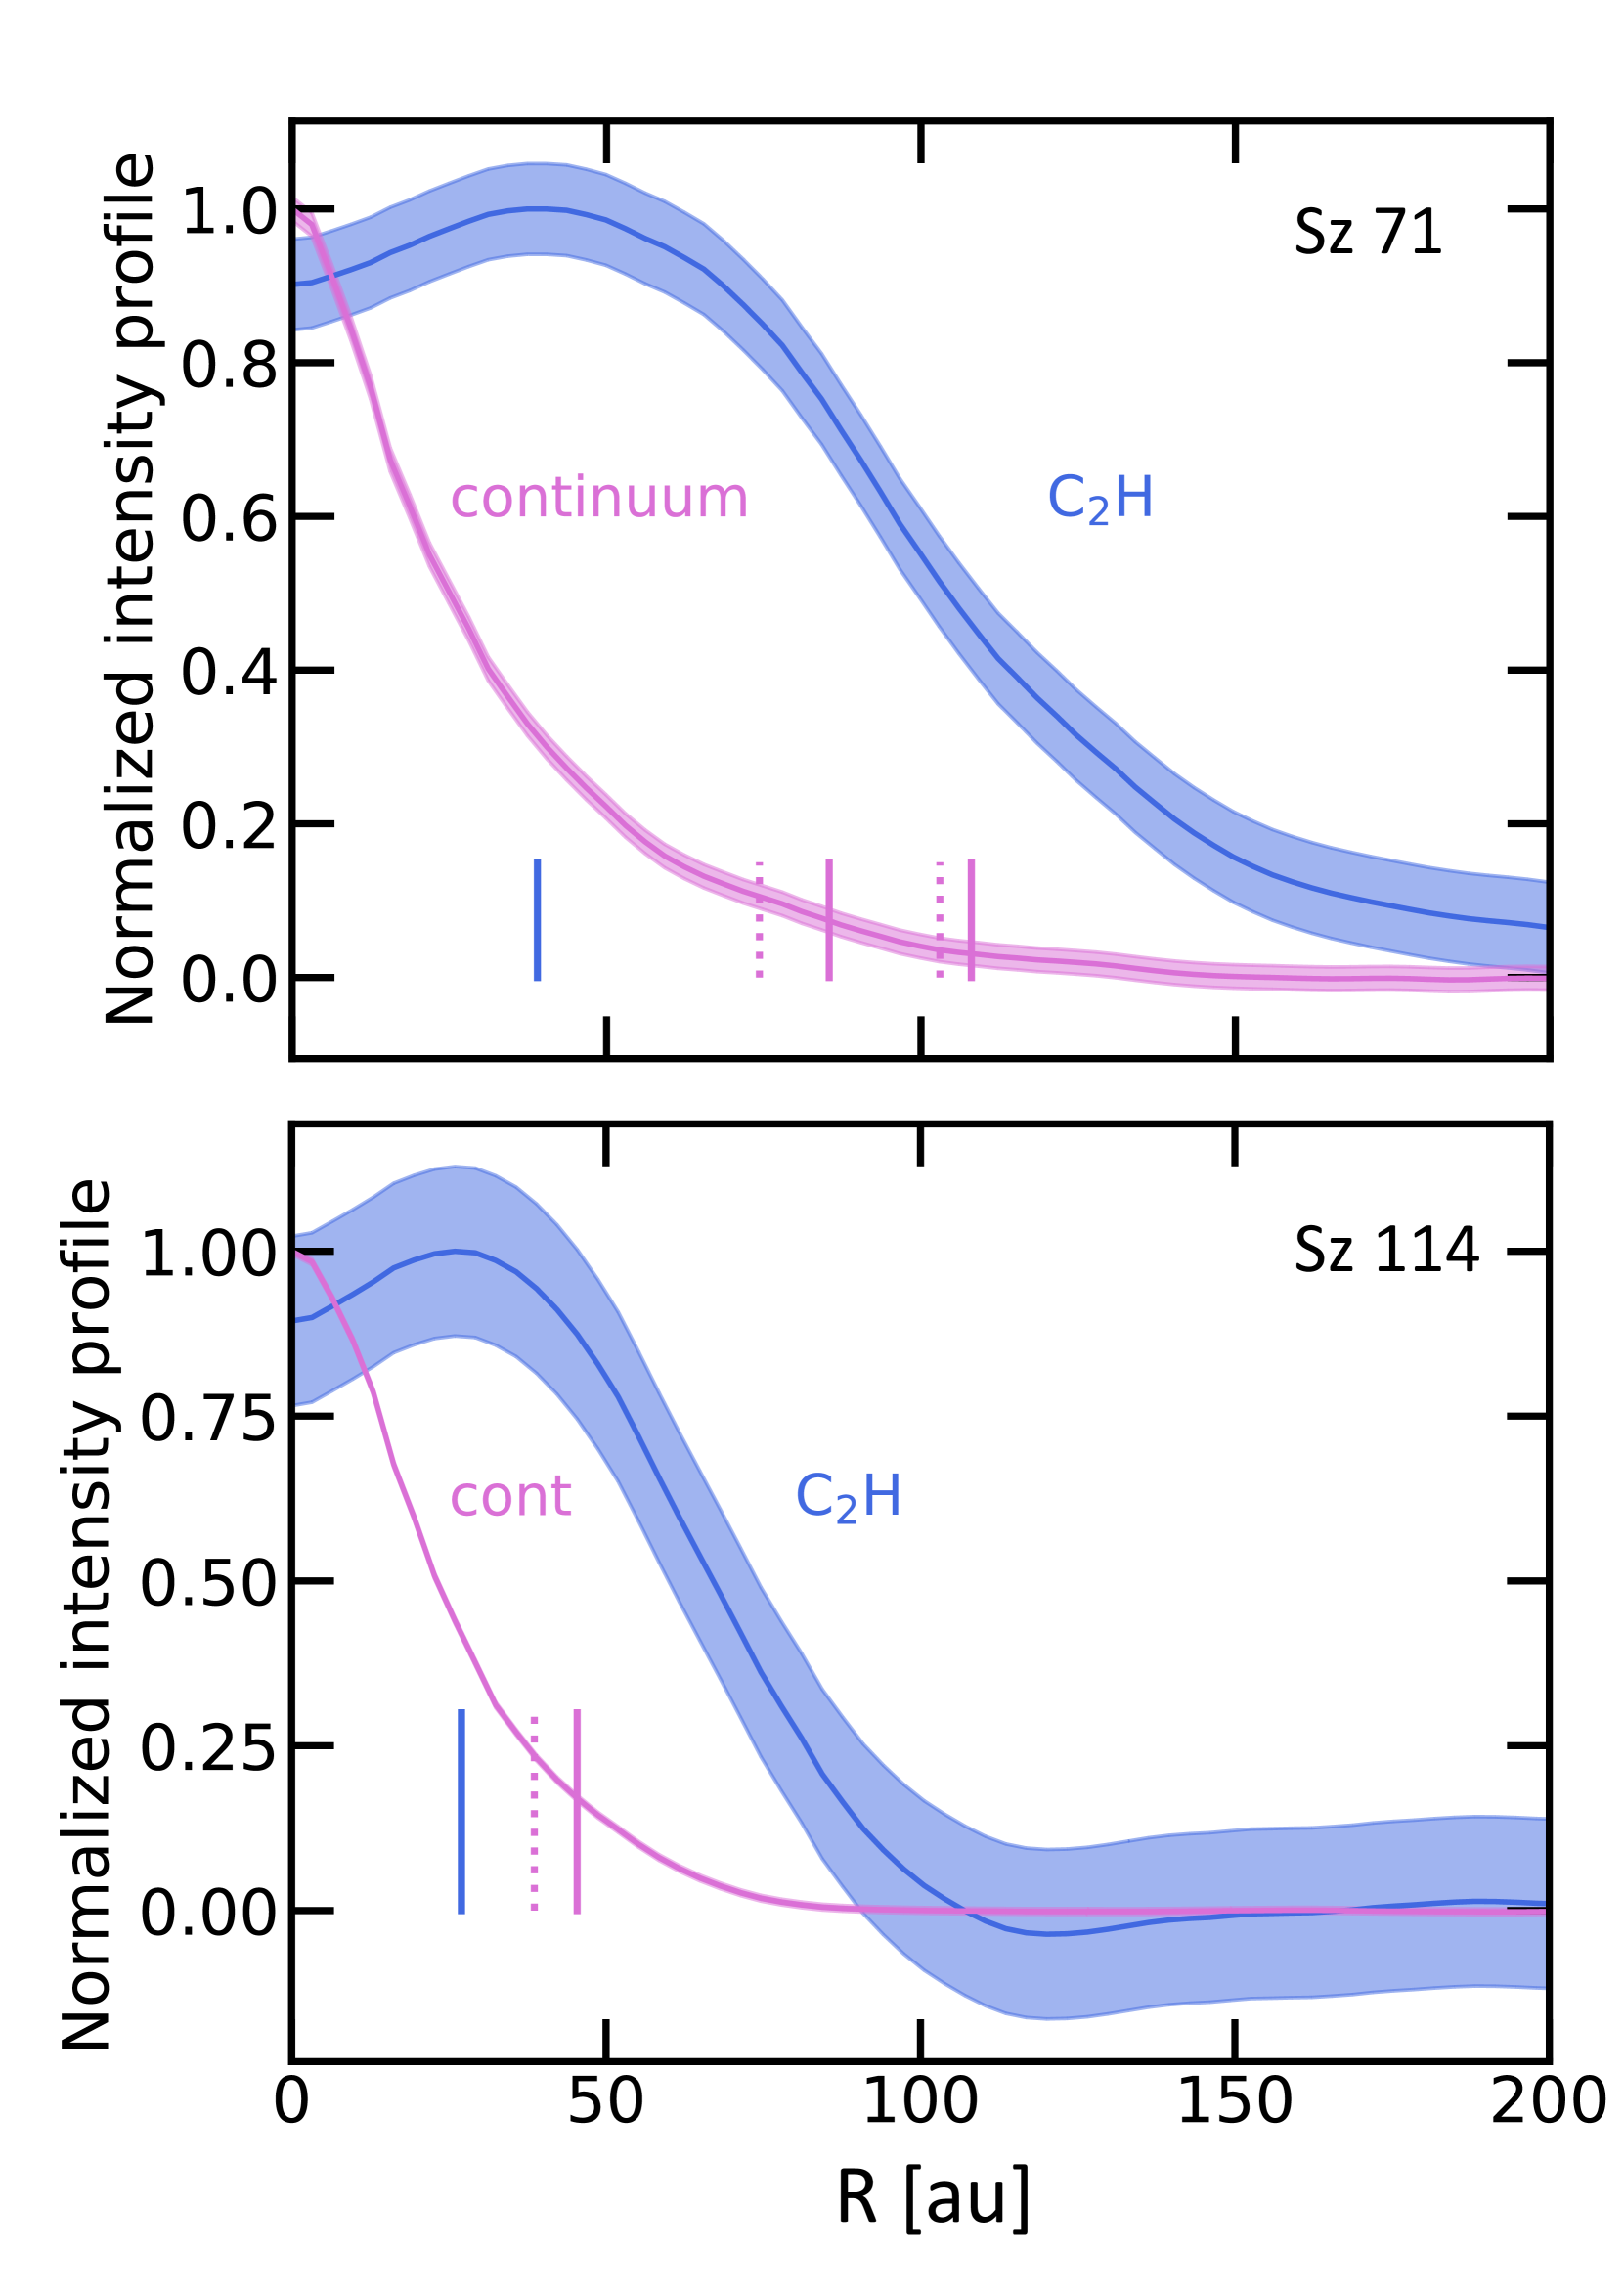
As shown in Figure 1, C2H emission is Sz 114 show clear ring-shaped emission. The C2H azimuthally averaged intensity radial profile is computed after derotating and deprojecting the images following van Terwisga et al. (2018) (see blue line in Fig. 3). The azimuthally averaged continuum emission in our observations is shown by the pink line in Fig. 3. The peak of C2H emission is located at 40 au and 27 au respectively in these two sources. This former peak coincides with the CN emission peak found by van Terwisga et al. (2018) in Sz 71. The location of the gaps and rings detected at very high angular resolution ALMA data (30 to 60 mas) by Huang et al. (2018) in these two sources is indicated by the dotted and solid pink vertical lines respectively, while the peak of the C2H emission is shown by the blue vertical line. The C2H emission ring location does not seem to be connected with either the gaps or the rings seen in continuum emission in Sz 71. The angular resolution of our C2H observations is 30 au, and this allows us to rule out that the C2H ring location coincides with any of the rings and gaps discovered in the continuum by Huang et al. (2018). This hints to a chemical origin for the hydrocarbon rings, similar to what found for CN at same location (Cazzoletti et al., 2018; van Terwisga et al., 2018). For Sz 114 the interpretation is less clear, as the distance between the C2H ring and the continuum substructures is smaller than our angular resolution. Proper chemical modelling to interpret the nature of the observed molecular rings is beyond the scope of this paper.
4 Discussion
Following Bergin et al. (2016) and Kama et al. (2016), if depletion of volatile carbon and oxygen happens in such a way that [C]/[O]¿1 in the gas, disks with lower carbon abundance and fainter CO isotopologue lines would show brighter hydrocarbon lines. If [C]/[O]¿1, not all volatile carbon is locked in CO but some is available to start the hydrocarbon chemistry. Furthermore, if the process of volatile depletion happens by incorporating carbon and oxygen in larger grains which settle to the midplane and drift inwards, the disk regions where this happens would be more exposed to UV radiation. High carbon-to-oxygen ratios combined with strong UV irradiation are the right conditions to boost hydrocarbon emission (Bergin et al., 2016). So, if the faint CO lines found in Lupus disks are due to high levels of volatile depletion rather than to low g/d ratios, this should be reflected in strong hydrocarbon emission. It may be expected that sources with volatile C and O depletion and thus faint CO lines will show bright C2H lines and vice versa.
4.1 CO-based g/d ratios
The 13CO and C18O integrated fluxes and continuum flux densities from Ansdell et al. (2016) can be used to estimate CO-based gas and dust masses. Miotello et al. (2017) have employed the grid of physical-chemical models run with the code DALI (Bruderer et al., 2012) presented previously in Miotello et al. (2016), which include isotope-selective processes and freeze-out, to estimate CO-based gas masses for the disks in Lupus. Such models cover a realistic range of disk and stellar parameters, sample disk masses from to , and produce simulated spatially integrated continuum and line fluxes. For each mass bin, Miotello et al. (2017) computed a median integrated 13CO line luminosity and they compared such values with observations (Ansdell et al., 2016), to determine the disk gas mass which is an input parameter in the DALI models. The uncertainty on the mass estimate was given by the dispersion from models with different disk parameters. The overall CO-based gas-masses are very low, often lower than one . As a consequence, the typical g/d mass ratios found in Lupus are much lower than the factor of 100 measured in the ISM (Miotello et al., 2017). Such low CO-based g/d ratio may in fact be an indication of volatile carbon and oxygen depletion, rather than fast gas dispersal in Lupus disks.
4.2 Dependence of C2H vs CO-based g/d mass ratio.
It is a priori not clear how tight any anti-correlation between C2H and CO-based g/d ratio should be, and even if this should be linear. This is in fact probably not the case, as there are competing effects at play that may differ from source to source. If carbon is depleted by a factor of 100, one could naively explain why CO emission is found to be a factor of 100 fainter than expected, but not C2H emission, which should be fainter by a factor of 104. C2H is instead found to be bright in the studied disks and this may be due to volatile [C]/[O]¿1 which boosts the C2H emission irrespective of the low C abundance. How much carbon depletion and [C]/[O]¿1 balance each other and which one prevails depends on source details and amount of depletion, but a tight relation is not expected. Any non-correlation or anti-correlation goes already in the direction of [C]/[O]¿1 hypothesis.
A simple interpretation of the bimodal distribution seen in Fig. 2 could be that the volatile [C]/[O] ratio would play as an on/off switch of the C2H emission. C2H lines are bright only if [C]/[O]¿1 and the hydrocarbon chemistry path is allowed, otherwise C2H lines would be much fainter, i.e., undetected in our specific case. This would be in line with chemical models, showing that the C2H column densities are boosted as soon as the [C]/[O] becomes larger than unity (see e.g., Cleeves et al., 2018, and Sec. 4.5). Such a scenario would explain the sharp transition between detections and non-detections seen in Fig. 2. All detections in our sample are much brighter than the typical sensitivity of our observations, shown by the grey line in Fig. 2. Our interpretation is however limited by the small-number statistics: our sample may simply lack intermediate cases. Enlarging the sample of deep C2H observations in Lupus would allow us to better describe the relation between C2H and CO-based g/d ratio and to learn more about the volatile depletion scenario.
4.3 C2H emission in other sources
Recently, Bergner et al. (2019) have published C2H observations of a set of 14 disks spanning a range of ages, stellar luminosities, and stellar masses, including the previously observed disks by Dutrey et al. (1997), Henning et al. (2010), Guilloteau et al. (2016), Bergin et al. (2016), Cleeves et al. (2018), and Kastner et al. (2018). This sample is complementary to our set of observations, as we target fainter and less radially extended disks, shown to be more representative of the disk bulk population (see e.g., Ansdell et al., 2016, 2018; Pascucci et al., 2016; Long et al., 2018), with similar stellar parameters, and age (Lupus is 1-3 Myr old, Comerón, 2008).
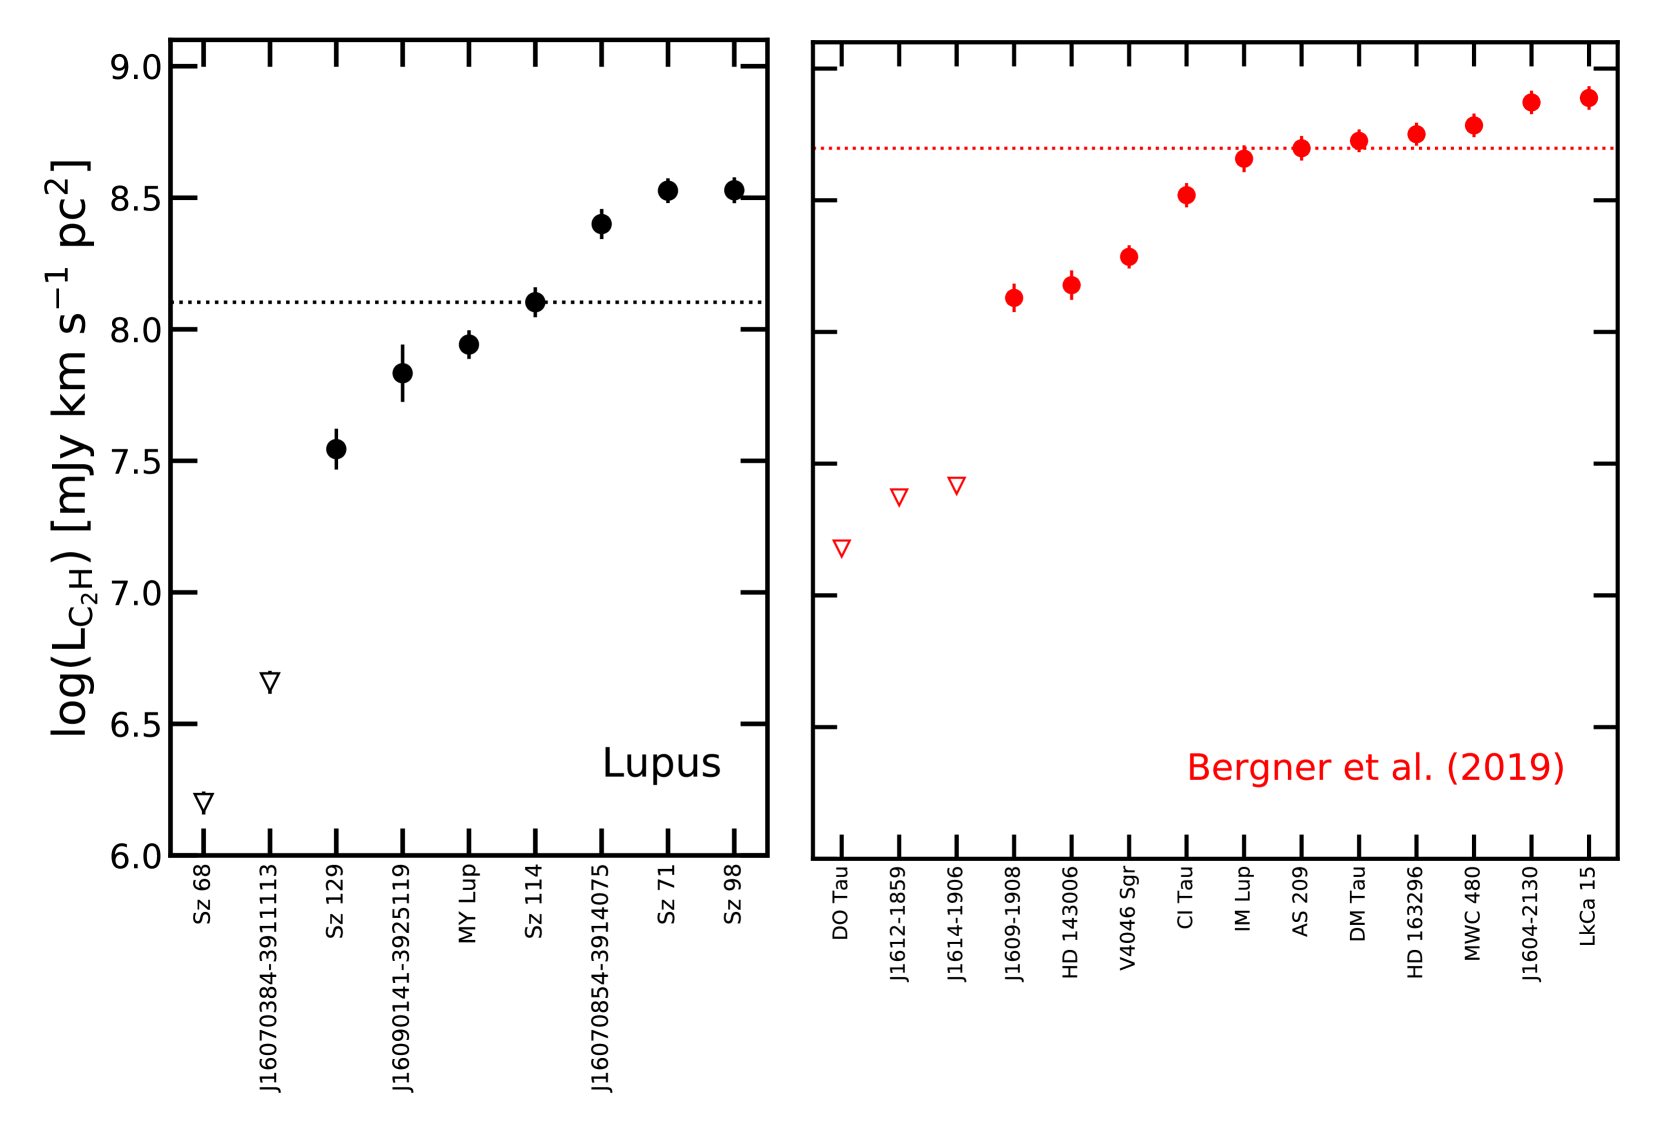
The Lupus disks are shown by the black symbols in Fig. 4, while the additional sources are reported in red. The C2H non-detections are shown by the empty triangles as 3- upper limits. The observations presented by Bergner et al. (2019) have have less sensitivity than ours, with 3 limits typically a factor 10 higher, and they do not allow us to rule out the hypothesis of a step-like behaviour of the C2H emission by populating the plot with intermediate cases, i.e., with the logarithm of C2H integrated line luminosities between 6.8 and 7.5. The disks in the Bergner et al. (2019) sample that might populate this range of C2H luminosity are all upper limits. On the other hand, our step-like behaviour hypothesis is strengthened by their detections, that are all as bright or brighter than our Lupus observations.
The two samples are however complementary. In Fig. 4 the dotted lines show the median integrated C2H line luminosity of the Lupus disks, in black, and of the additional sources, in red, which is 0.5 dex higher. The disks presented by Bergner et al. (2019) host in many cases more luminous stars (e.g., HD163296, MWC 480), show brighter millimetre continuum fluxes, and they are also much larger in their radial extent (see Tab. 5, and 6 of Bergner et al., 2019). The UV field impinging onto the disk, which is intrinsically connected with the stellar properties, and the disk outer radius are two parameters that most likely affect the C2H emission, similarly to what found for CN by (Cazzoletti et al., 2018) and (van Terwisga et al., 2018).
The question we would like to answer with this paper, however, regards the nature of the faint CO isotopologue emission of the Lupus disks (Ansdell et al., 2016; Miotello et al., 2017). As found also in Chamaeleon, the bulk of the disk population seems to be composed of faint and compact disks (Pascucci et al., 2016; Long et al., 2017). The open question is whether such disks have low gas masses or low volatile carbon and oxygen abundance, as both scenarios would lead to faint CO fluxes. Disks surrounding brighter stars and with larger radial extent, such as those presented e.g. by Bergner et al. (2019), do not show fainter than expected CO emission (see e.g. HD 163296, Kama et al., 2016). A proper description of the C2H emission dependence on higher UV fields and larger disk radii is beyond the scope of this paper, despite it being an interesting and important topic to be explored with models, similarly to what was done for CN by Cazzoletti et al. (2018). For these reasons, we focus here on the Lupus disk observations and we compare them with an explorative grid of models, tapered on such targets (see Sec. 4.5).
4.4 C2H and CN line luminosity in Lupus
Figure 5 shows integrated C2H line luminosity for the nine Lupus sources as a function of integrated CN line luminosity. The C2H non detections are also reported and shown as upper limits at the 3- level by the empty triangles. We compute the linear regression coefficients using the fully Bayesian method by Kelly (2007), which allows the inclusion of uncertainties on both axes, upper limits and intrinsic dispersion in the fitting procedure.
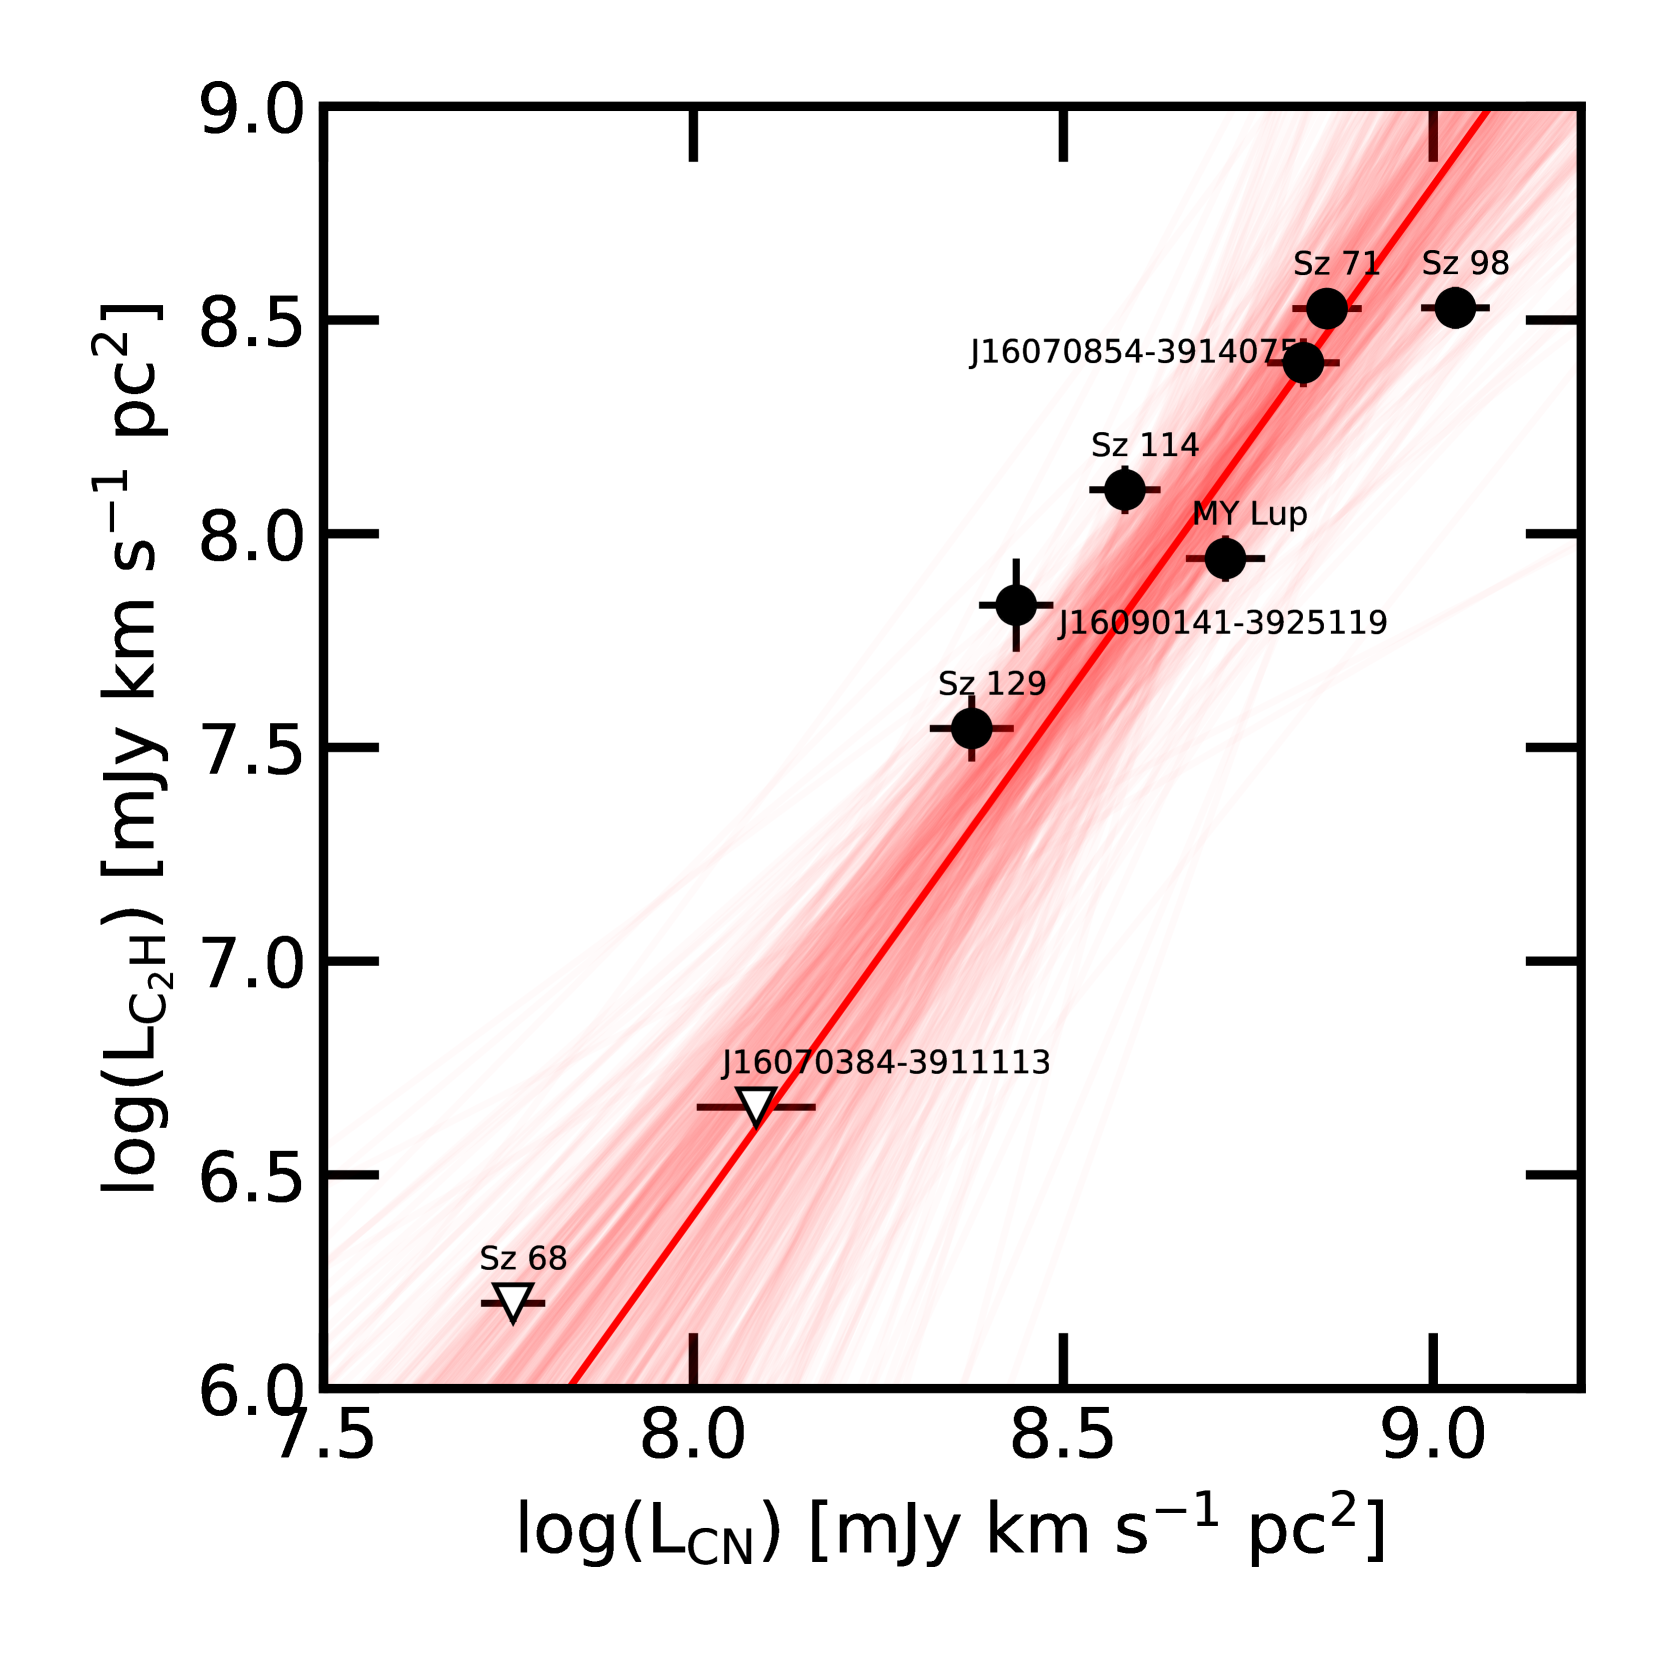
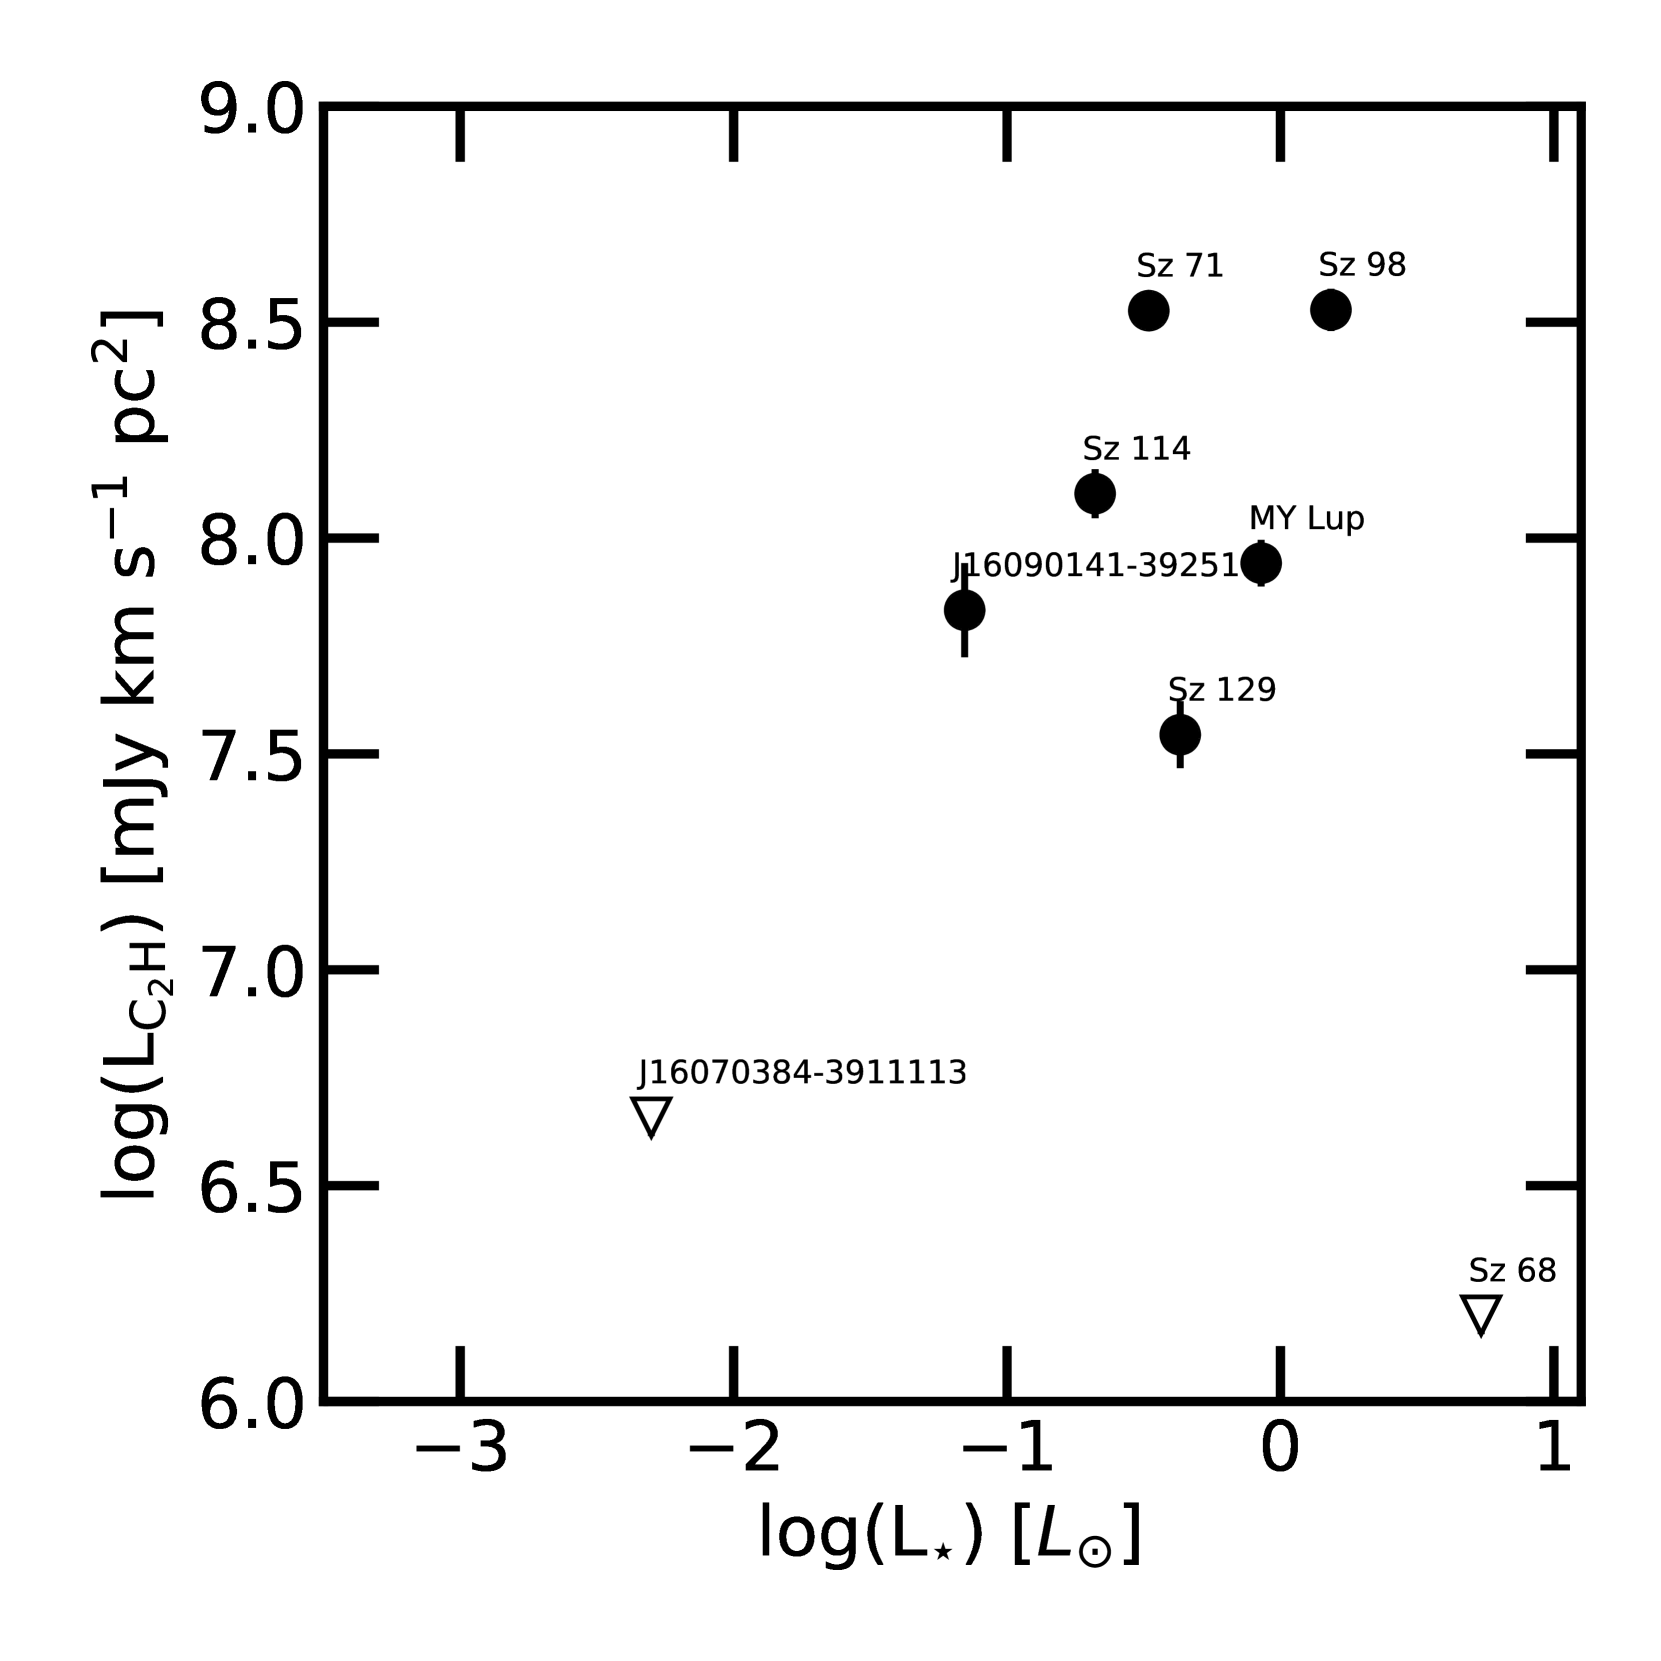
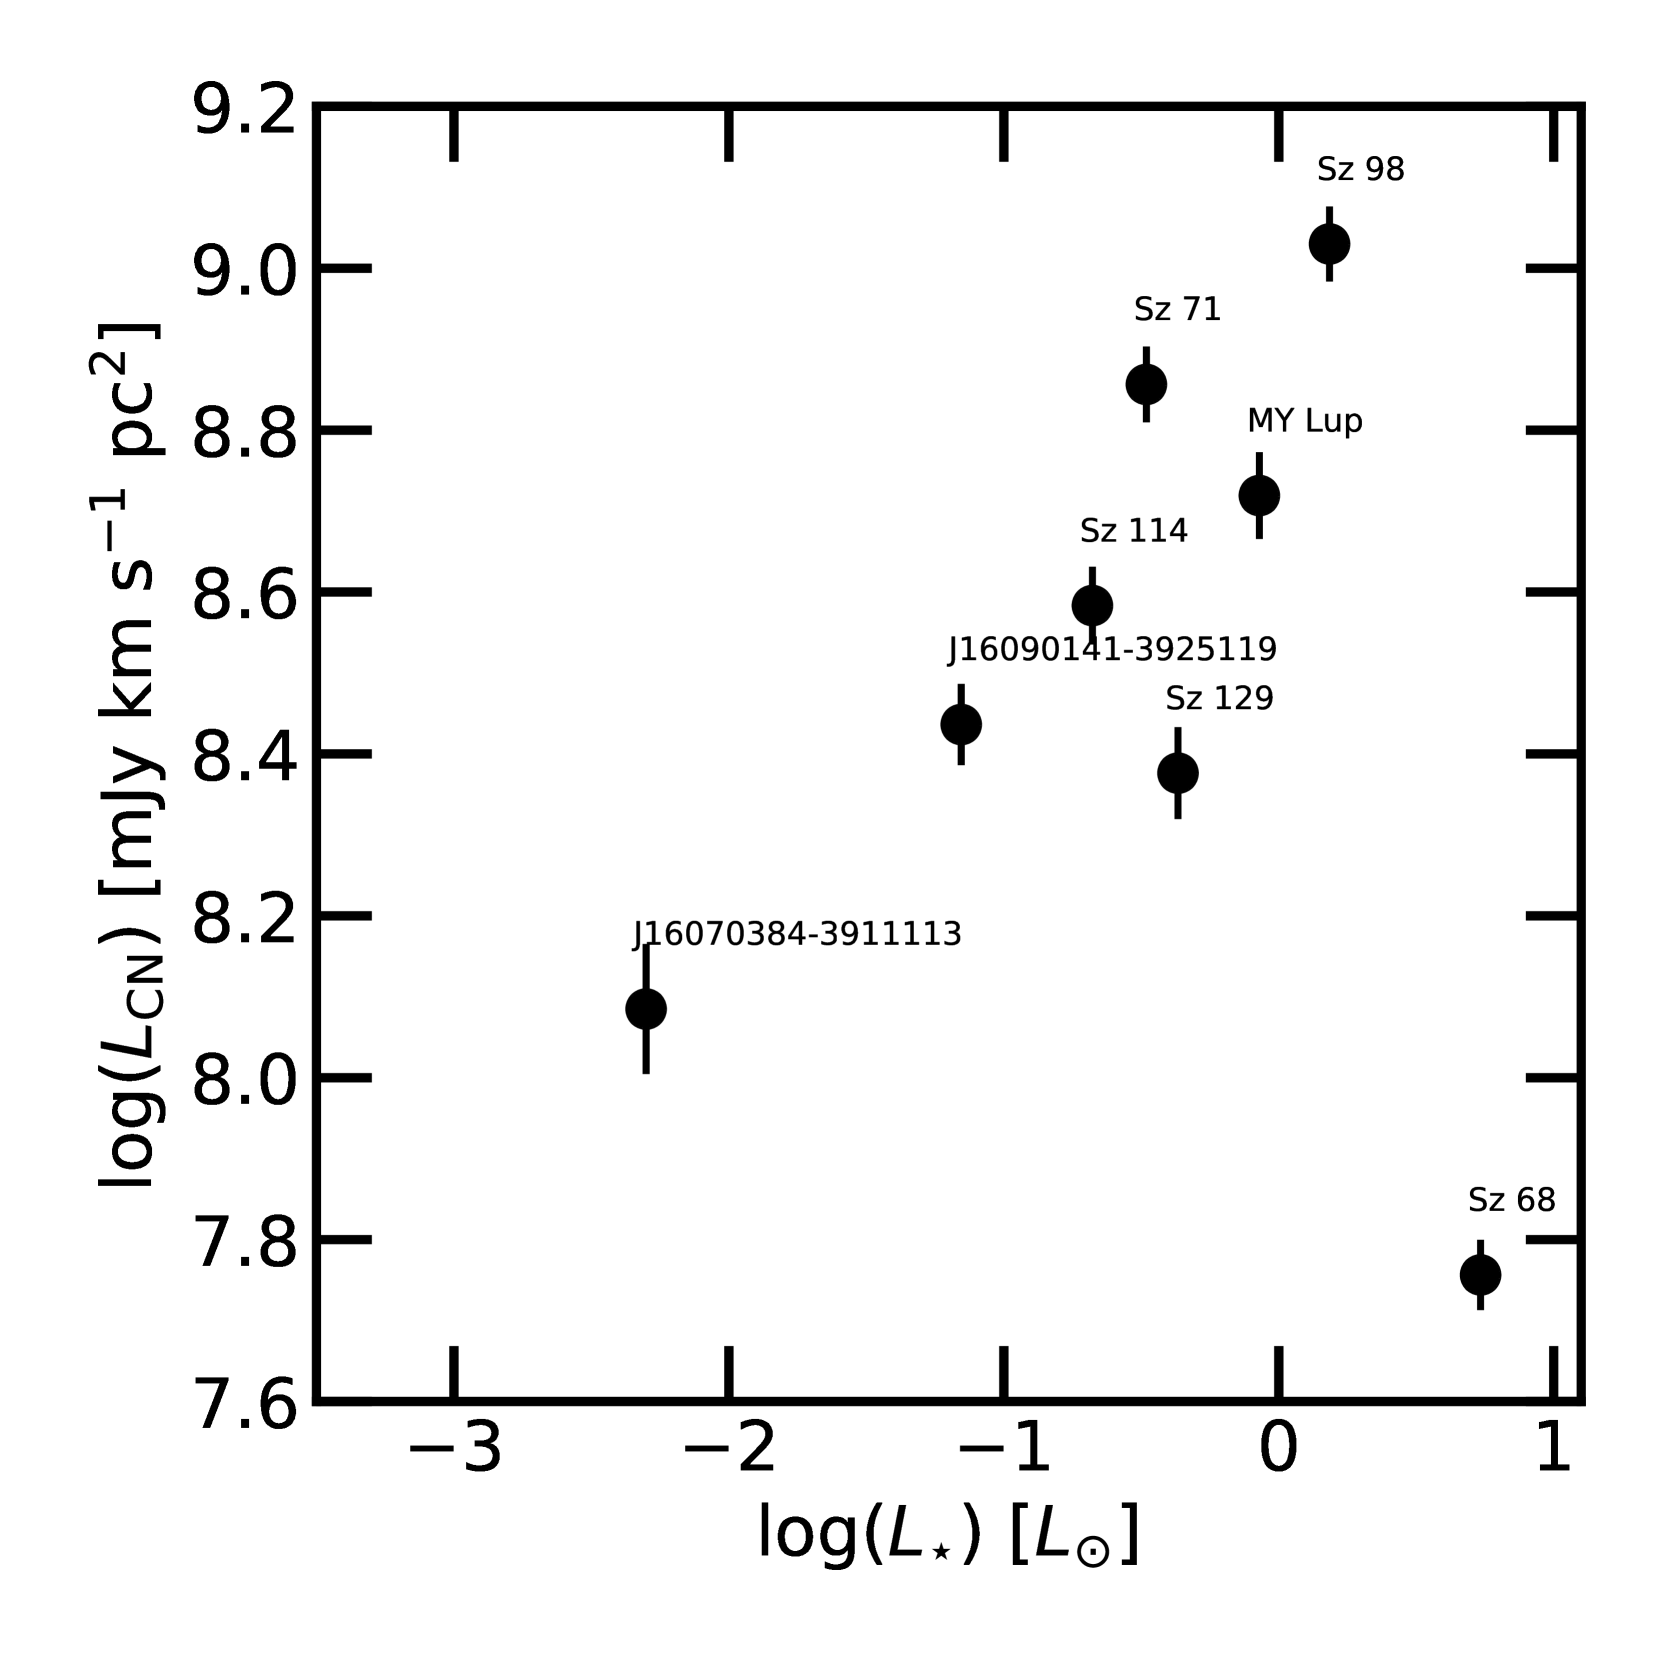
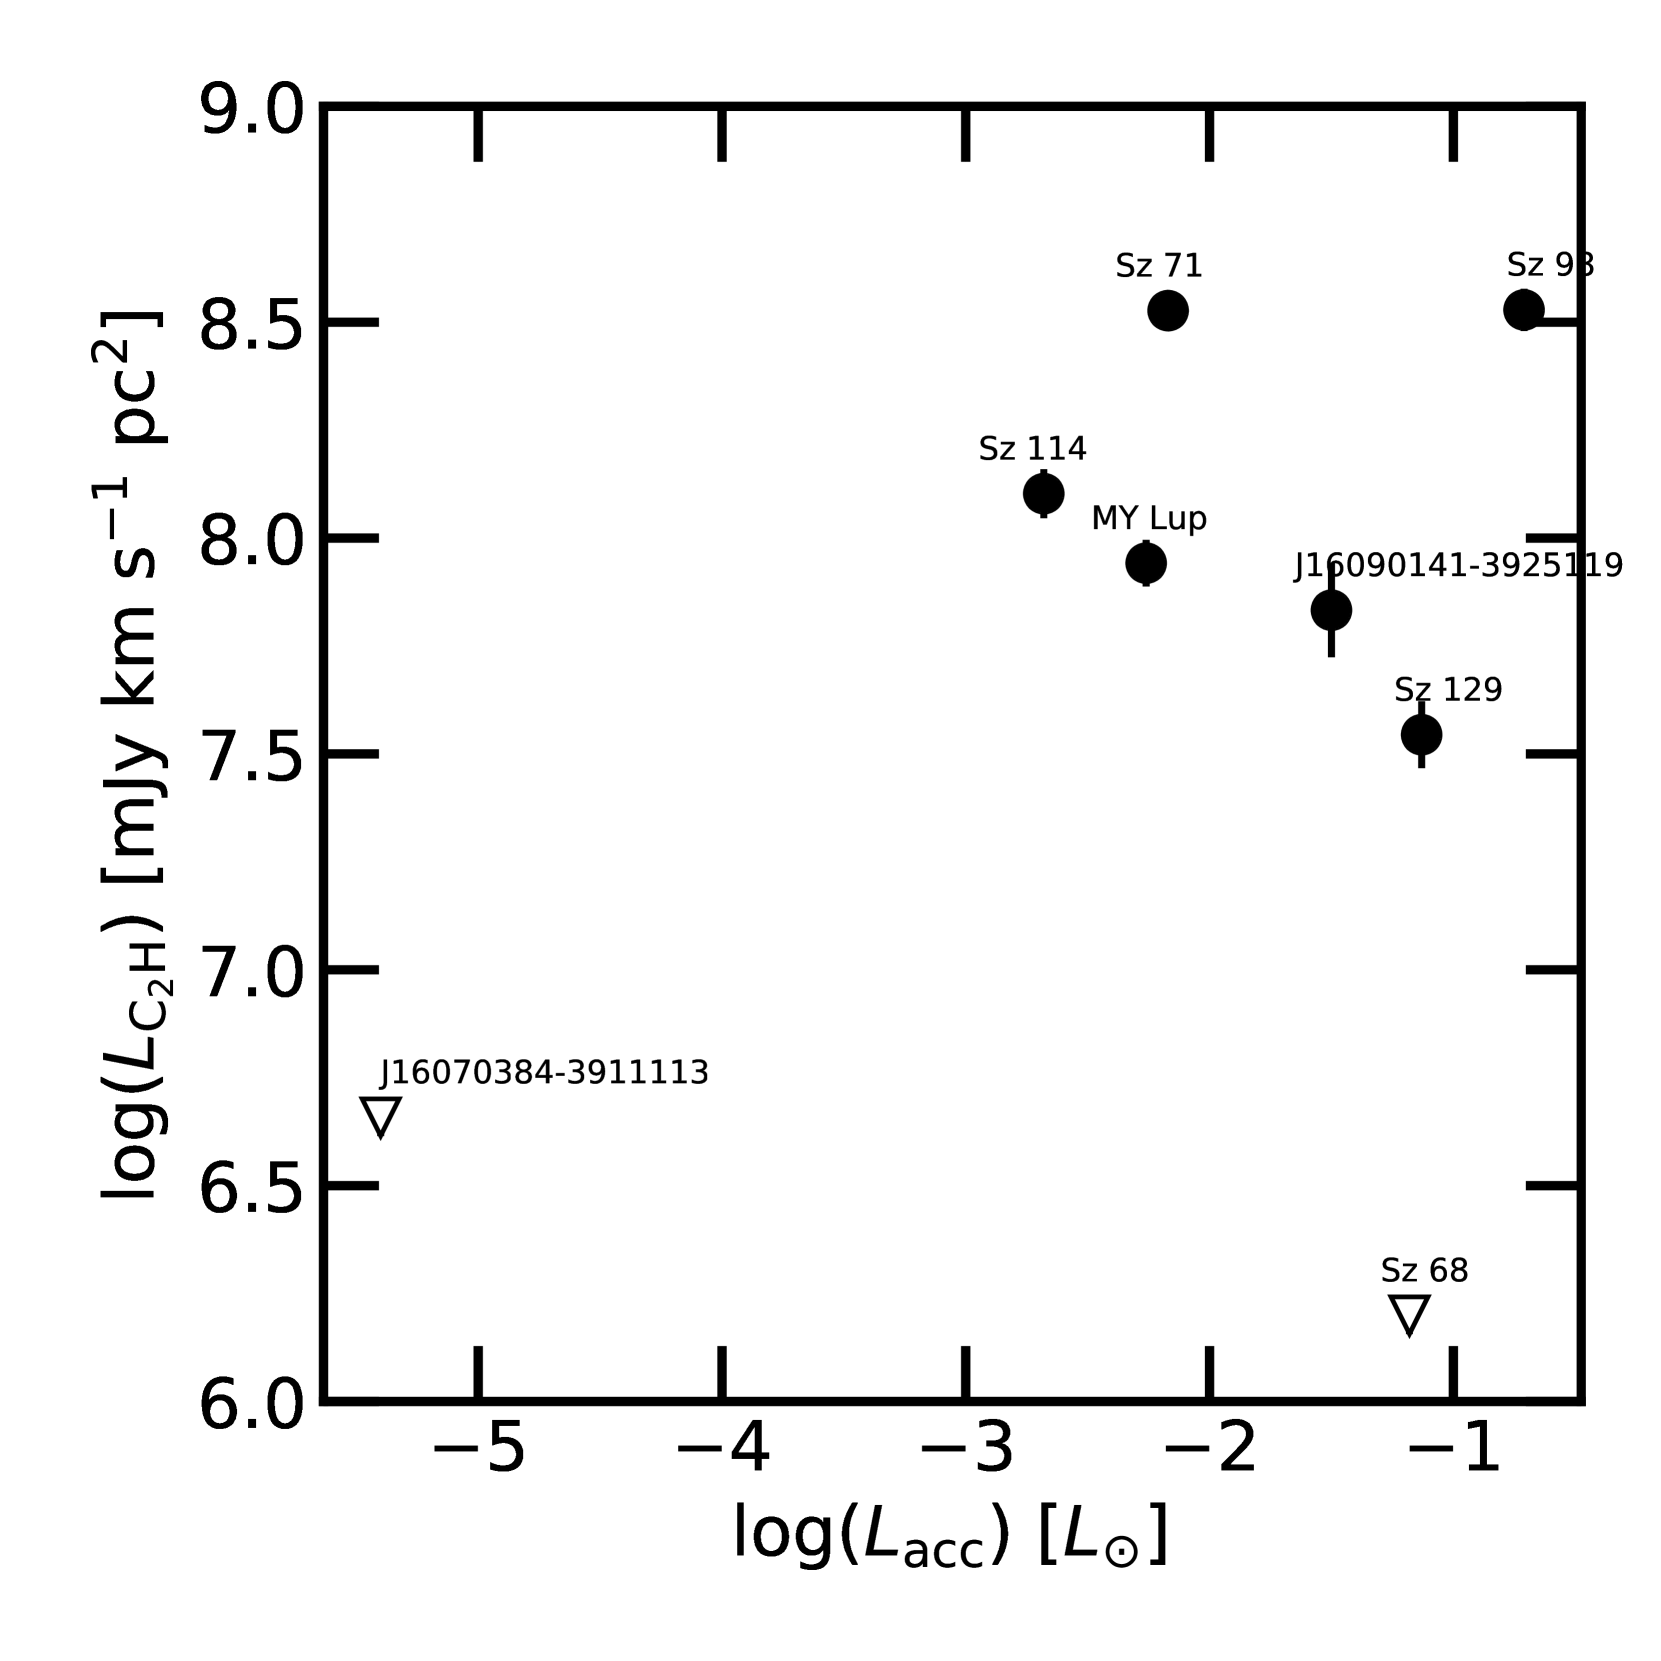
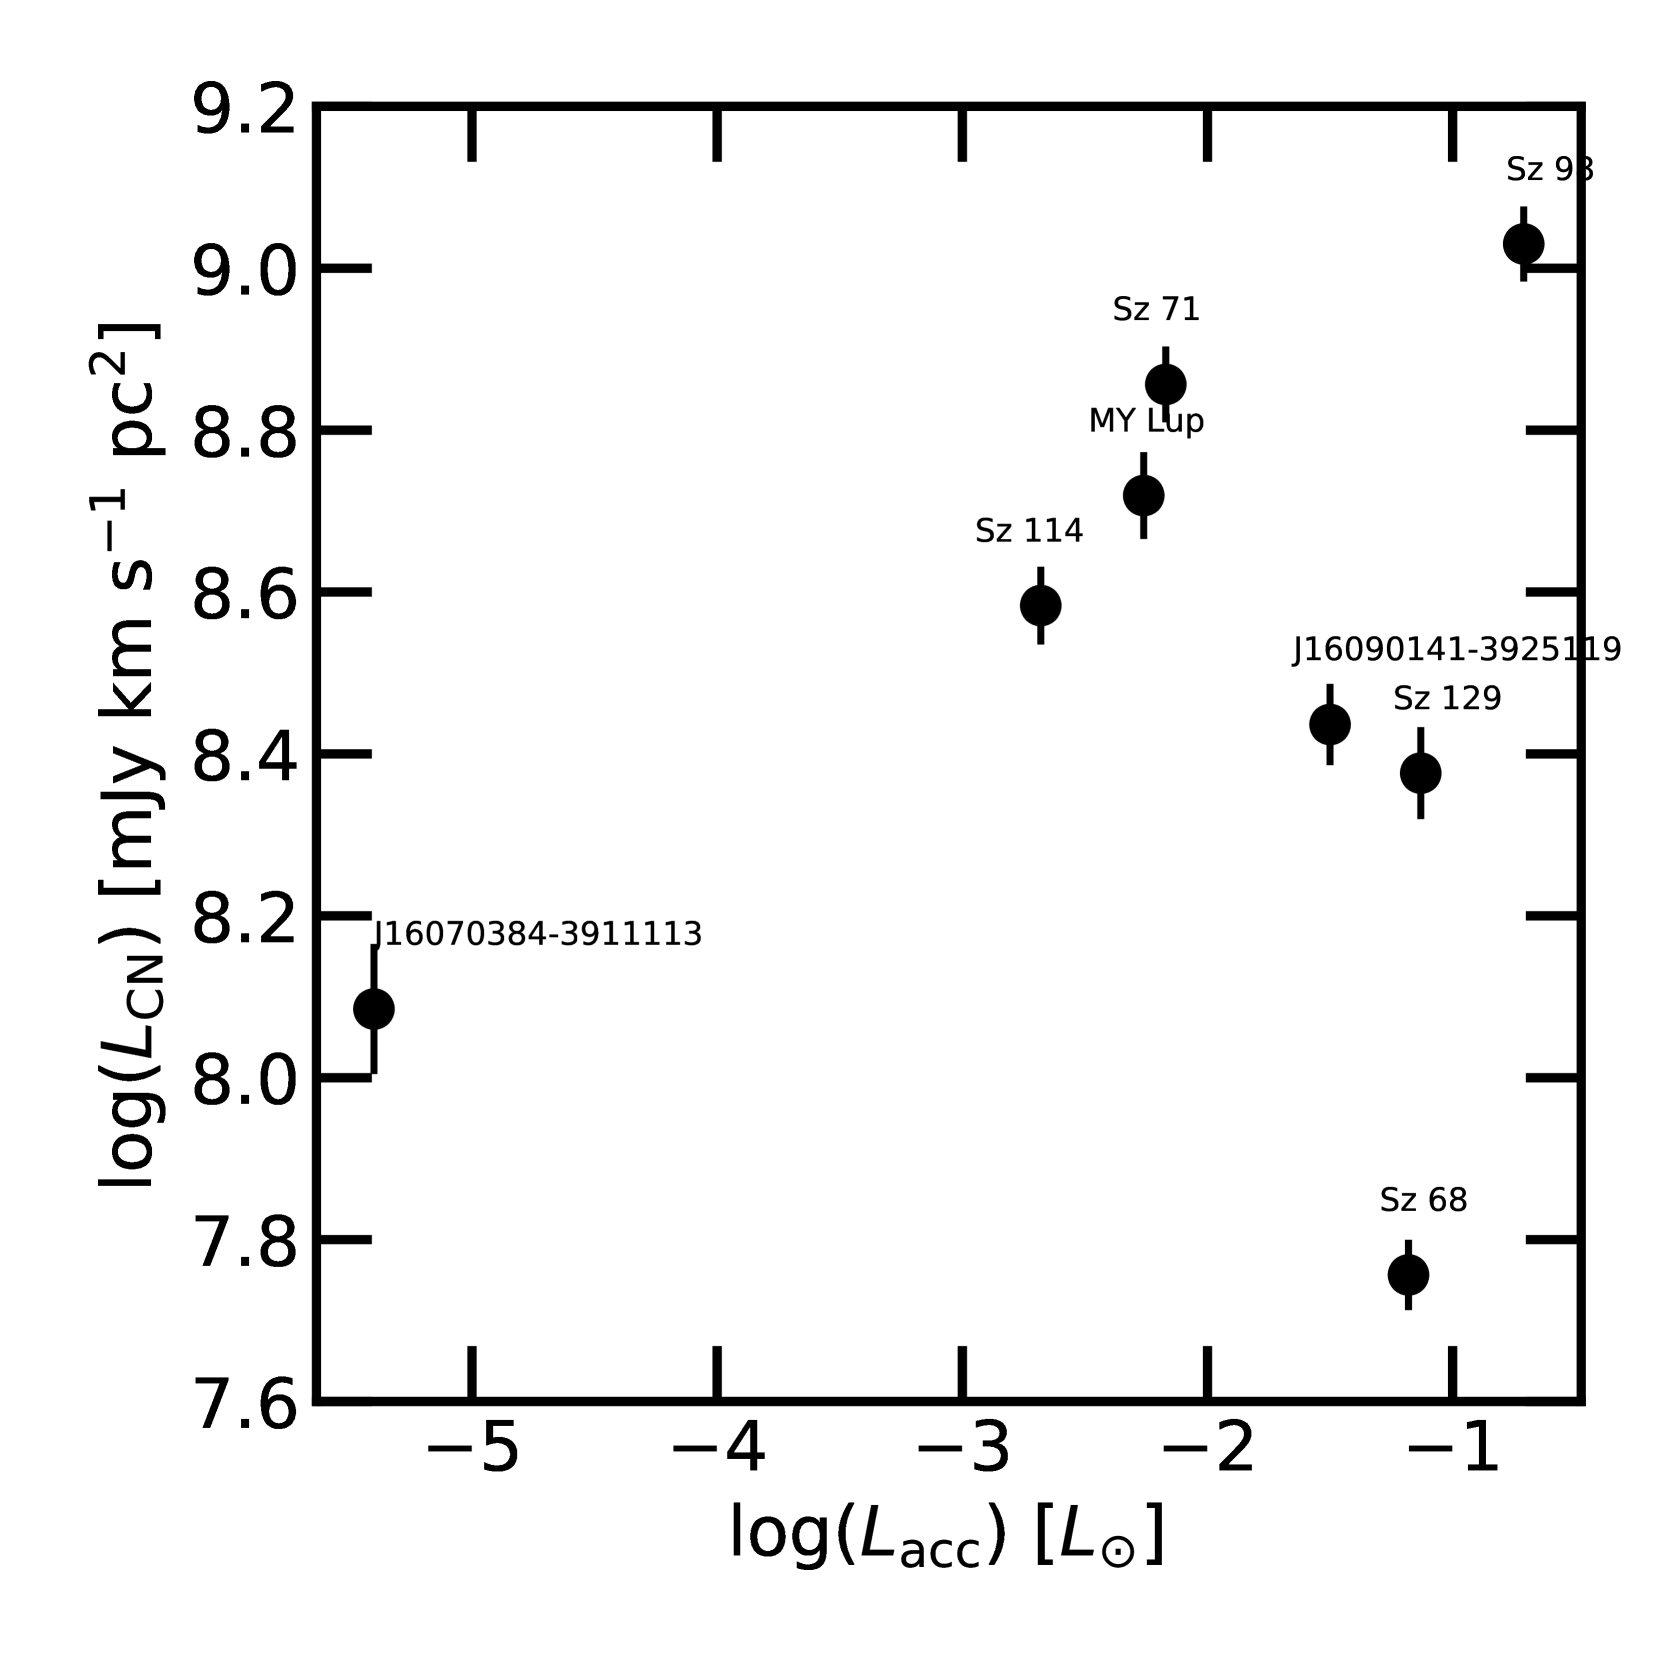
A correlation between the logarithm of C2H and CN line luminosity is found for the Lupus disks. The best representative set of parameters, which we adopt as the median of the results of the chains, is shown in Fig. 5 by the red solid line while the light red lines show a subsample of results from some chains. The intercept and the slope of the linear regression are and . The best representative model has a correlation coefficient of . As already mentioned, this may be an additional indication that C2H and CN have a similar or common driver in protoplanetary disks, as found by Bergner et al. (2019) for C2H and HCN. The linear correlation found on the log-log space is however steeper than two, hinting to the fact that C2H emission must depend stronger than CN emission on some parameter. C2H and CN emission luminosities, however, do not show different trends with stellar or accretion luminosity (see Figures 8, 9, 10, 11 in Appendix A) ruling out a different dependence on the UV field.
Kastner et al. (2014) and Guilloteau et al. (2016) have shown that C2H and CN abundances may be enhanced in more evolved disks. Following this suggestion, Sz 68 and J16070384-3911113, the two Lupus sources where C2H was not detected, may be the youngest disks in our sample. However, there is no indication from their classification that they are less evolved than the other 7 sources. This may simply be a sign that Sz 68 and J16070384-3911113 are chemically less evolved. On the other hand, the survey by Bergner et al. (2019) was explicitly designed to check for evolutionary trends, as it contains disks with ages from roughly 1 to 13 Myr. The authors find that there is no clear relation between older disks and brighter C2H lines. The caveat to their analysis is that fluxes may not be tracing molecular abundances reliably, due to optical depth effects. This problem should however not apply to our Lupus observations, as the observed fluxes are lower than those found by Bergner et al. (2019).
4.5 Comparison with models
In order to better quantify the effect of carbon and oxygen depletion on the hydrocarbon line emission, a grid of physical-chemical disk models run with the code DALI (Dust and LInes; Bruderer et al., 2012) was employed. This is a similar set of models as presented by Cazzoletti et al. (2018) for CN and they are designed to cover the typical disk parameter space, in terms of disk mass, vertical structure, and radial extent, with an updated chemistry described by Visser et al. (2018). More specifically, we chose T Tauri like disk models, where the central star emission is described by a black body at K plus an UV excess which mimics a typical mass accretion rate, and . The large-over-small grains mass fraction is and large grains are settled toward the midplane with a settling paramer (see Cazzoletti et al. (2018) for more details). Such models assume typical ISM-like gas-phase elemental abundances, more precisely [C]/[H]= and [O]/[H]= ([C]/[O]0.3). A detailed source-by-source modelling is beyond the scope of this paper. We employ the aforementioned grid of models to obtain physically and chemically motivated predictions that we can compare with the observed C2H integrated line luminosities.
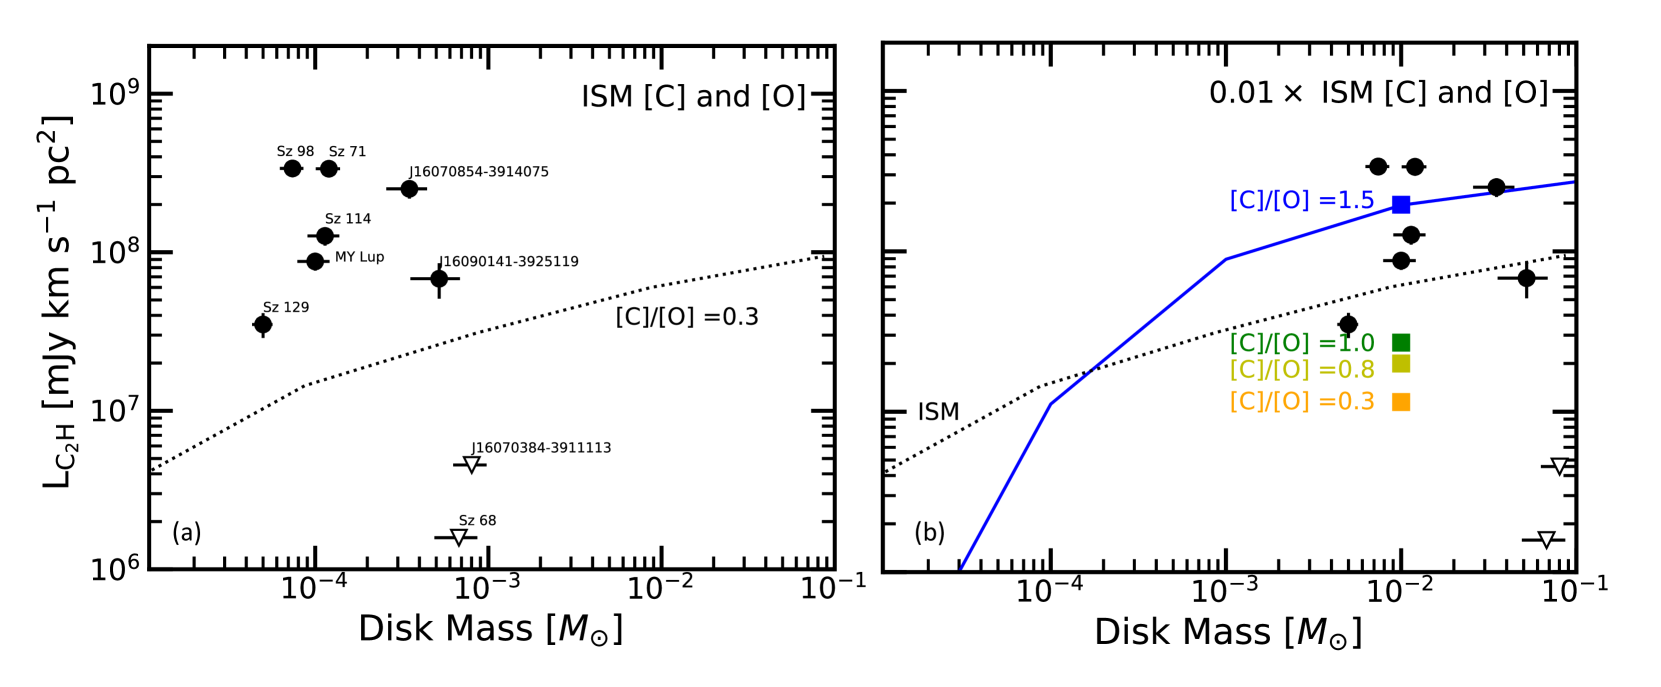
The simulated C2H integrated line luminosities are presented in Figure 6 as functions of gas disk mass and compared with the Lupus observations. In panel (a) the model results obtained with ISM-like gas-phase elemental abundances are shown by the dotted black line, while the observed C2H integrated line luminosities are shown by the black symbols vs the CO-based gas masses. Our model results underestimate the detected C2H integrated line luminosities shown by the black circles by one to two orders of magnitude.
A subsample of models has been run reducing the carbon abundance by two orders of magnitude and the oxygen abundance by slightly larger factors, in order to reach volatile [C]/[O]=0.3, 0.8, 1.0 and 1.5. The model results, presented in panel (b) of Fig. 6, are shown by the coloured squares (in orange, light green, dark green, and blue for [C]/[O]=0.3, 0.8, 1.0 and 1.5 respectively for ). A set of models with [C]/[O]=1.5 have been run for the whole mass range () and the simulated C2H integrated line luminosities are shown by the blue solid line. If the global volatile carbon and oxygen abundances are decreased by two orders of magnitude, but the [C]/[O] ratio is kept fixed to 0.3, the C2H integrated line luminosities are fainter by a factor of five (see orange square in comparison with the dotted black line). If however the volatile [C]/[O] ratio increases and overcomes the [C]/[O]=1 threshold, C2H line luminosities are boosted by more than one order of magnitude (see comparison between orange and blue squares). Our Lupus C2H detections may be compatible with a volatile carbon depletion of two orders of magnitude, and a [C]/[O]¿1, as shown in panel (b) where the observed data points are shifted toward larger disk masses by a factor of 100. If carbon is depleted by two orders of magnitude, CO isotopologues lines would also be fainter by roughly the same factor and the actual disk masses would be a factor of 100 larger (Miotello et al., 2016). This first order comparison with model predictions suggests that volatiles may be strongly depleted and [C]/[O]¿1 in the Lupus disks. The two sources that were not detected in C2H, Sz 68 and J16070384-3911113, may be disks with genuine gas depletion. In fact, according to Fig. 6, they would need to have very low masses to be reproduced by any of the models.
While our C2H model results show that C2H line emission increases by more than one order of magnitude if the volatile [C]/[O] ratio increases from 0.3 to 1.5 (see Fig. 6), the CN line fluxes, on the other hand, are found to vary only by a factor of 2 (see Cazzoletti et al., 2018, Fig. 14). The stronger dependence of C2H lines on volatile [C]/[O] compared with CN lines may explain the steep correlation shown in Fig. 5 and tells us something about the similar but different origin of these two molecules.
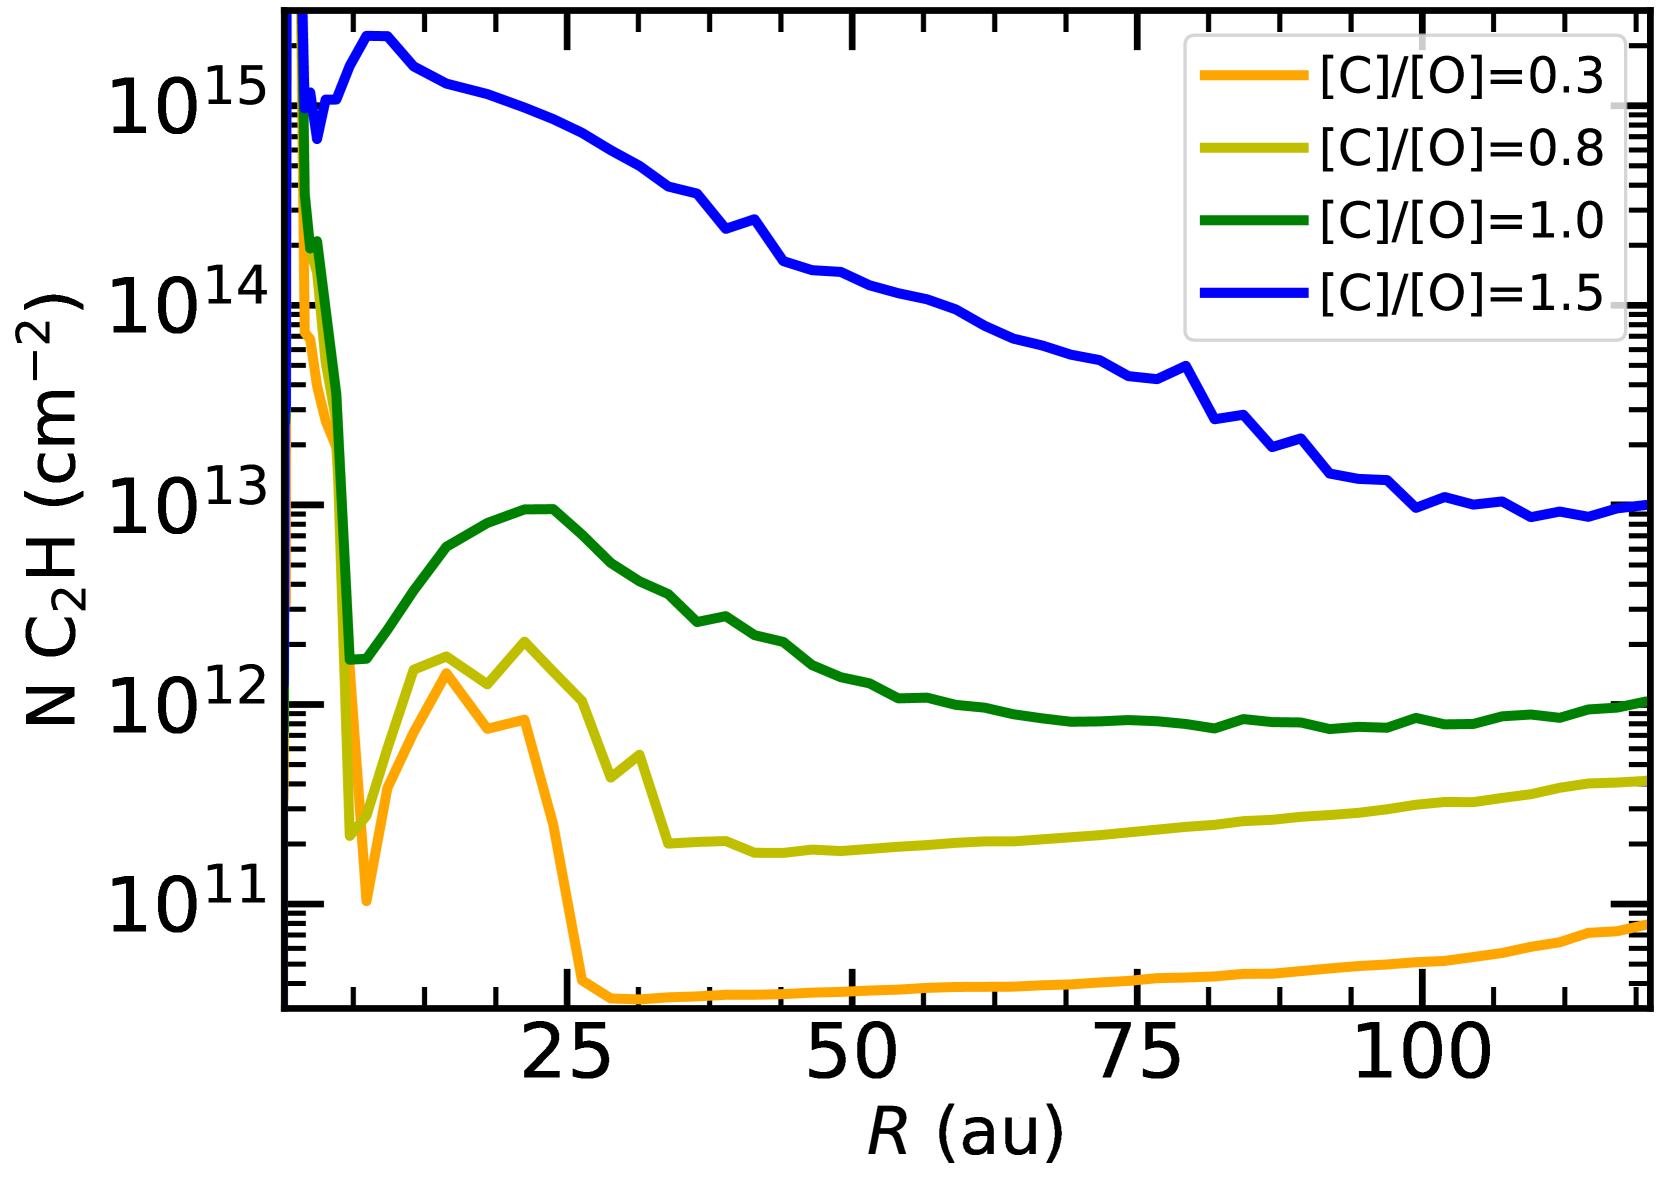
Bergin et al. (2016) investigated the effects of the volatile [C]/[O] on the intensity of the C2H emission. The authors ran different sets of models with ISM-like volatile [C]/[O]=0.4, and with enhanced [C]/[O] ratios equal to 1 and 2. With an ISM-like abundance of carbon and oxygen ([C]/[O]=0.4) their simulated emission is well below observed values in DM Tau and TW Hya. With [C]/[O]=1 the simulation comes closer to the data, but [C]/[O]¿1 is needed to approach the observed values, similarly to the Lupus disks. The same conclusion was found by Kama et al. (2016) for TW Hya. This shows that bright C2H observations do not simply imply a large volatile [C]/[O] ratio, but specifically that such ratio is larger than unity. Similarly, two orders of magnitude increase in the C2H simulated column densities is found by Cleeves et al. (2018) (see their Fig. 4) going from [C]/[O]=0.95 to 1.86. A similar behaviour is found also with our DALI models, where C2H column densities increase by two orders of magnitude if we increase [C]/[O] from 0.8 to 1.5 (see Fig. 12).
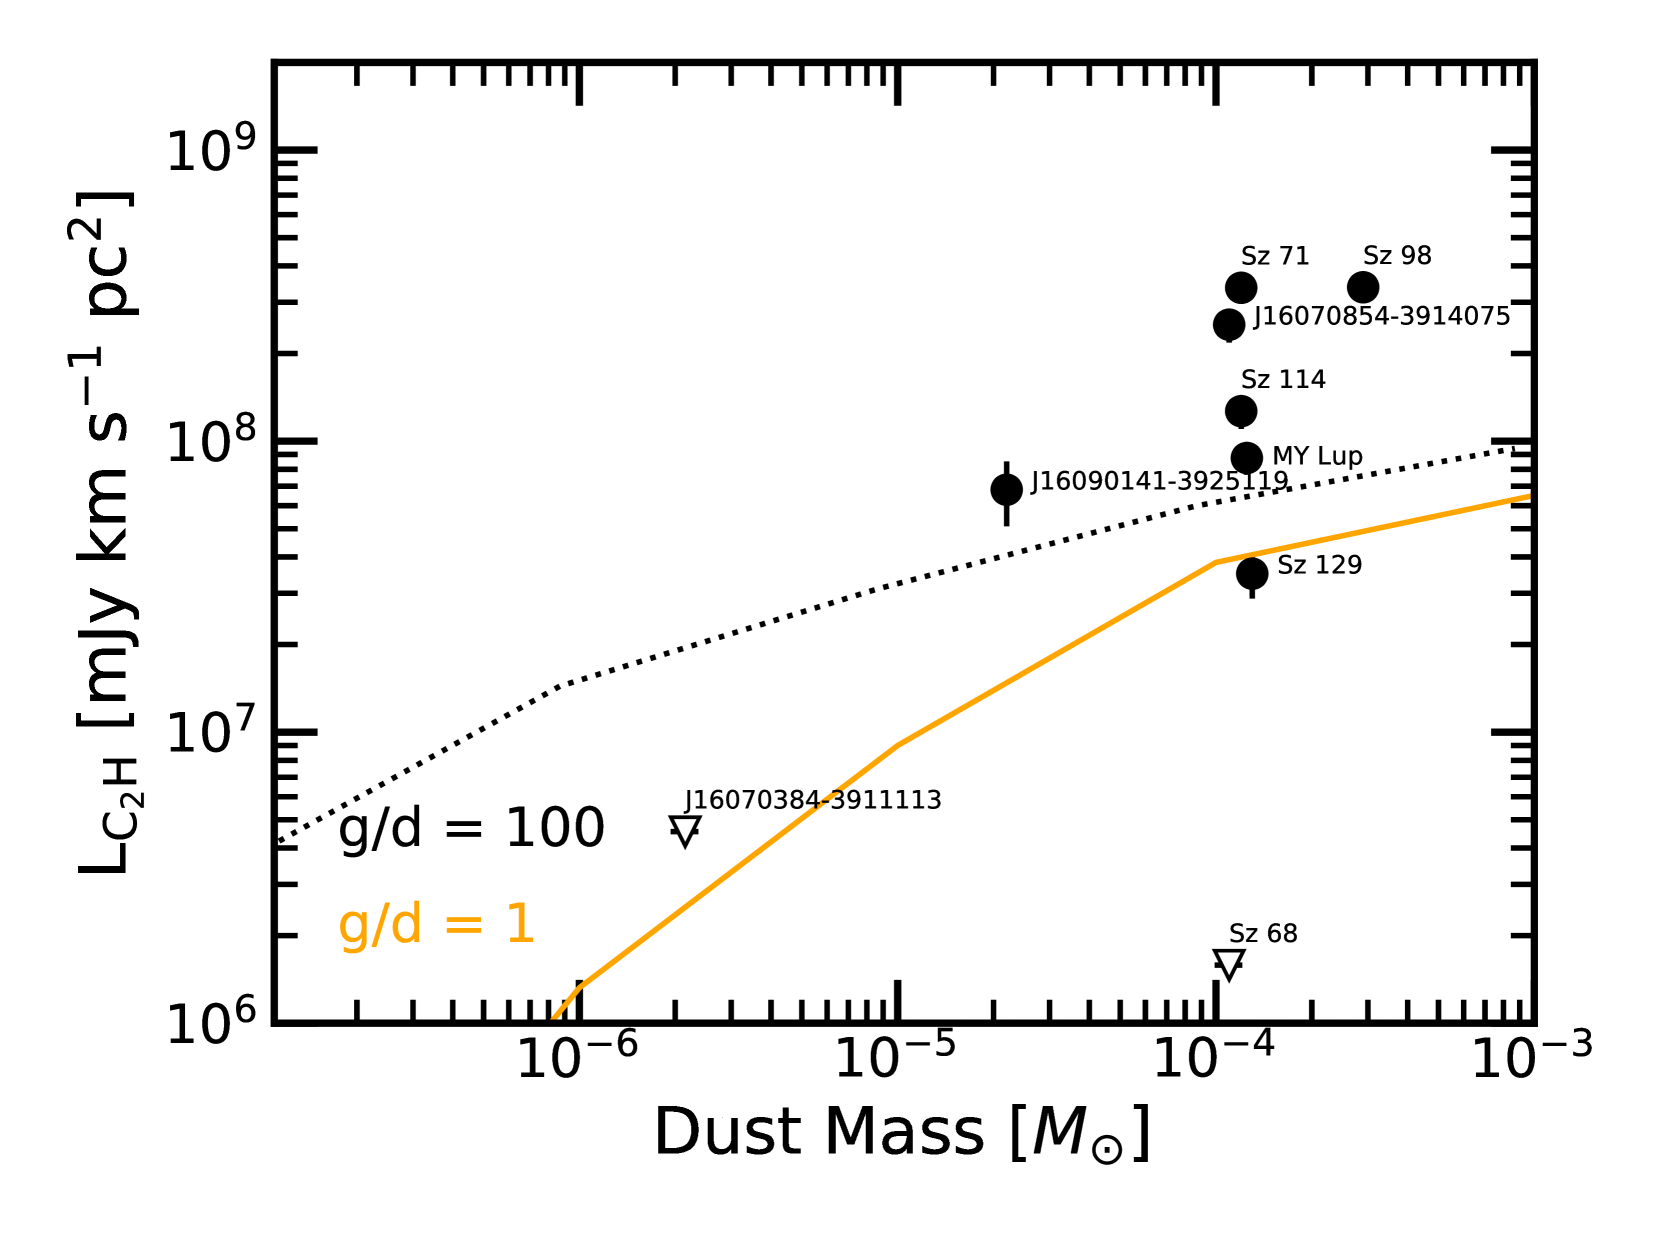
In order to test the dependence of the C2H emission with an actual gas depletion, we ran the same set of standard models shown by the dotted black line in Fig. 6, but decreasing the gas masses by two orders of magnitude while keeping the same dust masses. This provides a set of models with gas/dust ratios equal to unity, whose results are presented in Fig. 7 by the orange solid line. Our Lupus C2H observations are also reported, as a function of their dust masses, derived from their continuum emission (see Miotello et al., 2017). These models fail to reproduce the brighter observed C2H line luminosity even more than the models with a gas/dust ratio of 100. The fainter C2H detection, i.e. Sz 129, could be consistent with models with gas/dust=1 if we compare with the disk dust mass (Fig. 7), but this does not hold if we plot the model results against the total gas mass based on CO for ISM [C] and [O] (as in Fig. 6, left). Interestingly enough, J16070854-3914075 may be compatible with a genuine gas depletion. Sz 68 is a more complicated case, as part of a known binary system (Andrews et al., 2018).
5 Summary and conclusion
This work presents new ALMA observations of C2H together with higher signal/noise continuum data at 246 GHz in a subsample of nine protoplanetary disks in the Lupus star-forming region. Seven out of nine disks are detected in C2H emission. After performing self-calibration, the C2H integrated luminosities have been compared with CO-based gas/dust ratios (Miotello et al., 2017). The seven detections have much brighter fluxes than the typical sensitivity of our data, hinting to a step-like distribution of the disks in our sample that results from the [C]/[O] ratio being larger or smaller than unity. This interpretation is supported by physical-chemical models, which are able to reproduce the observations only if volatile carbon and oxygen are depleted and the [C]/[O] ratio is larger than unity. Models with reduced gas/dust ratios fail instead to reproduce our C2H observations. The small number statistics however limits the study, but the conclusion is strengthened when literature data on other sources are included. Other effects such as UV luminosity and disk size may cause scatter from source to source.
A steeper than linear correlation is found between C2H and CN emission lines in our Lupus disks. This can be explained by the fact that C2H line fluxes depend more strongly on variations of the volatile [C]/[O] ratio than CN line fluxes. This implies that these two molecules have a similar but different origin in disks.
Ring-like structures are detected both in C2H emission and in continuum (Huang et al., 2018) but they do not seem to be connected. Sz 71 shows ring shaped emission both in C2H and in CN and the location of the peak intensity coincides for the two tracers.
The results presented in this paper suggest that volatile carbon and oxygen depletion is at play in the Lupus disks, and it is consistent with the 13CO and C2H observations. This however does not necessarily rule out fast gas dispersal (see e.g., J16070854-3914075), as an explanation for the low CO fluxes and CO-based gas masses, since actual gas disk masses remain difficult to quantify (Ansdell et al., 2016; Pascucci et al., 2016; Miotello et al., 2017; Long et al., 2017). This has important implications for disk evolution and planet-formation theories, as disk gas masses are possibly larger than what CO observations would suggest if CO is assumed to be the main carbon carrier in the gas phase.
Acknowledgements
The authors wish to thank Richard Booth, Antonella Natta, Karin Öberg, and Jennifer Bergner for insightful comments and interesting discussions. A.M. and S.F. acknowledge an ESO Fellowship. This project has received funding from the European Union’s Horizon 2020 research and innovation programme under the Marie Sklodowska-Curie grant agreement No 823823. This work was funded by the Deutsche Forschungsgemeinschaft (DFG, German Research Foundation) - Ref no. FOR 2634/1 ER685/11-1. This paper makes use of the following ALMA data: ADS/JAO.ALMA#2017.1.00495.S. ALMA is a partnership of ESO (representing its member states), NSF (USA) and NINS (Japan), together with NRC (Canada), MOST and ASIAA (Taiwan), and KASI (Republic of Korea), in cooperation with the Republic of Chile. The Joint ALMA Observatory is operated by ESO, AUI/NRAO and NAOJ.
References
- Alcalá et al. (2017) Alcalá, J. M., Manara, C. F., Natta, A., et al. 2017, A&A, 600, A20
- Andrews et al. (2013) Andrews, S. M., Rosenfeld, K. A., Kraus, A. L., & Wilner, D. J. 2013, ApJ, 771, 129
- Andrews (2015) Andrews, S. M. 2015, PASP, 127, 961
- Andrews et al. (2018) Andrews, S. M., et al. 2018, ApJ, 869, L41
- Ansdell et al. (2016) Ansdell, M., Williams, J. P., van der Marel, N., et al. 2016, ApJ, 828, 46
- Ansdell et al. (2017) Ansdell, M., Williams, J. P., Manara, C. F., et al. 2017, AJ, 153, 240
- Ansdell et al. (2018) Ansdell, M., Williams, J. P., Trapman, L., et al. 2018, ApJ, 859, 21
- Bai & Stone (2014) Bai, X.-N., & Stone, J. M. 2014, ApJ, 796, 31
- Barenfeld et al. (2016) Barenfeld, S. A., Carpenter, J. M., Ricci, L., & Isella, A. 2016, ApJ, 827, 142
- Bergin et al. (2013) Bergin, E. A., Cleeves, L. I., Gorti, U., et al. 2013, Nature, 493, 644
- Bergin et al. (2014) Bergin, E. A., Cleeves, L. I., Crockett, N., & Blake, G. A. 2014, Faraday Discussions, 168, 61
- Bergin et al. (2016) Bergin, E. A., Du, F., Cleeves, L. I., et al. 2016, ApJ, 831, 101
- Bergner et al. (2019) Bergner, J. B., Oberg, K. I., Bergin, E. A., et al. 2019, arXiv:1904.09315
- Bosman et al. (2017) Bosman, A. D., Bruderer, S., & van Dishoeck, E. F. 2017, A&A, 601, A36
- Bosman et al. (2018) Bosman, A. D., Walsh, C., & van Dishoeck, E. F. 2018, A&A, 618, A182
- Bruderer et al. (2012) Bruderer, S., van Dishoeck, E. F., Doty, S. D., & Herczeg, G. J. 2012, A&A, 541, A91
- Cazzoletti et al. (2018) Cazzoletti, P., van Dishoeck, E. F., Visser, R., Facchini, S., & Bruderer, S. 2018, A&A, 609, A93
- Cleeves et al. (2018) Cleeves, L. I., Öberg, K. I., Wilner, D. J., et al. 2018, ApJ, 865, 155
- Comerón (2008) Comerón, F. 2008, Handbook of Star Forming Regions, Volume II, 295
- Du et al. (2017) Du, F., Bergin, E. A., Hogerheijde, M., et al. 2017, ApJ, 842, 98
- Dutrey et al. (1997) Dutrey, A., Guilloteau, S., & Guelin, M. 1997, A&A, 317, L55
- Eisner et al. (2016) Eisner, J. A., Bally, J. M., Ginsburg, A., & Sheehan, P. D. 2016, ApJ, 826, 16
- Eistrup et al. (2016) Eistrup, C., Walsh, C., & van Dishoeck, E. F. 2016, A&A, 595, A83
- Eistrup et al. (2018) Eistrup, C., Walsh, C., & van Dishoeck, E. F. 2018, A&A, 613, A14
- Favre et al. (2013) Favre, C., Cleeves, L. I., Bergin, E. A., Qi, C., & Blake, G. A. 2013, ApJ, 776, L38
- Flock et al. (2015) Flock, M., Ruge, J. P., Dzyurkevich, N., et al. 2015, A&A, 574, A68
- Gaia Collaboration et al. (2018) Gaia Collaboration, Mignard, F., Klioner, S. A., et al. 2018, A&A, 616, A14
- Guilloteau et al. (2016) Guilloteau, S., Reboussin, L., Dutrey, A., et al. 2016, A&A, 592, A124
- Henning et al. (2010) Henning, T., Semenov, D., Guilloteau, S., et al. 2010, ApJ, 714, 1511
- Hogerheijde et al. (2011) Hogerheijde, M. R., Bergin, E. A., Brinch, C., et al. 2011, Science, 334, 338
- Huang et al. (2018) Huang, J., Andrews, S. M., Dullemond, C. P., et al. 2018, ApJ, 869, L42
- Johansen et al. (2009) Johansen, A., Youdin, A., & Klahr, H. 2009, ApJ, 697, 1269
- Kama et al. (2016) Kama, M., Bruderer, S., van Dishoeck, E. F., et al. 2016, A&A, 592, A83
- Kastner et al. (2014) Kastner, J. H., Hily-Blant, P., Rodriguez, D. R., Punzi, K., & Forveille, T. 2014, ApJ, 793, 55
- Kastner et al. (2015) Kastner, J. H., Qi, C., Gorti, U., et al. 2015, ApJ, 806, 75
- Kastner et al. (2018) Kastner, J. H., Qi, C., Dickson-Vandervelde, D. A., et al. 2018, ApJ, 863, 106
- Kelly (2007) Kelly, B. C. 2007, ApJ, 665, 1489
- Krijt et al. (2018) Krijt, S., Schwarz, K. R., Bergin, E. A., & Ciesla, F. J. 2018, ApJ, 864, 78
- Long et al. (2017) Long, F., Herczeg, G. J., Pascucci, I., et al. 2017, ApJ, 844, 99
- Long et al. (2018) Long, F., Pinilla, P., Herczeg, G. J., et al. 2018, ApJ, 869, 17
- Manara et al. (2016) Manara, C. F., Rosotti, G., Testi, L., et al. 2016, A&A, 591, L3
- Manara et al. (2018) Manara, C. F., Morbidelli, A., & Guillot, T. 2018, A&A, 618, L3
- Mathews et al. (2013) Mathews, G. S., Klaassen, P. D., Juhász, A., et al. 2013, A&A, 557, A132
- McClure et al. (2016) McClure, M. K., Bergin, E. A., Cleeves, L. I., et al. 2016, ApJ, 831, 167
- Miotello et al. (2014) Miotello, A., Bruderer, S., & van Dishoeck, E. F. 2014, A&A, 572, AA96
- Miotello et al. (2016) Miotello, A., van Dishoeck, E. F., Kama, M., & Bruderer, S. 2016, A&A, 594, A85
- Miotello et al. (2017) Miotello, A., van Dishoeck, E. F., Williams, J. P., et al. 2017, A&A, 599, A113
- Öberg et al. (2011) Öberg, K. I., Murray-Clay, R., & Bergin, E. A. 2011, ApJ, 743, L16
- Öberg et al. (2015) Öberg, K. I., Furuya, K., Loomis, R., et al. 2015, ApJ, 810, 112
- Pascucci et al. (2016) Pascucci, I., Testi, L., Herczeg, G. J., et al. 2016, ApJ, 831, 125
- Schwarz et al. (2016) Schwarz, K. R., Bergin, E. A., Cleeves, L. I., et al. 2016, ApJ, 823, 91
- Schwarz et al. (2018) Schwarz, K. R., Bergin, E. A., Cleeves, L. I., et al. 2018, ApJ, 856, 85
- Tazzari et al. (2017) Tazzari, M., Testi, L., Natta, A., et al. 2017, A&A, 606, A88
- Tazzari et al. (2018) Tazzari, M., Beaujean, F., & Testi, L. 2018, MNRAS, 476, 4527
- Testi et al. (2003) Testi, L., Natta, A., Shepherd, D. S., & Wilner, D. J. 2003, A&A, 403, 323
- van Terwisga et al. (2018) van Terwisga, S. E., van Dishoeck, E. F., Cazzoletti, P., et al. 2018, arXiv:1811.03071
- Testi et al. (2014) Testi, L., Birnstiel, T., Ricci, L., et al. 2014, Protostars and Planets VI, 339
- Trapman et al. (2017) Trapman, L., Miotello, A., Kama, M., van Dishoeck, E. F., & Bruderer, S. 2017, A&A, 605, A69
- Tripathi et al. (2017) Tripathi, A., Andrews, S. M., Birnstiel, T., & Wilner, D. J. 2017, ApJ, 845, 44
- van Dishoeck & Black (1988) van Dishoeck, E. F., & Black, J. H. 1988, ApJ, 334, 771
- van der Marel et al. (2016) van der Marel, N., van Dishoeck, E. F., Bruderer, S., et al. 2016, A&A, 585, A58
- van Terwisga et al. (2018) van Terwisga, S. E., van Dishoeck, E. F., Cazzoletti, P., et al. 2018, arXiv:1811.03071
- van ’t Hoff et al. (2017) van ’t Hoff, M. L. R., Walsh, C., Kama, M., Facchini, S., & van Dishoeck, E. F. 2017, A&A, 599, A101
- van Zadelhoff et al. (2001) van Zadelhoff, G.-J., van Dishoeck, E. F., Thi, W.-F., & Blake, G. A. 2001, A&A, 377, 566
- Visser et al. (2009) Visser, R., van Dishoeck, E. F., & Black, J. H. 2009, A&A, 503, 323
- Visser et al. (2018) Visser, R., Bruderer, S., Cazzoletti, P., et al. 2018, A&A, 615, A75
- Williams & Best (2014) Williams, J. P., & Best, W. M. J. 2014, ApJ, 788, 59
- Woitke et al. (2009) Woitke, P., Kamp, I., & Thi, W.-F. 2009, A&A, 501, 383
- Woitke et al. (2016) Woitke, P., Min, M., Pinte, C., et al. 2016, A&A, 586, A103
- Yu et al. (2017a) Yu, M., Evans, N. J., II, Dodson-Robinson, S. E., Willacy, K., & Turner, N. J. 2017, ApJ, 841, 39
- Yu et al. (2017b) Yu, M., Evans, N. J., II, Dodson-Robinson, S. E., Willacy, K., & Turner, N. J. 2017, ApJ, 850, 169
- Zhang et al. (2017) Zhang, K., Bergin, E. A., Blake, G. A., Cleeves, L. I., & Schwarz, K. R. 2017, Nature Astronomy, 1, 0130
Appendix A Dependence of C2H and CN emission on and .
The nine Lupus disks targeted in this paper have also been detected by van Terwisga et al. (2018) in CN () emission. In this section we plot C2H and CN emission line luminosity as a function of stellar and accretion luminosity (Alcalá et al., 2017, see Tab. 1) in Fig. 8, 9, 10, 11.
Appendix B C2H column densities.
The simulated C2H column densities obtained with a subsample of our DALI models are shown in Fig. 12. The total disk mass is fixed to 10, volatile C abundance is reduced by two orders of magnitude (with respect to ISM abundance) and O abundance is decreased by the same value or more in order to obtain [C]/[O] ratios of 0.3 (orange line), 0.8 (light green line), 1.0 (green line) and 1.5 (blue line). Similarly to what is found by Cleeves et al. (2018) (see their Fig. 4), the C2H column density increases by more than one order of magnitude if we increase [C]/[O] from 0.8 to 1.5 (see FIg. 12).