The Mapillary Traffic Sign Dataset for Detection and Classification on a Global Scale
Abstract
Traffic signs are essential map features globally in the era of autonomous driving and smart cities. To develop accurate and robust algorithms for traffic sign detection and classification, a large-scale and diverse benchmark dataset is required. In this paper, we introduce a traffic sign benchmark dataset of street-level images around the world that encapsulates diverse scenes, wide coverage of geographical locations, and varying weather and lighting conditions and covers more than manually annotated traffic sign classes. The dataset includes images that are fully annotated and images that are partially annotated. This is the largest and the most diverse traffic sign dataset consisting of images from all over world with fine-grained annotations of traffic sign classes. We have run extensive experiments to establish strong baselines for both the detection and the classification tasks. In addition, we have verified that the diversity of this dataset enables effective transfer learning for existing large-scale benchmark datasets on traffic sign detection and classification. The dataset is freely available for academic research111www.mapillary.com/dataset/trafficsign.
![[Uncaptioned image]](/html/1909.04422/assets/imgs/samples/mts_taxonomy_300dpi.png)
| Dataset | #Images | #Classes | #Signs | Attributes | Region | BBoxes | Unique |
| MTSD (TRAIN+VAL) MTSD | 313 | 11footnotemark: 1 | occluded, exterior, out-of-frame, dummy, ambiguous, included | world-wide | ✓ | ✓ ✗44footnotemark: 4 | |
| TT100K [36] | 22footnotemark: 2 | 66footnotemark: 6 221 | ✗ | China | ✓ | ✓ | |
| MVD [21] | 22footnotemark: 22 | ✗ | world-wide | ✓ | ✓ | ||
| GTSDB [9] | 43 | ✗ | Germany | ✓ | ✗ | ||
| RTSD [25] | 33footnotemark: 3 | 156 | 33footnotemark: 3 | ✗ | Russia | ✓ | ✗ |
| STS [12] | 20 | ✗ | Sweden | ✓ | ✗ | ||
| LISA [20] | 47 | ✗ | USA | ✓ | ✗ | ||
| GTSRB [30] | ✗ | 43 | ✗ | Germany | ✗ | ✗ | |
| BelgiumTS [31] | ✗ | 108 | ✗ | Belgium | ✗ | ✗ |
1 Introduction
Robust and accurate object detection and classification in diverse scenes is one of the essential tasks in computer vision. With the development and application of deep learning in computer vision, object detection and recognition has been studied [5, 23, 16] extensively on general scene understanding datasets [17, 4, 10]. In terms of fine-grained detection and classification, there are also the datasets that focused on general hierarchical object classes [10] or domain-specific datasets, e.g. on bird species [33]. In this paper, we will focus on detection and fine-grained classification of traffic signs.
Traffic signs are key map features for navigation, traffic control, and road safety. Specifically, traffic signs encode information for driving directions, traffic regulation, and early warning. For autonomous driving, accurate and robust perception of traffic signs is essential for localization and motion planning.
As an object class, traffic signs have specific characteristics in their appearance. First of all, traffic signs are in general rigid and planar. Secondly, traffic signs are designed to be distinctive from their surroundings. In addition, there is limited variety in colors and shapes for traffic signs. For instance, regulatory signs in European countries are typically circular with a red border. To some degree, the aforementioned characteristics limit the appearance variation and increase the distinctness of traffic signs. However, traffic sign detection and classification is still a very challenging problem due to the the following reasons: (1) traffic signs are easily confused with other object classes in street scenes (e.g. advertisements, banners, and billboards); (2) reflection, low light condition, damages, and occlusion hinder the classification performance of a sign class; (3) fine-grained classification with small inter-class difference is not trivial; (4) the majority of traffic signs—when appearing in street-level images—are relatively small in size, which requires efficient architecture designs for small objects.
Traffic sign detection and classification has been studied extensively in the computer vision community. Specifically, convolutional neural networks (CNN) [24] have obtained great success for traffic sign classification in the German Traffic Sign Benchmark [29]. Recent works on simultaneous detection and classification of traffic signs have also achieved good results on well-studied benchmark datasets [19, 36] using either the Viola-Jones framework [32] or CNN-based methods [13]. However, these studies were done in relatively constrained settings in terms of the benchmark dataset: the images and traffic signs are collected in a specific country; the number of traffic sign classes is relatively small; the images lack diversity in weather conditions, camera sensors, and seasonal changes.
Extensive research is still needed for the task of detecting and classifying traffic signs at a global scale and under varying capture conditions and devices. In this paper, we present the following contributions:
-
•
We present the most diverse traffic sign dataset with images from all over the world. The dataset contains over images that are fully annotated, covering known traffic sign classes and other unknown classes, resulting in over signs in total. Additionally, the dataset also includes about 48K images, where traffic signs are partially annotated by automatically propagating labels between neighboring images.
-
•
We establish extensive baselines for detection and classification on the dataset, shedding light on future research directions.
-
•
We study the impact of transfer learning using our traffic sign dataset and other traffic sign datasets released in the past. Our results show that pre-training on our dataset boosts the average precision () of the binary detection task by , thanks to the completeness and diversity of our dataset.
Related Work. Traffic sign detection and recognition has been studied extensively in the literature in the past. The German Traffic Sign Benchmark Dataset (GTSBD) [29] is one of the first datasets that was created to evaluate the classification branch of the problem. Following that, there have also been other traffic sign datasets focusing on regional traffic signs, e.g. Swedish Traffic Sign Dataset [11], Belgium Traffic Sign Dataset [19], Russian Traffic Sign Dataset [26], and Tsinghua-Tencent Dataset (TT100K) in China [36]. For generic traffic sign detection (where no class information of the traffic signs is available), there has been work done in the Mapillary Vistas Dataset (MVD) [21] (global) and BDD100K [35] (US only). A detailed overview and comparison of publicly available traffic sign datasets can be found in Footnote 4.
For general object detection, there has been substantial work on CNN-based methods with two main directions, i.e. one-stage detectors [18, 22, 16] and two-stage detectors [6, 5, 23, 3]. One-stage detectors are generally much faster, trading off accuracy compared to two-stage detectors. One exception is the one-stage RetinaNet [16] architecture that outperforms the two-stage Faster-RCNN [23] thanks to a weighting scheme during training to suppress trivial negative supervision. For simultaneous detection and classification, one of the recent works [2] shows that decoupling the classification from detection head boosts the accuracy significantly. Our work is related to [2] as we also decouple the detector from the traffic sign classifier.
To handle the scale variation of objects in the scene, many efficient multi-scale training and inference algorithms have been proposed and evaluated on existing datasets. For multi-scale training, in [27, 28, 14], a few schemes have been proposed to distill supervision information from different scales efficiently by selective gradient propagation and crop generation. To enable efficient multi-scale inference, feature pyramid networks (FPN) [15] were proposed to utilize lateral connections in a top-down architecture to construct effective multi-scale feature pyramid from a single image.
To develop the baselines presented in this paper, we have chosen Faster-RCNN [23] with FPN [15] as the backbone. Given the aforementioned characteristics of traffic sign imagery, we have also trained a separate classifier for fine-grained classification as in [2]. We elaborate the details of our baseline method in Section 4.
2 Mapillary Traffic Sign Dataset
In this section, we present a large-scale traffic sign dataset called Mapillary Traffic Sign Dataset (MTSD) including images with fully annotated traffic sign bounding boxes and corresponding class labels. Additionally, it includes a set of nearby images with automatically generated labels, making it a total of images. In the following sections we describe how the dataset was created and present our traffic sign class taxonomy consisting of 313 classes.
2.1 Image Selection
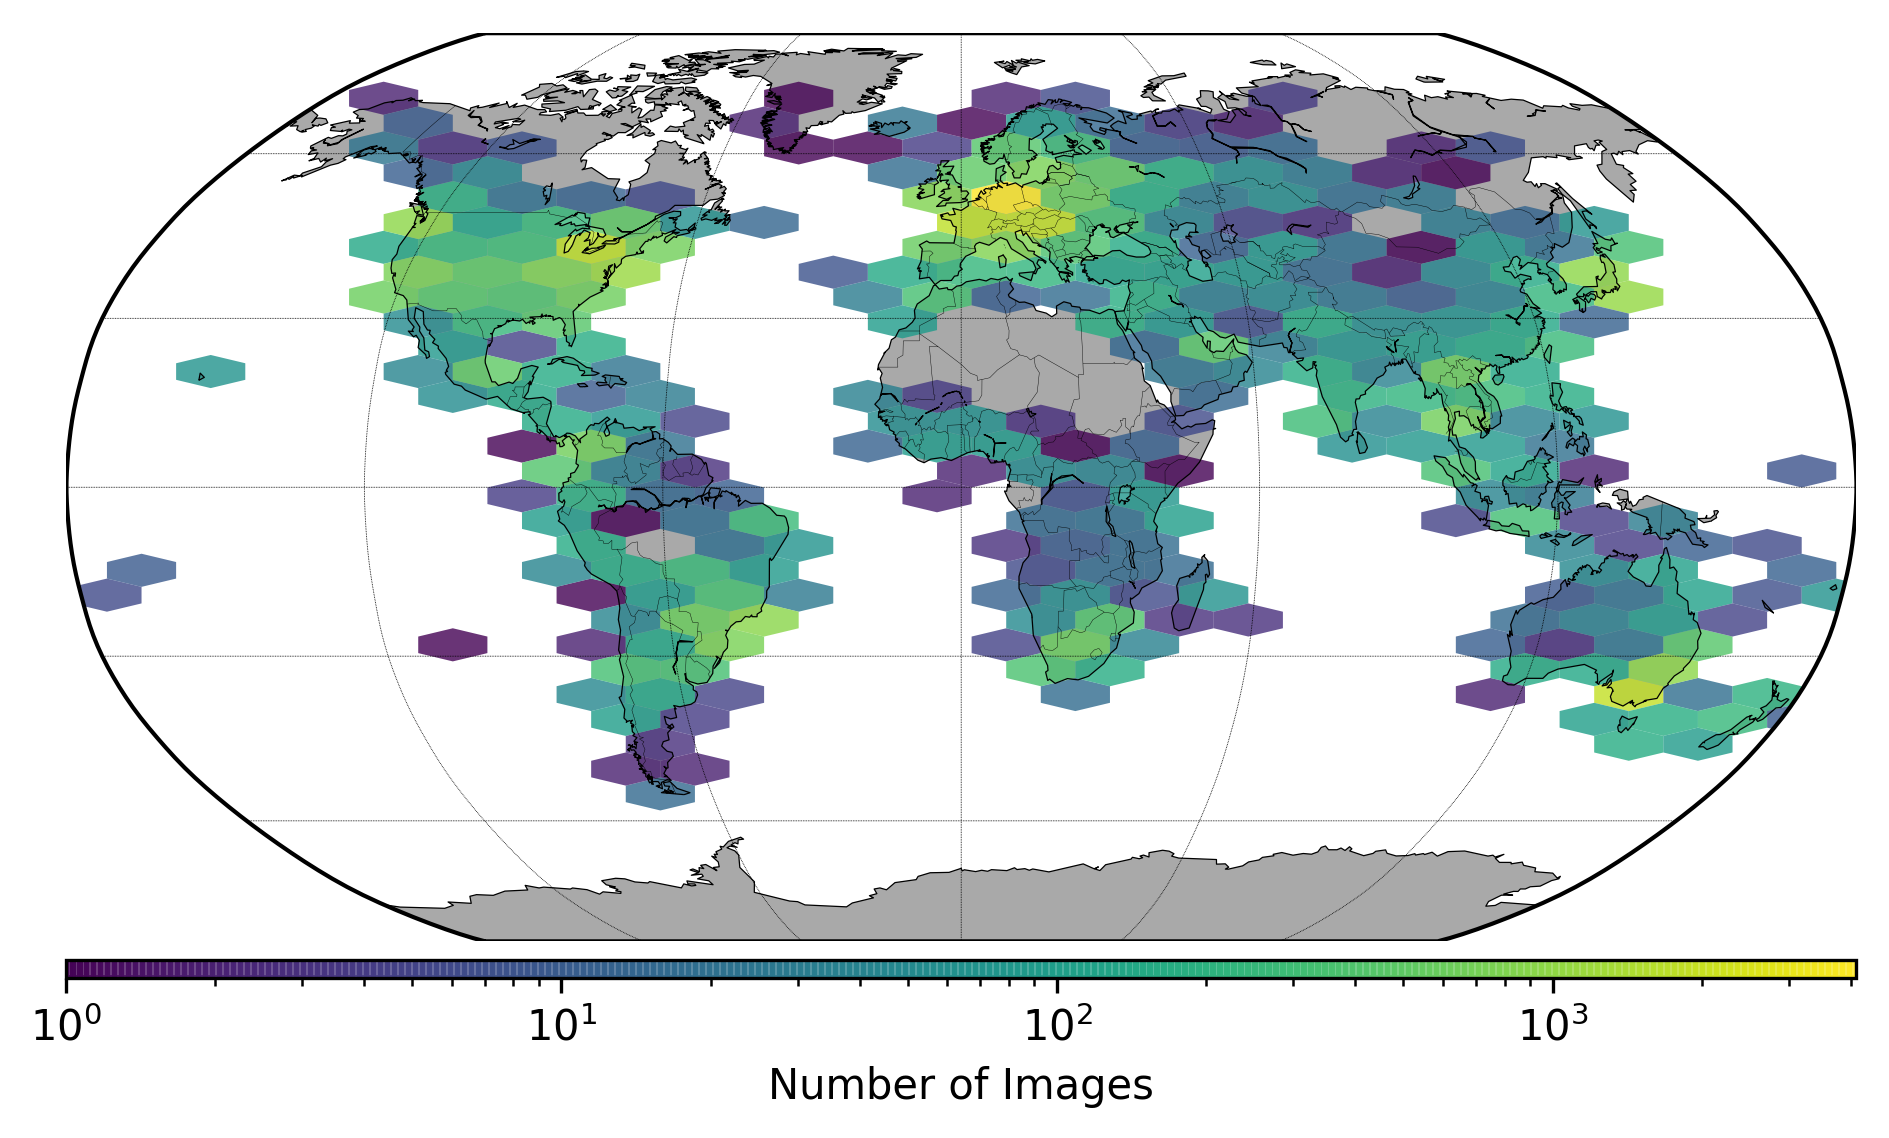
There are various conventions for traffic signs in different parts of the world, leading to strong appearance differences. Even within a single country or state, the distribution of signs is not uniform: some signs occur only in urban areas, some only on highways, and others only in rural areas. With MTSD, we present a dataset that covers this diversity uniformly. In order to do so, a proper pre-selection of images for annotation is crucial. The requirements for this selection step are: (1) to have a uniform geographical distribution of images around the world, (2) to cover images of different quality, captured under varying conditions, (3) to include as many signs as possible per image, and (4) to compensate for the long-tailed distribution of potential traffic sign classes.
Mapillary222www.mapillary.com/app is a street-level imagery platform hosting images collected by members of their community. All images are accessible to everyone via Mapillary’s public API under a CC-BY-SA license. Derived data including traffic sign detections are also available for academic research and approved applications.
In order to get a pool of pre-selected images satisfying the aforementioned requirements, we sample images in a per-country manner with a greedy scheme. The fraction of target images for each country is derived from the number of images available in that country and its population count weighted by a global target distribution over all continents (i.e. North America, Europe, Asia, South America, Oceania, Africa). We further make sure to cover both rural and urban areas within each country by binning the sampled images uniformly in terms of their geographical locations and sample random images from each of the resulting bins. In the last step of our greedy image sampling scheme, we prioritize images containing at least one traffic sign instance according to the traffic sign detections given by the Mapillary API and make sure to cover various image resolutions, camera manufacturers and scene properties333Details on how scene properties are defined and derived are included in the supplementary materials.. Additionally, we add a distance constraint so that selected images are far away from each other in order to avoid highly correlated images and traffic sign instances.
2.2 Annotation Process
The process of annotating an image including image selection approval, traffic sign localization by drawing bounding boxes, and class label assignment for each box is a complex and demanding task. To improve efficiency and quality, we split it into 3 consecutive tasks, with each having its own quality assurance process. All tasks were done by experts in image annotation after being trained with explicit specifications for each task.
- Image Approval.
-
Since initial image selection was done automatically based on the greedy heuristics described in Section 2.1, the annotators needed to reject images that did not fulfill our criteria for the dataset. In particular, we do not include non-street level images or images that have been taken from unusual places or viewpoints. Also we discarded images of very bad quality that could not be used for training at all (i.e. extremely blurry or overexposed). However, we still sample images of low quality in the dataset which include recognizable traffic signs as these are good examples to evaluate recognition on traffic signs in real-world scenarios.
- Sign Localization.
-
In this task, the annotators were instructed to localize all traffic signs in the images and annotate them with bounding boxes. In contrast to previous traffic sign datasets where only specific types of traffic signs have been annotated (e.g. TT100K [36] includes only standard circular and triangular shaped signs), MTSD contains bounding boxes for all types of traffic related signs including direction, information, highway signs, etc.
To speed up the annotation process, each image was initialized with bounding boxes of traffic signs extracted from the Mapillary API. The annotators were asked to correct all existing bounding boxes to tightly contain the signs (or reject them in cases of false positives) and to annotate all missing traffic signs if their shorter sides were larger than . We provide a statistical evaluation of the manual changes done by the annotators in Section 3.3.
- Sign Classification.
-
This task was done independently for each annotated traffic sign. Each traffic sign (together with some image context) was shown to the annotators who were asked to provide the correct class label. This is not trivial, since the number of possible traffic sign classes is large. To the best of our knowledge, there is no globally valid traffic sign taxonomy available; even then, it would be impossible for the annotators to keep track of all the different traffic sign classes.
To overcome this issue, we used a set of previously harvested template images of traffic signs from Wikimedia Commons [1] and grouped them by similarity in appearance and semantics. This set of templates (together with their grouping) defines the possible set of traffic sign classes that can be selected by the annotators. In fact, we store an identifier of the actual selected template, which allows us to link the traffic sign instances to our flexible traffic sign taxonomy without even knowing the final set of classes beforehand (see Section 2.3).
Since it would still be too time-consuming to scroll through the entire list of templates to choose the correct one out of thousands, we trained a neural network (with the grouped template images) to predict the similarities between an arbitrary image of a traffic sign instance and the templates. We used this proposal network to assist the annotators in choosing the correct template by pre-sorting the template list for each individual traffic sign. For cases in which this strategy fails to provide a matching template, we provided a text-based search for templates. For details about the annotation UI and how the proposal network was used to assist the annotator we refer to the supplemental material.
- Additional Attributes.
-
In addition to the bounding boxes and the matching traffic sign templates, the annotators were asked to provide additional attributes for each sign: occluded if the sign is partly occluded; ambiguous if the sign is not classifiable at all (e.g. too small, bad quality, heavy occlusion etc.); dummy if it looks like a sign but isn’t (e.g. car stickers, reflections, etc.); out-of-frame if the sign is cut off by the image border; included if the sign is part of another bigger sign; and exterior if the sign includes other signs. Some of these attributes were assigned during localization (if context information is needed). The rest was assigned during classification. In Section 4 we describe how we use some of these attributes to guide the training of our traffic sign detector.
- Annotation Quality.
-
All annotations in MTSD were done by expert annotators going through a thorough training process. Their work was monitored by a continuous quality control (QC) process to quickly identify problems during annotations. Moreover, our step-wise annotation process (i.e. approval followed by localization followed by classification) ensures that each traffic sign was seen by at least two annotators. The second annotator operating in the classification step was able to reject false positive signs or to report issues with the bounding box in which case the containing image was sent back to the localization step.
In additional quality assurance (QA) experiments done by a \nth2 annotator on images including traffic signs we found that
-
•
only of bounding boxes needed correction.
-
•
the false negative rate was (corresponding to a total number of only missing signs; most of them being very small).
-
•
the false positive rate was at . Note that is in the localization step before classification, where a second annotator would have been asked to classify the sign and could potentially fix false positives.
-
•
2.3 Traffic Sign Class Taxonomy
Traffic signs vary across different countries. For many countries, there exists no publicly available and complete catalogue of signs. The lack of a known set of traffic sign classes leads to challenges in assigning class labels to traffic signs annotated in MTSD. The potential magnitude of this unknown set of traffic signs is in the thousands as indicated by the set of template images described in Section 2.2.
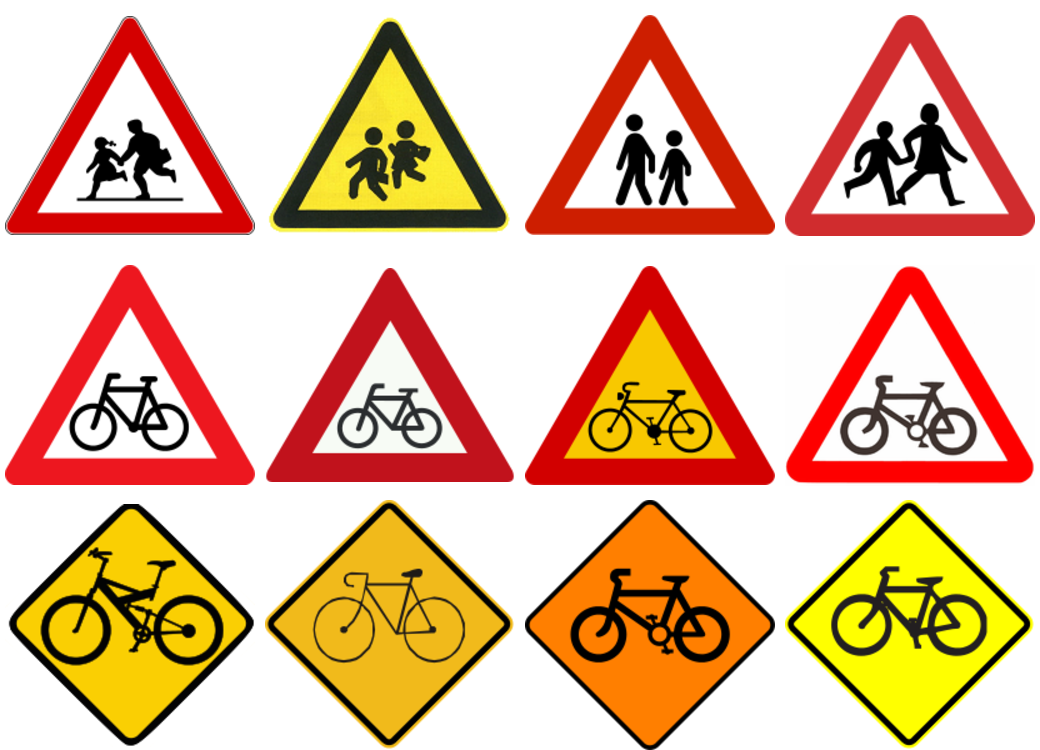
For MTSD, we did a manual inspection of the templates that have been chosen by the annotators and selected a subset of them to form the final set of classes included in the dataset as visualized in Figure 1. This subset was chosen and grouped such that there are no overlaps or confusion (visual or semantic) among the classes. Templates with the same semantics and similar appearance form a class. However, different groups of templates that share the same semantics but are different in terms of appearance form different classes as shown in Figure 3.
All these classes defined by disjoint sets of templates build up our traffic sign class taxonomy. We map all annotated traffic signs in MTSD that have a template selected within this taxonomy to a class label. We would like to emphasize that our flexible traffic sign taxonomy allows us to incrementally extend MTSD by adding more classes together with already annotated traffic sign instances with known templates.
2.4 Partial Annotations
In addition to the fully-annotated images, we provide another set of images with partially annotated bounding boxes and labels of traffic signs. Given the fully-annotated images, the annotations of this set of images are generated automatically. We achieve this by finding correspondences between the manual annotations in the fully-annotated images and automatic detections in geographically neighboring images from the Mapillary API. To find these correspondences, we first use Structure from Motion (SfM) [7] to recover the relative camera poses between the fully-annotated images and the partially annotated images. With these estimated relative poses, we generate the correspondences between annotated signs and automatically detected signs by triangulating and verifying the re-projection errors for the centers of the bounding boxes between multiple images. Having these correspondences, we propagate the manually annotated class labels to the automatic detections in the partially annotated images. Since there is no guarantee that all traffic signs are detected through Mapillary’s platform, we obtained a set of images with partially annotated bounding box annotations and labels. Note that, for unbiased evaluation, we ensure that the extension is done only in the geographical neighborhood of images in the training set (based on the split discussed in Section 2.5). Example images can be found in Figure 4. A more detailed description of how this set was created can be found in supplemental material.
We see this set of partially annotated images serving as a data source for further research in semi-supervised learning for traffic sign detection and recognition. In addition, the correspondence information between the traffic sign observations will pave the ways for other learning tasks like semantic matching with street-level objects.
2.5 Dataset Splits
As common practice with other datasets such as COCO [17], MVD [21] and PASCAL VOC [4], we split MTSD into training, validation and test sets, consisting of , , and images, respectively. We provide the image data for all images as well as the annotations for the training and validation set; the annotations for the test set will not be released in order to ensure a fair evaluation. Additionally, we provide a set of images with partial annotations as discussed in Section 2.4 that can be used for training as well.
Each split is created in a way to match the distributions described in Section 2.1. Especially, we ensure that the distribution of class instances is similar for each split, to avoid that rare classes are under-represented in the smaller sets (i.e. validation/test sets). The same holds true for the additional sign attributes (e.g. ambiguous, etc.).
3 Statistics
In this section, we provide statistics of image and traffic sign properties of MTSD and also a comparison with previous datasets such as TT100K [36] and MVD [21]. Furthermore, we provide statistical insights about annotator actions during the creation of MTSD.
3.1 Image Properties
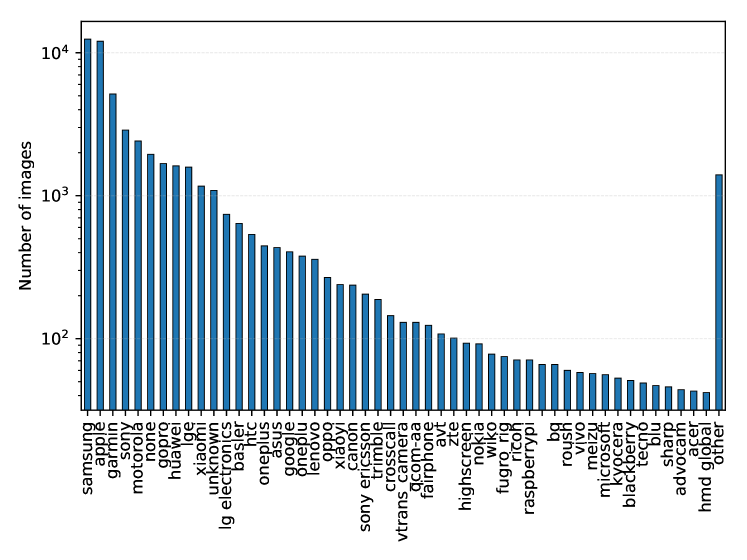
For a diverse dataset to reflect a real-world image capturing setting, it is important to cover a broad range of different image qualities and other image properties such as aspect ratio, focal length and other sensor-specific properties. The image selection strategy described in Section 2.1 used for MTSD ensures a good distribution over different capturing settings. In Figure 5, we show the distribution of camera manufacturers used for capturing the images of MTSD. In total, the dataset covers over different sensor manufacturers (we group the tail of the distribution for displaying purposes) which results in a large variety of image properties similar to the properties described in [21]. This is in contrast to the setup used for the TT100K [36] which contains only images taken by a single sensor setup, making MTSD more challenging in comparison.
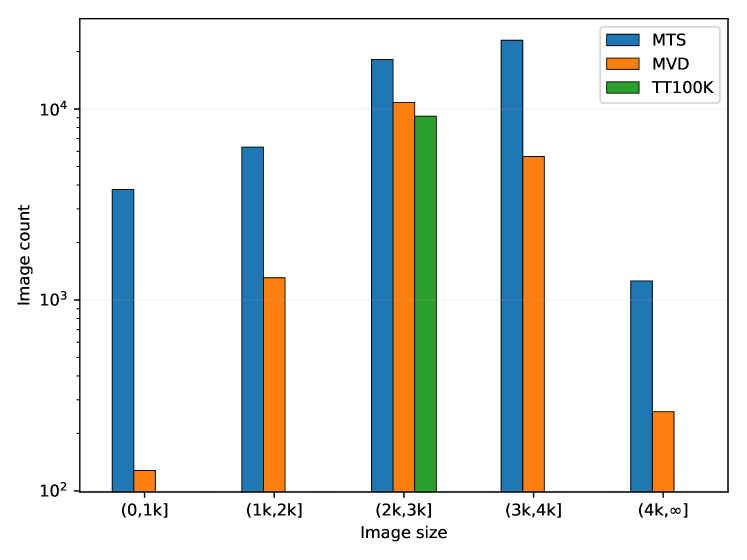
The diversity in camera sensors further results in a diverse distribution over image resolutions as shown in Figure 6. MTSD covers a broad range of image sizes starting from low-resolution images with going up to images of more than . Additionally, we include 360-degree panoramas stored as standard images with equi-rectangular projection. Besides the overall larger image volume compared to other datasets, MTSD also covers a larger fraction of low-resolution images, which is especially interesting for pre-training and validating detectors applied on similar sensors e.g. built-in automotive cameras. For comparison, TT100K only contains images of and even for this resolution the volume of images is smaller than in MTSD.
3.2 Traffic Sign Properties
The fully-annotated set of MTSD includes a total number of traffic sign bounding boxes out of which have a class label within our traffic sign taxonomy covering different traffic sign classes. The remaining traffic signs sum up as ambiguous signs, directional signs, information signs, highway shields, exterior signs, barrier signs, signs without a selected template, and signs with a template not included by our current taxonomy (but potentially in future releases of the dataset).
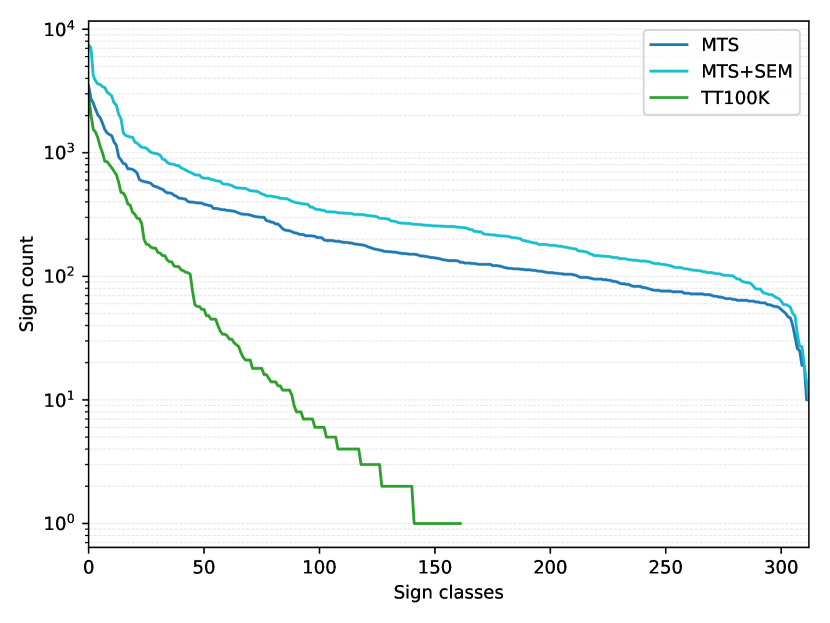
The left plot in Figure 7 shows a comparison of the traffic sign class distribution between MTSD and TT100K. Note that MVD is not included here since it does not have labels of traffic sign classes. MTSD has approximately twice as many traffic sign classes than TT100K; if we use the definition of a trainable class in [36] (which are classes with at least traffic sign instances within the dataset) this factor increases to approximately between TT100K and MTSD. This difference gets even higher if we consider the instances from the partially annotated set of MTSD as well.
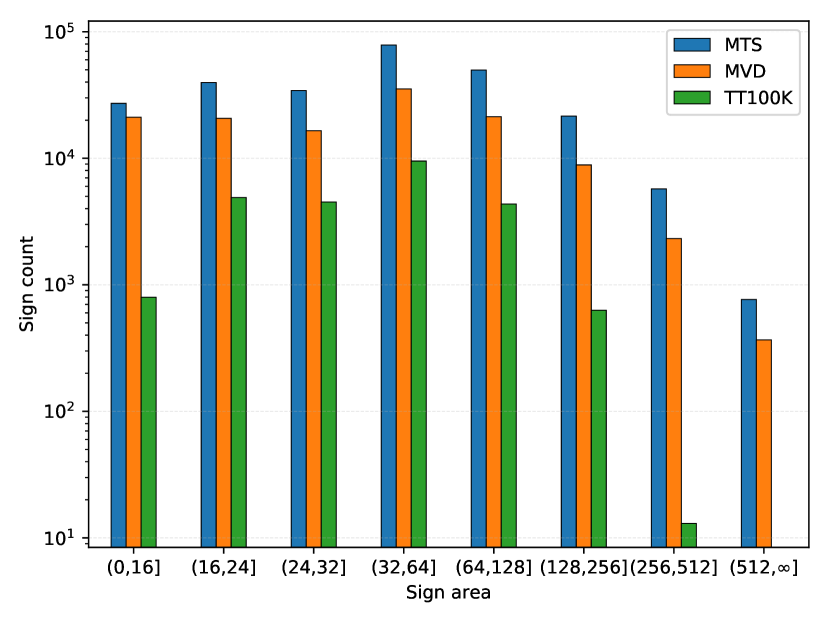
The plot in the middle of Figure 7 compares the areas of signs in terms of pixels in the original resolution of the containing image. MTSD covers a broad range of traffic sign sizes with an almost uniform distribution up to . MVD has a similar distribution with a lower overall volume. In comparison to TT100K, MTSD provides a higher fraction of extreme sizes which poses another challenge for traffic sign detection.
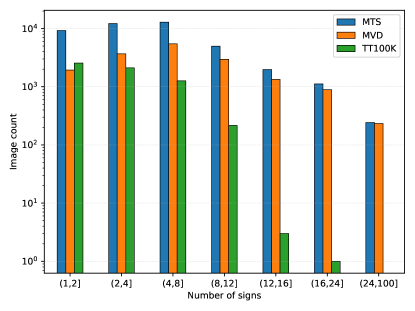
Finally, the plot on the right of Figure 7 shows the distribution of images over the number of signs within the image. Besides the higher volume of images, MTSD contains a larger fraction of images with a large number of traffic sign instances (i.e. ). One reason for this is that the annotations in MTSD cover all types of traffic signs, whereas TT100K only contains annotations for very specific types of traffic signs in China.
3.3 Annotator Interactions
| Count | Mean | ||
| Images worked on | - | ||
| Signs worked on | - | ||
| Originated from detection | |||
| IoU with original detection | - | ||
| New signs per image | - |
To gather some insights about the work of the annotators, we analyzed their interactions with the bounding boxes fetched from the Mapillary API as described in Section 2.2 and present the results in Table 2. We found that of the bounding boxes annotated in MTSD originated from an automatic detection already present. However, when comparing the final boxes within MTSD to the original ones, we find an overlap of only in terms of IoU, proving the improvement of detection accuracy. Additionally, we found that the annotators on average added approximately completely new bounding boxes that were missing before in each image.
4 Traffic Sign Detection
The first task defined on MTSD is detecting traffic signs as bounding boxes without inferring the specific class labels. The goal is to predict a set of bounding boxes with corresponding confidence scores as traffic signs.
- Metrics.
-
Given a set of detections with estimated scores for each image, we first compute the matching between the detections and annotated ground truth within each image separately. A detection can be successfully matched to a ground truth if their Jaccard overlap () [4] is ; if multiple detections match the same ground truth, only the detection with the highest score is a match while the rest is not (double detections); each detection will only be matched to one ground truth bounding box with the highest overlap.
Having this matching indicator (TP vs. FP) for every detection, we define define average precision () similar to COCO [17] (i.e. which resembles definition of PASCAL VOC [4]) and compute precision as a function of recall by sorting the matching indicators by their corresponding detection confidence scores in descending order and accumulate the number of TPs and FPs. is then defined as the area under the curve of this step function. Additionally, we follow [17] and compute for traffic signs of different scales: , , and refer to computed for boxes with area , , and , respectively.
- Baseline and Results.
-
In Footnote 1, we show experimental results using a Faster R-CNN based detector [23] with FPN [15] and residual networks [8] as the backbone.
During training we randomly sample crops of size at full resolution instead of down-scaling the image to avoid vanishing of small traffic signs, as traffic signs can be very small in terms of pixels and MTSD covers traffic signs from a broad range of scales in different image resolutions. We use a batch size of 16 distributed over 4 GPUs during training for the ResNet50 models; for the ResNet101 version, we use batches of size 8. Unless stated otherwise, we train using stochastic gradient descent (SGD) with an initial learning rate of and lower the learning rate when the validation error plateaus. For inference, we down-scale the input images such that their larger side does not exceed a certain number of pixels (either or ) or operate on full resolution if the original image is smaller.
Besides training on MTSD, we conduct transfer-learning experiments on TT100K and MVD444We convert the segmentation of traffic-sign–front instances to bounding boxes by taking the minimum and maximum in the x, y axes. Note that this conversion can be inaccurate if signs are occluded by other objects. to test the generalization properties of the proposed dataset. We use the same baseline as for the MTSD experiments and train it on both datasets, once with ImageNet initialization and once with MTSD initialization. The models trained with ImageNet initialization are trained to convergence. To ensure a fair comparison, we fine-tune only for half the number of epochs when initializing with MTSD weights. The results in Footnote 1 show that MTSD pre-training boosts detection performance by a large margin on both datasets regardless of the input resolution. This is a clear indication for the generalization qualities of MTSD.
| Max 4000px | Max 2048px | |||||||
| MTSD | ||||||||
| ResNet50 FPN | ||||||||
| ResNet101 FPN | ||||||||
| TT100K | ||||||||
| [36] multi-scale11footnotemark: 1 | - | - | - | - | ||||
| ResNet50 FPN | - | - | - | - | ||||
| + pre-trained on MTSD | - | - | - | (+) | ||||
| MVD (traffic signs) | ||||||||
| ResNet50 FPN | ||||||||
| + pre-trained on MTSD | (+) | (+) | ||||||
| MTSD | ||||
| FPN50 + classifier | ||||
| FPN101 + classifier | ||||
| TT100K | ||||
| [36] multi-scale | ||||
| FPN50 + classifier | (+) | |||
| + det pre-trained | (+) | |||
| + cls pre-trained | (+) | |||
5 Simultaneous Detection and Classification
The second task on MTSD is simultaneous detection and classification of traffic signs (i.e. multi-class detection). It extends the detection task to additionally predict a class label for each traffic sign instance that is in our taxonomy. For the traffic signs that do not have a label within our taxonomy we introduce a general class other-sign.
- Metric.
-
The main metric for this task is mean average precision () over all classes; per-class is calculated as described in Section 4. The matching between predicted and ground truth boxes is done in a binary way by ignoring the class label. After that, we filter out all other-sign ground-truth instances and detections since we do not want to evaluate on this general class.
- Baseline.
-
A trivial baseline for this task would be to extend the binary detection baseline from Section 4 to the multi-class setting by adding a -way classification head. However, preliminary experiments showed that a straight-forward training of such a network does not yield acceptable performance. We hypothesize that this is due to (1) scale issues for small signs before RoI pooling and, (2) under-represented class variation within the training batches given that the majority of traffic sign instances are other-sign.
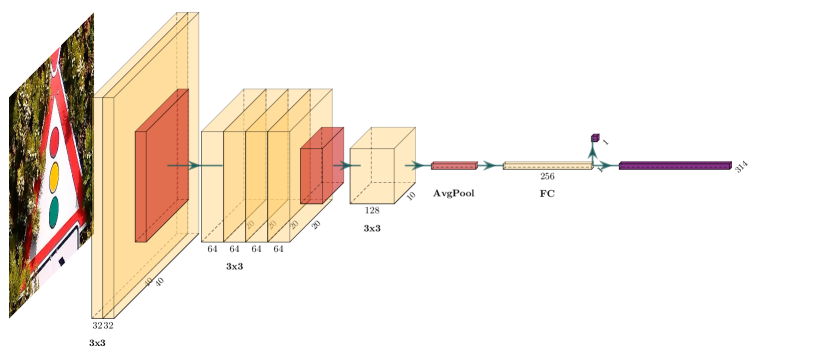
To overcome the scale issue and to have better control over batch statistics during training, we opted for a two-stage architecture with using our binary detector in the first stage and a decoupled shallow classification network in the second stage. This form of decoupling has been shown to improve the detection and recognition accuracy [2]. The classification network consists of seven convolutions (each followed by batch normalization) with 2 max-pooling layers after the and convolution layer. The last convolution is followed by spatial average pooling and a fully-connected stage resulting in a -way classification head with softmax activation ( and other-sign) and a single sigmoid activation for foreground/background classification. The network architecture is depicted in Figure 9.
We use image crops predicted by the detector (both foreground and background) together with crops from the ground-truth as input during training and optimize the network using cross-entropy loss. To balance the distribution of traffic sign classes in a batch, we uniformly sample different classes with 3 samples each class and add another background crops per batch. We train the network with SGD for epochs starting with a learning rate of , lowered by a factor of after and epochs.
- Results.
-
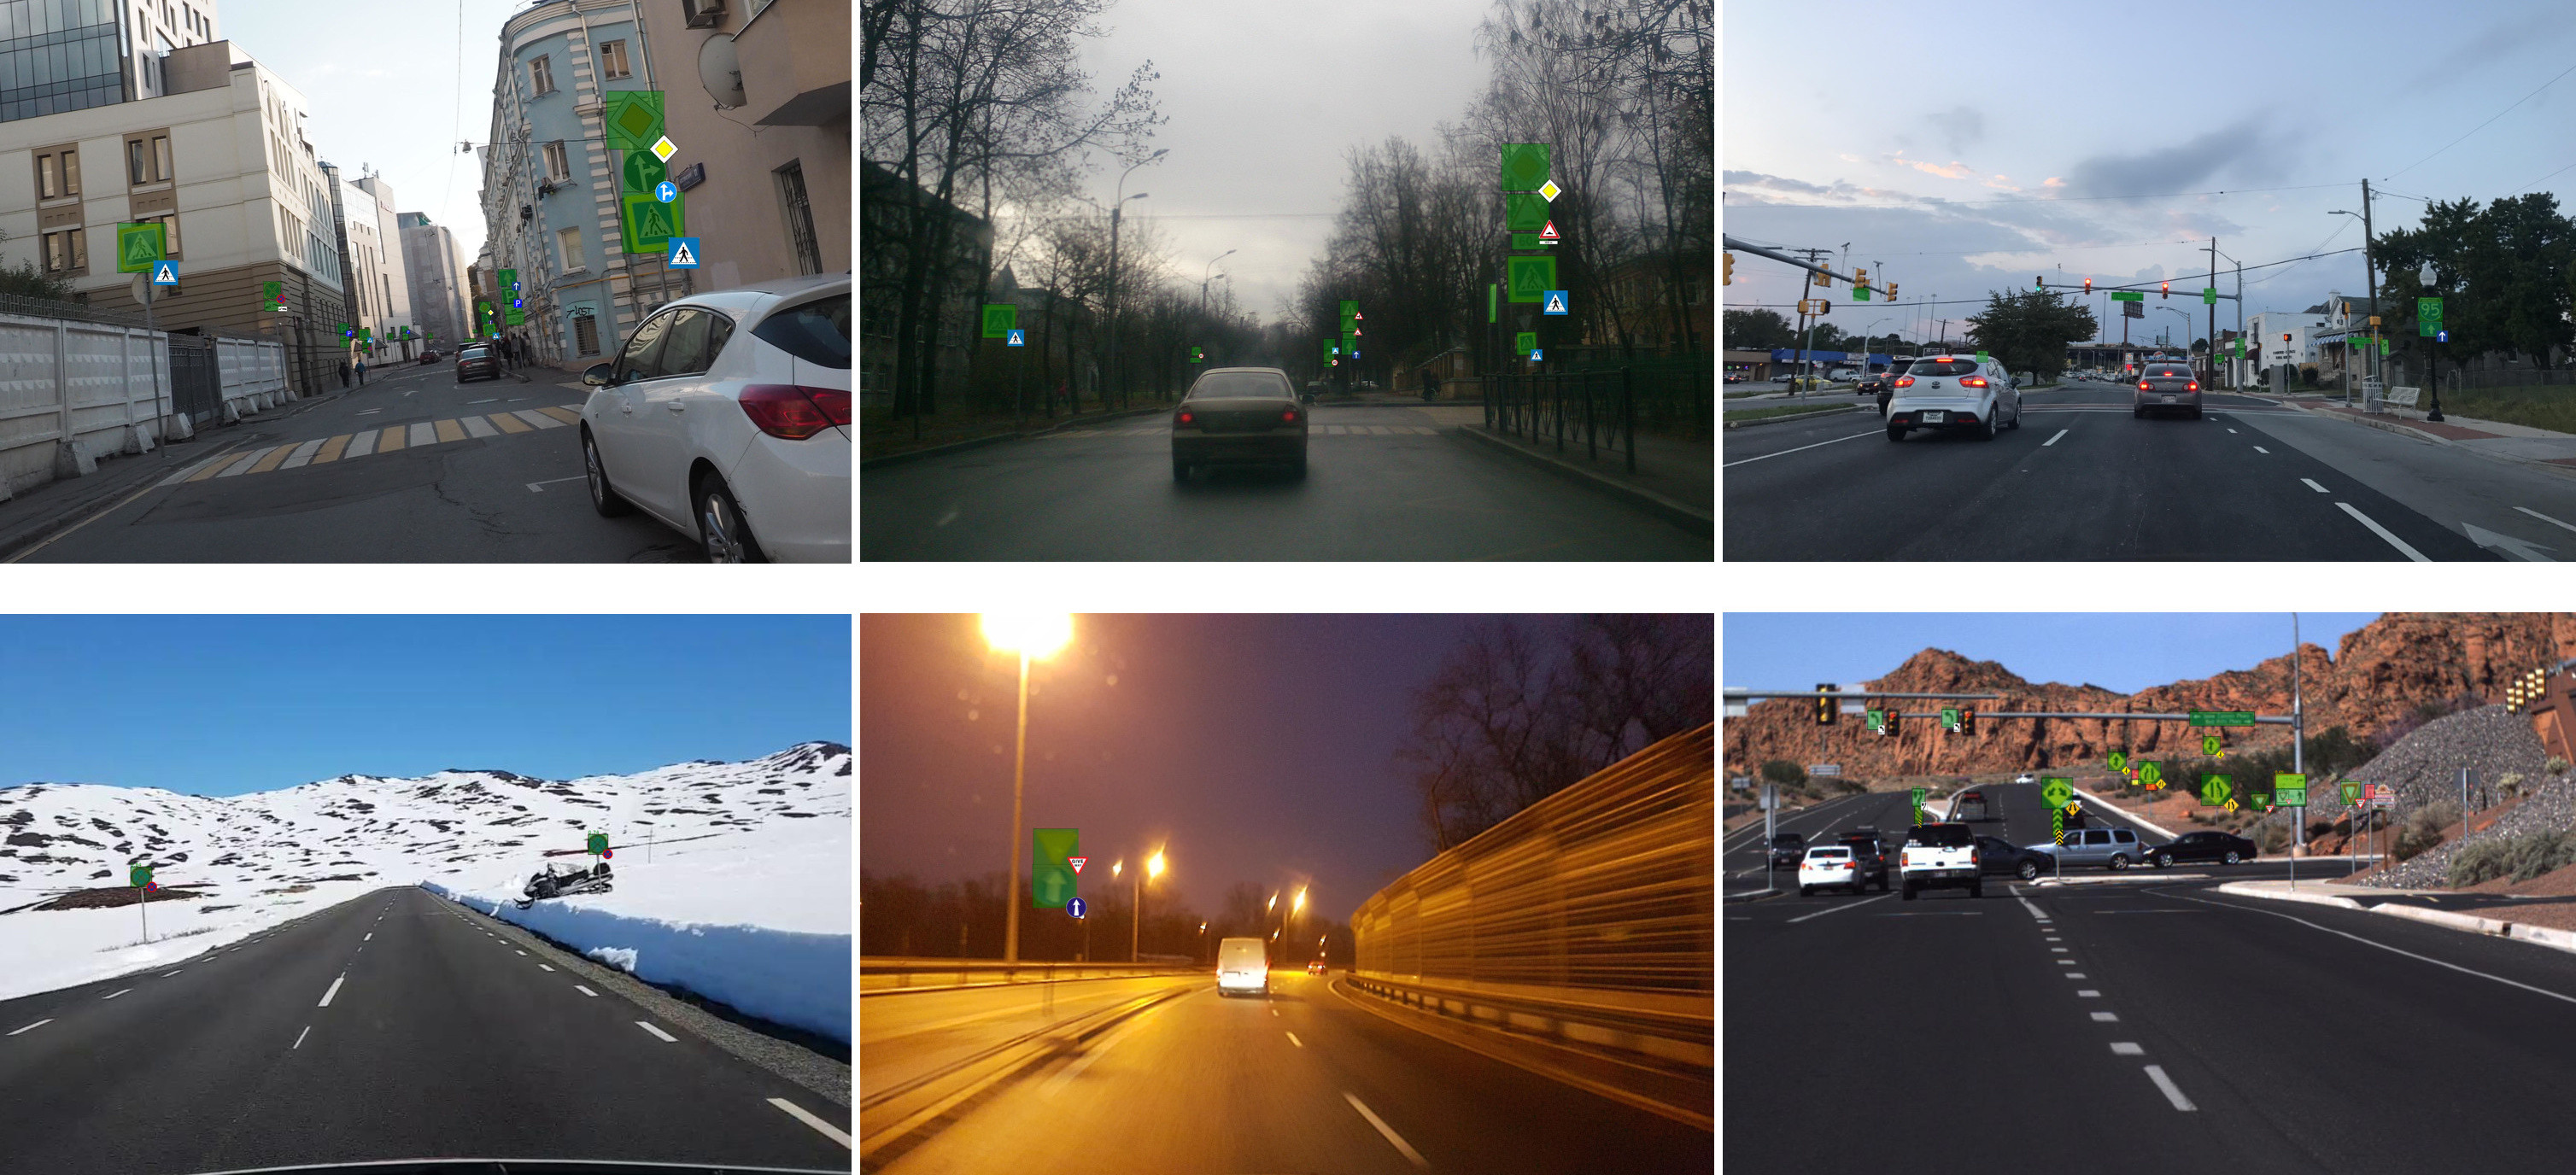
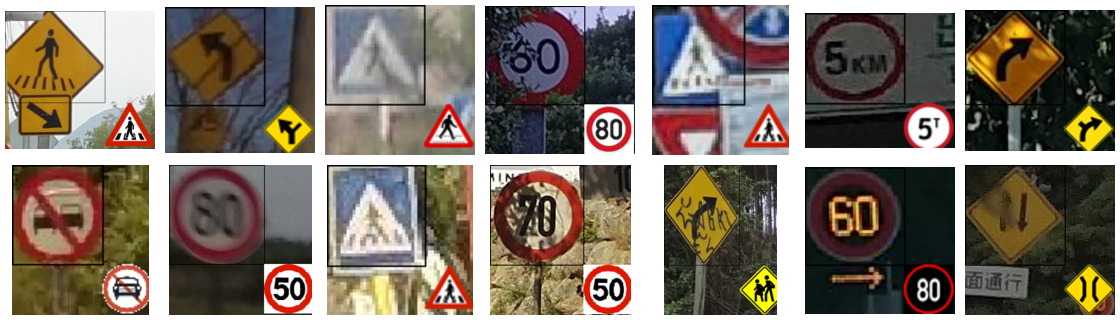
We show the results of our baseline in Table 4. Our classifier in combination with ResNet101 binary detector reaches over all classes; the ResNet50 variant is only about points lower. Figure 8 shows visual examples of our baseline’s predictions and Figure 10 shows typical failure cases of the classification network.
To verify our baseline, we train with the same setup on TT100K and compare the results with the baseline in [36]555We convert their results to the format used by MTSD and evaluate using our metrics.. Our two-stage approach outperforms their baseline by points, even though the performances of the binary detectors are similar (see Footnote 1). This validates that the decoupled classifier (even with a very shallow network) is able to yield good results. Moreover, the accuracy is improved further after pre-training the classifier (and the detector) on MTSD before fine-tuning it on TT100K, which further validate the generalization effectiveness of the MTSD.
6 Conclusion
In this work, we have introduced MTSD, a large-scale traffic sign benchmark dataset that includes images with full and partial bounding-box annotations, covering traffic sign classes from all over the world. MTSD is the most diverse traffic sign benchmark dataset in terms of geographical locations, scene characteristics, and traffic sign classes. We have shown in baseline experiments that decoupling detection and fine-grained classification yields superior results on previous traffic sign datasets. Additionally, in transfer-learning experiments, we show that MTSD facilitates fine-tuning and improves accuracy substantially for traffic sign datasets in a narrow domain.
We see MTSD as the first step to drive the research efforts towards solving fine-grained traffic sign detection and classification at a global scale. With the partial annotated dataset, we would also like to pave the way for further research in semi-supervised learning. In the future, we would like to extend the dataset towards a complete traffic sign taxonomy globally. To achieve this, we see the potential of applying zero-shot learning to efficiently model the semantic and appearance attributes of traffic sign classes. With the global taxonomy built, we can optimize the performance further with hierarchical classification [22, 34].
References
- [1] Wikimedia commons. https://commons.wikimedia.org. Accessed: 2019-03-13.
- [2] B. Cheng, Y. Wei, H. Shi, R. Feris, J. Xiong, and T. Huang. Revisiting rcnn: On awakening the classification power of faster rcnn. In Proceedings of the European Conference on Computer Vision (ECCV), pages 453–468, 2018.
- [3] J. Dai, Y. Li, K. He, and J. Sun. R-fcn: Object detection via region-based fully convolutional networks. In Advances in neural information processing systems, pages 379–387, 2016.
- [4] M. Everingham, S. A. Eslami, L. Van Gool, C. K. Williams, J. Winn, and A. Zisserman. The pascal visual object classes challenge: A retrospective. International journal of computer vision, 111(1):98–136, 2015.
- [5] R. Girshick. Fast r-cnn. In Proceedings of the IEEE international conference on computer vision, pages 1440–1448, 2015.
- [6] R. Girshick, J. Donahue, T. Darrell, and J. Malik. Rich feature hierarchies for accurate object detection and semantic segmentation. In Proceedings of the IEEE conference on computer vision and pattern recognition, pages 580–587, 2014.
- [7] R. Hartley and A. Zisserman. Multiple View Geometry in Computer Vision. Cambridge university press, 2003.
- [8] K. He, X. Zhang, S. Ren, and J. Sun. Deep residual learning for image recognition. In Proceedings of the IEEE conference on computer vision and pattern recognition, pages 770–778, 2016.
- [9] S. Houben, J. Stallkamp, J. Salmen, M. Schlipsing, and C. Igel. Detection of traffic signs in real-world images: The German Traffic Sign Detection Benchmark. In International Joint Conference on Neural Networks, number 1288, 2013.
- [10] A. Kuznetsova, H. Rom, N. Alldrin, J. Uijlings, I. Krasin, J. Pont-Tuset, S. Kamali, S. Popov, M. Malloci, T. Duerig, et al. The open images dataset v4: Unified image classification, object detection, and visual relationship detection at scale. arXiv preprint arXiv:1811.00982, 2018.
- [11] F. Larsson and M. Felsberg. Using fourier descriptors and spatial models for traffic sign recognition. In Scandinavian conference on image analysis, pages 238–249. Springer, 2011.
- [12] F. Larsson, M. Felsberg, and P.-E. Forssen. Correlating Fourier descriptors of local patches for road sign recognition. IET Computer Vision, 5(4):244–254, 2011.
- [13] J. Li, X. Liang, Y. Wei, T. Xu, J. Feng, and S. Yan. Perceptual generative adversarial networks for small object detection. In Proceedings of the IEEE Conference on Computer Vision and Pattern Recognition, pages 1222–1230, 2017.
- [14] Y. Li, Y. Chen, N. Wang, and Z. Zhang. Scale-aware trident networks for object detection. arXiv preprint arXiv:1901.01892, 2019.
- [15] T.-Y. Lin, P. Dollár, R. Girshick, K. He, B. Hariharan, and S. Belongie. Feature pyramid networks for object detection. In Proceedings of the IEEE Conference on Computer Vision and Pattern Recognition, pages 2117–2125, 2017.
- [16] T.-Y. Lin, P. Goyal, R. Girshick, K. He, and P. Dollár. Focal loss for dense object detection. In Proceedings of the IEEE international conference on computer vision, pages 2980–2988, 2017.
- [17] T.-Y. Lin, M. Maire, S. Belongie, J. Hays, P. Perona, D. Ramanan, P. Dollár, and C. L. Zitnick. Microsoft coco: Common objects in context. In European conference on computer vision, pages 740–755. Springer, 2014.
- [18] W. Liu, D. Anguelov, D. Erhan, C. Szegedy, S. Reed, C.-Y. Fu, and A. C. Berg. Ssd: Single shot multibox detector. In European conference on computer vision, pages 21–37. Springer, 2016.
- [19] M. Mathias, R. Timofte, R. Benenson, and L. Van Gool. Traffic sign recognition—how far are we from the solution? In The 2013 international joint conference on Neural networks (IJCNN), pages 1–8. IEEE, 2013.
- [20] A. Mogelmose, M. M. Trivedi, and T. B. Moeslund. Vision-based traffic sign detection and analysis for intelligent driver assistance systems: Perspectives and survey. IEEE Transactions on Intelligent Transportation Systems, 13(4):1484–1497, 2012.
- [21] G. Neuhold, T. Ollmann, S. Rota Bulo, and P. Kontschieder. The mapillary vistas dataset for semantic understanding of street scenes. In Proceedings of the IEEE International Conference on Computer Vision, pages 4990–4999, 2017.
- [22] J. Redmon and A. Farhadi. Yolo9000: better, faster, stronger. In Proceedings of the IEEE conference on computer vision and pattern recognition, pages 7263–7271, 2017.
- [23] S. Ren, K. He, R. Girshick, and J. Sun. Faster r-cnn: Towards real-time object detection with region proposal networks. In Advances in neural information processing systems, pages 91–99, 2015.
- [24] P. Sermanet and Y. LeCun. Traffic sign recognition with multi-scale convolutional networks. In IJCNN, pages 2809–2813, 2011.
- [25] V. Shakhuro and A. Konushin. Russian traffic sign images dataset. Computer Optics, 40(2):294–300, 2016.
- [26] V. I. Shakhuro and A. Konouchine. Russian traffic sign images dataset. Computer Optics, 40(2):294–300, 2016.
- [27] B. Singh and L. S. Davis. An analysis of scale invariance in object detection snip. In Proceedings of the IEEE Conference on Computer Vision and Pattern Recognition, pages 3578–3587, 2018.
- [28] B. Singh, M. Najibi, and L. S. Davis. Sniper: Efficient multi-scale training. In Advances in Neural Information Processing Systems, pages 9333–9343, 2018.
- [29] J. Stallkamp, M. Schlipsing, J. Salmen, and C. Igel. The german traffic sign recognition benchmark: A multi-class classification competition. In IJCNN, volume 6, page 7, 2011.
- [30] J. Stallkamp, M. Schlipsing, J. Salmen, and C. Igel. Man vs. computer: Benchmarking machine learning algorithms for traffic sign recognition. Neural Networks, (0):–, 2012.
- [31] R. Timofte, K. Zimmermann, and L. Van Gool. Multi-view traffic sign detection, recognition, and 3d localisation. Machine vision and applications, 25(3):633–647, 2014.
- [32] P. Viola, M. Jones, et al. Rapid object detection using a boosted cascade of simple features. CVPR (1), 1:511–518, 2001.
- [33] C. Wah, S. Branson, P. Welinder, P. Perona, and S. Belongie. The caltech-ucsd birds-200-2011 dataset. 2011.
- [34] Z. Yan, H. Zhang, R. Piramuthu, V. Jagadeesh, D. DeCoste, W. Di, and Y. Yu. Hd-cnn: hierarchical deep convolutional neural networks for large scale visual recognition. In Proceedings of the IEEE international conference on computer vision, pages 2740–2748, 2015.
- [35] F. Yu, W. Xian, Y. Chen, F. Liu, M. Liao, V. Madhavan, and T. Darrell. Bdd100k: A diverse driving video database with scalable annotation tooling. arXiv preprint arXiv:1805.04687, 2018.
- [36] Z. Zhu, D. Liang, S. Zhang, X. Huang, B. Li, and S. Hu. Traffic-sign detection and classification in the wild. In Proceedings of the IEEE Conference on Computer Vision and Pattern Recognition, pages 2110–2118, 2016.