A spectroscopic census of the Fornax cluster and beyond: preparing for next generation surveys
Abstract
The Fornax cluster is the nearest, large cluster in the southern sky, and is currently experiencing active assembly of mass. It is thus the target of a number of ongoing observing campaigns at optical, near-infrared and radio wavelengths, using state-of-the-art facilities in the Southern hemisphere. Spectroscopic redshifts are essential not only for determining cluster membership, but also kinematics within the cluster and identifying substructures. We present a compilation of all available major spectroscopic campaigns undertaken within the Fornax region, including new and previously unpublished spectroscopy. This provides not only a comprehensive census of Fornax cluster membership as a resource for the many ongoing studies of this dynamic system, but also probes the large scale structure in the background volume.
keywords:
surveys–catalogues–galaxies:general–galaxies:distances and redshifts–galaxies:clusters:general1 Introduction
The observable properties of galaxies are known to be strongly dependent on their local and large-scale environment (e.g. Dressler 1980; Binggeli, Tarenghi, & Sandage 1990; Peng et al. 2010). Clusters, as the densest environment, thus provide an excellent laboratory for investigating environmental effects felt by galaxies, where we are able to witness the transformational processes such as interactions and mergers, and stripping of the gaseous component of galaxies.
The Fornax cluster, located at a distance of 20.0 megaparsecs (Mpc; Blakeslee et al. 2009), is the second most massive cluster within 20 Mpc, and is the largest nearby cluster in the Southern hemisphere. It is dominated by an overdensity centred on the brightest cluster galaxy (BCG) NGC 1399, and has a lower-density substructure surrounding the radio galaxy NGC 1316 (hereinafter referred to as Fornax A) located to the south-west. It’s relative proximity means galaxy interactions, and processes of accretion/removal of gas onto/from galaxies can be studied in great detail, with observations extending back at least 60 years (e.g. Hodge 1959). Despite the long history of studies targeting the general galaxy population, along with specific sub-populations, there is renewed interest in the Fornax cluster, coinciding with the availability of new observing facilities in the south.
The Fornax cluster has recently been at the centre of several major observing programmes over a wide range of wavelengths. This includes deep optical imaging (Iodice et al. 2016; Venhola et al. 2018; Eigenthaler et al. 2018), optical integral field unit (IFU) observations of selected targets (Scott et al. 2014; Mentz et al. 2016; Sarzi et al. 2018), ALMA observations (Zabel et al. 2019; Morokuma-Matsui et al. 2019), far-infrared Herschel imaging (Davies et al. 2013) and, at radio wavelengths, a survey carried out with the Australia Telescope Compact Array (ATCA; Lee-Waddell et al. 2018).
The reason for this ongoing interest is the Fornax cluster’s role in our understanding of galaxy evolution in dense environments. Fornax is very different from other nearby clusters. Compared to the well-known Virgo and Coma clusters, Fornax is about one and two orders of magnitude smaller, respectively, in total halo mass (Drinkwater, Gregg, & Colless 2001b for Fornax; Łokas & Mamon 2003 for Virgo), meaning the density of the intra-cluster medium (ICM; Paolillo et al. 2002 for Fornax; Fabricant, Lecar, & Gorenstein 1980 for Virgo) and the velocity dispersion of its galaxy population are lower. Therefore, ram pressure stripping (a prime candidate for the removal of gas from galaxies and for the quenching of star formation in dense environments), which scales as the ICM density times the relative velocity squared, should be significantly weaker in Fornax than in Coma and Virgo (i.e. an order of magnitude lower compared to that in Virgo, see, for example Venhola et al. 2019). Fornax also has a higher galaxy number density in its centre. Coupled with the lower velocity dispersion, this creates an ideal environment for tidal interactions to be effective.
The Fornax cluster is thus an environment in which the balance between hydrodynamical and tidal effects is quite different compared to other, better-studied clusters. It is therefore an important system for extending the baseline of cluster properties over which we have a detailed view of galaxy transformation in action. And it is indeed in action, since Fornax continues to grow by accreting new galaxies and galaxy groups (Drinkwater, Gregg, & Colless, 2001b). The best example of accretion is the relatively gas-rich group centred on Fornax A, currently at the edge of the cluster but moving towards it, possibly along a large scale filament of the cosmic web (Scharf, Zurek, & Bureau 2005; Venhola et al. 2019).
Hindering any study of galaxy clusters is the availability of spectroscopic redshifts, fundamental for not only confirming cluster membership, but also deriving kinematics within the cluster. A number of authors have performed observations within the Fornax cluster region targeting particular sub-populations of objects, or specific spatial regions, resulting in a large number of, albeit heterogeneously selected, spectroscopic redshifts (listed and described in Section 2). Taken individually, no one survey gives complete coverage of the cluster, but when combined, the projects result in a comprehensive census of the Fornax cluster galaxy population, the foreground Galactic stars, as well as the background galaxies in the volume behind the cluster.
The new surveys currently underway provide motivation to compile the spectroscopy into one useful resource. Here we describe some of the recent large programmes either already underway or about to begin, which will directly benefit from such a compilation.
1.1 The Fornax Deep Survey
The Fornax Deep Survey (FDS; Iodice et al. 2016; Venhola et al. 2018) is one of the new imaging surveys exploring the Fornax cluster. Using the VLT Survey Telescope (VST) at the Paranal observatory of the European Southern Observatory (ESO), the FDS is part of Guaranteed Time Observation surveys FOCUS (PI R Peletier) and VEGAS (PI E Iodice). The 2.6-m wide-field VST, coupled with the 1 square degree field of view OmegaCam (Kuijken, 2011) provides imaging in the Sloan Digital Sky Survey (SDSS) and bands, with a pixel scale of 0.21 arcsec pix-2.
The imaging survey was completed at the end of 2017, and resulted in images with surface brightness sensitivity extending to 27–28 mag arcsec-2 in the four optical bands. The area covered spans 26 deg2, centred on NGC 1399, and extending to include Fornax A. The key goals of the FDS include investigating the ultra-diffuse galaxies (UDGs; Venhola et al. 2017) and the dwarf galaxy population of the cluster (e.g. Venhola et al. 2018), a census of the globular cluster population (D’Abrusco et al. 2016; Cantiello et al. 2018), the low surface brightness outskirts of galaxies (e.g. Iodice et al. 2019), along with the intra-cluster light, to understand the formation history of galaxies within the cluster environment.
1.2 The MeerKAT Fornax Survey
The relatively low cluster cluster mass, resulting in low velocity dispersion, along with the high density of galaxies, means the Fornax cluster is an interesting laboratory within which to observe the behaviour of the neutral hydrogen (H i) component of galaxies, which is a key tracer of processes that drive the evolution of galaxies in dense environments.
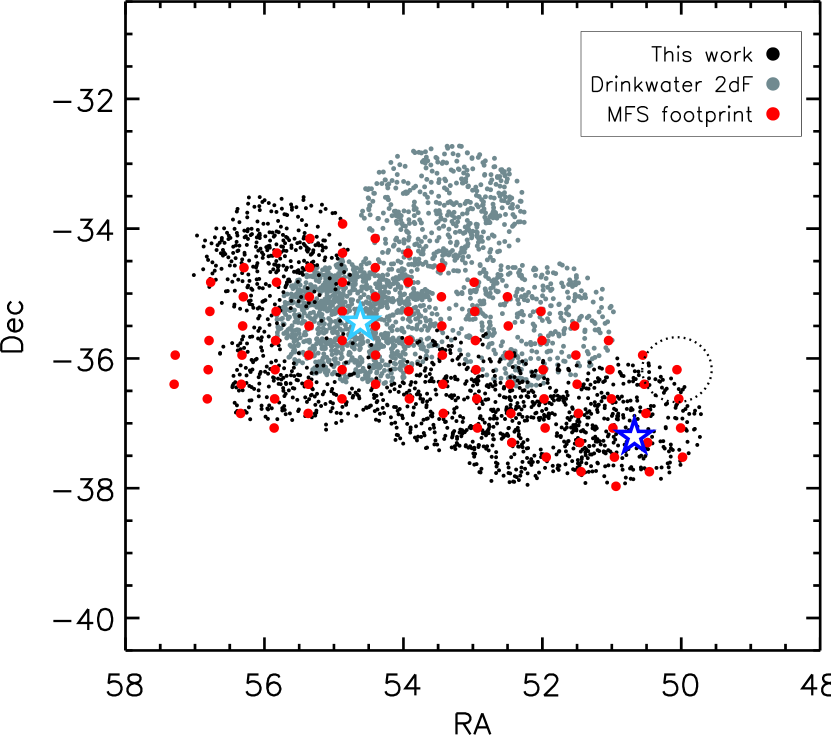
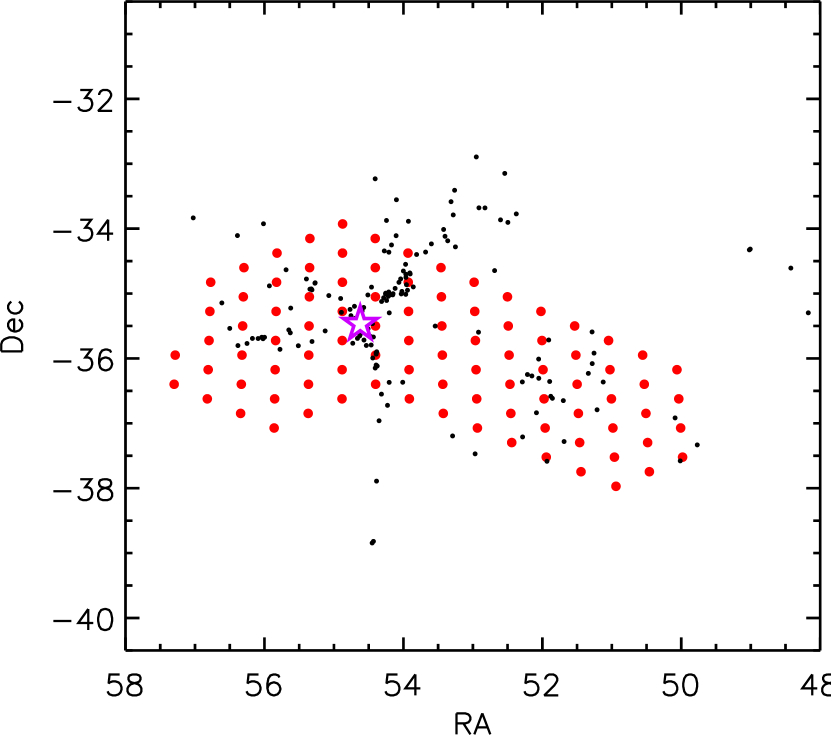
The MeerKAT Fornax Survey (MFS; Serra et al. 2016) will utilise the newly-commissioned MeerKAT radio telescope (Jonas & MeerKAT Team, 2016) to observe H i and radio synchrotron emission of galaxies and of the intra-cluster medium in the Fornax cluster. Observations spanning 12 deg2 will cover the central NGC 1399 region, extending towards the Fornax A subgroup, as seen in Fig. 1. The supreme sensitivity of MeerKAT will enable the low column density H i extending beyond the stellar disks to be probed, including streams of H i removed from galaxies via ram-pressure stripping. With a predicted H i mass detection limit of , low-mass dwarf galaxies along with H i -poor galaxies will all be detected. The relative proximity of the cluster results in 1 kiloparsec (kpc) spatial resolution, with down to 1 km s-1 spectral resolution. The MFS, coupled with the FDS imaging, will thus be an ideal set of observations for understanding the transformational processes underway within dense environments.
1.3 MIGHTEE-H i
Due to the large bandwidth of the MeerKAT L-band receiver, the H i spectral line is observable over the redshift range . The Fornax cluster occupies a very small slice of this volume. In order to maximise the scientific return from the MFS observations, the volume behind the Fornax cluster will be analysed as part of another MeerKAT large survey, the MeerKAT International Giga-Hertz Tiered Extragalactic Exploration (MIGHTEE; Jarvis et al. 2016). MIGHTEE is a commensal radio continuum and spectral line survey, with the working group responsible for the H i emission data designated as MIGHTEE-H i, and an additional working group focusing on H i in absorption.
The depth of the Fornax observations is well-matched to
the MIGHTEE observations, which results in predicted sensitivity
to direct detections of the H i line to (see Figure 2
from Maddox, Jarvis, &
Oosterloo 2016). Having a spectroscopic census of the
volume behind the Fornax cluster is of great use for the MIGHTEE H i emission and absorption science, particularly at the higher redshift
end of the volume, where statistical techniques such as stacking will be used.
Here, we present new spectroscopic observations which substantially
add to the coverage of the FDS and MFS area, focusing on the
extragalactic population. We then include these new spectra in a
compilation of 12 separate spectroscopic surveys of the
Fornax cluster region, including both published and unpublished
data. This compilation is not only the most comprehensive census
of Fornax cluster objects, but also includes redshifts for several
thousands of objects behind the Fornax volume, providing essential
data for the MIGHTEE survey.
The structure of the paper is as follows: in Section 2 we detail each of the works, both published and unpublished, that contribute to our final spectroscopic catalogue. Section 3 investigates the velocity structure of the Fornax cluster, and the various structures found in the background volume. A discussion and summary are given in Section 4. Concordance cosmology with km s-1 Mpc-1 (thus /[100 km s-1 Mpc-1]), , is assumed, and AB magnitudes are used throughout unless otherwise stated.
2 Input Spectroscopy
The aim of the current work is to collect all available redshifts within the Fornax cluster sky area, in order to determine cluster membership as well as background volume large scale structure. This will serve as a useful resource not only for studies targeting the cluster itself, but also work focused on the volume behind the cluster. A major contribution to the compilation comes from newly acquired spectroscopy, which provides nearly one quarter of the redshifts of extragalactic objects in the catalogue.
We have searched the literature for spectroscopic campaigns either specifically targeting the Fornax cluster region, or large-area surveys that include the Fornax cluster. A short description of each source of spectroscopy is given below, along with the relevant references for further, more detailed information. Observations targeting single objects within the cluster, such as the Fornax 3D project (Sarzi et al. 2018) are not included, as they do not contribute to the redshift census.
Many of the spectroscopic campaigns collated here focused on the compact stellar system (CSS) populations within the cluster, primarily associated with the BCG NGC 1399. Therefore, there is a large number of spectroscopically confirmed CSS objects. As noted in several of the following works, there is some ambiguity regarding the nomenclature for the various CSS populations found within the Fornax cluster. The populations within the CSS umbrella term include globular clusters (GCs) bound to a host galaxy, GCs not bound to a host galaxy, dwarf ellipticals (dEs) and ultra-compact dwarf galaxies (UCDs). While UCDs tend to be more massive, larger and brighter than GCs, deep observations show they overlap in luminosity but not dynamically (Gregg et al., 2009). The characteristics of the photometry may affect the morphological classification, with the input imaging ranging from digitised sky plates through new survey telescopes. Therefore, we use the nomenclature native to each survey without further comment. While GCs might not be considered galaxies unto themselves, we include compilations of CSS, including GCs, for completeness.
This work
While most observing campaigns in this area of the sky understandably focus on cluster objects, the MIGHTEE-H i survey is specifically surveying the volume behind Fornax. Therefore, a census of background galaxies to moderate redshifts is one of the aims of these observations. The observations with the most comprehensive coverage of the Fornax background volume is from Drinkwater et al. (2000a), which covers 9 square degrees. We designed our observations to be complementary to these, both in coverage and in depth. The footprints of the two surveys are shown in Fig. 1.
The input photometry is derived from the FDS (Iodice et al. 2016), with catalogues of resolved objects provided by Venhola et al. (2018). We impose a magnitude limit of to be generally consistent with the observations with the same instrument by Drinkwater et al. (2000a). Employing the catalogue of extended objects means there were very few Galactic stars in our input catalogue.
We obtained three nights of observations in mixed conditions with the AAOmega multi-object spectrograph (Saunders et al., 2004) and the Two-degree Field (2dF; Lewis et al. 2002) fibre positioner on the 3.9-m Anglo-Australian Telescope (AAT) 24-26 October 2017. We employed the 580V and 385R gratings in the blue and red arms, respectively, with central dispersion 1.03Å pix-1 and 1.56Å pix-1, which results in velocity resolution of 220 km s-1. The AAOmega spectrograph provides continuous wavelength coverage from 3800–8800Å. Five 2dF fields were observed, covering the MFS footprint while avoiding overlap with the existing observations. The spectra were reduced using 2dfdr111The 2dfdr software is available from https://www.aao.gov.au/science/software/2dfdr (Croom, Saunders, & Heald 2004; AAO Software Team 2015) and classified with the Manual and Automatic Redshifting Software MARZ (Hinton et al. 2016). After visually inspecting the output of MARZ, and altering the classification when necessary, we successfully obtained redshifts for 1553 objects, 1549 of which are extragalactic, and 44 belong within the Fornax volume.
Drinkwater 2dF
The Fornax Cluster Spectroscopic Survey (FCSS; Drinkwater et al. 2000a), was also undertaken with the 2dF instrument on the AAT, before the upgrade to the AAOmega spectrograph. Targets were selected over from the UK Schmidt Telescope Sky Survey plates, which have been digitised by the Automatic Plate Measuring facility (APM) in Cambridge. Crucially, no morphological selection was imposed on the input sample, which resulted in the formalisation of a population of ultra-compact dwarf galaxies (UCDs) within the Fornax cluster (Drinkwater et al. 2000b).
Four fields were planned within the FCSS, however only three were observed, starting in 1997 and spanning multiple observing seasons. The spectral coverage was 3600-8010Å, with dispersion 4.3Å per pixel. We obtained the catalogue of objects for which a secure redshift was determined from the authors (Drinkwater, private communication). The catalogue contains both published and unpublished redshifts. The lack of morphological selection results in a sample of objects dominated by Galactic stars, with 4102 of 12071 objects confirmed to be extragalactic, and 119 of these within the Fornax volume. The location of the three Drinkwater 2dF fields are also shown in Fig. 1.
Firth 2dF
Firth, Drinkwater, & Karick (2008) targeted not only the core of the Fornax cluster, centred on NGC 1399, but also the area around the neighbouring overdensity at Fornax A, with the 2dF/AAOmega spectrograph on the AAT in an observing campaign in December 2006. Targets were selected from APM-measured and -band photometry, choosing point sources with , based on the colours of previously identified compact galaxies within the Fornax cluster. The magnitude limits for the area around Fornax A was , and for the field centred on NGC 1399. The spectral coverage of the dual-beam AAOmega spectrograph was 3800–8900Å.
While the results from these observations have been published in Firth, Drinkwater, & Karick (2008), the catalogue derived from the observations was not. Therefore, we extracted the five nights of observations from the AAT archive hosted by data central222datacentral.org.au. The data were reduced using 2dfdr, in the same way as the spectra from this work, and visually classified using MARZ.
For a number of observations, calibration files for one of the two spectrograph arms were missing, so those observations were not reduced or classified. No attempt to co-add multiple exposures of the same target to increase the signal-to-noise ratio was made. As for the Drinkwater 2dF observations, the selection of targets resulted in a population of objects dominated by Galactic stars. Of 1906 objects with secure redshifts, 352 are extragalactic, with 24 Fornax cluster members.
Gregg 2dF
Gregg et al. (2009) also employed the 2dF spectrograph on the AAT, in search of faint UCDs within the Fornax cluster centred on NGC 1399. Targets were selected from the APM Catalogue and plates, choosing unresolved objects with , over , extending to fainter magnitudes than the previously known population.
Observations carried out in Oct 2003 and Nov 2004 resulted in 60 UCDs in the region of NGC 1399 (54 new discoveries), as well as 53 additional cluster members. The faint magnitude limit of the observations result in UCDs overlapping in luminosity with NGC 1399 GCs, however the UCDs remain dynamically separate (Gregg et al., 2009). Around half of the population is located in the intra-cluster volume, rather than associated with a host galaxy, as GCs generally are. We add the 113 objects to our compilation.
Drinkwater FLAIR-II
A spectroscopic campaign with the now-decommissioned FLAIR-II multi-object spectrograph on the UK Schmidt Telescope at the Siding Spring Observatory in Australia was undertaken over 1992–1997 by Drinkwater et al. (2001a). Restricted to , these observations are shallower, but cover a larger area than that probed by the FCSS observations.
Objects are again selected from the APM measurements of the survey plates, to be compact, but not stellar. Selection was based in part on photometric classifications from the Fornax Cluster Catalog (FCC, Ferguson 1989). For observations through 1996, the spectral coverage was 3670-7230Å, with 13Å resolution, and 5150-6680Å, 5.3Å resolution for observations in 1997. We extract the 108 confirmed Fornax cluster galaxies and 408 background galaxies from this work.
Firth FLAMES
Employing input imaging from the Cerro-Tololo Inter-American Observatory (CTIO) Mosaic Imager with the 4-m Blanco Telescope in the area around NGC 1399 (Karick, Gregg, Drinkwater, Hilker & Firth 2006); Firth et al. (2007) selected point sources for observation with the Very Large Telescope Fibre Large Array Multi Element Spectrograph (VLT-FLAMES; Pasquini et al. 2002). The point sources were selected to be faint, extending to , or , and and where , , and are calibrated to the SDSS photometric system. Only point sources were selected as the aim of the observations was to confirm CSS objects.
Of 468 targets observed in November 2004, 98 Galactic stars and 57 Fornax objects were confirmed. The good resolution of the spectra, with R6000, resulted in recession velocity uncertainties of km s-1. The order of preference for consolidating the redshifts from their Table 2 is VLTBergondFCOS2df. In addition, 28 prominent galaxies near NGC 1399 with redshifts from the literature are assembled. Based on brightness and proximity to NGC 1399, the objects are separated into four categories, including dwarf ellipticals, known cluster CSS, new cluster CSS, and other prominent galaxies, primarily early type galaxies.
2MRS
As the Fornax cluster is at low redshift, a number of the cluster galaxies are bright and extended on the sky. Thus a number of cluster members were observed within the Two Micron All Sky Survey (2MASS; Skrutskie et al. 2006) Redshift Survey (2MRS; Huchra et al. 2012). Input photometry was supplied by the all-sky near-infrared imaging from the 2MASS extended source catalogue (XSC; Jarrett et al. 2000. Spectrographs on multiple telescopes were employed, with spectral coverage ranging from 3500–3700Å at the blue end and 6400–7400Å at the red end, sufficient to detect multiple spectral features of the primarily low-redshift galaxies. New observations were supplemented by existing spectroscopy from the literature.
Galaxies with RA degrees and Dec degrees were extracted from both the main redshift catalogue, with , and the additional catalogue which extends to fainter magnitudes. 79 and 371 galaxies lie within the Fornax volume and background volume, respectively.
Hilker 1999
While the primary driver of the combined photometric and spectroscopic campaign undertaken by Hilker et al. (1999a) (photometry) and Hilker et al. (1999b) (spectroscopy) was to find dwarf galaxies near the Fornax giant elliptical galaxies, the volume behind the Fornax cluster was explored as well.
Using the 2.5-m du Pont telescope at the Las Campanas Observatory, images in Johnson and Cousins were obtained around several Fornax spheroids, with a four-field mosaic centred on NGC 1399 (Hilker et al. 1999a). 125 targets to were selected for spectroscopic follow-up with the multi-fibre spectrograph on the du Pont telescope. Observations in December 1996 of 112 galaxies resulted in confirmation of 7 Fornax members and 73 background galaxies. Among the Fornax members were the first two UCD objects, however they were not formally given this designation until Drinkwater et al. (2000b). These spectra confirmed the existence of a background galaxy cluster at , also clearly seen in our compilation of spectra. Note that we use the ‘adopted’ velocity from their Table 2.
Ferguson 1989
Ferguson (1989) undertook a seminal investigation of the Fornax cluster. Image plates from the du Pont 2.5-m telescope, supplemented with blue plates from the ESO UK Science Research Council (SRC) survey taken on the UK Schmidt Telescope provide the photometry over a region.
Cluster members were identified by visual inspection, considering their surface brightness, luminosity and morphology. This classification resulted in a catalogue of 340 likely cluster members, and 2338 background galaxies. The ‘FCC’ designation still employed by a number of authors to refer to specific galaxies originated within this work.
Of the 340 galaxies presumed to belong to the Fornax cluster within the original FCC catalogue, spectroscopy was compiled by Ferguson (1989) from various sources for 68 objects, confirming their cluster membership. Only these 68 objects are included in our compilation. The B1950 coordinates of the 68 objects have been converted to the J2000 epoch within the catalogue.
Bergond 2007
Rather than focusing on a specific host galaxy, Bergond et al. (2007) investigated the GC population between galaxies to better probe the cluster dynamics.
Deep imaging of a strip centred on NGC 1399 with the WFI camera on the ESO/MPG 2.2-m telescope provided the input imaging from which point sources with were selected as candidate targets. Spectroscopy of more than 500 candidates was obtained with the multi-object spectrograph FLAMES on the VLT. 149 GCs and 27 dwarf galaxies within the Fornax cluster were confirmed, with 61 within the intra-cluster medium.
Mieske 2004
The Fornax Compact Object Survey (FCOS) undertaken by Mieske, Hilker, & Infante (2002) and Mieske, Hilker, & Infante (2004) looked to further understand the UCD galaxies within the Fornax cluster. Unresolved targets to were selected from imaging from the du Pont 2.5-m telescope and the CTIO 4-m telescope. Follow-up spectroscopy with the multi-slit mask Wide Field CCD on the du Pont telescope in two campaigns, 30 Dec 2000 – 1 Jan 2001, and 4–6 Dec 2002. The first employed a medium resolution grism with spectral coverage 3500–6300Å, giving 3Å resolution, while the second used a lower resolution grism with wider spectral coverage, 3600–7800Å, for 6Å resolution.
Combining the published results from the two sets of observations results in 305 objects with confirmed velocities, including 65 Fornax galaxies, of which 10 are UCDs, and 62 in the background volume.
Schuberth 2010
A comprehensive census of the GC population in the wide vicinity of NGC 1399 has been undertaken by Schuberth et al. (2010). Candidates for spectroscopic followup were chosen from wide-field imaging from the CTIO MOSAIC camera on the 4-m Blanco telescope. Multi-object spectroscopy with the FORS2 instrument on the VLT (1–3 December 2002) and GMOS on Gemini South (November 2003 and December 2004) resulted in 477 new spectra. These spectra were combined with 559 earlier observations, velocities for which were re-computed to be consistent with the new observations.
We extract the online tables of Fornax objects and foreground Galactic stars, and based on our velocity limit of 600 km s-1 for the Fornax cluster instead of the author’s limit of 450 km s-1, we extract velocities with Class A (secure velocity) classifications for 182 foreground stars and 554 Fornax GCs. The spatial extent of the observations means that the GC population contains both objects physically associated with NGC 1399 and objects within the intra-cluster medium or associated with other massive host galaxies.
2.1 The final catalogue
Table 1 lists the sources of redshifts contributing to the compilation, and the number of redshifts contributed by each in the final catalogue.
| Source | Reference | Instrument | N(Spectra) |
|---|---|---|---|
| 1 | This work | AAOmega/2dF | 1553 |
| 2 | Drinkwater 2dF | 2dF | 12071 |
| 3 | Firth 2dF | AAOmega/2dF | 1608 |
| 4 | Gregg 2dF | VLT/FLAMES | 25 |
| 5 | Drinkwater FLAIR | FLAIR-II | 346 |
| 6 | Firth FLAMES | FLAMES | 46 |
| 7 | 2MRS | Multiple | 276 |
| 8 | Hilker 1999 | du Pont | 29 |
| 9 | Ferguson1989 | Multiple | 57 |
| 10 | Bergond 2007 | FLAMES | 138 |
| 11 | Mieske 2004 | du Pont | 102 |
| 12 | Schuberth 2010 | FORS2/GMOS | 605 |
| Total | 16856 |
Table 2 is the final list of 16856 objects with spectroscopic redshifts. Only objects with ‘secure’ redshifts, as determined by each work, were included. For our spectroscopy and those we reduced from Firth, Drinkwater, & Karick (2008), redshifts were considered secure if assigned a quality operator (QOP) value of 3 or 4, which indicates the redshift was derived either from a single, unambiguous spectral feature, or several identifiable spectral features. Other works have their own criteria for secure redshifts, and we follow their guidelines for usage. Each object is assigned a unique identifier. The four general populations of objects within the table are Galactic stars, Fornax galaxies, Fornax GCs, and background objects, including galaxies and quasars. In particular, we included Galactic stars in the table to enable the reader to choose the velocity limits of the Fornax cluster themselves.
Individual targets are often observed more than once. Duplicate observations within studies, and duplicate observations spanning multiple studies, have been removed from the catalogue. Duplicate observations within a study are removed either by their object ID (preferred) or by positional match, with a matching radius of 1″. A small matching radius is appropriate as the observations are derived from the same input imaging, so positional consistency between observations should be good.
A matching radius of 2″ is used to identify duplicate observations across multiple studies. This is a conservative radius, as for some of the larger, extended cluster members, the object centroid differs based on the input photometry used by several arcseconds. Therefore, we caution the reader that there may still be a few tens of objects in the catalogue with duplicate entries. In the case of duplicate observations, priority is given in the order listed in Table 1.
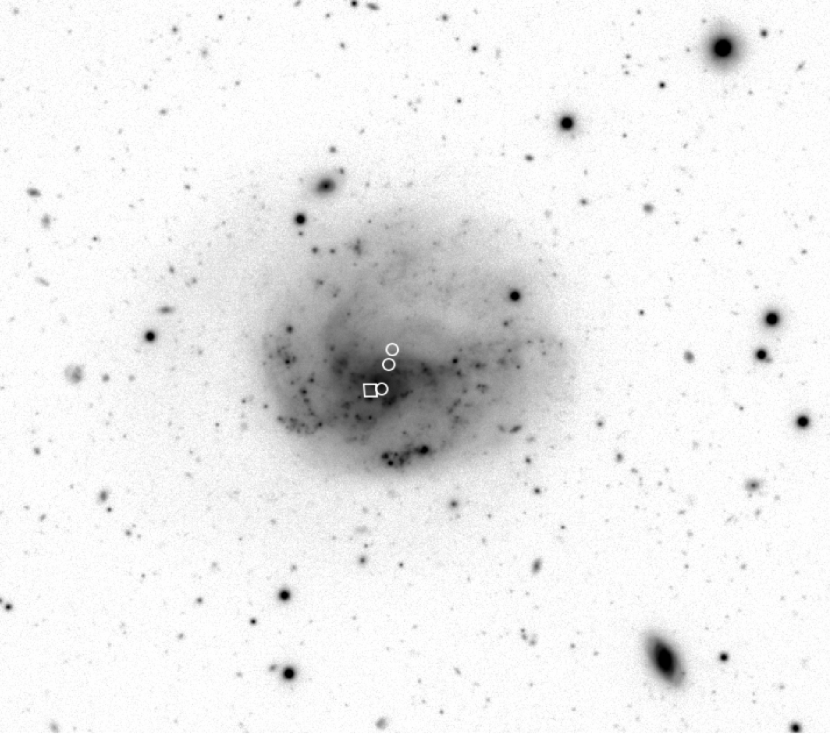
Fig. 2 illustrates one of these cases. There are three spectra for the same object (marked as white circles) in the spectroscopic catalogue, separated by more than the 2″ radius used to identify duplicate observations. The maximum separation distance between these spectra is 13.5″, and the three spectra have recession velocities 891, 891 and 895km s-1.
| ID | RA | Dec | Source | Type | ||
|---|---|---|---|---|---|---|
| J2000 | J2000 | km s-1 | km s-1 | |||
| F17029 | 53.7313 | -35.0666 | 230 | 60 | 12 | FGS |
| F17031 | 53.7402 | -35.0564 | 195 | 45 | 12 | FGS |
| F17033 | 53.7504 | -35.1570 | 651000 | 45000 | 12 | QSO |
| F17035 | 53.7628 | -35.3482 | 49220 | 105 | 12 | BGO |
| F17037 | 53.7637 | -35.0094 | 94500 | 175 | 12 | BGO |
| F17038 | 53.7661 | -35.2338 | 180 | 25 | 12 | FGS |
| F17042 | 53.7804 | -34.9703 | 130 | 25 | 12 | FGS |
| F17047 | 53.8263 | -34.9727 | 160 | 35 | 12 | FGS |
| F17051 | 53.8509 | -35.2808 | 135 | 25 | 12 | FGS |
| F17062 | 54.1800 | -35.7606 | 30821 | 84 | 12 | BGO |
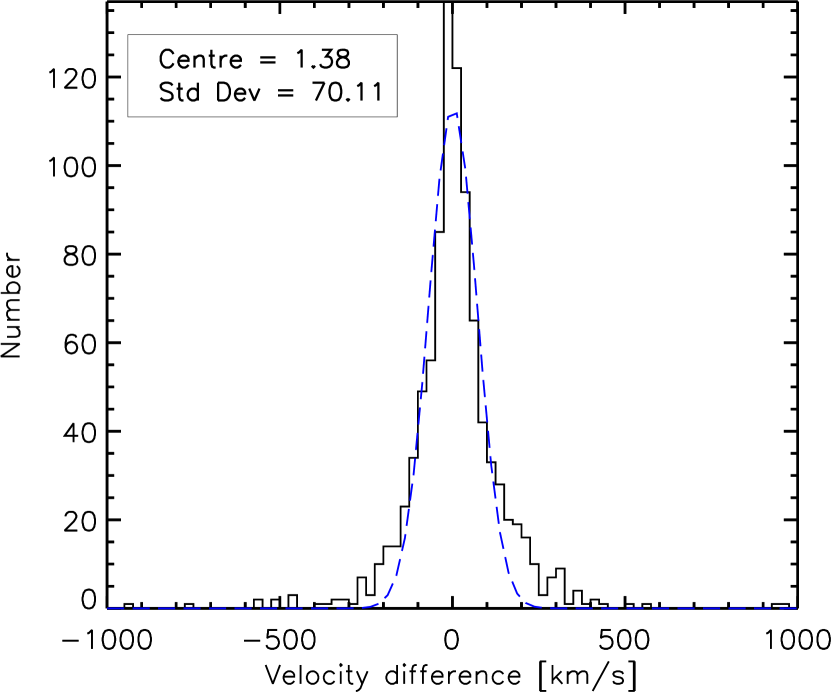
We can estimate the consistency of recession velocity determinations between the various surveys by extracting objects that were observed more than once. Selecting objects with secure measurements from more than one survey, we find very good agreement in their velocities, as shown in Fig. 3. The results do not change substantially if the duplicate measures are divided into three populations, i.e. Galactic stars, Fornax objects and background objects. The uncertainties are not large enough for objects to have their classification of foreground, Fornax or background to be in question. Only 14 objects within the full catalogue have discrepant redshifts , or km s-1. Nearly all of these are extragalactic objects mistakenly classified as Galactic stars, five of which are broad-line quasi-stellar objects (QSOs). None are Fornax cluster galaxies. Since we do not have the original spectra for these objects, we cannot inspect them to understand the discrepancies.
While all coordinates given in Table 2 are J2000 and extracted from each catalogue, the many Galactic stars within the catalogue may have moved substantially since the observations were taken, by as much as several arcseconds. This should be taken into account when using the table, in particular when crossmatching the table with new photometry.
No velocity uncertainties are output by the MARZ program, so the velocities from this work, Firth 2dF and Gregg 2dF do not have velocity uncertainties in the table. However, since all three sets of observations use the same instrumentation, the uncertainties will be similar for each. There are 166 objects from the new spectroscopy and those of Firth 2dF that have two high confidence redshifts. The velocities of the duplicate observations all agree to within 40km s-1. From the Drinkwater 2dF spectra, the provided redshift uncertainties are =0.0002–0.0004, corresponding to velocity uncertainties of 60–120km s-1. These are all consistent with the estimated redshift uncertainty of the MARZ program of 0.0003, determined by comparison with an independent redshifting method (Hinton et al., 2016).
3 The Fornax cluster and beyond
3.1 The Fornax volume
Fig. 4 shows the volume contained within km s-1. We adopt a lower velocity limit of 600 km s-1 to separate Galactic stars from Fornax cluster galaxies, based on the obvious minimum at this velocity, although lower values are occasionally used in the literature. The volume behind the cluster is exceptionally empty. We adopt 3000 km s-1 as the upper limit for the Fornax cluster volume.
Of the 16856 unique objects with spectroscopic redshifts, 1039 belong within the Fornax volume of km s-1, of which 651 are confirmed GCs, leaving 388 cluster galaxies. 9483 are Galactic stars, reflecting the fact that many works either specifically targeted point sources, or imposed no morphological selection. While this approach results in a low yield of extragalactic objects, this strategy revealed the population of ultra-compact dwarf galaxies in the Fornax cluster.
Fig. 5 shows how the Fornax cluster members are distributed in space. GCs are not shown here, as they cluster heavily around NGC 1399. There is a slight overdensity of objects in the south-west extension, centred on Fornax A.

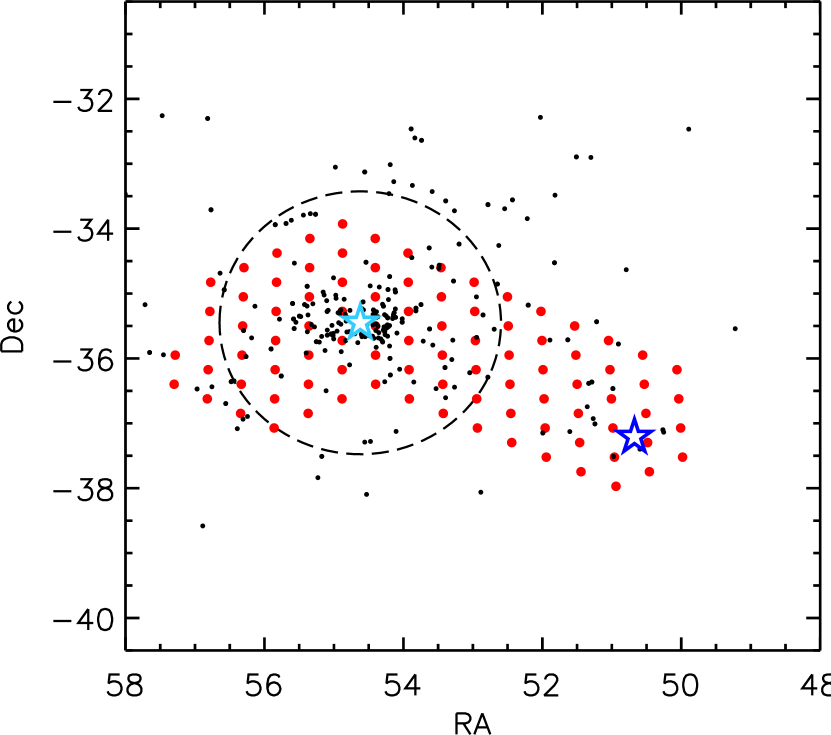
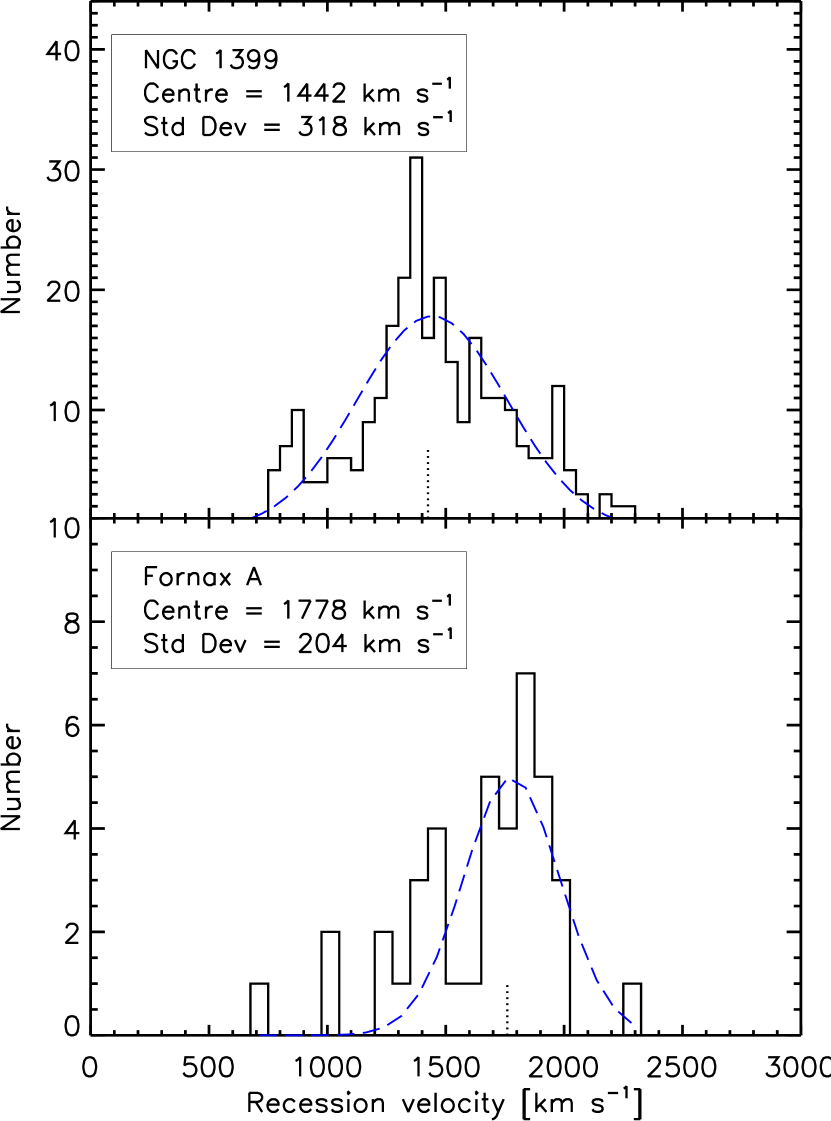
As we now have the most comprehensive census of spectroscopically confirmed Fornax cluster members assembled to date, we can confidently measure the velocity dispersion of the Fornax cluster. Incorporating only objects with km s-1 and within the virial radius of 0.7 Mpc centred on NGC 1399 as determined by Drinkwater, Gregg, & Colless (2001b), we find the cluster recession velocity is 1454 km s-1, offset from the accepted recession velocity of NGC 1399 of 1425 km s-1 (Graham et al. 1998). The width of the distribution is 286 km s-1. Removing the GCs, which dominate the number counts and may not be sampling the cluster potential, the cluster velocity is centred at 1442 km s-1, with a width of 318 km s-1. The distribution of velocities is shown in the top panel of Fig. 6, along with a Gaussian fit, as well as the recession velocity of NGC 1399 itself at 1425 km s-1. We note that more sophisticated methods of parametrising the complex distribution of velocities could be used, but a simple Gaussian is sufficient for our purposes here.
We can separate the objects in the top panel of Fig. 6 into dwarf galaxies and giant galaxies, based on the photometry described in Section 3.4. For dwarf galaxies confirmed to have , as used by Venhola et al. (2019), and employing a distance modulus of 31.51 as in Blakeslee et al. 2009, the centre and width of the recession velocity distribution are 1435 km s-1 and 303 km s-1, respectively. The results are insensitive to the magnitude delimiting dwarfs from giants.
This is much smaller than the 429 km s-1 dispersion found in Drinkwater, Gregg, & Colless (2001b), who use only the 55 dwarf galaxies within their FLAIR-II observations. These 55 galaxies are a subset of the 168 dwarfs found in the current compilation, which more fully probe the velocity distribution of the cluster. They are also uniformly distributed across the volume of the cluster, whereas our 168 objects are more concentrated around NGC 1399.
The Drinkwater, Gregg, & Colless (2001b) study also uses to define the dwarf regime, compared to (which is approximately for colours typical of dwarf galaxies). Relaxing this to to be more comparable to the magnitude limit used here, the resulting 84 galaxies in their sample have lower velocity dispersion of 370 km s-1.
Giant galaxies are selected to either have or be from the 2MRS or Ferguson 1989 compilations, which both have very bright flux limits. There are only a few tens of such bright galaxies in our survey area, so the velocity distribution is not well-described by a Gaussian, but the resulting fit is centred at 1453 km s-1, with a width of 329 km s-1, not substantially different from the dwarfs or the general population.
Using the relation between the dynamical mass, , of a cluster, and the velocity dispersion, , as determined in Saro et al. (2013):
| (1) |
with , and , and km s-1, we derive a dynamical mass of . We caution that the relation in equation 1 was calibrated for clusters with masses , so we are extrapolating to lower masses. Drinkwater, Gregg, & Colless (2001b) find a velocity of the overdensity around NGC 1399 centred at 1478 km s-1 with width 370 km s-1. However, they only had 92 spectroscopic cluster members, compared with our 945, or 294 excluding GCs. They employ a number of methods of computing masses, with results spanning , consistent with our estimate.
We also have 40 galaxies confirmed to lie within 0.7 Mpc of Fornax A to the south west. This number is small, but can provide an indication of the subgroup velocity. Although the small numbers mean the distribution is not well-fit by a Gaussian, the central velocity of the Fornax A subgroup is found to be 1778 km s-1 with 204 km s-1 width, as seen in the bottom panel of Fig. 6. This is in good agreement with the recession velocity of Fornax A at 1760 km s-1. Again using equation 1, the velocity dispersion corresponds to a mass of . For the Fornax A subgroup, using only 16 galaxies, Drinkwater, Gregg, & Colless (2001b) find a recession velocity of 1583 km s-1, higher than that of the main NGC 1399 overdensity, but lower than our value.
A two-sided Kolmogorov-Smirnov (KS) test on the recession velocities for the structures centred on NGC 1399 and Fornax A, returns a probability that the two distributions are drawn from the same underlying sample of 810-5, so it is likely that the Fornax A subgroup is kinematically distinct from the NGC 1399 overdensity, consistent with the conclusion drawn in Drinkwater, Gregg, & Colless (2001b).
Comparing the top and bottom panels of Fig. 6, the NGC 1399 distribution appears skewed toward high velocities, while the Fornax A distribution appears skewed to low velocities. We have extracted the objects that lie more than 1- from the mean velocity (mean + 1- for NGC 1399 and mean - 1- for Fornax A) to explore the spatial distribution of these objects. Although Venhola et al. (2019) find an overdensity of dwarf galaxies in the region between NGC 1399 and Fornax A, we find no evidence for similar behaviour of the general galaxy population.
3.2 Clusters behind clusters
Our spectroscopic compilation includes 6334 background galaxies, extending to , with the majority of galaxies at , and the high redshift objects all broad-line quasars.

From Fig. 7, we confirm the overdensity at also reported in Hilker et al. (1999b). The peak velocity we find of 33 528 km s-1 agrees very well with their value of 33 580 km s-1, although we find a narrower dispersion, only 144 km s-1, in contrast with their 316 km s-1. Hilker et al. (1999b) identify the BCG of the cluster as CGF 1-1, only 11 south of NGC 1399, and lies at the intersection of at least two filaments, as seen in Fig. 8, indicated by the purple star. The filaments extend 4 degrees on the sky in the North–South direction, which at the distance of this overdensity, corresponds to a linear size of 29 Mpc. With our increased numbers of objects (168 compared with 19 from Hilker et al. 1999b), we find that the overdensity at this redshift is actually composed of several smaller peaks. However, from Fig. 8, several of the 168 objects are probably physically unrelated.
Also seen in Fig. 7, there are two additional, narrow overdensities at and , which have velocity standard deviations of 275 and 240 km s-1, respectively. From the spatial distributions, all three overdensities appear to be filamentary in structure.
3.3 High redshift and radio sources
There are 264 objects marked in the catalogue as QSOs, 23 of which are within the MIGHTEE-H i volume of , while 205 are at . The absence of colour selection within the Drinkwater 2dF spectroscopic campaign was leveraged by Meyer et al. (2001) to construct an unbiased QSO sample from the first epoch of observations. Their comparison of the flux-limited sample with other commonly used methods of identifying QSO candidates showed that selecting objects with a UV-excess results in samples which are 69 per cent and 50 per cent complete at and , respectively. Multi-colour selection increased completeness to 90 and 80 per cent at low and high redshifts, respectively.
To within a matching radius of 20″, only 12 of the 264 have matches in the NRAO VLA Sky Survey radio catalogue (NVSS; Condon et al. 1998). A large crossmatching radius is necessary due to the different location of radio emission with respect to the optical host galaxy position for double-lobed radio sources. The NVSS catalogue has a relatively bright peak flux limit of 2 mJy beam-1, thus preferentially selects only nearby star-forming galaxies and the most radio-bright quasars. Table 3 lists the 86 objects at that are also detected in NVSS, 12 of which are QSOs.
With the deep radio imaging from MeerKAT, we expect most, if not all, of the QSOs in this field to be detected at radio wavelengths, even those classically considered to be radio quiet (White et al., 2015). The MFS will reach a root-mean-square (RMS) flux limit of Jy, nearly three orders of magnitude deeper than NVSS. These objects can be used as background sources searching for either associated or intervening absorption of H i along the line of sight. Having spectroscopic redshifts of the radio continuum sources immediately enables us to determine whether any H i absorption seen in the radio spectrum is associated with the background source (the absorption is at the same redshift as the continuum source) or intervening along the line of sight to the background source (the absorption is at a lower redshift than the continuum source).
| ID | RA | Dec | Redshift | Peak flux |
|---|---|---|---|---|
| J2000 | J2000 | [mJy/beam] | ||
| F00057 | 50.2941 | -36.2826 | 0.294 | 2.029 |
| F00107 | 50.6439 | -37.3849 | 0.168 | 4.454 |
| F00112 | 50.6744 | -36.8857 | 0.356 | 5.540 |
| F00208 | 51.1021 | -36.6014 | 0.361 | 3.149 |
| F00221 | 51.1596 | -37.3265 | 0.169 | 10.398 |
| F00249 | 51.2431 | -36.7258 | 0.433 | 58.723 |
| F00322 | 51.4887 | -36.4247 | 0.272 | 6.727 |
| F00498 | 52.2118 | -37.7718 | 0.114 | 2.113 |
| F00535 | 52.3344 | -36.9957 | 0.103 | 2.135 |
| F00554 | 52.3832 | -36.7790 | 0.326 | 6.450 |
3.4 Photometry
In order to understand the magnitude range of observed objects, the spectroscopic catalogue is matched to the output of Source Extractor over the Fornax region from the FDS, which served as the initial object detection list for the work in Venhola et al. (2018), and thus includes both resolved and unresolved source. Of 16856 objects, 15254 have a counterpart in the optical catalogue to a crossmatching radius of 15. The objects without optical counterparts are primarily composed of five categories. The first is objects with a spectrum that lie outside the imaging footprint of the FDS. The second is Galactic stars. As the time difference between the spectroscopic observations and the new FDS imaging is as much as 20 years in some cases, the stars have moved on the sky by several arcseconds.
The third group of objects often without photometry are the CSS objects. As these primarily lie within the halos of more massive galaxies, specialised photometry processing is required to isolate these objects. The next group are the massive galaxies themselves, which require photometry processing tuned toward spatially extended objects. There are a few tens of such large galaxies in our sample. The final group is background galaxies, with an increased incompleteness behind NGC 1399, where the density of foreground galaxies is high, and blending of the photometry is an issue.
Fig. 9 shows the distribution of -band magnitudes from the FDS for objects with spectroscopy. The bulk of the objects are Galactic stars. The faint end of the distribution is dominated by GCs, which were targeted specifically, in particular by Schuberth et al. (2010), who were able to extend to faint magnitudes due to the large collecting area of the VLT used for the observations.

3.5 Completeness
We provide here an estimate of the completeness of the spectroscopy over the FDS 26 deg2 area. As the primary data product of this work is the spectroscopic catalogue, we only perform a basic completeness calculation for interest.
Computing the overall spectroscopic completeness is complicated by a number of competing factors. The most severe is the high density of targeted observations focusing exclusively around NGC 1399, resulting in very high spectroscopic completeness in that area, with lower completeness elsewhere. The high density of foreground objects around NGC 1399 also results in the difficult crowded-field photometry, affecting the completeness of background galaxies. Another main issue is the missing GSs and Fornax CSS systems from the crossmatch between the spectroscopy and photometry.
We eliminate the missing point source complication by employing the photometric catalogues from Venhola et al. (2018) which have a restriction for the minimum size of included objects, with semi-major axis 2″. This removes the GSs and CSS objects, but is small enough to include objects similar in size to Local Group dwarf spheroidals at the distance of the Fornax cluster. Additional objects removed by the size restriction are background QSOs and compact background galaxies. However, the catalogue is a fair representation of the extragalactic population, particularly at the distance of the Fornax cluster, the primary focus of many studies.
The 2″ photometry catalogue is crossmatched to the spectroscopic catalogue, with magnitude-based crossmatching radii. At bright magnitudes, , the galaxies are large, and the centroid of the objects is dependent on the depth of the photometry and the processing employed. Fig. 2 illustrates the issue of using different photometry as the input for spectroscopic observations. The white square indicates the coordinates of the object as listed in our input catalogues, while the white circles show where spectroscopic observations were centred. The nearest spectrum is 4″ distant from the photometric coordinates, and is thus missed by a small positional crossmatch between photometry and spectroscopy. For these objects, we use a crossmatching radius of 15″ between the galaxy position and the corresponding spectroscopy.
At fainter magnitudes, we use a crossmatching radius of 15. The spectroscopic completeness as a function of -band magnitude is shown in Fig. 10. We achieve 100 per cent completeness for the bright galaxies. There is a small bump at , which reflects the approximate magnitude limit of many of the contributing spectroscopic surveys. The variation of completeness depending on location within the cluster is also indicated. The red dotted line shows the completeness reached by 80 per cent of the survey area, while the blue dotted line is the completeness reached by 20 per cent of the area.
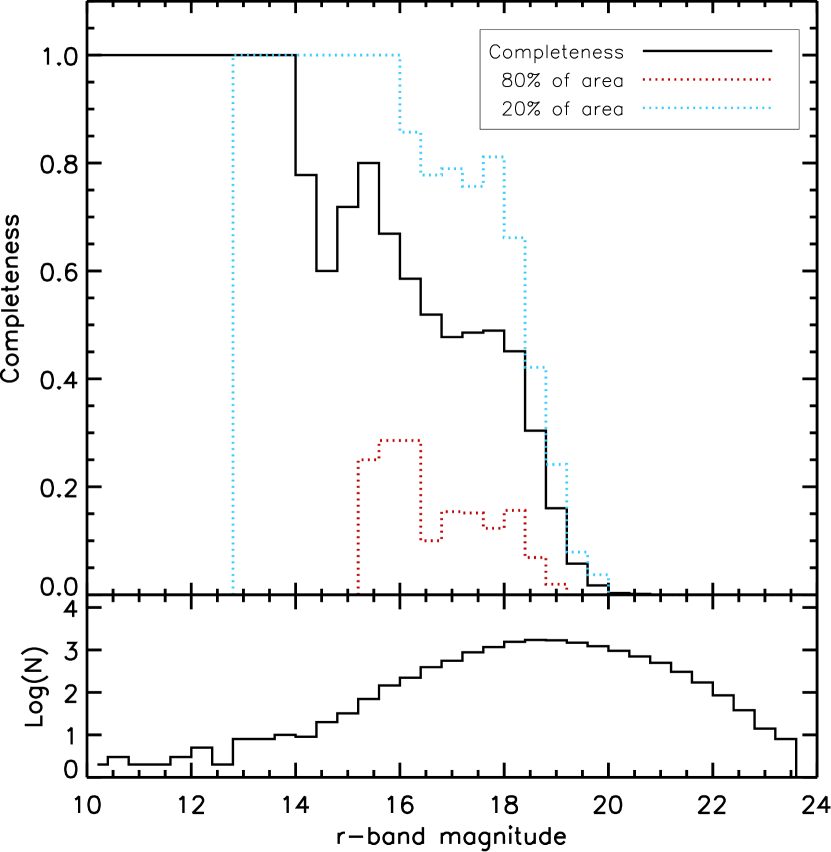
Difficulty of obtaining spectroscopic redshifts for low surface brightness galaxies is also a source of incompleteness. The behaviour of central surface brightness as a function of magnitude for the input catalogue for the Drinkwater 2dF spectroscopy is illustrated in Figure 2 of Drinkwater et al. (2000a). The VST imaging serving as input photometry for the spectroscopy in this work shows similar behaviour, but extends to fainter magnitudes. As stated in Deady et al. (2002), two-hour integrations with the original 2dF instrument reached 80 per cent completeness to surface brightness of 23.2 mag arcsec-2. There are very few objects within the magnitude limits probed here that have surface brightnesses fainter than about 23 mag arcsec-2, so while they are an interesting subpopulation of objects, they are only a small source of overall incompleteness.
4 Discussion and Summary
While this is the most comprehensive compilation of spectroscopy in the Fornax cluster region to date, we make no strong claims on the completeness with respect to any given population of object. Each of the spectroscopic campaigns imposed different selection criteria, involving imaging from different sources, morphological classification, colours and location within the cluster. The region surrounding NGC 1399 understandably has the most spectroscopic observations. The observations of Drinkwater et al. (2000a) are close to unbiased, as the only selection criterion was a magnitude limit. However, the large fraction of confirmed Galactic stars (7969 of 12071 spectra) means this approach is inefficient and requires large amounts of telescope time. A magnitude limit also introduces a bias against objects with low surface brightness, but the lack of morphology cut resulted in the discovery of the UCD population of galaxies.
Nonetheless, the spectroscopic compilation provided here will be of great value for studies targeting the cluster itself, and also the background volume. The inclusion of the many thousands of confirmed Galactic stars and GCs, in addition to the new high-quality imaging from the FDS, will assist in future observing campaigns aimed at morphologically compact objects, as target selection can incorporate knowledge of the colour space occupied by the different populations.
With our vastly increased numbers, we can constrain the recession velocity of the cluster centred on NGC 1399 to be 1454 km s-1, or 1442 km s-1 if the GC population is excluded. This is distinct from the substructure centred on Fornax A, which is found to have a higher velocity of 1778 km s-1. We also confirm a background structure at that was hinted at in previous observations, along with at least two other overdensities, which should be interesting environments to explore with the upcoming radio spectral line and continuum surveys with MeerKAT.
With the onset of the MFS and MIGHTEE surveys, which are spectroscopic observations, we expect additional galaxies to have spectroscopic redshifts derived from their H i profiles. This will be particularly true for low surface brightness, but H i-rich, objects, for which an optical spectrum is difficult to obtain, but within reach of the excellent sensitivity of MeerKAT. These objects can be added to the census of redshifts as they become available.
Due to its dynamic nature, ongoing growth, and relative proximity, the Fornax cluster has been a rich environment for galaxy evolution studies for several decades. With the new observing facilities in the Southern hemisphere, interest has been renewed.
Acknowledgements
We thank the anonymous referee for a rapid response and helpful comments which improved this paper.
We are grateful to Michael Drinkwater for providing his catalogue of spectroscopic classifications. NM would like to thank Samuel Hinton for assistance with the MARZ tool. We would like to thank J. Mohr, J. Allison, and T. Westmeier for useful discussions.
NM acknowledges support from the BMBF D-MeerKAT award 05A2017. This project has received funding from the European Research Council (ERC) under the European Union’s Horizon 2020 research and innovation programme (grant agreement no. 679627; project name FORNAX). AV acknowledges the Scholarship Fund of the University of Oulu for the financial support. E.I. acknowledges financial support from the VST project (P.I. P. Schipani) and from the European Union Horizon 2020 research and innovation programme under the Marie Skodowska-Curie grant agreement n. 721463 to the SUNDIAL ITN network. SIL is supported by the National Research Foundation (NRF) of South Africa.
This research has made use of NASA’s Astrophysics Data System Bibliographic Services. This research has made use of the VizieR catalogue access tool, CDS, Strasbourg, France (DOI: 10.26093/cds/vizier). Based in part on data acquired through the Australian Astronomical Observatory, under program A/2017B/006. This paper includes data that has been provided by AAO Data Central (datacentral.org.au).
References
- AAO Software Team (2015) AAO Software Team, 2015, ascl.soft, ascl:1505.015
- Bergond et al. (2007) Bergond G., et al., 2007, A&A, 464, L21
- Binggeli, Tarenghi, & Sandage (1990) Binggeli B., Tarenghi M., Sandage A., 1990, A&A, 228, 42
- Blakeslee et al. (2009) Blakeslee J. P., et al., 2009, ApJ, 694, 556
- Cantiello et al. (2018) Cantiello M., et al., 2018, A&A, 611, A93
- Condon et al. (1998) Condon J. J., Cotton W. D., Greisen E. W., Yin Q. F., Perley R. A., Taylor G. B., Broderick J. J., 1998, AJ, 115, 1693
- Croom, Saunders, & Heald (2004) Croom S., Saunders W., Heald R., 2004, AAONw, 106, 12
- D’Abrusco et al. (2016) D’Abrusco R., et al., 2016, ApJ, 819, L31
- Davies et al. (2013) Davies J. I., et al., 2013, MNRAS, 428, 834
- Deady et al. (2002) Deady J. H., et al., 2002, MNRAS, 336, 851
- Dressler (1980) Dressler A., 1980, ApJ, 236, 351
- Drinkwater et al. (2000a) Drinkwater M. J., et al., 2000, A&A, 355, 900
- Drinkwater et al. (2000b) Drinkwater M. J., Jones J. B., Gregg M. D., Phillipps S., 2000, PASA, 17, 227
- Drinkwater et al. (2001a) Drinkwater M. J., Gregg M. D., Holman B. A., Brown M. J. I., 2001, MNRAS, 326, 1076
- Drinkwater, Gregg, & Colless (2001b) Drinkwater M. J., Gregg M. D., Colless M., 2001, ApJ, 548, L139
- Eigenthaler et al. (2018) Eigenthaler P., et al., 2018, ApJ, 855, 142
- Fabricant, Lecar, & Gorenstein (1980) Fabricant D., Lecar M., Gorenstein P., 1980, ApJ, 241, 552
- Ferguson (1989) Ferguson H. C., 1989, AJ, 98, 367
- Firth et al. (2007) Firth P., Drinkwater M. J., Evstigneeva E. A., Gregg M. D., Karick A. M., Jones J. B., Phillipps S., 2007, MNRAS, 382, 1342
- Firth, Drinkwater, & Karick (2008) Firth P., Drinkwater M. J., Karick A. M., 2008, MNRAS, 389, 1539
- Graham et al. (1998) Graham A. W., Colless M. M., Busarello G., Zaggia S., Longo G., 1998, A&AS, 133, 325
- Gregg et al. (2009) Gregg M. D., et al., 2009, AJ, 137, 498
- Hilker et al. (1999a) Hilker M., Kissler-Patig M., Richtler T., Infante L., Quintana H., 1999, A&AS, 134, 59
- Hilker et al. (1999b) Hilker M., Infante L., Vieira G., Kissler-Patig M., Richtler T., 1999, A&AS, 134, 75
- Hinton et al. (2016) Hinton S. R., Davis T. M., Lidman C., Glazebrook K., Lewis G. F., 2016, A&C, 15, 61
- Hodge (1959) Hodge P. W., 1959, PASP, 71, 28
- Huchra et al. (2012) Huchra J. P., et al., 2012, ApJS, 199, 26
- Iodice et al. (2016) Iodice E., et al., 2016, ApJ, 820, 42
- Iodice et al. (2019) Iodice E., et al., 2019, A&A, 623, A1
- Jarrett et al. (2000) Jarrett T. H., Chester T., Cutri R., Schneider S., Skrutskie M., Huchra J. P., 2000, AJ, 119, 2498
- Jarvis et al. (2016) Jarvis M., et al., 2016, Proceedings of MeerKAT Science: On the Pathway to the SKA. 25-27 May, 6, mks..conf
- Jonas & MeerKAT Team (2016) Jonas J., MeerKAT Team, 2016, Proceedings of MeerKAT Science: On the Pathway to the SKA. 25-27 May, 1, mks..conf
- Karick, Gregg, Drinkwater, Hilker & Firth (2006) Karick A. M., Gregg M. D., Drinkwater M. J., Hilker M., Firth P., 2006, arXiv e-prints, astro–ph/0605515
- Kuijken (2011) Kuijken K., 2011, Msngr, 146, 8
- Lee-Waddell et al. (2018) Lee-Waddell K., et al., 2018, MNRAS, 474, 1108
- Lewis et al. (2002) Lewis I. J., et al., 2002, MNRAS, 333, 279
- Łokas & Mamon (2003) Łokas E. L., Mamon G. A., 2003, MNRAS, 343, 401
- Maddox, Jarvis, & Oosterloo (2016) Maddox N., Jarvis M. J., Oosterloo T. A., 2016, MNRAS, 460, 3419
- Mentz et al. (2016) Mentz J. J., et al., 2016, MNRAS, 463, 2819
- Meyer et al. (2001) Meyer M. J., Drinkwater M. J., Phillipps S., Couch W. J., 2001, MNRAS, 324, 343
- Mieske, Hilker, & Infante (2002) Mieske S., Hilker M., Infante L., 2002, A&A, 383, 823
- Mieske, Hilker, & Infante (2004) Mieske S., Hilker M., Infante L., 2004, A&A, 418, 445
- Morokuma-Matsui et al. (2019) Morokuma-Matsui K., et al., 2019, PASJ, 71, 85
- Paolillo et al. (2002) Paolillo M., Fabbiano G., Peres G., Kim D.-W., 2002, ApJ, 565, 883
- Pasquini et al. (2002) Pasquini L., et al., 2002, The Messenger, 110, 1
- Peng et al. (2010) Peng Y.-j., et al., 2010, ApJ, 721, 193
- Saro et al. (2013) Saro A., Mohr J. J., Bazin G., Dolag K., 2013, ApJ, 772, 47
- Sarzi et al. (2018) Sarzi M., et al., 2018, A&A, 616, A121
- Saunders et al. (2004) Saunders W., et al., 2004, SPIE, 5492, 389
- Scharf, Zurek, & Bureau (2005) Scharf C. A., Zurek D. R., Bureau M., 2005, ApJ, 633, 154
- Schuberth et al. (2010) Schuberth Y., Richtler T., Hilker M., Dirsch B., Bassino L. P., Romanowsky A. J., Infante L., 2010, A&A, 513, A52
- Scott et al. (2014) Scott N., Davies R. L., Houghton R. C. W., Cappellari M., Graham A. W., Pimbblet K. A., 2014, MNRAS, 441, 274
- Serra et al. (2016) Serra P., et al., 2016, Proceedings of MeerKAT Science: On the Pathway to the SKA. 25-27 May, 8, mks..conf
- Skrutskie et al. (2006) Skrutskie M. F., et al., 2006, AJ, 131, 1163 and ultra diffuse galaxies in the center of the Fornax cluster
- Venhola et al. (2017) Venhola A., et al., 2017, A&A, 608, A142
- Venhola et al. (2018) Venhola A., et al., 2018, A&A, 620, A165
- Venhola et al. (2019) Venhola A., et al., 2019, A&A, 625, A143
- White et al. (2015) White S. V., Jarvis M. J., Häußler B., Maddox N., 2015, MNRAS, 448, 2665
- Zabel et al. (2019) Zabel N., et al., 2019, MNRAS, 483, 2251