The brightening of the pulsar wind nebula of PSR B0540–69 after its spin-down rate transition
Abstract
It is believed that an isolated pulsar loses its rotational energy mainly through a relativistic wind consisting of electrons, positrons and possibly Poynting flux[2, 3, 4]. As it expands, this wind may eventually be terminated by a shock, where particles can be accelerated to energies of X-ray synchrotron emission, and a pulsar wind nebula (PWN) is usually detectable surrounding a young energetic pulsar[2, 3, 4]. However, the nature and/or energetics of these physical processes remain very uncertain, largely because they typically cannot be studied in a time-resolved fashion. Here we show that the X-ray PWN around the young pulsar PSR B0540–69 brightens gradually up to 32 over the mean previous flux, after a sudden spin-down rate () transition (SRT) by in December 2011, which has very different properties from a traditional pulsar glitch[5]. No evidence is seen for any change in the pulsed X-ray emission. We conclude that the SRT results from a sudden change in the pulsar magnetosphere that increases the pulsar wind power and hence the PWN X-ray emission. The X-ray light curve of the PWN suggests a mean life time of the particles of days, corresponding to a magnetic field strength of mG in the PWN.
Key Laboratory of Particle Astrophysics, Institute of High Energy Physics, Chinese Academy of Sciences, Beijing 100049, China
School of Mathematics and Physics, Anhui Jianzhu University, Hefei 230601, China
Department of Physics and Institute of Theoretical Physics, Nanjing Normal University, Nanjing 210023, China
University of Chinese Academy of Sciences, Chinese Academy of Sciences, Beijing 100049, China
Astronomy Department, University of Massachusetts, Amherst, MA 01003
School of of Architecture and Art, Hebei University of Engineering, Handan 056038, China
PSR B0540–69 is in the Large Magellanic Cloud, has a spin period of 50 ms, characteristic age of 1670 yr, spin-down power , and is surrounded by a PWN[6, 7, 8]. Those properties make PSR B0540–69 a twin of the famous Crab pulsar[8]. In the SRT in Dec. 2011, the spin-down rate (also called spin frequency derivative) of PSR B0540–69 changed suddenly from to , and has remained almost constant since then[9, 10, 11, 12]. The pulsed X-ray flux and profile shape have remained unchanged since the SRT, and no gamma-ray variability with an upper limit of 30% has been detected[5].
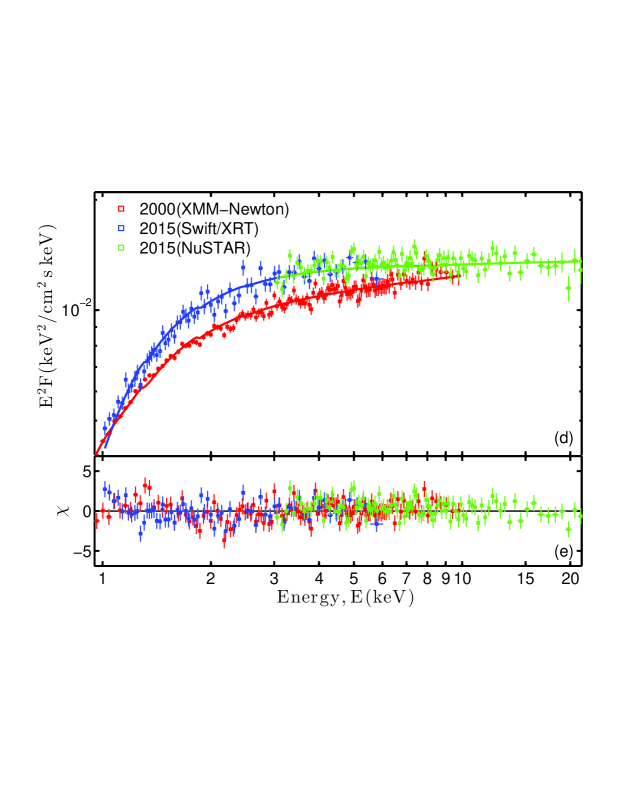
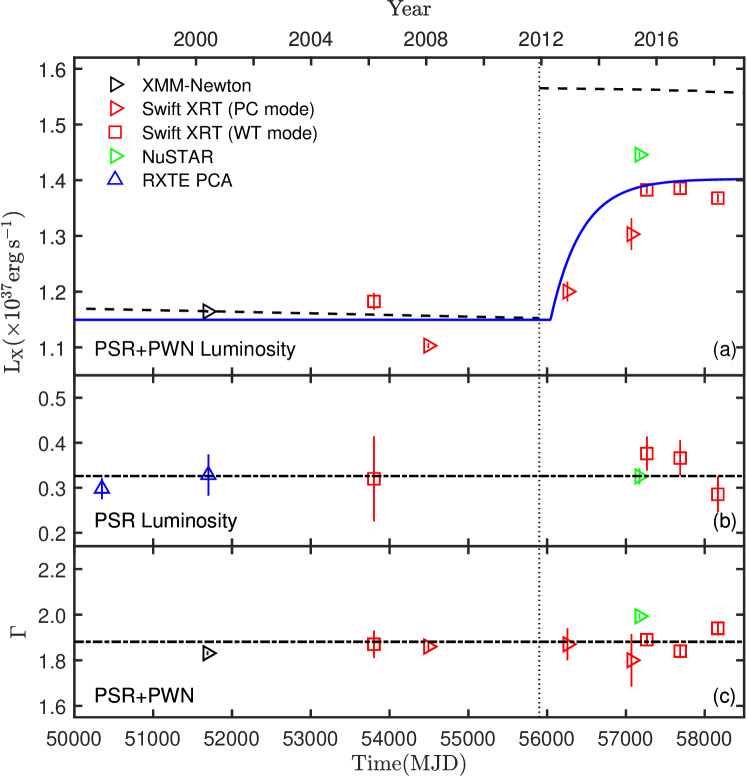
We use observations from XMM-Newton, NuSTAR and the X-ray Telescope onboard the Neil Gehrels Swift Observatory (Swift/XRT), spanning from 1999 to 2018, to measure the total X-ray luminosity of PSR B0540-69 plus the PWN (PSR+PWN) at several epochs; these were measured together because the two components cannot be resolved due to the limited angular resolutions of these telescopes (refer to the “Methods” for the details of analysis). As shown in Figures 1, 2 and Table 1, the spectra of PSR+PWN can be described by a power-law model with flux increasing with time and a nearly constant spectral index. The 1-10 keV X-ray luminosity of the PSR+PWN has gradually increased by (, for this and all the errors in this paper) over the mean pre-SRT value since December 2011.
The evolution of the total X-ray luminosity post-SRT can be characterized with a simple model (details in Methods):
| (1) |
where is the X-ray luminosity in the SRT epoch , the ratio of the increased luminosity compared with the luminosity at , the variation time scale, the time the PWN starts to brighten, which is days after as inferred from the radius of the termination shock[8], and a step function that equals to 0 when , 0.5 when and 1 when . These parameters are obtained by fitting the X-ray luminosities on different dates, and the results of which are listed in Supplementary Table 1. The best-fit value of is days.
Here we discuss the possible origins of the luminosity increase of the PSR+PWN after SRT. We first investigate whether the pulsed flux of PSR B0540–69 varied from Feburary 2014 to September 2018, and as shown in Figure 2(b), the pulsed flux remains almost constant, consistent with the behaviors of this pulsar in the first month after the SRT[5]. Secondly, from the spectral fitting results we know that , the absorption column density, did not change as a result of the SRT. This could not have induced the observed luminosity change. Thirdly, we also found that the luminosity increase is unlikely due to the brightening of recently heated ejecta. Observation of the High Resolution Camera onboard the Chandra X-ray Observatory revealed that the X-ray flux of the supernova remnant surrounding PSR B0540-69 is about 18% of that of the PSR+PWN[7]. If the luminosity increase were due to the recently heated ejecta, the X-ray flux of the supernova remnant should have doubled in several years, which is almost impossible given the fact that the system has a characteristic age of 1670 years. We therefore conclude that the only possible origin of the observed luminosity increase of the PSR+PWN is due to the brightening of the PWN. From the combined PSR+PWN flux and the pulsed flux (refer to Figure 2 and Table 2), it can be inferred that the 1-10 keV X-ray luminosity of the PWN has increased by .
We note that the SRT is unlike traditional pulsar glitches. The latter refer to sudden pulse frequency and/or frequency derivative changes generally interpreted as the result of angular momentum transfer between the inner superfluid material and the outer crust[13]. In the SRT, the spin frequency () shows no sudden change, while changes by 36% within 2 weeks and has remained nearly constant over the past 6.5 years (refer to Supplementary Figure 1 and Supplementary Table 2). These are obviously different from the traditional glitches, which, in addition to the sudden pulse frequency, and often frequency derivative changes, also show tendency of recovering to pre-transition values on a time scale of 100 days[14]. The evolution of this pulsar’s spin after the SRT is instead similar to the long-term evolution of a typical pulsar, and the accelerated spin-down since the SRT is thus experienced by the pulsar as a whole, rather than solely by the crust. Therefore, the pulsar’s spin-down power can be expressed by the following canonical equation:
| (2) |
where is the moment of inertia of the pulsar. According to equation (2) and the values of and pre- and post-SRT, of PSR B0540–69 should increase by after SRT. This is near to the fractional increase of the PWN flux and implies that the brightness of the PWN is directly related to . The physical connection between increase and PWN brightening should be the pulsar wind strength.
In the widely accepted pulsar wind and PWN scenario, the pulsar wind leaves the pulsar at almost the speed of light, but only starts to emit after being randomized and probably further accelerated at the termination shock[2, 3, 4]. We denote the time taken for the particles moving from the pulsar to the termination shock as , where pc is the distance of the termination shock from the pulsar[8]. The pulsar wind strength increases immediately after the SRT, but the PWN starts to brighten at days. Then, given the synchrotron emission nature of the PWN[4, 16, 15, 17], we can estimate the magnetic field of the PWN by equating the synchrotron time scale to the rising time of the PWN emission. Using days, where the magnetic field strength is in milli-Gauss (mG) and the photon energy in keV[8], we can infer that the magnetic field strength is mG, where a photon energy of 2.66 keV (the weighted mean of the X-ray photons) is used. This inferred magnetic field strength is consistent with the equipartition value, 0.8 mG of this PWN[8].
The brightening of the PWN of PSR B0540–69 is unique, though flux variations have also been detected in other PWNe. Among these PWNe, one of the most extensively studied cases is the Crab nebula, which has GeV flares and whose X-ray flux changes by up to 10% over a year-timescale[18, 19]. The PWN associated with PSR J1846–0258 is expanding but has dimmed by between 2000 and 2016 (see ref. 20). However, neither the Crab pulsar nor PSR J1846-0258 have shown corresponding changes. The variations of the Crab nebula are interpreted as being due to the instability of the PWN rather than induced by the central pulsar[15]. The fading of the PWN of PSR J1846–0258 has not been well explained, but unlikely connected with changes of , which has been nearly steady throughout[20]. Other PWNe, such as that of the Vela pulsar, show local X-ray instability[21] , but again, no connection between the instability and the rotation state changes of the central pulsars has been found. Hence, the PWN brightening of PSR B0540–69 appears to be very different from these phenomena, as it seems to have been triggered by the variation of the spin-down state of the central pulsar.
Comparison between the SRT behaviors of PSR B0540–69 and the timing variabilities of other pulsars may provide us with information on the mechanism producing the SRT. Lyne et al. 2010 found that in six pulsars the changes in ascribed to timing noise are correlated with the variations of their radio pulse profiles over timescales of about one to several years[22]. They thus proposed that the timing instability is the result of changes in the pulsar magnetosphere. Among these pulsars, PSR B2035+36 has the most similar timing behaviors to the SRT of PSR B0540–69 with respect to the amplitude (13.28%) of variation and the time ( days) over which it remains in the large state. Besides these six pulsars, PSR B1931+24 and PSR J2021+4026 also have similar timing behaviors with the SRT of PSR B0540–69. PSR B1931+24 has a variation amplitude of 44.90%, but it is an intermittent pulsar with dramatic flux changes[23]. In October 2011, PSR J2021+4026 experienced a sudden change in by 4% but no significant change in , and at the same time significant gamma-ray flux and profile variations were detected[24], which are attributed to changes in the magnetosphere[24]. The SRT of PSR B0540–69 is similar to the timing instabilities of these pulsars, because they all show fast state transitions and appear to remain in the new states for months to years. Given these similar timing behaviors and the different characteristics to a traditional pulsar glitch, where the latter is ascribed to changes in the pulsar crust and/or interior, we believe that the SRT of PSR B0540–69 is also due to the variations of its magnetosphere. However, the exact changes to the magnetosphere of PSR B0540–69 and the observational consequences are probably different from the other pulsars: its X-ray emission regions have not been affected significantly, so pulse profile or pulsed flux variations seen in the other pulsars are not detected in this pulsar (refer to Figure 2 and Supplementary Figure 2); instead, the changes to the magnetosphere of PSR B0540-69 result in the brightening of the PWN in the X-ray band.
According to the classic structure of a pulsar, the pulsed emission is produced in the co-rotating magnetosphere and the pulsar wind is produced outside the light cylinder, which is connected with the pulsar through open magnetic field lines originating from the magnetic polar region[25]. Theoretical studies show that the radio and X-ray emissions of a pulsar probably come from different regions: the radio-emitting region is closer to the magnetic polar region[26, 27], but the X-ray emission is from a broader region such as the outer gap[28]. We thus suggest that the major changes to the magnetosphere of PSR B0540-69 take place in the magnetic polar region. If PSR B0540-69 has pulsed radio emission, it may also have detectable profile vairations following the SRT, similar to those observed by Lyne et al. 2010 (see ref. 22).
The varying braking index and the unchanged pulsed emission of PSR B0540-69 after the SRT set important constraints on theoretical studies of pulsar magnetospheres. The braking index of PSR B0540–69 changed from pre-SRT to in the first four years after the SRT[12], and then to its current value (refer to the Supplementary Figure 1 and Supplementary Table 2). Kou et al. 2016 proposed that the increased pulsar wind strength could lead to a small braking index[29]. However, their model cannot give a quantitatively satisfactory explanation to the post-SRT braking index and the enhancement of the pulsar wind. Ekşi suggested that the low braking index of PSR B0540-69 post-SRT is due to the diffusion of the magnetic fields buried in the crust by rapid fallback accretion soon after the neutron star birth[30]. If such a model is correct, the magnetic field is probably buried in the pulsar magnetic pole region so that the increased magnetic field would mainly enhance the wind production outside the light cylinder. It has also been realized that there are current sheets separating the open from the closed regions of the magnetosphere[31]. In this scenario, the braking index is[31]
| (3) |
where is the radius of the light cylinder, the size of the closed regions of the magnetosphere. To yield a braking index , should change significantly, which seems to conflict with the undetectable changes of the pulsed X-ray emission. However, equation (3) predicts the consequence of overall magnetosphere variations, and as discussed above, the changes in the magnetosphere of PSR B0540–69 may mainly be in the magnetic polar region, which has no major influence on the pulsed X-ray emission of PSR B0540–69.
With the direct evidence that pulsar wind is currently the main force braking the spin of this pulsar, more theoretical work is needed to simultaneously explain the strengthening of the wind, the lack of changes to the pulsed X-ray profile and flux, as well as the braking index of the pulsar post-SRT. New X-ray observation with high spacial resolution is also urged to test the scenario for the SRT and to explore the dynamics of the pulsar outflows, by comparing the new observation to the archive data obtained by the Chandra X-ray Observatory before the SRT.
| Telescope | Time | Photon Index | Flux (1-10 keV) | reduced (d.o.f.) | |
|---|---|---|---|---|---|
| MJD | 1021 cm-2 | 10-11 erg s-1 cm-2 | |||
| XMM-Newton | 51690 | 1.12(152) | |||
| NuSTAR | 57173 | 3.4 | 1.08(197) | ||
| Swift/XRT (PC mode) | 53474-55511 | 0.98(2871) | |||
| Swift/XRT (PC mode) | 56254-56261 | 1.26(193) | |||
| Swift/XRT (PC mode) | 56967-57173 | 1.16(88) | |||
| Swift/XRT (WT mode) | 53761-53843 | 1.05(259) | |||
| Swift/XRT (WT mode) | 57070-57463 | 1.05(1533) | |||
| Swift/XRT (WT mode) | 57493-57884 | 1.01(1396) | |||
| Swift/XRT (WT mode) | 57915-58420 | 1.04(952) |
| Telescope | Time | Flux (1–10 keV) | reduced (d.o.f.) | |||
| MJD | 1021 cm-2 | 10-11 erg s-1 cm-2 | ||||
| RXTE/PCA | 50348 | 3.4 | 1.11(1725) | |||
| 51700 | – | – | – | – | ||
| NuSTAR | 57173 | – | – | – | – | |
| Swift/XRT (WT mode) | 53761-53843 | – | – | – | – | |
| Swift/XRT (WT mode) | 57070-57463 | – | – | – | – | |
| Swift/XRT (WT mode) | 57493-57884 | – | – | – | – | |
| Swift/XRT (WT mode) | 57915-58420 | – | – | – | – |
Methods
Data Reduction and Analyses
We select the X-ray telescopes XMM-Newton, NuSTAR and Swift/XRT to measure the flux of PSR B0540–69 and its wind nebula (PSR+PWN). Due to the relatively large distance, the central pulsar and its nebula can not be individually resolved spatially, hence only the overall fluxes of the PSR+PWN are obtained by these observations. In order to estimate the pulsed X-ray flux of PSR B0540–69, we only utilize the observations with good time resolution, such as by RXTE/PCA, NuSTAR, and Swfit/XRT in the Windowed Timing (WT) mode. We use the pulse-on spectra with the background from the pulse-off region subtracted to estimate the pulsed flux of the central pulsar[10]. Each spectrum is fitted by an absorbed power-law model (tbabs*powerlaw in XSPEC). Due to the relatively low count rate of the pulsar, in the spectral analyses of the pulsed emission, the absorption column density is fixed to 3.4, the value obtained by XMM-Newton when fit the overall spectrum of the PSR+PWN. The coordinates of PSR B0540–69 are and =-69º19′54′′.34 (J2000)[32], which are used to correct the arrival time of each photon to the Solar System Barycentre (SSB).
0.1 RXTE/PCA
0.2
The data collected by the Proportional Counter Array (PCA) onboard the Rossi X-Ray Timing Explorer (RXTE) were used in this paper. PCA is one of the main instruments operating in 2 to 60 keV with time resolution up to 1 s[33]. Altogether there are 1448 observations on PSR B0540–69 with a total exposure time of 3481 ks, which make the detailed temporal studies possible.
The Good Xenon mode data from observations P10206, P10218, P10250, P20188, P30087, P40139, P50103, P60082, P70092, P80089, P80118, P90075, P91060, P92010, P93023, P93448, P94023, P95023 and P96023 are selected for our timing analyses, and then the Standard RXTE data processing method is used to obtain the timing data as follows. (1) Generate the Good Time Interval by the FTOOL command maketime based on the RXTE filter file; (2) merge the Good Xenon data with make_se and then filter the events with grosstimefilt; (3) convert the arrival time of each photon to the SSB with faxbary. Among these observations, P10206 and P50103 were used to create the pulsed spectra as they are the only two on-axis observations with relatively long exposure time.
0.3 XMM-Newton
0.4
We processed the data collected by the European Photon Imaging Camera (EPIC) of XMM-Newton around May 26, 2000 (see ref. 34, ObsID 0117510201, exposure 10 ks) using the Science Analysis System (SAS) (v14.0.01) software . The time intervals contaminated by flaring particle background are discarded. Events in a circular region with a radius of centred on the pulsar position are selected to ensure that all the source events are included, while the background region is a co-centred annulus with the inner and outer radii of and , respectively. The instrument response files for spectral analyses are generated by the SAS commands rmfgen and arfgen, and the spectra are grouped to have at least 15 counts per bin with the command specgroup, to enable the use of chi-square statistics. The region with radius less than is subtracted to preclude the pile-up effect, and the effect of this subtraction is automatically corrected by the software ( http://xmm-tools.cosmos.esa. int/external/xmm_user_support/documentation/uhb/epic_pile-up.html).
0.5 NuSTAR
0.6
PSR B0540–69 was observed by NuSTAR[35] around May 30 (OBSID 40101013002), 2015, with an exposure time of 59 ks. In this work, we analyze data from two telescopes on NuSTAR (usually labeled by their focal plane modules, FPMA and FPMB) using HEASoft (version 6.24). We utilize nupipline with NuSTAR CALDB v20180312 to create GTIs and select a circular region of radius centred on the pulsar position to extract the source spectrum. The background spectrum was extracted from a circular region of radius 150′′ centred on and =-69º19′30′′.683, which is source free and not far away from PSR B0540–69. The arrival time of each photon is corrected to SSB too.
0.7 Swift/XRT
0.8
The Neil Gehrels Swift Observatory (SWIFT)[36] is suitable for monitoring the variability of X-ray sources owing to its rapid slew capability. Until May 28, 2018, there are 109 observations pointing to the position of PSR B0540–69, of which 77 were taken in the WT mode (00033603, 00053402, 00093144) and 32 in the Photon Counting (PC) mode (00053400, 00053402, 00033490,00045451–3)[37]. The exposure time of an individual Swift observation ranges from 254 s to 20 ks, with a mean value of 3.2 ks. All the data are analyzed with the packages in Heasoft version 6.24 ( https://heasarc.gsfc.nasa.gov/docs/software/lheasoft/). The initial event cleaning is executed with the command xrtpipeline using the standard quality cuts.
Because the count rate of PSR B0540–69 is cts s-1,
the PC mode data suffer from pile-up problems. We
therefore extract the source spectra from a circular region with a radius of 20 pixels (47.15′′)
but exclude the central 2 pixels that have the highest count rates
to minimize the contamination of
pile-up (refer to the Supplementary information and
https://heasarc.gsfc.
nasa.gov/docs/heasarc/caldb/swift/docs/xrt/XRT-OAB-CAL_ARF_v3.pdf).
The background
spectra are extracted from an annulus region with the inner and
outer radii of 20 and 40 pixels, respectively. The ancillary response files (ARFs)
and the corresponding response files (RMFs) are generated separately.
ARFs are produced with the command xrtmkarf, while
the corresponding RMFs are taken from the CALDB database.
The spectra are regrouped to have at least 20 counts per bin
to ensure that the
statistics can be used. In order to provide better constraints on
the spectral parameters, we also divide the observations
into several groups and fit the spectra simultaneously for
each group.
Thanks to the good time resolution ( ms), the WT mode data are adequate for timing analysis. In the 77 WT mode observations, we exclude the observation performed on March 04 2016, because the source is erratically located in and out of the field of view[37]. The source events in 1–10 keV are extracted from a circular region with a radius of 15 pixels centred on the source position, and the background spectrum is extracted from an annulus with the inner and outer radii of 15 and 30 pixels, respectively. The photon arrival time is converted to SSB using the FTOOL command barycorr. Light curves with a bin size of 2 ms are extracted and corrected for the telescope vignetting and point spread function effects by running the Swift script xrtlccorr. The background-subtracted light curves are plotted in Supplementary Figure 4.
As shown in Supplementary Figure 4, the Swift/XRT count rate of PSR+PWN increases gradually after SRT while the pulsed count rate does not show any significant enhancement. Then, the count rate variation of PSR+PWN is also fitted with equation (2), and the parameters are listed in Supplementary Table 2, which are consistent with those obtained from the luminosities by different instruments.
Timing and pulsed emission
The timing analysis of PSR B0540–69 pre-SRT has been performed in details by Ferdman et al. 2015 (see ref. 11). So we adopt the pre-SRT timing parameters from their work, and only focus on the post-SRT timing analyses.
We calculate the rotation frequencies and their derivatives from the pulse times-of-arrivals (TOAs) of the pulsar in different epochs. To obtain the TOAs, we first create an accurate template profile by adding all the aligned profiles from our full data set in the entire energy band for each instrument. The template contains 10 bins because of the low count rate of PSR B0540–69. We then obtain the TOAs for each observation by comparing the template profile with the one from that observation, as detailed in the following part. (1) Search for the spin frequency that makes the folded profile deviating the most from a uniform distribution as represented by the Pearson value, and this is taken as the best spin frequency[10]. (2) Fold the pulse profile with the starting time of the observation as the reference epoch of the TOA obtained in the next step. (3) Calculate the phase shift using the cross-correlation between the pulse profile and template profile, from which we can calculate the TOA representing each observation in the reference epoch. The uncertainty of a TOA is calculated with a Monte-Carlo method[10] as follows. (1) Generate a fake profile based on the Poisson count error of each phase bin for the corresponding integrated profile; (2) Calculate the phase shift using the cross-correlation between the fake profile and the template profile; (3) Repeat steps (1) and (2) for 400 times and obtain 400 fake TOAs; (4) The 1 width of the distribution of the 400 fake TOAs is taken as the uncertainty of the TOA in one observation.
We perform both part-timing analysis and fully coherent timing analysis for PSR B0540–69 to study its timing behaviors using TEMPO2[38], similar to Ferdman et al. 2015 (see ref. 11). The part-timing analyses with a typical duration of 100 days were performed for all the post-SRT observations, to obtain the long-term evolution of the rotation frequency, while the fully coherent timing analyses were performed only for three time intervals, MJD 57070–57546, 57546–57946 and 57946–58420 to obtain more accurate pulse profiles, as two small glitches on MJD 57546 and 57946 are detected at the boundary epochs of the three time ranges[39]. In equation (4) below, which describes the pulse phase calculation, we only consider and in the part timing analysis because of the relatively short duration, and include in the fully coherent timing analysis.
| (4) |
where , , and are the phase, frequency, frequency derivative and the second order derivative of frequency at the reference epoch , respectively. The resultant timing residuals are less than 1.4 ms and distributed quite smoothly as shown in Supplementary Figure 3 and Supplementary Table 2, implying that the inferred rotation parameters are reliable. It can be also seen that only changes very slightly, which means that keeps almost constant post-SRT. However, with the new value of and , it can be inferred that the braking index increases from in the first four years after SRT[12] to in the recent two years.
With the timing parameters obtained above, we can determine the pulsed X-ray profiles and the fluxes during different epochs. As shown in Supplementary Figure 2, the pulse profile of PSR B0540–69 remains almost unchanged post-SRT. To get the pulsed flux, the events in phase range 0.4–0.6 are used to generate the background spectra and those outside this phase range are taken to generate the source spectra. Because of the low count rate of the pulsar, the pulsed spectra are fitted with a log-parabola model[37] by freezing to 3.4, forcing all the photon indices equal to each other and only setting the normalization values of different spectra as free parameters. The resultant spectral parameters and fluxes are listed in Table 2. The averaged pulsed flux pre-SRT is ergs s-1 cm-2, while the averaged pulsed flux is ergs s-1 cm-2 post-SRT. Therefore, the pulsed flux remains unchanged within about 1, consistent with the results of Marshall et al. 2015 (see ref. 5).
Derivation of Equation (1)
As shown by many studies, the pulsar wind is lepton-dominated at the termination shock[4]. For simplicity, we assume that the Lorentz factor (velocity) of the electrons/positrons keeps unchanged post-SRT, because the spectral indices pre- and post-SRT are the same. In this case the electron/positron injection rate is proportional to the spin-down luminosity of the pulsar
| (5) |
where is the converting factor. Denoting the total number of electrons/positrons in the PWN as , we have
| (6) |
where the second term on the left side is the electron/positron number dying away because of synchrotron emission and is the mean lifetime of the electrons/positrons.
Further assuming that the magnetic field in the PWN keeps constant during the SRT, the X-ray luminosity of the PWN is proportional to the total number of electrons/positrons, which is
| (7) |
by which Equation can be rewritten as
| (8) |
As , , and are all constants, the above equation can be readily integrated to give the desired result
| (9) |
where is the saturated X-ray luminosity of the PWN after the SRT, and is the time at which the X-ray luminosity starts to increase. The original X-ray luminosity of the PWN is , where is the spin-down luminosity of the pulsar before the SRT. We could therefore re-write the formula as,
| (10) |
where .
Data availability
The data that support the plots within this paper and other findings of this study are available from the corresponding author M.-Y.G.(gemy@ihep.ac.cn) upon reasonable request. All the observational data used in this study are public and can be downloaded from the archives of these X-ray satellites.
References
References
- [1]
- [2] Pacini, F. and Salvati, M. On the Evolution of Supernova Remnants. Evolution of the Magnetic Field, Particles, Content, and Luminosity Astrophys. J. 186, 249-266 (1973).
- [3] Rees, M. J. and Gunn, J. E. The origin of the magnetic field and relativistic particles in the Crab Nebula Mon. Not. R. Astron. Soc. 167, 1-12 (1974).
- [4] Kennel, C. F. and Coroniti, F. V. Magnetohydrodynamic model of Crab nebula radiation Astrophys. J. 283, 710-730 (1984).
- [5] Marshall, F. E. and Guillemot, L. and Harding, A. K. and Martin, P. and Smith, D. A. Discovery of a Spin-down State Change in the LMC Pulsar B0540-69. Astrophys. J. Lett. 807, L27 (2015).
- [6] Seward, F. D. and Harnden, Jr., F. R. and Helfand, D. J. Discovery of a 50 millisecond pulsar in the Large Magellanic Cloud Astrophys. J. Lett. 287, L19-L22 (1984).
- [7] Gotthelf, E. V. and Wang, Q. D. A Spatially Resolved Plerionic X-Ray Nebula around PSR B0540-69 Astrophys. J. Lett. 532, L117-L120 (2000).
- [8] Petre, R. and Hwang, U. and Holt, S. S. and Safi-Harb, S. and Williams, R. M. The X-Ray Structure and Spectrum of the Pulsar Wind Nebula Surrounding PSR B0540-69.3 Astrophys. J. 662, 988-997 (2007).
- [9] Zhang, W. and Marshall, F. E. and Gotthelf, E. V. and Middleditch, J. and Wang, Q. D. A Phase-connected Braking Index Measurement for the Large Magellanic Cloud Pulsar PSR B0540-69 Astrophys. J. Lett. 554, L177-L180 (2001).
- [10] Ge, M. Y. and Lu, F. J. and Qu, J. L. and Zheng, S. J. and Chen, Y. and Han, D. W. X-Ray Phase-resolved Spectroscopy of PSRs B0531+21, B1509-58, and B0540-69 with RXTE Astrophys. J. Suppl. 199, 32 (2012).
- [11] Ferdman, R. D. and Archibald, R. F. and Kaspi, V. M. Long-term Timing and Emission Behavior of the Young Crab-like Pulsar PSR B0540-69. Astrophys. J. Lett. 812, L95 (2015).
- [12] Marshall, F. E. and Guillemot, L. and Harding, A. K. and Martin, P. and Smith, D. A. A New, Low Braking Index for the LMC Pulsar B0540-69. Astrophys. J. Lett. 827, L39 (2016).
- [13] Alpar M. A., Anderson P. W., Shaham J. Vortex creep and the internal temperature of neutron stars. I - General theory. Astrophys. J. 276, 325-334 (1984).
- [14] Espinoza, C. M. and Lyne, A. G. and Stappers, B. W. and Kramer, M. A study of 315 glitches in the rotation of 102 pulsars. Mon. Not. R. Astron. Soc. 414, 1679-1704 (2011).
- [15] Kargaltsev, O., Cerutti, B., Lyubarsky, Y., & Striani, E. Pulsar-Wind Nebulae. Recent Progress in Observations and Theory. Space Sci. Rev. 191, 391-439 (2015).
- [16] Bucciantini, N., Arons, J., & Amato, E. Modelling spectral evolution of pulsar wind nebulae inside supernova remnants. Mon. Not. R. Astron. Soc. 410, 381-398 (2011).
- [17] Wang, L. J., Dai, Z. G., Liu, L. D., & Wu, X. F. Probing the Birth of Post-merger Millisecond Magnetars with X-Ray and Gamma-Ray Emission. Astrophys. J. 823, 15 (2016).
- [18] Tavani, M. and Bulgarelli, A. and Vittorini, V. and Pellizzoni, A. and Striani, E. et al. Discovery of Powerful Gamma-Ray Flares from the Crab Nebula. Science 331, 736-739 (2011).
- [19] Abdo, A. A. and Ackermann, M. and Ajello, M. and Allafort, A. and Baldini, L. et al. Gamma-Ray Flares from the Crab Nebula. Science 331, 739-742 (2011).
- [20] Reynolds, S. P. and Borkowski, K. J. and Gwynne, P. H. Expansion and Brightness Changes in the Pulsar-wind Nebula in the Composite Supernova Remnant Kes 75. Astrophys. J. 856, 133 (2018).
- [21] Pavlov, G. G. and Teter, M. A. and Kargaltsev, O. and Sanwal, D. The Variable Jet of the Vela Pulsar. Astrophys. J. 591, 1157-1171 (2003).
- [22] Lyne, A. and Hobbs, G. and Kramer, M. and Stairs, I. and Stappers, B. Switched Magnetospheric Regulation of Pulsar Spin-Down. Science 329, 408-412 (2010).
- [23] Kramer, M. and Lyne, A. G. and O’Brien, J. T. and Jordan, C. A. and Lorimer, D. R. A periodically-active pulsar giving insight into magnetospheric physics. Science 314, 97 (2006).
- [24] Allafort, A. et al. PSR J2021+4026 in the Gamma Cygni Region: The First Variable -Ray Pulsar Seen by the Fermi LAT. Astrophys. J. Lett. 777, L2 (2013).
- [25] Goldreich, P. and Julian, W. H. Pulsar Electrodynamics Astrophys. J. 157, 869-880 (1969).
- [26] Ruderman, M. A. and Sutherland, P. G. Theory of pulsars - Polar caps, sparks, and coherent microwave radiation Astrophys. J. 196, 51-72 (1975).
- [27] Arons, J. and Scharlemann, E. T. Pair formation above pulsar polar caps - Structure of the low altitude acceleration zone Astrophys. J. 231, 854-879 (1979).
- [28] Cheng, K. S. and Ho, C. and Ruderman, M. Energetic radiation from rapidly spinning pulsars. I - Outer magnetosphere gaps. II - VELA and Crab Astrophys. J. 300, 500-539 (1986).
- [29] Kou, F. F. and Ou, Z. W. and Tong, H. On the variable timing behavior of PSR B0540-69: an almost excellent example to study the pulsar braking mechanism. RAA 16, 79 (2016).
- [30] Ekşi, K. Y. On the new braking index of PSR B0540-69: further support for magnetic field growth of neutron stars following submergence by fallback accretion. Mon. Not. R. Astron. Soc. 469, 1974-1978 (2017).
- [31] Bucciantini, N., Thompson, T. A., Arons, J., Quataert, E., Del Zanna, L. Relativistic magnetohydrodynamics winds from rotating neutron stars. Mon. Not. R. Astron. Soc. 368, 1717-1734 (2006).
- [32] Mignani, R. P. and Sartori, A. and de Luca, A. and Rudak, B. and Słowikowska, A. and Kanbach, G. and Caraveo, P. A. HST/WFPC2 observations of the LMC pulsar PSR B0540-69. Astron. Astrophys. 515, A110 (2010).
- [33] Jahoda, K. and Markwardt, C. B. and Radeva, Y. and Rots, A. H. and Stark, M. J. and Swank, J. H. and Strohmayer, T. E. and Zhang, W. Calibration of the Rossi X-Ray Timing Explorer Proportional Counter Array. Astrophys. J. Suppl. 163, 401-423 (2006).
- [34] Jansen, F. and Lumb, D. and Altieri, B. and Clavel, J. and Ehle, M. and Erd, C. and Gabriel, C. and Guainazzi, M. and Gondoin, P. and Much, R. and Munoz, R. and Santos, M. and Schartel, N. and Texier, D. and Vacanti, G. XMM-Newton observatory. I. The spacecraft and operations. Astron. Astrophys. 365, 1-6 (2001).
- [35] Harrison, F. A. and Craig, W. W. and Christensen, F. E. and Hailey, C. J. and Zhang, W. W., et al. The Nuclear Spectroscopic Telescope Array (NuSTAR) High-energy X-Ray Mission. Astrophys. J. 770, 103 (2013).
- [36] Gehrels, N. and Chincarini, G. and Giommi, P. and Mason, K. O. and Nousek, J. A. et al. The Swift Gamma-Ray Burst Mission. Astrophys. J. 611, 1005-1020 (2004).
- [37] Campana, R. and Mineo, T. and de Rosa, A. and Massaro, E. and Dean, A. J. and Bassani, L. X-ray observations of the Large Magellanic Cloud pulsar PSR B0540-69 and its pulsar wind nebula. Mon. Not. R. Astron. Soc. 389, 691-700 (2008).
- [38] Hobbs, G. B., Edwards, R. T. & Manchester, R. N. TEMPO2, a new pulsar-timing package - I. An overview. Mon. Not. R. Astron. Soc. 369, 655–672 (2006).
- [39] Mignani, R. P. and Shearer, A. and de Luca, A. and Marshall, F. E. and Guillemot, L. and Smith, D. A. and Rudak, B. and Zampieri, L. and Barbieri, C. and Naletto, G. and Gouiffes, C. and Kanbach, G. The first ultraviolet detection of the Large Magellanic Cloud pulsar PSR B0540-69. Astrophys. J. 871, 246 (2019).
Acknowledgements We thank the anonymous referees for their insightful suggestions. Professors K. S. Cheng of the Hongkong University and L. Zhang of the Yunnan University are appreciated for helpful discussions on the emission mechanism of pulsars. This work is supported by the National Key R&D Program of China (2016YFA0400800) and the National Natural Science Foundation of China under grants 11503027, 11673013, 11653004, U1838201, U1838202 and U1838104. We thank the data support from XMM-Newton, NuSTAR, RXTE and Swift teams.
Author contributions M.-Y.G., L.-L.Y., S.-S.W., Z.-J.L. and W.Z. were involved in the data analysis. F.-J.L., M.-Y.G., L.-J.W., S.-N.Z., and Q.-D.W. contributed to the theoretical discussions. The manuscript was produced by M.-Y.G., F.-J.L., L.-J.W., Q.-D.W., S.-N.Z. and S.-S.W..
Competing Interests The authors declare that they have no competing financial interests.
Correspondence Correspondence and requests for materials should be addressed to (F.J.L and M.Y.G, email: lufj@ihep.ac.cn, gemy@ihep.ac.cn).