The highest-speed local dark matter particles come from the Large Magellanic Cloud
Abstract
Using N-body simulations of the Large Magellanic Cloud (LMC’s) passage through the Milky Way (MW), tailored to reproduce observed kinematic properties of both galaxies, we show that the high-speed tail of the Solar Neighborhood dark matter distribution is overwhelmingly of LMC origin. Two populations contribute at high speeds: 1) Particles that were once bound to the LMC, and 2) MW halo particles that have been accelerated owing to the response of the halo to the recent passage of the LMC. These particles reach speeds of 700-900 km/s with respect to the Earth, above the local escape speed of the MW. The high-speed particles follow trajectories similar to the Solar reflex motion, with peak velocities reached in June. For low-mass dark matter, these high-speed particles can dominate the signal in direct-detection experiments, extending the reach of the experiments to lower mass and elastic scattering cross sections even with existing data sets. Our study shows that even non-disrupted MW satellite galaxies can leave a significant dark matter footprint in the Solar Neighborhood.
1 Introduction
The nature of dark matter (DM) is one of the fundamental unsolved mysteries in astrophysics. The simplest phenomenological model of DM, the cold dark matter (CDM) paradigm of a cold, collisionless, stable particle species, works remarkably well to describe the expansion of the Universe and the web of cosmic structure [1, 2, 3]. A class of particle CDM candidate, the weakly interacting massive particle (WIMP; [4]), naturally reproduces DM at the abundance measured precisely with cosmological measurements, on account of a small coupling between DM and baryonic matter [1]. This small coupling motivates direct and indirect astroparticle searches for WIMPs in the Milky Way (MW) and beyond. And yet, WIMP CDM has never been detected in an experiment. A confirmation of the WIMP CDM paradigm requires observing a consistent signal in astroparticle experiments and astronomical observations [5], but an assessment of consistency requires accurate theoretical modeling of our Galaxy’s DM halo and any massive perturbers.
A prime example of the intertwining of signals in astroparticle experiments and the distribution of DM in the MW is the interpretation of direct-detection experiments. If DM consists of WIMPs (or axions [6]), laboratory experiments directly detect DM as it passes through the apparatus [7, 8, 9, 10, 11]. The number of events, the energy spectrum of recoiling nuclei/electrons (WIMPs) or photons (axions), and their angular distribution depend on the Solar Neighborhood DM phase-space density as well as DM’s intrinsic particle properties. While there are well-motivated ideas about what the Solar Neighborhood DM phase-space density might be (e.g., Refs. [12, 13, 14]), the only way to understand and measure it will be via these same direct-detection experiments [15, 16].
This presents both a problem and opportunity. The problem is that, in the absence of a secure detection, the experiments require an assumption about the DM density and its velocity distribution in the Solar Neighborhood in order to interpret any potential signal in terms of DM particle-physics parameters (e.g., mass, cross sections; for a novel alternative “halo-free” method, see Refs. [17, 18]). Current input models, however, are unrealistically simple, frequently invoking a Maxwell-Boltzmann velocity distribution (usually assumed to be isotropic, but sometimes anisotropic [19]), and an axisymmetric or triaxial mass distribution of DM that is in dynamical equilibrium [20, 21, 22, 23, 12]. The isotropic Maxwell-Boltzmann model with a Solar Neighborhood DM mass density of GeV/cm3 and a cut-off at the escape speed from the MW is called the “standard halo model” (SHM) [24, 25]. A number of simulations, though, indicate that the SHM is a poor model for the MW, even if it allows for convenient benchmarking of experiments against each other at the present (e.g., Refs. [26, 27, 28, 29]. The inclusion of baryons may bring the local DM speed distribution closer to Maxwellian [30, 31, 32], although with significant halo-to-halo variations.
The opportunity is that the phase-space density, shaped by effects of the MW disk and the recent accretion history of the MW, may be directly measured from WIMP detections (e.g., Ref. [15]). Both effects are only partially theoretically and observationally understood. At geocentric speeds of km/s km/s, the disk of the MW likely has a dramatic effect on the Solar Neighborhood DM density and velocity distribution (e.g., Refs. [33, 27, 34]), although other authors have argued the opposite (see, e.g., [32, 28]). A measurement of this effect would provide an important constraint on hydrodynamic simulations of the co-evolution of galactic disks and their DM halos.
The satellites of the MW—both the ones identified as galaxies as well as those dissolving into the stellar halo—are evidence of the MW’s non-equilibrium state and assembly history, and should be imprinted in the Solar Neighborhood DM phase-space density. The cosmological assembly history of a galaxy can induce significant halo-to-halo scatter in the velocity distribution function [35, 29]. Several studies associate DM with un-phase-mixed stellar debris, notably: Sagittarius stellar stream [36, 37], Gaia-Enceladus [38, 39], Gaia-Sausage [40], Sequoia & S1 stream [41, 42], and Nyx [43]. The DM associated with these stellar substructures is expected to leave distinct signatures in direct-detection experiments [44, 45, 46, 14, 16, 47, 48, 49]. It is possible, though unlikely, that the solar system is sitting inside a dense subhalo, which would significantly influence the local DM phase-space density [50, 51, 52].
In current models, the highest-speed DM particles are spatially homogenized remnants of recently accreted and disrupted subhalos [31, 53, 13]. For low-mass WIMPs, these high-speed particles can dominate the signal, since only the fastest particles are energetic enough to reach the experimental threshold.
Current estimates of both effects – the disk effects on the moderate-speed population and the streams, and the substructure origin of the high-speed tail – come from a handful of hydrodynamic simulations, none of which contain an analog of the most massive substructure orbiting within the MW halo, the Large Magellanic Cloud (LMC). An appropriate analog of the LMC must have 3D velocity and position vectors that are consistent with the observations of the real system, a feat that is not achievable in cosmological simulations. This omission is problematic, as the LMC is the most massive and most recent merger event for the MW, with a recent high-speed pericenter passage at a distance of 48 kpc only 50 Myr ago [54].
In this study, our models account for three effects simultaneously: 1) the MW disk potential; 2) the MW DM halo velocity anisotropy profile; and, for the first time, 3) the presence of the LMC. At 50 kpc, the LMC is a significantly more massive, higher speed and closer satellite than is found in the majority of cosmological simulations [55, 56]. In the following we illustrate that the high-speed tail of the local DM distribution is overwhelmingly of LMC origin – both as particles that were once bound to the LMC and MW halo particles that have been accelerated owing to halo resonances induced by the motion of the LMC [57].
2 The LMC: A Massive Satellite on First Infall
The influence of the LMC on the DM structure of the MW has been ignored in all existing models of the MW’s DM potential. However, two new pieces of information about the LMC are causing the astronomical community to reconsider its omission:
1) The LMC is just past its first close approach to the MW: Recent measurement of the 3D velocity of the LMC has revealed that it is moving too fast to be a long-term companion of our Galaxy [58]. It is expected to have only recently ( 1-2 Gyr) entered our neighborhood and is just past its only pericentric approach to the MW in at least 6 Gyr [54]. The LMC’s closest approach to the MW occurred only 50 Myr ago at a distance of 48 kpc. This first infall scenario is cosmologically expected for high-speed satellites of MW-like galaxies [55, 59, 56] and implies that the LMC should have retained a significant fraction of the DM mass it had upon entering the MW halo [57].
2) The LMC is a Massive Satellite: The stellar mass of the LMC is M⊙ [60]. Abundance matching techniques indicate that the LMC’s cosmologically expected halo mass at infall is M⊙ (e.g., Ref. [61]). This is larger than conventionally assumed for the LMC. Recently, it was shown that such a high LMC mass will not perturb the MW’s disk to levels inconsistent with observations [62] and is both supported by the timing argument [63] and needed to explain the kinematics of the Orphan Stream [64] (and likely many other stellar streams whose kinematics are now measured by Gaia [65]). Furthermore, such high infall mass prevents the LMC disk from being tidally truncated by the MW, explaining new results that the LMC’s outer stellar disk extends to a radius approximately half its current separation to the MW ( kpc; [66, 67]). Significantly, Ref. [68] finds that satellites of MW type galaxies with stellar masses similar to the LMC and with a satellite companion comparable in mass to the Small Magellanic Cloud (SMC), are found to have a pre-capture DM mass of MM⊙. This high mass is also supported by studies of cosmological dwarf galaxy pairs in the field [69].
The mounting evidence supporting the LMC’s high infall mass implies that the LMC cannot be treated as a point mass tracer of the halo potential and cannot be ignored in dynamical models of the MW (see the review in Refs. [57, 70]). Rather, such a massive satellite will contribute to the DM distribution of the MW. In particular, the virial radius of the LMC at infall is expected to be of order 100 kpc. Given its current separation of 50 kpc, this implies that the LMC’s DM halo overlaps with the MW’s disk and our own Solar Neighborhood. In this study, we explore the contribution of DM particles from the LMC’s halo to the density and kinematics of DM in the Solar Neighborhood in a first infall scenario.
3 Numerical Methods
The LMC is just past its first pericentric approach to the MW [58, 54]. This is a rare orbital configuration and cosmological analogs are difficult to identify at z=0 [56]. Moreover, because the kinematic properties of LMC particles in the Solar Neighborhood will depend on the exact orbital motion of the LMC through the halo, we cannot turn to cosmological simulations to study the LMC’s impact on the velocity distribution of DM in the Solar Neighborhood. Instead, we utilize idealized N-body simulations of the LMC-MW encounter presented in Ref. [57] (hereafter, G19), which we summarize briefly here.
All simulations are created using the N-body/TreePM Smoothed Particle Hydrodynamics (SPH) code P-GADGET-3 an updated version of the publicly available GADGET-2 code [71]. N-body galaxy models are generated using the publicly available GALIC code, which implements an iterative method for the construction of N-body galaxy models in collisionless equilibrium [72].
3.1 The MW Model
The MW is modeled as a Hernquist DM halo [73] of mass M M⊙. The virial mass M is defined as the mass enclosed within the virial radius, R; the radius where the halo density , with being the average density of the Universe. The equivalent halo mass for the Hernquist profile is M M⊙. The circular speed for the MW DM halos in both Model 1 and Model 2 (see below) peaks at km/s.
The MW’s DM halo is simulated with particles, providing a DM mass resolution of M⊙. This is comparable to state-of-the-art cosmological simulations, like Caterpillar ( M⊙) [74], ELVIS ( M⊙) [75] LATTE ( M⊙) [76] or APOSTLE ( M⊙) [77]. By modeling the MW DM halo using as a spherical Hernquist distribution, any velocity asymmetries that result can be unambiguously attributed to the action of the LMC.
The stellar component of the MW is modeled as a live Hernquist bulge (M M⊙) and exponential disk (M M⊙). Live stellar components allow us to appropriately account for gravitational accelerations from MW baryons and also allows us to accurately track the center of mass motion of the MW and the relative location of the Sun.
The properties of the MW disk, bulge and halo (e.g. scale lengths, mass) are listed in G19 (their table 1) and are chosen such that the disk kinematics roughly reproduce the observed rotation curve of the MW, which peaks at a value of km/s [78, 79]. Note that this circular speed is higher than generally assumed in the Standard Halo Model (e.g., Ref. [80]).
3.2 Initial MW Halo Kinematics
In order to fully specify the initial conditions for the DM halo particles in the simulations, we must additionally make assumptions about the velocity distribution. The velocity distribution can either be isotropic — the velocity dispersion is the same in every direction, like for an ideal gas — or anisotropic. While idealized simulations often adopt isotropy for simplicity (one may then use Eddington’s formula to define the full 6D phase-space density given a spatial density profile [81]), real halos typically have significant radial anisotropy resulting from their accretion histories. At a given radius in the halo, the so-called anisotropy parameter, , is defined as:
| (3.1) |
Following G19, we explore two MW halo models with different initial velocity anisotropy profiles, : 1) Model 1 an isotropic DM halo (); and 2) Model 2 a radially biased profile [82], consistent with the kinematics of DM halos formed in cosmological simulations [83],
| (3.2) |
G19 find that the amplitude of the halo response to the LMC is strengthened in Model 2 relative to the isotropic Model 1. In this study, these two models will thus allow us to explore whether the MW’s initial halo kinematics also generate different kinematic responses in the Solar Neighborhood. For example, Green:2002a [19, 84] have suggested that halo velocity anisotropy can impact direct-detection experiments.
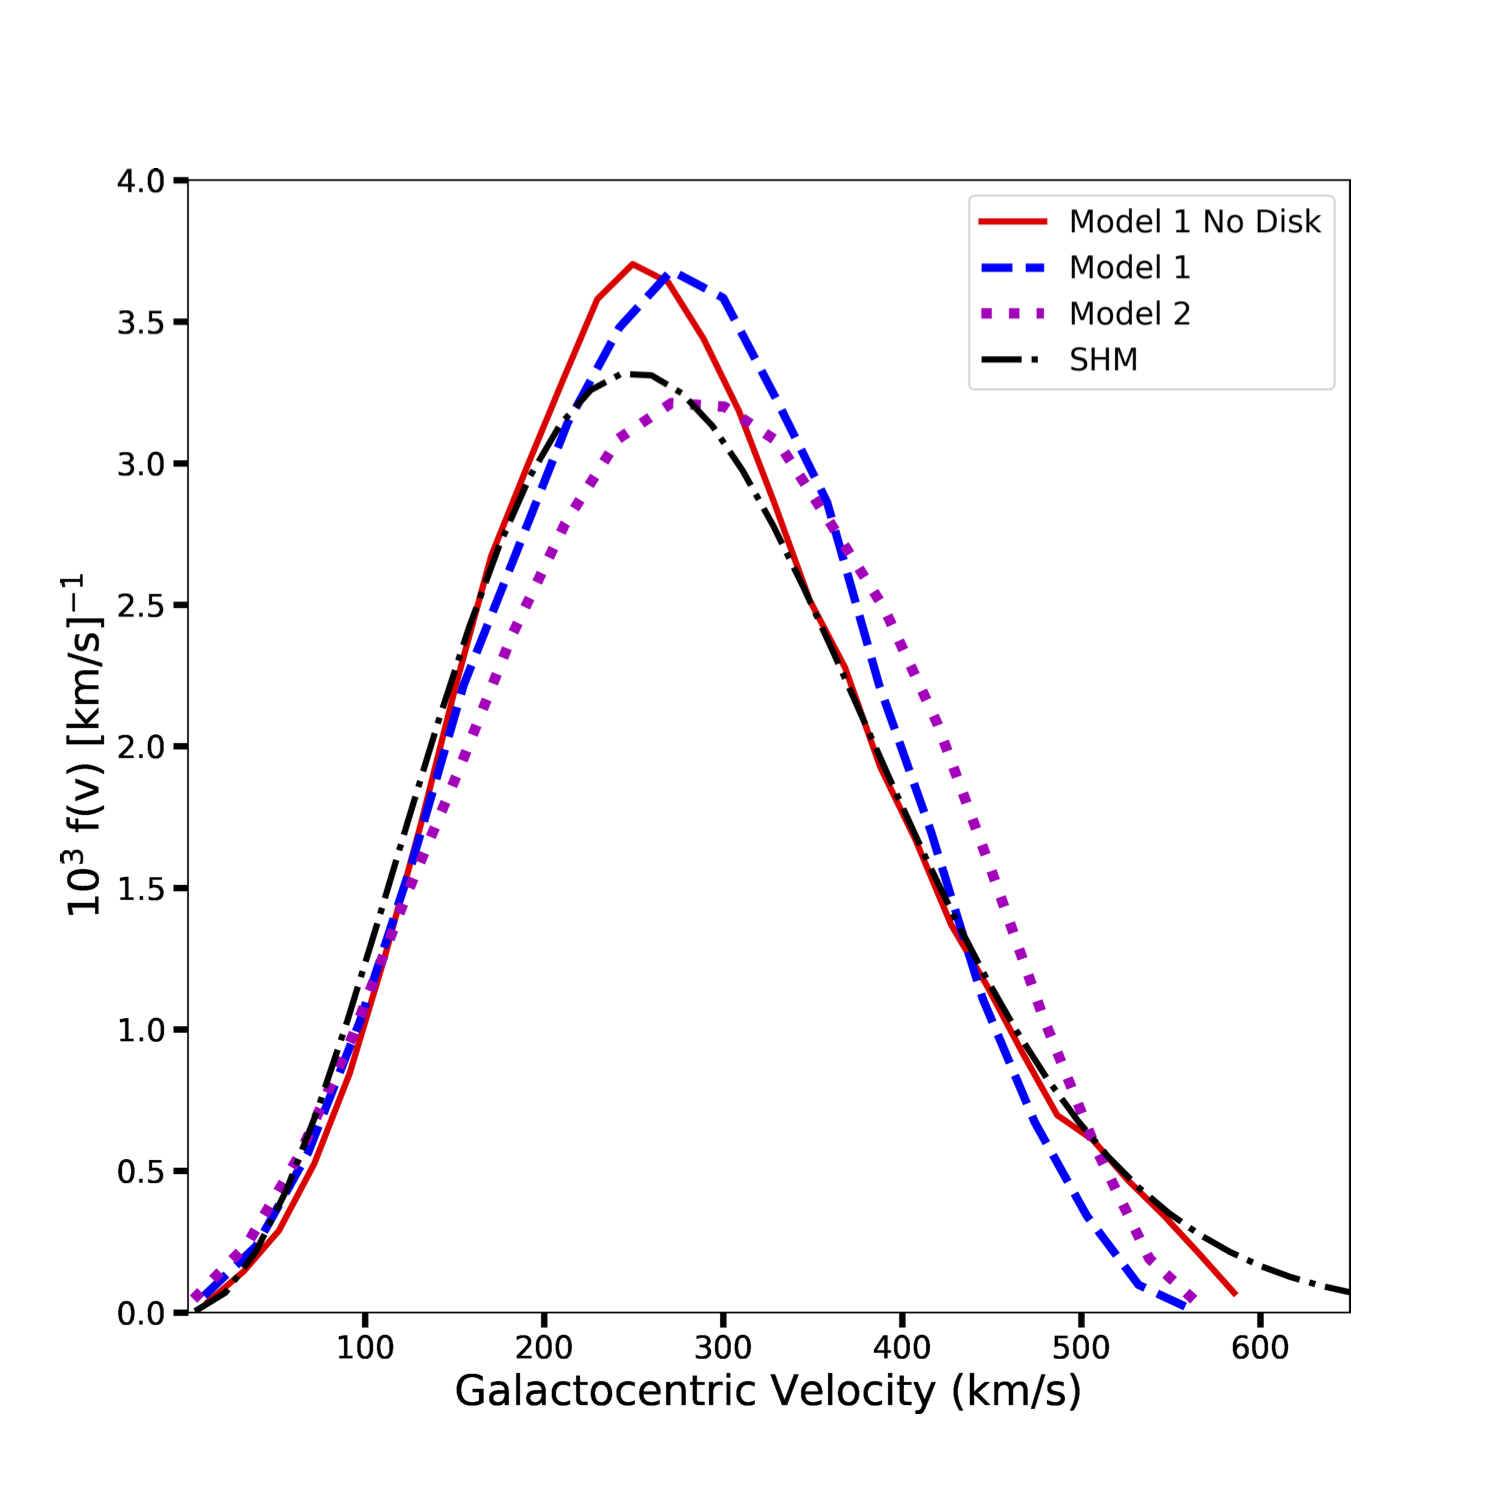
Both the velocity anisotropy profile and the inclusion of a stellar disk/bulge impact the kinematics of DM particles in the Solar Neighborhood. This is illustrated in Figure 1, which shows the normalized distribution function of Galactocentric speeds, :
| (3.3) |
of all DM particles selected within a thick ring (6 kpc in both width and thickness), centered at the Solar radius of 8.3 kpc. Results are shown for three different MW halos: Model 1, Model 2, and Model 1 initialized without a disk or bulge.
Plotted for reference is the 1D speed distribution function for the Standard Halo Model (SHM), which has isotropic dispersions and is described by a Maxwell-Boltzmann distribution:
| (3.4) |
The value of the 1D velocity dispersion ( km/s) is computed from the motions of DM particles in the Solar Neighborhood within Model 1, initialized without a disk. Note that the SHM speed distribution, , is usually truncated at an escape speed of 500-600 km/s (e.g., as measured by the RAVE survey [85]), but we do not do this here to provide a point of reference for the high velocity tail.
The SHM model corresponds to a collisionless isothermal density distribution, with (see Ref. [86]). Unsurprisingly, the SHM model is not a good fit to the kinematics of the DM halo in Model 1 (red solid line), which is modeled as a Hernquist density profile. In general, self-consistent, stable models of cuspy DM structures do not have a locally Maxwellian velocity distributions [87].
Additionally, Figure 1 illustrates that the discrepancy between the SHM model and the modeled MW increases when a stellar bulge and disk is included in Model 1 (blue dashed lined) and when the halo kinematics are not isotropic, as in Model 2 (magenta dotted).
3.3 The LMC Model
The LMC is modeled using a Hernquist DM halo of mass M M⊙. This is the highest LMC mass model explored in G19 (their model LMC4; see their table 2). This LMC model is consistent with cosmological expectations of LMC analogs that host SMC-mass companions (see § 2). In § 6.1 we study the validity of our results in lower mass LMC models (G19 models LMC3 and LMC2).
The initial orbital parameters for the LMC are chosen such that its simulated present day position and velocity are within 2 of the observed values 2 Gyr after first crossing the MW’s virial radius [58]. The LMC’s orbital plane is roughly confined with the YZ Galactocentric plane, where the LMC reached its pericentric approach of 48 kpc, 50 Myr ago. The fiducial simulations used in this study thus correspond to Simulations 4 and 8 in G19 (see their table 3). In the following we track the present day positions and velocities of DM particles that were initially bound to the LMC at infall but now reside within the Solar Neighborhood.
3.4 Defining Motions in the Solar Neighborhood
We identify particles representative of motions in the Solar Neighborhood as having Galactocentric positions:
| (3.5) |
where the position of the Sun is ()= (-8.3, 0, 0.027) kpc. There are MW DM particles in this volume in both Model 1 and Model 2 before the LMC crosses the virial radius of the MW 2 Gyr ago. Note that because the flow of LMC particles is not uniform throughout the disk, we do not consider the motions of particles within an annular ring centered at the Solar radius, in contrast to 3.2. The local MW DM density in this volume is 0.4 Gev/cm3 for both Models 1 and 2.
We acknowledge that the height of the defined Solar Neighborhood (3 kpc above or below the disk midplane) is large. This choice was made to maximize the number of LMC particles in the volume, given the resolution of the G19 simulation. On average, high speed LMC and MW DM particles ( 800 km/s with respect to the Earth) are roughly evenly distributed at all distances above or below the disk midplane (LMC high speed particles have a median height of 1.0 kpc from the disk midplane in the defined volume). As such, we are not averaging over local effects that would bias the expected velocity distribution of LMC particles in a smaller volume.
We compute the motion of LMC and MW particles in the Solar Neighborhood utilizing two different coordinate systems:
-
1.
Galactocentric Coordinates: A reference frame defined relative to the Galactic center. Because the MW and LMC are both modeled as live systems, the MW’s center of mass (COM) will move in response to gravitational forces from the LMC [88]. We account for this motion by computing all particle velocities with respect to the MW COM. In this coordinate system, the LMC is currently moving predominantly in the -Y direction (opposite to the velocity vector of the Sun).
-
2.
Earth Frame Coordinates: A reference frame defined relative to the position of the Earth. Particle velocities are corrected for both the motion of the Local Standard of Rest (LSR)222Our results are insensitive to the exact value of the LSR. The LSR motion is removed from the LMC’s observed velocity vector, measured with respect to the Sun [58], in order to compute the simulations in a Galactocentric frame. However, we then add back the LSR motion to carry out the calculations presented in this work. and the peculiar motion of the Sun. These are defined in Galactocentric coordinates following Schonrich:2010 [89] and McMillan:2017 [79]:
(3.6) To account for the annular motions of the Earth about the Sun, we follow equation 4.9 and 4.10 in Ref. [32] (see also Refs. [19, 90]).
Results presented in the Earth Frame thus account for both the motion of the Local Standard of Rest, the peculiar motion of the Sun and the annular motions of the Earth averaged over the year, unless otherwise indicated (e.g., at the end of §4 and §5). Because the LMC is currently moving in the opposite direction of the Sun, its DM particles will flow through the Solar Neighborhood in roughly the same direction as that of the MW halo particles.
4 Results: DM Motions in the Vicinity of the Sun
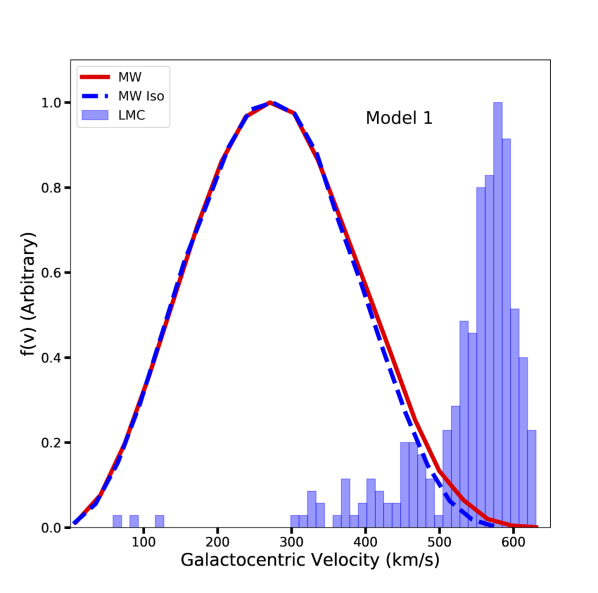
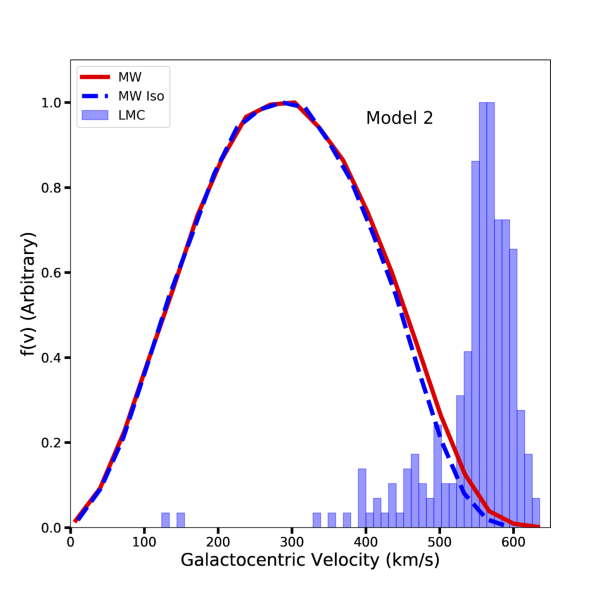
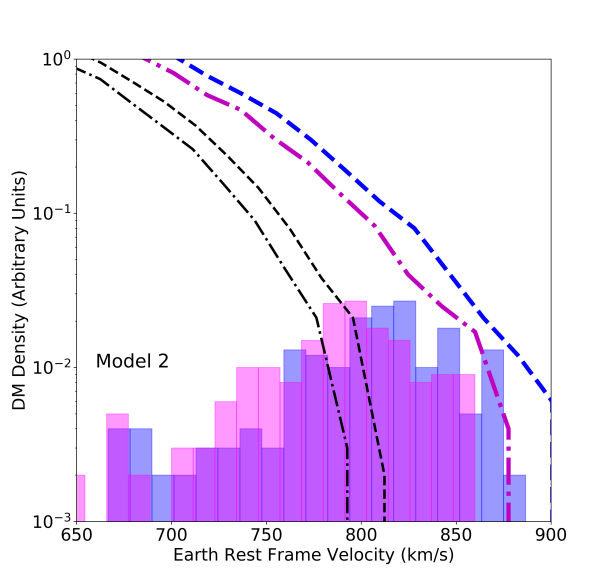
In Figure 2, we show the DM speed distribution in the Solar Neighborhood, with the inclusion of the LMC, in Galactocentric coordinates. We illustrate the speed distributions of MW DM particles for the two different MW models, before (blue dashed line) and after (red solid line and blue histogram) the LMC is introduced. DM particles from the LMC alone (not MW particles perturbed by the LMC’s passage through the disk) are shown with the histogram. Each distribution is normalized to peak at 1.0.
The speed distribution of LMC particles is striking. The RAVE survey finds that the 90% confidence range for the local escape velocity is 492 km/s587 km/s in the Galactocentric frame [85]. However, LMC particles are moving predominantly at 550-640 km/s — higher than, or at the same speed as, the local escape speed. Because the LMC is coming in for the first time, its contributing particles are not in equilibrium and can be moving at high speeds. Comparing the two panels of Figure 2, we find that the resulting LMC particle kinematics are the same in both Model 1 and Model 2 (median velocity of 570 km/s). This is by design as the LMC mass model and orbit is the same in both cases.
While LMC particles comprise a small fraction (0.2%) of particles in the Solar Neighborhood, they dominate the high speed tail - 70% of DM particles with geocentric speeds km/s originate from the LMC. Furthermore, the LMC also impacts the kinematics of MW halo particles, an effect which extends beyond the Solar Neighborhood, affecting stars as well as DM in the MW halo [57]. As the LMC passes near the MW disk, it accelerates DM particles to higher speed, such that the local MW DM velocity distribution skews to higher speeds (red solid line in Figure 2). 20% of DM particles moving at geocentric speeds km/s either originate from or are accelerated by the LMC, together augmenting the local DM density distribution by 5%.
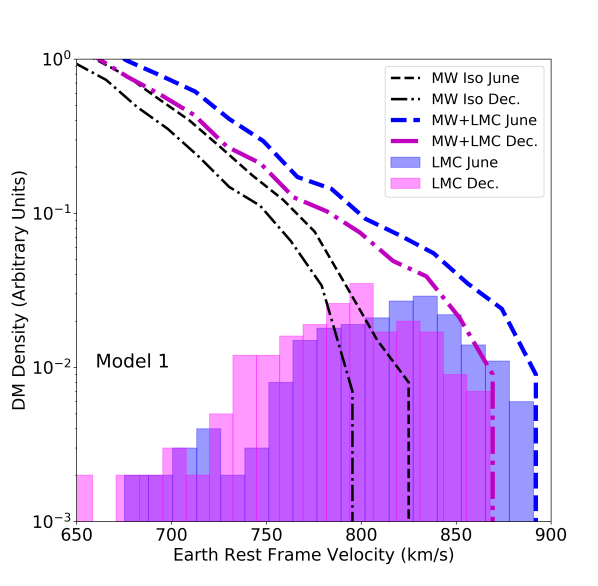
The relative contribution of LMC particles to the high-speed tail compared to the acceleration of MW particles by the LMC is illustrated more clearly in the Earth Frame Coordinate system (§3.4) in Figure 3. In that Figure, we focus on geocentric speeds greater than 650 km/s. The inclusion of the LMC clearly skews the velocity distribution to higher velocities, boosting particle speeds to as high as 900 km/s in June and 875 km/s in December. We will return to this point in the discussion of annual modulation of direct-detection signals in §5. Such speeds are not exhibited by MW particles prior to the arrival of the LMC (lines marked as MW Iso). As such, all of the highest speed particles in the Solar Neighborhood (near or above the escape speed) either originate from the LMC (60-100%) or are MW particles that have been accelerated to high speeds by the LMC. This statement follows from the LMC’s unique status as the only known substructure on first infall that can also impact the Solar Neighborhood, enabling DM particles to reach speeds near or exceeding the local escape speed.
Table 1 lists the DM density in the high speed tail originating from either the LMC or the MW (Model 1 or 2, before, MWIso, and after the LMC is accreted; columns 3-6). The inclusion of the LMC increases the amount of DM at Earth Frame velocities greater than 800 km/s by factors of 4-11 relative to the MW in isolation and by factors of 2 in June vs. December (column 7). For Model 1, the highest-speed particles come from the LMC, but for Model 2, the high-speed population has a higher contribution from accelerated MW halo particles (column 8). This result is consistent with the stronger halo response to the LMC’s passage found by G19 in Model 2 – i.e. the density enhancements in the Transient and Collective Responses in Model 2 are larger than in Model 1. Finally, all DM particles moving at geocentric speeds higher than 850 km/s either originate in or are accelerated by the LMC.
MWIso refers to the MW before the LMC arrives.
| Model | Speed (km/s) | MWIso | MW | LMC | MW+LMC | ||
|---|---|---|---|---|---|---|---|
| 1 | VJune | 1.9 | 8.3 | 8.3 | 16.7 | 9.0 | 0.50 |
| 1 | VDec | 0.93 | 3.2 | 6.5 | 9.3 | 11.0 | 0.35 |
| 1 | VJune | 0.0 | 0.93 | 3.2 | 4.2 | - | 0.77 |
| 1 | VDec | 0.0 | 0.0 | 0.93 | 0.93 | - | 1.0 |
| 2 | VJune | 4.7 | 13.0 | 6.9 | 20.0 | 4.3 | 0.35 |
| 2 | VDec | 1.9 | 6.0 | 4.7 | 10.6 | 5.8 | 0.43 |
| 2 | VJune | 0.0 | 1.4 | 2.3 | 3.7 | - | 0.63 |
| 2 | VDec | 0.0 | 0.46 | 0.93 | 1.4 | - | 0.67 |
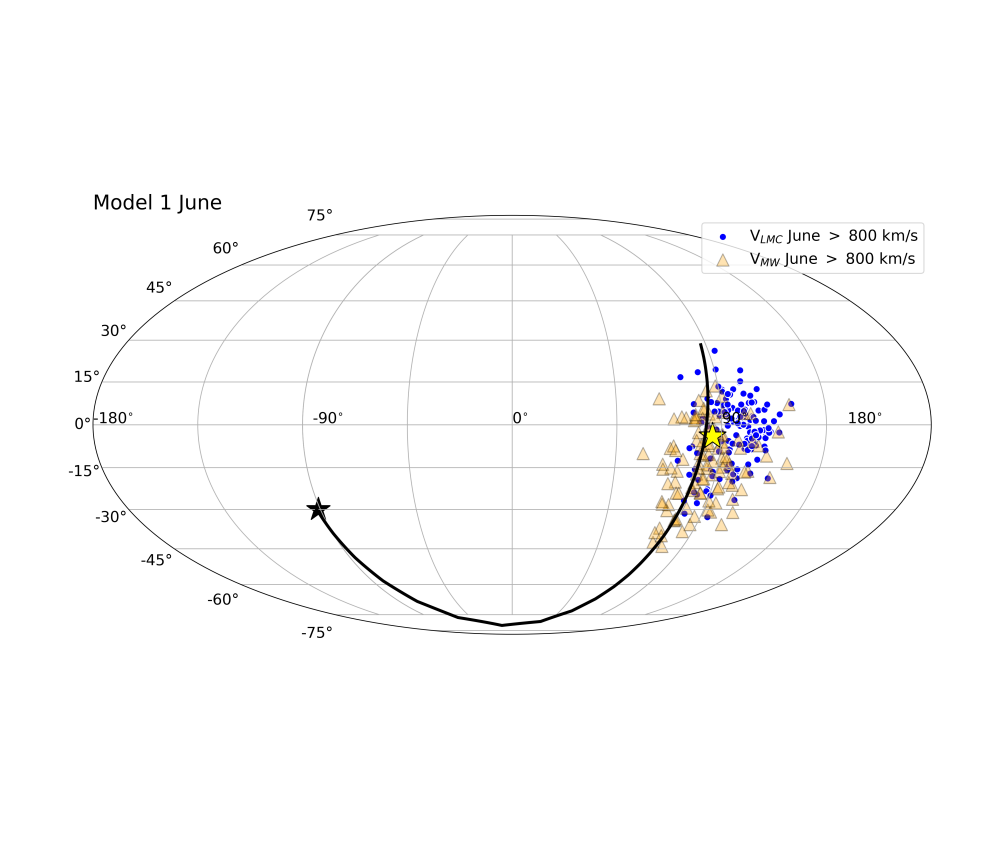
We can also show the direction from which the particles entered the Solar Neighborhood in the Earth Frame Coordinate system, which is of interest for directionally sensitive experiments [91]. Figure 4 illustrates the trajectories of high-speed DM particles in the Solar Neighborhood ( 800 km/s in Earth Frame Coordinates) projected on Mollweide equal-area plots of the sky at two different times of year. Trajectories are computed as the negative of the Earth Frame velocity vector of each DM particle, thus indicating the direction from which they originate. Results are presented for MW Model 1 and are similar for Model 2.
Particles at these high speeds primarily originate within or are accelerated by the LMC (Table 1), as such their motions reflect the direction of motion of the LMC at closest approach. This direction is coincident with the reflex motion of the Sun, indicated by the yellow star, explaining why the LMC has such a dramatic effect on the local velocity distribution at high speeds. If we attempted this experiment on the opposite side of the MW’s disk, where the LMC’s motion would be opposite the reflex motion of the Sun, the speeds would be roughly 240 km/s lower than we find here.
Although the LMC boosts the density of high-speed DM in the Solar Neighborhood, the arrival direction is approximately the same as (although somewhat more southerly than) the highest speed particles in the SHM. The arrival direction is little changed between the times of maximal (June) and minimal (December) relative speed of the Earth with respect to the Galactic halo, although the density of particles is higher in the former case (top vs. bottom panels in Figure 4). Interestingly, the arrival direction is distinct from other kinematic stellar substructures observed in Gaia [14].

5 Implications for direct-detection limits
We consider the implications of the LMC’s presence in the MW for WIMP direct-detection specifically, although the results from § 4 may also be applied to direct searches for other DM candidates. For concreteness, we consider only spin-independent elastic scattering off nuclei, although our results generalize to other types of interaction with nuclei or electrons.
For spin-independent interactions, the expected differential event rate is
| (5.1) |
the number of events in the experiment per unit time per unit recoil energy . We assume that the local phase-space density can be represented by the multiplication of the DM particle number density (the local mass density divided by the WIMP particle mass ) and utilize the three-dimensional velocity distribution in Earth Frame Coordinates. We assume that the experiment has a set of isotopes , and that there are target nuclei of isotope in the experiment, each with mass . The efficiency for an experiment to detect nuclear recoils of energy is . For a WIMP to scatter a nucleus to energy , the WIMP must have a minimum speed
| (5.2) |
where is the reduced mass of the nucleus-WIMP system. The elastic scattering cross section is
| (5.3) |
where is the interaction cross section in the limit of no momentum transfer, and is the form factor (taken to be the Helm form factor [92] in this work).
In order to benchmark experiments against each other, it is useful to express Eq. (5.1) in terms of the WIMP-proton cross section and to isolate the universal velocity dependence of the integral from other variables that depend on experimental specifics or WIMP mass. If the WIMP interacts equally strongly with protons and neutrons, then
| (5.4) |
where is the reduced mass of the WIMP-proton system and is the atomic number of the isotope. The mean inverse speed is
| (5.5) |
and hence, Eq. (5.3) can be re-written as
| (5.6) |
Modulo the form-factor suppression represented by , the energy spectrum of events follows the mean inverse speed function . In Figures 5 & 6, we show how the presence of the LMC alters , averaged over a year. The MW’s mean inverse speed before the LMC is added is denoted by the dashed black line, labeled “MW Iso”. To separate the effects of the acceleration of MW particles by the LMC (red line) from particles of LMC origin, we plot both the mean inverse speed of LMC particles (dot-dashed purple) and of the MW + LMC system (dashed blue line). The 3D velocity distribution function for each line is normalized to unity; in practice, the total event rate scales with the dark matter density in each component . In the bottom-left panel, we show the ratio of the MW mean inverse speed to that of the MW Iso model, and the ratio of the mean inverse speed of all particles in our simulated Solar Neighborhood model to the MW Iso initial conditions. For reference, we show the corresponding to the minimum nuclear recoil energy thresholds for various experiments assuming a 10 GeV WIMP, taking the threshold explicitly indicated in papers or the recoil energy corresponding to a detection efficiency .
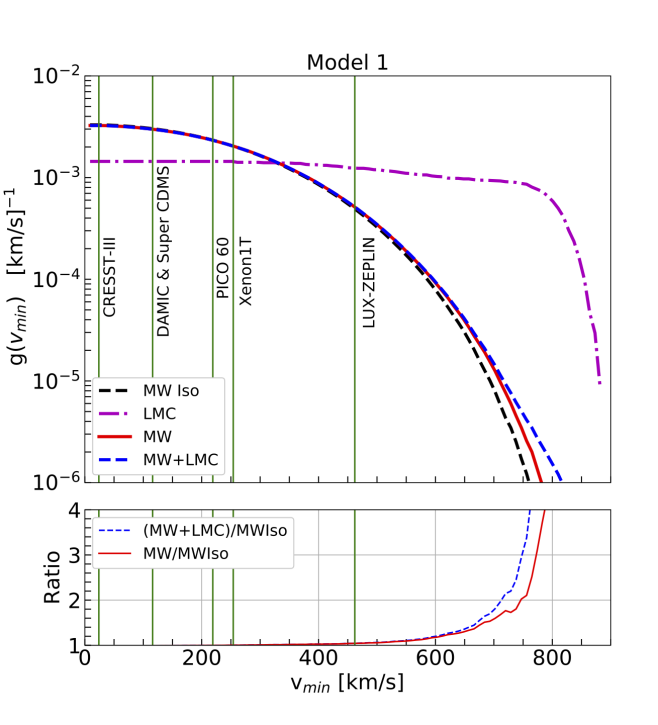
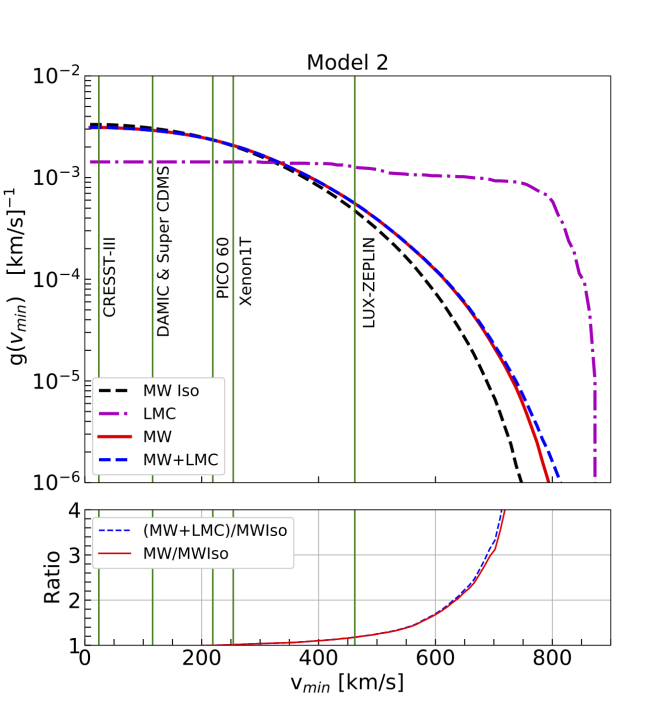
The LMC is found to increase the both by accelerating MW particles and also by contributing high-speed DM particles. Because the LMC particles are dominantly near the escape velocity from the MW, the mean inverse speed is high (dot-dashed line), and the energy spectrum is hard. However, the percentage of Solar Neighborhood particles originating in the LMC is relatively small, and the bigger effect of the LMC on the mean inverse speed function is the acceleration of MW particles by resonances induced in the halo by the LMC, until the LMC becomes dominant for speeds above 750 km/s. This is most visible in the bottom left panels of Figures 5 & 6, where we examine the ratio of of Solar Neighborhood particles (either with or without the LMC particles) after the LMC’s passage relative to the isolated MW. Above a geocentric speed of 600 km/s (close to the threshold for S1 + S2 analyses of xenon nuclear recoil analysis for a 10 GeV WIMP), the LMC’s passage leads to a 25% enhancement of the signal in Model 1, and nearly a factor of 2 change for Model 2. Especially for Model 2, the MW response to the LMC passage leads to a large enhancement in , which increases sharply to factors of a few beyond km/s. Above the escape speed from the MW ( 750-800 km/s in Earth Frame Coordinates; Figure 3), the ratio is undefined, and the LMC dominates the signal.
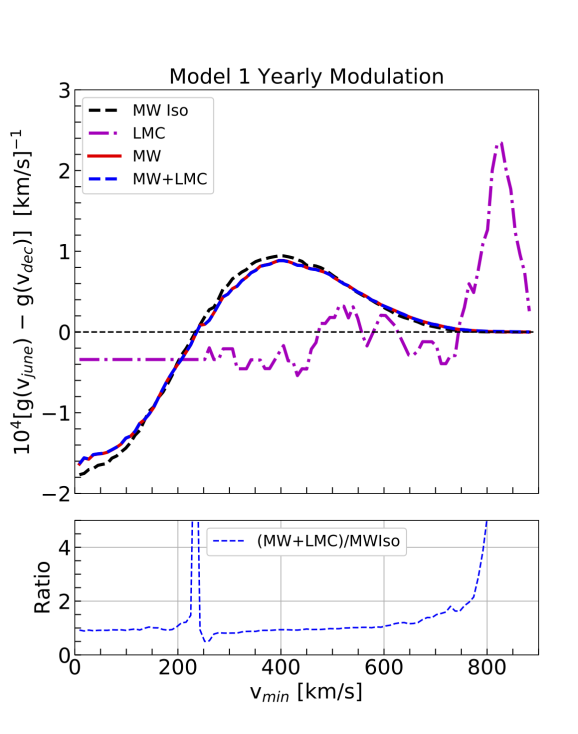
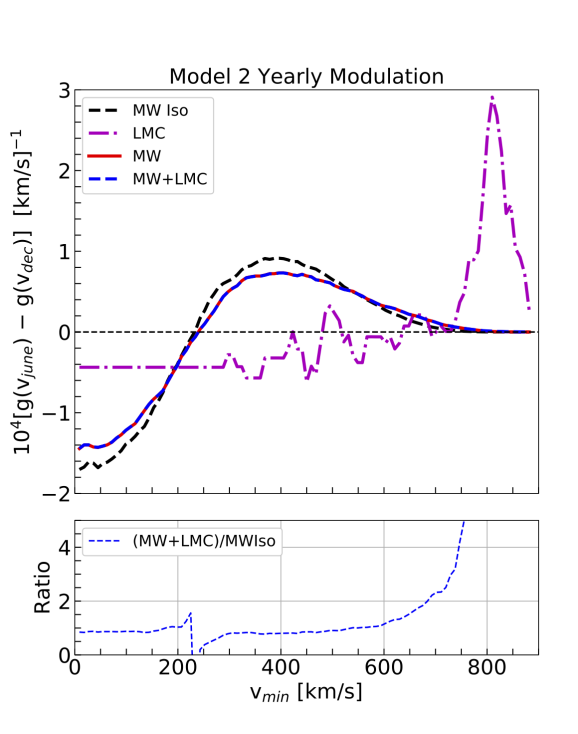
Before we describe the key effect of the LMC on WIMP direct-detection – the tightening of exclusion curves at low WIMP mass – we highlight the effect of the LMC on the direct-detection annual modulation signal. In the right-hand panels of Figures 5 & 6, we show the difference in at the two dates at which the isolated MW has its extrema. The relative speed between the DM and the Earth is highest in June and lowest in December, leading to an excess of high-speed particles ( km/s) in June and low-speed particles in December (see also Figure 3). The difference in is proportional to the amplitude of the annual modulation of the direct-detection recoil spectrum.
Because the LMC leads to a boost in highest-speed particles (both of LMC origin and MW particles accelerated by the passage of the LMC), the post-LMC-impact annual modulation of largely follows that of the isolated MW below speeds of 600 km/s for both the isotropic (Model 1) and anisotropic (Model 2) MW cases. There is a slight shift in the zero point of the annual modulation amplitude, as indicated by the sharp excursions around 200 km/s in the bottom right panels of Figures 5 & 6. Above 600 km/s, the annual modulation amplitude rises significantly relative to the isolated MW case. This pattern of annual modulation amplitude as a function of is unique to the LMC, as other dark-matter substructures have different shapes and annual modulation amplitudes [90].
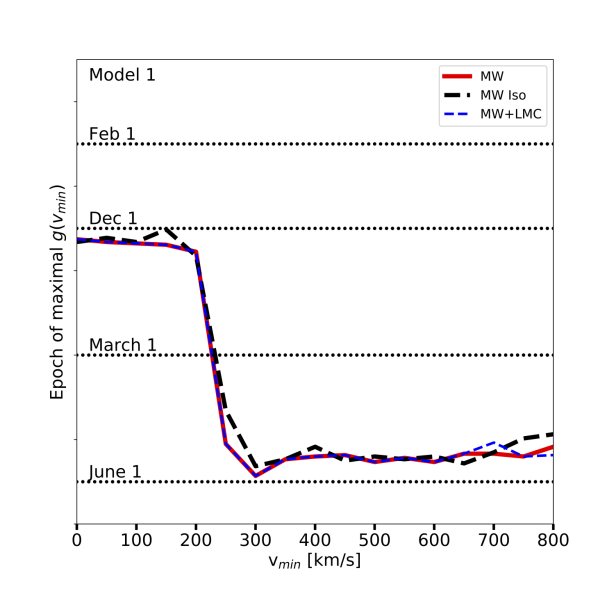
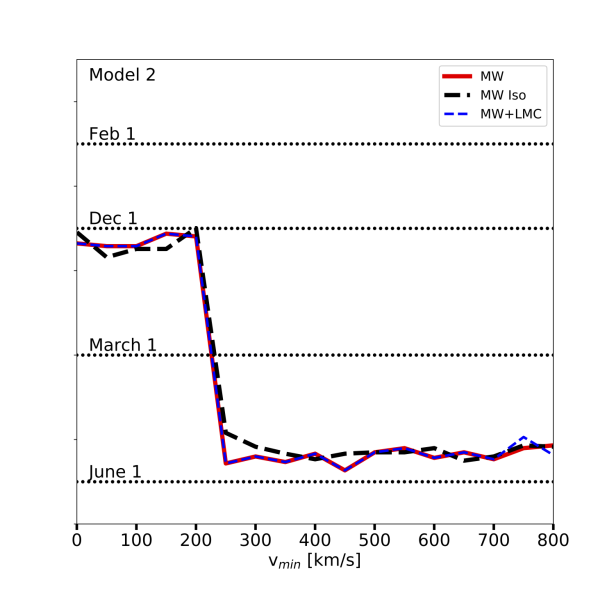
Because the LMC’s velocity vector is almost exactly anti-parallel to the Sun’s motion, the phase of annual modulation largely mimics that of the isolated MW, unlike other possible DM kinematic substructures. This point is illustrated in Figure 7, we show the date at which is maximized as a function of . We have included the effect of the relative speed of the Earth with respect to the local WIMP population, but not gravitational focusing, which shifts the phase for speeds km/s [100], below the speeds of LMC and LMC-induced MW accelerated particle populations. Thus, the Figure shows that the signature of the LMC in annual modulation measurements lies not in its phase but in its amplitude.
The key effect of the LMC on direct-detection experiments is to extend the reach of those experiments to lower WIMP mass. The existence of a low-energy threshold implies that there is a minimum WIMP mass to which experiments are sensitive, given a fixed speed distribution. Figure 8 illustrates the resulting limits on the spin-independent DM-nucleon scattering cross section at low DM particle mass compared to that assuming an isolated MW. In this figure, the limits correspond to the results from the Xenon-1T 1 ton-year exposure result [93]. We translate the experimental limit from that work to more general forms of the WIMP speed distribution function according to the method of Ref. [48]. The presence of the LMC causes the cross-section limits to shift downward and to lower WIMP masses. Importantly, the effect is independent of the assumed MW dark matter velocity anisotropy at the lowest masses.
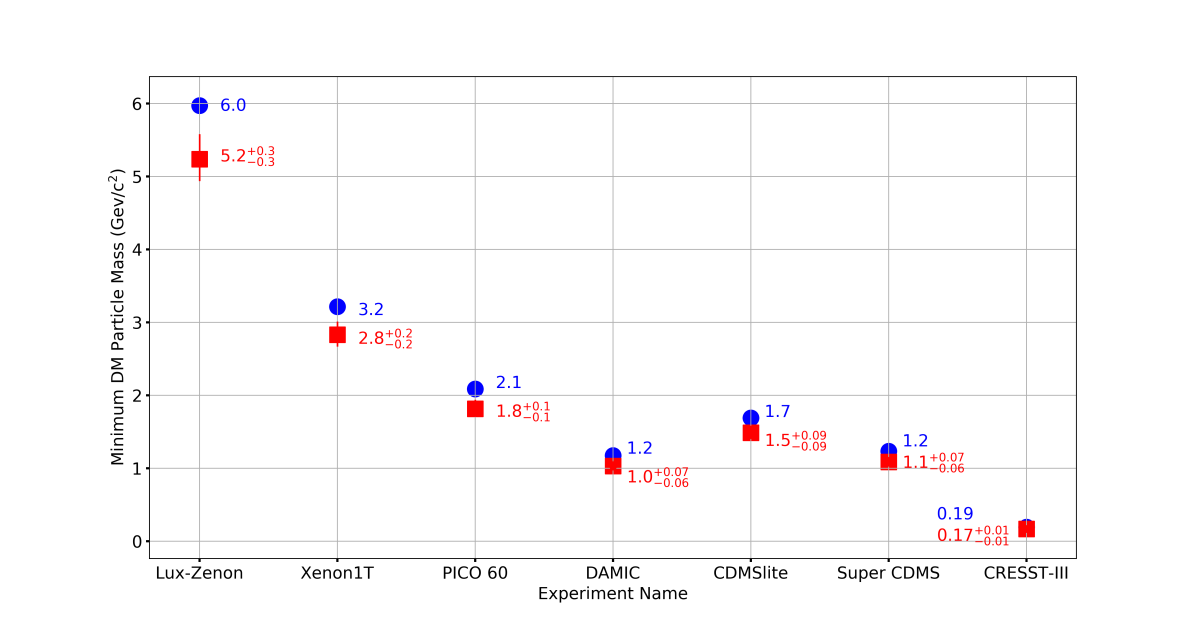
Because of the high-speed WIMP population induced by the LMC, the cross section limits can be significantly lower for low-mass WIMPs (by over an order of magnitude) than expected when the LMC is neglected. Furthermore, some experiments are more sensitive to low-mass WIMPs than they currently claim to be. This is illustrated for specific experiments in Figure 9, where we compare the WIMP mass that may be probed with DM at the MW escape speed relative to the lower WIMP mass that is accessible because of the LMC-induced high-speed tail in the Solar Neighborhood.

6 Discussion
In this work, we have shown that the LMC is responsible for the high-speed tail of the WIMP velocity distribution in the Solar Neighborhood, and that this extends the reach of direct-detection experiments to lower WIMP mass and lower cross section. In this section, we discuss our findings in the context of the uncertainty in the LMC’s and MW’s total DM masses, and in recent work in reconstructing the Solar Neighborhood WIMP phase-space density using the stellar halo.
6.1 Impact of Uncertainties in the LMC and MW Mass and Orbit
In this study we have utilized a massive LMC halo model with infall mass of M⊙. Here, we explore the impact of the uncertainty on the LMC’s and MW’s halo masses on our results.
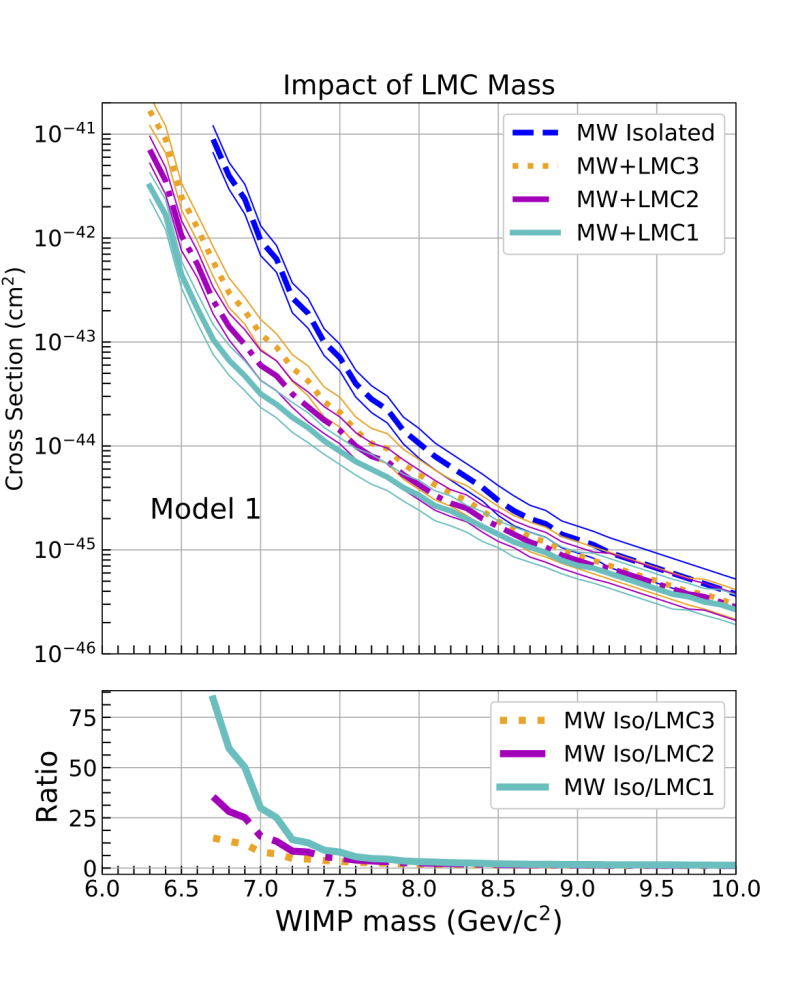
We include three different LMC infall halo mass models, as introduced in G19: M⊙ (LMC3), M⊙ (LMC2), M⊙ (LMC1; Fiducial). These LMC mass models encompass a representative range for the expected mass of the LMC prior to entry within the virial radius of the MW 2 Gyr ago (see discussion in G19 and §2). Note that all results presented in prior sections have focused on a fiducial (LMC1) mass model.
The top panel of Figure 10 illustrates the resulting cross section for each LMC model using MW Model 1. The bottom panel illustrates the ratio of these cross sections to the MW in isolation. The cross section is impacted at low DM masses in all cases – general trends are the same provided the LMC mass at infall is at least M⊙. The change in cross section owes to the increased number of LMC particles in the Solar Neighborhood as a function of increasing LMC infall mass. The normalized speed distribution of LMC particles does not change significantly with increasing LMC mass, rather, there are simply more particles at all speeds. For example, LMC1 has roughly a factor of 10 more particles at speeds in excess of 850 km/s than LMC3.
Note that adopting a different density profile for the LMC’s DM halo at infall can also change the amount of LMC particles in the Solar Neighborhood. The NFW density profile, for instance, falls off less rapidly than the Hernquist profile with distance, which would increase the amount of LMC particles. This may allow for lower LMC infall masses than studied here. Our results assume that, at a minimum, the LMC’s halo extends for 50 kpc (which is true for all three LMC models explored in this study). This enables the LMC’s halo to overlap with the Solar Neighborhood at the present day, regardless of the slope of the profile.
In contrast, the number of accelerated MW particles does not change significantly with increasing LMC mass. This is consistent with the behavior of the halo response to the LMC’s orbit, which does not change in amplitude as a function of LMC mass at Galactocentric distances 70 kpc (see right panel of G19 Figure 25). The MW particles accelerated by the LMC are an important contributor to the high speed tail - their properties appear to be independent of the exact LMC profile.
The direction of motion of LMC particles in the Solar Neighborhood is dependent on the velocity vector of the LMC at closest approach to the MW (48 kpc), which is model-independent. In other words, changing either the mass or density profile of the LMC or MW’s halo does little to change the distance, velocity vector or timing of the LMC’s closest approach [58, 102]. Calculations presented here about the impact of LMC particles to the Solar Neighborhood are thus robust to uncertainties in the orbit of the LMC, as these are negligible over the past 1 Gyr [56].
The total DM mass and density profile of the MW may impact the amplitude of the halo response to the passage of the LMC. Luckily, both are well-constrained by the rotation curve within 20 kpc. As demonstrated by the exercise of changing the LMC mass, changes in the amplitude of the halo response at large scales, 50 kpc, do little to impact the halo response in the inner halo (G19). More significant are uncertainties in the velocity anisotropy profile, which change the initial velocity distribution in the Solar Neighborhood before the LMC arrives. We have studied this effect in our analysis of Model 1 and Model 2, finding that a radially biased velocity distribution can promote the acceleration of MW particles. Note that changing the nature of the DM particle (e.g. “fuzzy DM” vs. cold dark matter) may change the MW’s halo response (see discussion in G19), and is the subject of future work.
6.2 DM contribution of known substructure and debris flow vs. the LMC to the Solar Neighborhood
In addition to the virialized component of the MW halo (stellar and DM), several other un-phase-mixed structures certainly contribute to the distribution of stars in the Solar Neighborhood, and perhaps also to the DM. These non-equilibrium structures – gravitationally bound satellite galaxies and subhalos, narrow streams of dissolved satellites, and the spatially coherent but kinematically unmixed “debris flow” particles from dissolved or dissolving satellites [26] – may all lead to unique kinematic signatures in direct-detection experiments. In this section, we place the LMC’s implications for direct-detection experiments in this context, and how various authors infer properties of the Solar Neighborhood DM phase-space density based on stellar signatures of disequilibrium in the MW halo. We note that in our work, in addition to the LMC’s DM debris, there is also a contribution from MW DM halo particles that have been accelerated through a Collective Response of the halo to the passage of the LMC [57]. These accelerated particles are distinct from the traditional definition of debris flow.
The most famous non-equilibrium structure is the Sagittarius dwarf spheroidal galaxy (Sag dSph). This galaxy is moving in an orbital plane orthogonal to the MW’s disk, perpendicular to that of the LMC. It has two massive stellar streams wrapped completely around the MW [37, 103, 104]. The associated stellar and DM debris stream is expected to exhibit speeds of 400-500 km/s [46] with respect to the Earth (see also Ref. [90, 45], who find stream debris to contribute at 350 km/s). These authors find that the SHM is insufficient to describe the non-Maxwellian velocity distribution caused by Sag dSph and that the presence of Sag dSph may reduce the amplitude of the annual modulation of the event rate by as much as factor of two. Furthermore, Ref. [46] find that although Sag dSph may contribute more to the Solar Neighborhood DM density than the LMC does ( vs ), the debris enhances event rates by only because the speed distribution of Sag dSph particles lies close to the peak of that of the overwhelmingly dominant MW population. Thus, even though the LMC contributes less to the Solar Neighborhood DM density than Sag dSph does, the high-speed nature of LMC and LMC-accelerated MW particles leads to a much stronger enhancement of events in direct-detection experiments relative to isolated MW predictions in the relevant energy window.
Recently, multiple authors have identified additional stellar substructures within the inner halo of the MW. These data are consistent with a scenario in which our Galaxy has undergone one or two substantial merger events 9-10 Gyr ago: 1) Gaia-Sausage, characterized by radially anisotropic stellar debris [40] ; 2) retrograde stars, such as the S1 stream and remnants of the Sequoia dwarf galaxy [41]; 3) Gaia-Enceladus debris that likely consists of both Gaia-Sausage stars and the retrograde components of Sequoia [38, 39]; and 4) the prograde stream Nyx [43]. These features lie somewhere in the continuum of distinct streams and debris flow.
These substructures suggest that the local DM halo is not in equilibrium and will deviate from SHM [48]. In particular, the kinematics and distribution of Gaia-Sausage stars are best matched by the disruption of a system on a radial orbit, resulting in a strongly radially anisotropic velocity distribution of stars in the solar neighborhood, which may have implications for directional direct-detection experiments [14]. The Gaia-Sausage and other debris-flow material may contribute at the level to the Solar Neighborhood DM density, but the velocity distribution of stars associated with the Gaia-Sausage populate speeds of 500 km/s [40, 14, 13], much lower than the expected LMC debris flow.
The highest energy stars in the halo are typically retrograde [42, 105, 106, 107], suggesting these stars were accreted through past mergers [108, 109, 110, 111]. The S1 Stream is also a retrograde structure and Ref. [41] suggest a common link with a single dwarf galaxy progenitor, Sequoia, which was potentially accreted 9 Gyr ago, bringing 1010 M⊙ worth of DM. The retrograde S1 stream is estimated to be significant at speeds of 450-650 km/s with respect to the Earth [49, 47], causing an excess for recoil energies at km/s.
While the kinematics associated with all of the listed substructures are expected to cause deviations in the local debris flow from a Maxwellian distribution, none of these structures impact the velocity distribution at Earth-frame-speeds as high as those expected for the LMC debris flow (700 km/s). In fact, the DM distribution inferred from SDSS-Gaia DR2 suggests that there are far fewer high-speed particles than expected from the SHM [48]. The LMC is thus expected to be the most significant contributor to the high-speed local DM debris flow.
The inferences about Solar Neighborhood DM substructure based on the kinematic substructure in stellar halo stars depends on the assumption that stars trace the kinematic structure of DM. Indeed, Ref. [14] and others argue that the Solar Neighborhood DM can be modeled with the SHM with the addition of DM associated with stellar substructures. Ref. [13] suggest that the strongest correlation between stars and DM exists for the relaxed component of the halo and the debris flow. However, relating the stellar and DM components of unmixed and dissolving substructures is less straightforward [112]. DM halos are vastly more extended than the stellar component of satellite galaxies, and typically at least 90% of dark matter must be tidally stripped before the stars are touched [113]. Thus, in detail, some of the inferences of DM kinematic substructure in the Solar Neighborhood may change as we understand the relative kinematics of stars and DM in disrupting massive satellites [48, 112].
Significantly, relying on stars to trace DM in the Solar Neighborhood misses any DM component arising from satellites whose stellar component is intact, like the LMC’s. The LMC contribution to the local DM debris flow will not have a stellar counterpart – LMC DM particles are from the outskirts of its halo ( 50 kpc from the center of the LMC). Furthermore, no simulated MW stellar disk particles in the Solar Neighborhood reach geocentric speeds in excess of 750 km/s at the present day. This is because the kinematics of MW stellar disk particles in the Solar Neighborhood are not affected by the resonances that impact the DM halo, such as the Collective Response (G19). Note, however, that the outer stellar disk of the MW (15 kpc) is impacted by the LMC, inducing a pronounced warp [62]. Similarly, we do not expect the LMC to dramatically alter the local kinematics of a “dark disk” of DM that is kinematically similar to the stellar disk (whether it be of accretion origin [114] or a result of strong dissipation in the hidden sector [115]).
Thus, the kinematic structure in the Solar Neighborhood arising from the LMC is unique – it cannot be traced by stars, and its super-escape-velocity average speed is much higher than any other known component of the Solar Neighborhood.
7 Conclusions
A positive detection of DM interactions in a laboratory is the holy grail of particle physicists. Of particular interest for the WIMP/CDM paradigm is a detection of Galactic DM as it passes through underground laboratories. The next generation of multi-ton direct-detection experiments will test conventional WIMP-nucleon interaction cross sections down to the irreducible background of solar and atmospheric neutrinos [116].
In this study, we utilize a suite of controlled simulations of the recent infall of a massive ( M⊙) LMC into the MW’s DM halo to study the resulting velocity distribution of DM particles in the Solar Neighborhood [57]. These simulations account for three effects simultaneously: 1) the MW’s disk potential; 2) the DM halo velocity anisotropy profile; and, for the first time, 3) the presence of a massive LMC on first infall [54, 117].
We find that the high-speed tail of the local DM distribution is overwhelmingly of LMC origin – both as particles that were once bound to the LMC and MW halo particles that have been accelerated owing to halo resonances induced by the motion of the LMC [57]. The general trends we report below require that the LMC mass at infall is at least M⊙, as expected from CDM cosmology. Although, we note that changing the LMC’s DM halo profile from the Hernquist profile adopted here to the more extended NFW profile may allow for more LMC particles in the Solar Neighborhood even in lower mass LMC models.
-
•
The LMC both directly contributes particles and also accelerates local MW DM halo particles to high speeds, reaching velocities km/s, with respect to the Earth. These are significantly higher speeds than traditionally assumed in the SHM.
-
•
The velocity vector of these high-speed particles reflect the direction of motion of the LMC at closest approach, which is roughly coincident with the reflex motion of the Sun. The spatial distribution of high speed particle trajectories is distinct from that of the SHM model or other substructures, such as those seen in Gaia [14]. It is more concentrated and skewed towards the South.
-
•
The LMC is found to increase the the time-averaged inverse speed, , resulting in an expected increase in the event rate at speeds km/s by factors of a few or more.
-
•
The LMC causes the limits on the spin-independent DM-nucleon scattering cross section, , to be significantly lower for low mass WIMPS than expected when the LMC is neglected (e.g. SHM Model). The effect will be even more dramatic for inelastic dark matter models [118, 31], or for models of elastic scattering with other types of potentials [119, 120].
-
•
The LMC accelerates MW DM particles to higher speeds if the initial velocity anisotropy profile of the MW is radially biased (Model 2 vs. Model 1). This is in agreement with the augmentation of the MW’s halo response to the LMC’s orbit seen in G19 using cosmologically motivated, radially biased halo models.
The LMC extends the high velocity tail of the local DM distribution to higher speeds than previously considered in SHM or un-phase-mixed models (Sagittarius or Gaia substructures) owing to the fact that the LMC is on first infall (high energy orbit) with a trajectory that is primarily in the same direction as the reflex motion of the Sun. Significantly, the LMC contribution to the local DM debris flow will not have a stellar counterpart. The LMC thus uniquely impacts the prospects of detecting low mass WIMPS (10 GeV/c2) in current and future direct-detection experiments.
Acknowledgments
We would like to thank Nassim Bozorgnia, Mariangela Lisanti, Lina Necib, David Spergel and Louis Strigari for helpful comments that have improved this manuscript. This work is supported by a NASA ATP grant 17-ATP17-0006 to GB, and by NSF Grant No. AST-1615838 to AHGP.
References
- [1] Planck collaboration, P. A. R. Ade et al., Planck 2015 results. XIII. Cosmological parameters, Astron. Astrophys. 594 (2016) A13, [1502.01589].
- [2] DES collaboration, T. M. C. Abbott et al., Dark Energy Survey Year 1 Results: Cosmological Constraints from Galaxy Clustering and Weak Lensing, 1708.01530.
- [3] DES collaboration, M. A. Troxel et al., Dark Energy Survey Year 1 Results: Cosmological Constraints from Cosmic Shear, 1708.01538.
- [4] G. Steigman and M. S. Turner, Cosmological Constraints on the Properties of Weakly Interacting Massive Particles, Nucl. Phys. B253 (1985) 375–386.
- [5] M. R. Buckley and A. H. G. Peter, Gravitational probes of dark matter physics, Phys. Rept. 761 (2018) 1–60, [1712.06615].
- [6] R. D. Peccei and H. R. Quinn, CP Conservation in the Presence of Instantons, Phys. Rev. Lett. 38 (1977) 1440–1443.
- [7] P. Sikivie, Experimental Tests of the Invisible Axion, Phys. Rev. Lett. 51 (1983) 1415–1417.
- [8] M. W. Goodman and E. Witten, Detectability of Certain Dark Matter Candidates, Phys. Rev. D31 (1985) 3059.
- [9] A. K. Drukier, K. Freese and D. N. Spergel, Detecting Cold Dark Matter Candidates, Phys. Rev. D33 (1986) 3495–3508.
- [10] I. Wasserman, Possibility of Detecting Heavy Neutral Fermions in the Galaxy, Phys. Rev. D33 (1986) 2071–2078.
- [11] K. Van Bibber, N. R. Dagdeviren, S. E. Koonin, A. Kerman and H. N. Nelson, Proposed experiment to produce and detect light pseudoscalars, Phys. Rev. Lett. 59 (1987) 759–762.
- [12] M. Pato, F. Iocco and G. Bertone, Dynamical constraints on the dark matter distribution in the Milky Way, JCAP 1512 (2015) 001, [1504.06324].
- [13] L. Necib, M. Lisanti, S. Garrison-Kimmel, A. Wetzel, R. Sanderson, P. F. Hopkins et al., Under the Firelight: Stellar Tracers of the Local Dark Matter Velocity Distribution in the Milky Way, 1810.12301.
- [14] N. W. Evans, C. A. J. O’Hare and C. McCabe, Refinement of the standard halo model for dark matter searches in light of the Gaia Sausage, Phys. Rev. D. 99 (Jan, 2019) 023012.
- [15] A. H. G. Peter, V. Gluscevic, A. M. Green, B. J. Kavanagh and S. K. Lee, WIMP physics with ensembles of direct-detection experiments, Phys. Dark Univ. 5-6 (2014) 45–74, [1310.7039].
- [16] C. A. J. O’Hare, Terrestrial WIMP/Axion astronomy, in 13th Patras Workshop on Axions, WIMPs and WISPs (AXION-WIMP 2017) CHALKIDIKI TBC, GREECE, May 15-19, 2017, 2017. 1710.10923.
- [17] M. Blennow, J. Herrero-Garcia and T. Schwetz, A halo-independent lower bound on the dark matter capture rate in the Sun from a direct detection signal, JCAP 1505 (2015) 036, [1502.03342].
- [18] F. Ferrer, A. Ibarra and S. Wild, A novel approach to derive halo-independent limits on dark matter properties, JCAP 1509 (2015) 052, [1506.03386].
- [19] A. M. Green, Effect of halo modeling on weakly interacting massive particle exclusion limits, Phys. Rev. D. 66 (Oct., 2002) 083003, [astro-ph/0207366].
- [20] A. H. G. Peter, Dark matter in the solar system I: The distribution function of WIMPs at the Earth from solar capture, Phys. Rev. D79 (2009) 103531, [0902.1344].
- [21] R. Catena and P. Ullio, The local dark matter phase-space density and impact on WIMP direct detection, Journal of Cosmology and Astro-Particle Physics 2012 (May, 2012) 005, [1111.3556].
- [22] L. E. Strigari, Galactic Searches for Dark Matter, Phys. Rept. 531 (2013) 1–88, [1211.7090].
- [23] J. I. Read, The Local Dark Matter Density, J. Phys. G41 (2014) 063101, [1404.1938].
- [24] J. D. Lewin and P. F. Smith, Review of mathematics, numerical factors, and corrections for dark matter experiments based on elastic nuclear recoil, Astropart. Phys. 6 (1996) 87–112.
- [25] A. M. Green, Astrophysical uncertainties on the local dark matter distribution and direct detection experiments, J. Phys. G44 (2017) 084001, [1703.10102].
- [26] M. Lisanti and D. N. Spergel, Dark Matter Debris Flows in the Milky Way, Phys. Dark Univ. 1 (2012) 155–161, [1105.4166].
- [27] J. D. Sloane, M. R. Buckley, A. M. Brooks and F. Governato, Assessing Astrophysical Uncertainties in Direct Detection with Galaxy Simulations, Astrophysical Journal 831 (Nov., 2016) 93, [1601.05402].
- [28] N. Bozorgnia, F. Calore, M. Schaller, M. Lovell, G. Bertone, C. S. Frenk et al., Simulated Milky Way analogues: implications for dark matter direct searches, JCAP 1605 (2016) 024, [1601.04707].
- [29] Y.-Y. Mao, L. E. Strigari and R. H. Wechsler, Connecting direct dark matter detection experiments to cosmologically motivated halo models, Phys. Rev. D. 89 (Mar, 2014) 063513, [1304.6401].
- [30] M. Vogelsberger, A. Helmi, V. Springel, S. D. M. White, J. Wang, C. S. Frenk et al., Phase-space structure in the local dark matter distribution and its signature in direct detection experiments, MNRAS 395 (May, 2009) 797–811, [0812.0362].
- [31] M. Kuhlen, N. Weiner, J. Diemand, P. Madau, B. Moore, D. Potter et al., Dark matter direct detection with non-Maxwellian velocity structure, JCAP 2 (Feb., 2010) 030, [0912.2358].
- [32] C. Kelso, C. Savage, M. Valluri, K. Freese, G. S. Stinson and J. Bailin, The impact of baryons on the direct detection of dark matter, JCAP 1608 (2016) 071, [1601.04725].
- [33] M. Kuhlen, A. Pillepich, J. Guedes and P. Madau, The Distribution of Dark Matter in the Milky Way’s Disk, Astrophys. J. 784 (2014) 161, [1308.1703].
- [34] P. F. de Salas, K. Malhan, K. Freese, K. Hattori and M. Valluri, On the estimation of the Local Dark Matter Density using the rotation curve of the Milky Way, arXiv e-prints (Jun, 2019) arXiv:1906.06133, [1906.06133].
- [35] Y.-Y. Mao, L. E. Strigari, R. H. Wechsler, H.-Y. Wu and O. Hahn, Halo-to-halo Similarity and Scatter in the Velocity Distribution of Dark Matter, ApJ 764 (Feb, 2013) 35, [1210.2721].
- [36] D. Lynden-Bell and R. M. Lynden-Bell, Ghostly streams from the formation of the Galaxy’s halo, Mon. Not. Roy. Astron. Soc. 275 (1995) 429–442.
- [37] SDSS collaboration, H. J. Newberg et al., The Ghost of Sagittarius and Lumps in the Halo of the Milky Way, Astrophys. J. 569 (2002) 245–274, [astro-ph/0111095].
- [38] A. Helmi, C. Babusiaux, H. H. Koppelman, D. Massari, J. Veljanoski and A. G. A. Brown, The merger that led to the formation of the Milky Way’s inner stellar halo and thick disk, Nat 563 (Nov, 2018) 85–88, [1806.06038].
- [39] J. M. D. Kruijssen, J. L. Pfeffer, M. Reina-Campos, R. A. Crain and N. Bastian, The formation and assembly history of the Milky Way revealed by its globular cluster population, MNRAS 486 (Jul, 2019) 3180–3202, [1806.05680].
- [40] V. Belokurov, D. Erkal, N. W. Evans, S. E. Koposov and A. J. Deason, Co-formation of the disc and the stellar halo, MNRAS 478 (Jul, 2018) 611–619, [1802.03414].
- [41] G. C. Myeong, E. Vasiliev, G. Iorio, N. W. Evans and V. Belokurov, Evidence for Two Early Accretion Events That Built the Milky Way Stellar Halo, MNRAS (Jul, 2019) 1731, [1904.03185].
- [42] G. C. Myeong, N. W. Evans, V. Belokurov, N. C. Amorisco and S. E. Koposov, Halo substructure in the SDSS-Gaia catalogue: streams and clumps, MNRAS 475 (Apr, 2018) 1537–1548, [1712.04071].
- [43] L. Necib, B. Ostdiek, M. Lisanti, T. Cohen, M. Freytsis, S. Garrison-Kimmel et al., Evidence for a Vast Prograde Stellar Stream in the Solar Vicinity, arXiv e-prints (Jul, 2019) arXiv:1907.07190, [1907.07190].
- [44] K. Freese, P. Gondolo, H. J. Newberg and M. Lewis, The effects of the Sagittarius dwarf tidal stream on dark matter detectors, Phys. Rev. Lett. 92 (2004) 111301, [astro-ph/0310334].
- [45] K. Freese, P. Gondolo and H. J. Newberg, Detectability of weakly interacting massive particles in the Sagittarius dwarf tidal stream, Phys. Rev. D71 (2005) 043516, [astro-ph/0309279].
- [46] C. W. Purcell, A. R. Zentner and M.-Y. Wang, Dark Matter Direct Search Rates in Simulations of the Milky Way and Sagittarius Stream, JCAP 1208 (2012) 027, [1203.6617].
- [47] C. A. J. O’Hare, C. McCabe, N. W. Evans, G. Myeong and V. Belokurov, Dark matter hurricane: Measuring the S1 stream with dark matter detectors, Phys. Rev. D98 (2018) 103006, [1807.09004].
- [48] L. Necib, M. Lisanti and V. Belokurov, Inferred Evidence for Dark Matter Kinematic Substructure with SDSS-Gaia, ApJ 874 (Mar, 2019) 3.
- [49] M. R. Buckley, G. Mohlabeng and C. W. Murphy, Direct Detection Anomalies in light of Data, arXiv e-prints (May, 2019) arXiv:1905.05189, [1905.05189].
- [50] D. Stiff, L. M. Widrow and J. Frieman, Signatures of hierarchical clustering in dark matter detection experiments, Phys. Rev. D. 64 (Oct, 2001) 083516, [astro-ph/0106048].
- [51] A. Helmi, S. D. White and V. Springel, The phase-space structure of a dark-matter halo: Implications for dark-matter direct detection experiments, Phys. Rev. D. 66 (Sep, 2002) 063502, [astro-ph/0201289].
- [52] M. Kamionkowski and S. M. Koushiappas, Galactic substructure and direct detection of dark matter, Phys. Rev. D. 77 (May, 2008) 103509, [0801.3269].
- [53] M. Kuhlen, M. Lisanti and D. N. Spergel, Direct detection of dark matter debris flows, Phys. Rev. D 86 (Sept., 2012) 063505, [1202.0007].
- [54] G. Besla, N. Kallivayalil, L. Hernquist, B. Robertson, T. J. Cox, R. P. van der Marel et al., Are the Magellanic Clouds on Their First Passage about the Milky Way?, Astrophysical Journal 668 (Oct., 2007) 949–967, [astro-ph/0703196].
- [55] M. Boylan-Kolchin, G. Besla and L. Hernquist, Dynamics of the Magellanic Clouds in a Lambda cold dark matter universe, Mon. Not. Roy. Astron. Soc. 414 (June, 2011) 1560–1572, [1010.4797].
- [56] E. Patel, G. Besla and S. T. Sohn, Orbits of massive satellite galaxies - I. A close look at the Large Magellanic Cloud and a new orbital history for M33, Mon. Not. Roy. Astron. Soc. 464 (Feb., 2017) 3825–3849, [1609.04823].
- [57] N. Garavito-Camargo, G. Besla, C. F. P. Laporte, K. V. Johnston, F. A. Gómez and L. L. Watkins, Hunting for the Dark Matter Wake Induced by the Large Magellanic Cloud, arXiv e-prints (Feb, 2019) arXiv:1902.05089, [1902.05089].
- [58] N. Kallivayalil, R. P. van der Marel, G. Besla, J. Anderson and C. Alcock, Third-epoch Magellanic Cloud Proper Motions. I. Hubble Space Telescope/WFC3 Data and Orbit Implications, Astrophysical Journal 764 (Feb., 2013) 161, [1301.0832].
- [59] M. T. Busha, P. J. Marshall, R. H. Wechsler, A. Klypin and J. Primack, The Mass Distribution and Assembly of the Milky Way from the Properties of the Magellanic Clouds, The Astrophysical Journal 743 (Dec., 2011) 40, [1011.2203].
- [60] R. P. van der Marel, N. Kallivayalil and G. Besla, Kinematical structure of the Magellanic System, in The Magellanic System: Stars, Gas, and Galaxies (J. T. Van Loon and J. M. Oliveira, eds.), vol. 256 of IAU Symposium, pp. 81–92, Mar., 2009. 0809.4268. DOI.
- [61] B. P. Moster, T. Naab and S. D. M. White, Galactic star formation and accretion histories from matching galaxies to dark matter haloes, Mon. Not. Roy. Astron. Soc. 428 (Feb., 2013) 3121–3138, [1205.5807].
- [62] C. F. P. Laporte, F. A. Gómez, G. Besla, K. V. Johnston and N. Garavito-Camargo, Response of the Milky Way’s disc to the Large Magellanic Cloud in a first infall scenario, Mon. Not. Roy. Astron. Soc. 473 (Jan., 2018) 1218–1230.
- [63] J. Peñarrubia, F. A. Gómez, G. Besla, D. Erkal and Y.-Z. Ma, A timing constraint on the (total) mass of the Large Magellanic Cloud, Mon. Not. Roy. Astron. Soc. 456 (Feb., 2016) L54–L58, [1507.03594].
- [64] D. Erkal, V. Belokurov, C. F. P. Laporte, S. E. Koposov, T. S. Li, C. J. Grillmair et al., The total mass of the Large Magellanic Cloud from its perturbation on the Orphan stream, MNRAS 487 (Aug, 2019) 2685–2700, [1812.08192].
- [65] N. Shipp, T. S. Li, A. B. Pace, D. Erkal, A. Drlica-Wagner, B. Yanny et al., Proper Motions of Stellar Streams Discovered in the Dark Energy Survey, arXiv e-prints (Jul, 2019) arXiv:1907.09488, [1907.09488].
- [66] A. D. Mackey, S. E. Koposov, D. Erkal, V. Belokurov, G. S. Da Costa and F. A. Gómez, A 10 kpc stellar substructure at the edge of the Large Magellanic Cloud: perturbed outer disc or evidence for tidal stripping?, Mon. Not. Roy. Astron. Soc. 459 (June, 2016) 239–255, [1508.01356].
- [67] G. Besla, D. Martínez-Delgado, R. P. van der Marel, Y. Beletsky, M. Seibert, E. F. Schlafly et al., Low Surface Brightness Imaging of the Magellanic System: Imprints of Tidal Interactions between the Clouds in the Stellar Periphery, ApJ 825 (Jul, 2016) 20, [1602.04222].
- [68] S. Shao, M. Cautun, A. J. Deason and C. S. Frenk, Evolution of LMC-mass dwarf galaxies in the EAGLE simulation, ArXiv e-prints (Mar., 2018) , [1803.07269].
- [69] G. Besla, D. R. Patton, S. Stierwalt, V. Rodriguez-Gomez, E. Patel, N. J. Kallivayalil et al., The frequency of dwarf galaxy multiples at low redshift in SDSS versus cosmological expectations, MNRAS 480 (Nov., 2018) 3376–3396.
- [70] G. Besla, The Orbits of the Magellanic Clouds, p. 311. 2015. 10.1007/978-3-319-10614-4-26.
- [71] V. Springel, The cosmological simulation code GADGET-2, Mon. Not. Roy. Astron. Soc. 364 (Dec., 2005) 1105–1134, [astro-ph/0505010].
- [72] D. Yurin and V. Springel, An iterative method for the construction of N-body galaxy models in collisionless equilibrium, Mon. Not. Roy. Astron. Soc. 444 (Oct., 2014) 62–79, [1402.1623].
- [73] L. Hernquist, An analytical model for spherical galaxies and bulges, ApJ 356 (June, 1990) 359–364.
- [74] B. F. Griffen, A. P. Ji, G. A. Dooley, F. A. Gómez, M. Vogelsberger, B. W. O’Shea et al., The Caterpillar Project: A Large Suite of Milky Way Sized Halos, ApJ 818 (Feb, 2016) 10, [1509.01255].
- [75] S. Garrison-Kimmel, M. Boylan-Kolchin, J. S. Bullock and K. Lee, ELVIS: Exploring the Local Volume in Simulations, MNRAS 438 (Mar, 2014) 2578–2596, [1310.6746].
- [76] A. R. Wetzel, P. F. Hopkins, J.-h. Kim, C.-A. Faucher-Giguère, D. Kereš and E. Quataert, Reconciling Dwarf Galaxies with CDM Cosmology: Simulating a Realistic Population of Satellites around a Milky Way-mass Galaxy, ApJL 827 (Aug, 2016) L23, [1602.05957].
- [77] T. Sawala, C. S. Frenk, A. Fattahi, J. F. Navarro, R. G. Bower, R. A. Crain et al., The APOSTLE simulations: solutions to the Local Group’s cosmic puzzles, MNRAS 457 (Apr, 2016) 1931–1943, [1511.01098].
- [78] P. J. McMillan, Mass models of the Milky Way, MNRAS 414 (July, 2011) 2446–2457, [1102.4340].
- [79] P. J. McMillan, The mass distribution and gravitational potential of the Milky Way, MNRAS 465 (Feb, 2017) 76–94, [1608.00971].
- [80] J. Herzog-Arbeitman, M. Lisanti, P. Madau and L. Necib, Empirical Determination of Dark Matter Velocities Using Metal-Poor Stars, Physical Review Letters 120 (Jan., 2018) 041102, [1704.04499].
- [81] J. Binney and S. Tremaine, Galactic Dynamics: Second Edition. 2008.
- [82] S. H. Hansen and B. Moore, A universal density slope Velocity anisotropy relation for relaxed structures, New Astronomy 11 (Mar., 2006) 333–338, [astro-ph/0411473].
- [83] M. G. Abadi, J. F. Navarro and M. Steinmetz, Stars beyond galaxies: the origin of extended luminous haloes around galaxies, MNRAS 365 (Jan., 2006) 747–758, [astro-ph/0506659].
- [84] A. M. Green, Interpreting data from WIMP direct detection experiments, arXiv High Energy Physics - Phenomenology e-prints (Aug., 2002) , [hep-ph/0208140].
- [85] T. Piffl, C. Scannapieco, J. Binney, M. Steinmetz, R. D. Scholz, M. E. K. Williams et al., The RAVE survey: the Galactic escape speed and the mass of the Milky Way, AAP 562 (Feb, 2014) A91, [1309.4293].
- [86] A. H. G. Peter, Particle dark matter in the solar system. PhD thesis, Princeton University, Jan, 2008.
- [87] S. Kazantzidis, J. Magorrian and B. Moore, Generating Equilibrium Dark Matter Halos: Inadequacies of the Local Maxwellian Approximation, ApJ 601 (Jan, 2004) 37–46, [astro-ph/0309517].
- [88] F. A. Gómez, G. Besla, D. D. Carpintero, Á. Villalobos, B. W. O’Shea and E. F. Bell, And Yet it Moves: The Dangers of Artificially Fixing the Milky Way Center of Mass in the Presence of a Massive Large Magellanic Cloud, ApJ 802 (Apr, 2015) 128, [1408.4128].
- [89] R. Schönrich, J. Binney and W. Dehnen, Local kinematics and the local standard of rest, MNRAS 403 (Apr., 2010) 1829–1833, [0912.3693].
- [90] K. Freese, M. Lisanti and C. Savage, Colloquium: Annual modulation of dark matter, Reviews of Modern Physics 85 (Oct., 2013) 1561–1581, [1209.3339].
- [91] F. Mayet et al., A review of the discovery reach of directional Dark Matter detection, Phys. Rept. 627 (2016) 1–49, [1602.03781].
- [92] J. Engel, Nuclear form-factors for the scattering of weakly interacting massive particles, Phys. Lett. B264 (1991) 114–119.
- [93] E. Aprile, J. Aalbers, F. Agostini, M. Alfonsi, L. Althueser, F. D. Amaro et al., Dark Matter Search Results from a One Ton-Year Exposure of XENON1T, Phys. Rev. Lett. 121 (Sep, 2018) 111302, [1805.12562].
- [94] D. S. Akerib, C. W. Akerlof, S. K. Alsum, H. M. Araújo, M. Arthurs, X. Bai et al., Projected WIMP sensitivity of the LUX-ZEPLIN (LZ) dark matter experiment, arXiv e-prints (Feb, 2018) arXiv:1802.06039, [1802.06039].
- [95] D. S. Akerib, H. M. Araújo, X. Bai, A. J. Bailey, J. Balajthy, P. Beltrame et al., Improved Limits on Scattering of Weakly Interacting Massive Particles from Reanalysis of 2013 LUX Data, Physical Review Letters 116 (Apr, 2016) 161301, [1512.03506].
- [96] C. Amole, M. Ardid, I. J. Arnquist, D. M. Asner, D. Baxter, E. Behnke et al., Dark matter search results from the complete exposure of the PICO-60 C3F8 bubble chamber, Phys. Rev. D. 100 (Jul, 2019) 022001, [1902.04031].
- [97] A. Aguilar-Arevalo, D. Amidei, X. Bertou, M. Butner, G. Cancelo, A. Castañeda Vázquez et al., Search for low-mass WIMPs in a 0.6 kg day exposure of the DAMIC experiment at SNOLAB, arXiv e-prints (Jul, 2016) arXiv:1607.07410, [1607.07410].
- [98] R. Agnese, A. J. Anderson, T. Aramaki, I. Arnquist, W. Baker, D. Barker et al., Projected sensitivity of the SuperCDMS SNOLAB experiment, Phys. Rev. D. 95 (Apr, 2017) 082002, [1610.00006].
- [99] CRESST Collaboration, A. H. Abdelhameed, G. Angloher, P. Bauer, A. Bento, E. Bertoldo et al., First results from the CRESST-III low-mass dark matter program, arXiv e-prints (Mar, 2019) arXiv:1904.00498, [1904.00498].
- [100] S. K. Lee, M. Lisanti, A. H. G. Peter and B. R. Safdi, Effect of Gravitational Focusing on Annual Modulation in Dark-Matter Direct-Detection Experiments, Phys. Rev. Lett. 112 (Jan, 2014) 011301, [1308.1953].
- [101] R. Agnese, A. J. Anderson, T. Aralis, T. Aramaki, I. J. Arnquist, W. Baker et al., Low-mass dark matter search with CDMSlite, Physical Review D 97 (Jan, 2018) 022002.
- [102] M. Salem, G. Besla, G. Bryan, M. Putman, R. P. van der Marel and S. Tonnesen, Ram Pressure Stripping of the Large Magellanic Cloud’s Disk as a Probe of the Milky Way’s Circumgalactic Medium, The Astrophysical Journal 815 (Dec, 2015) 77, [1507.07935].
- [103] R. Ibata, M. Irwin, G. F. Lewis and A. Stolte, Galactic Halo Substructure in the Sloan Digital Sky Survey: The Ancient Tidal Stream from the Sagittarius Dwarf Galaxy, The Astrophysical Journal 547 (Feb, 2001) L133–L136, [astro-ph/0004255].
- [104] S. R. Majewski, M. F. Skrutskie, M. D. Weinberg and J. C. Ostheimer, A Two Micron All Sky Survey View of the Sagittarius Dwarf Galaxy. I. Morphology of the Sagittarius Core and Tidal Arms, The Astrophysical Journal 599 (Dec, 2003) 1082–1115, [astro-ph/0304198].
- [105] G. C. Myeong, N. W. Evans, V. Belokurov, J. L. Sand ers and S. E. Koposov, Discovery of new retrograde substructures: the shards of Centauri?, Monthly Notices of the Royal Astronomical Society 478 (Aug, 2018) 5449–5459.
- [106] G. C. Myeong, N. W. Evans, V. Belokurov, J. L. Sand ers and S. E. Koposov, The Milky Way Halo in Action Space, The Astrophysical Journal 856 (Apr, 2018) L26, [1802.03351].
- [107] A. Helmi, J. Veljanoski, M. A. Breddels, H. Tian and L. V. Sales, A box full of chocolates: The rich structure of the nearby stellar halo revealed by Gaia and RAVE, Astronomy and Astrophysics 598 (Feb, 2017) A58, [1611.00222].
- [108] P. J. Quinn and J. Goodman, Sinking Satellites of Spiral Systems, The Astrophysical Journal 309 (Oct, 1986) 472.
- [109] J. E. Norris and S. G. Ryan, Population Studies: Evidence for Accretion of the Galactic Halo, The Astrophysical Journal 336 (Jan, 1989) L17.
- [110] D. Carollo, T. C. Beers, Y. S. Lee, M. Chiba, J. E. Norris, R. Wilhelm et al., Two stellar components in the halo of the Milky Way, Nature 450 (Dec, 2007) 1020–1025, [0706.3005].
- [111] T. C. Beers, D. Carollo, Ž. Ivezić, D. An, M. Chiba, J. E. Norris et al., The Case for the Dual Halo of the Milky Way, The Astrophysical Journal 746 (Feb, 2012) 34, [1104.2513].
- [112] N. Bozorgnia, A. Fattahi, D. G. Cerdeño, C. S. Frenk, F. A. Gómez, R. J. J. Grand et al., On the correlation between the local dark matter and stellar velocities, JCAP 2019 (Jun, 2019) 045, [1811.11763].
- [113] J. Peñarrubia, J. F. Navarro and A. W. McConnachie, The Tidal Evolution of Local Group Dwarf Spheroidals, ApJ 673 (Jan, 2008) 226–240, [0708.3087].
- [114] J. I. Read, G. Lake, O. Agertz and V. P. Debattista, Thin, thick and dark discs in LCDM, Mon. Not. Roy. Astron. Soc. 389 (2008) 1041–1057, [0803.2714].
- [115] J. Fan, A. Katz, L. Randall and M. Reece, Double-Disk Dark Matter, Physics of the Dark Universe 2 (Sep, 2013) 139–156, [1303.1521].
- [116] P. Cushman, C. Galbiati, D. N. McKinsey, H. Robertson, T. M. P. Tait, D. Bauer et al., Snowmass CF1 Summary: WIMP Dark Matter Direct Detection, ArXiv e-prints (Oct., 2013) , [1310.8327].
- [117] G. Besla, N. Kallivayalil, L. Hernquist, R. P. van der Marel, T. J. Cox and D. Kereš, Simulations of the Magellanic Stream in a First Infall Scenario, The Astrophysical Journal 721 (Oct, 2010) L97–L101, [1008.2210].
- [118] D. Smith and N. Weiner, Inelastic dark matter, Phys. Rev. D. 64 (Aug, 2001) 043502, [hep-ph/0101138].
- [119] J. Fan, M. Reece and L.-T. Wang, Non-relativistic effective theory of dark matter direct detection, JCAP 2010 (Nov, 2010) 042, [1008.1591].
- [120] A. L. Fitzpatrick, W. Haxton, E. Katz, N. Lubbers and Y. Xu, The effective field theory of dark matter direct detection, JCAP 2013 (Feb, 2013) 004, [1203.3542].