e-mail: ]ivlev@mpe.mpg.de e-mail: ]ksilsbee@mpe.mpg.de
Gas and dust temperature in pre-stellar cores revisited:
New limits on cosmic-ray ionization rate
Abstract
We develop a self-consistent model for the equilibrium gas temperature and size-dependent dust temperature in cold, dense pre-stellar cores, assuming an arbitrary power-law size distribution of dust grains. Compact analytical expressions applicable to a broad range of physical parameters are derived and compared with predictions of the commonly used standard model. It is suggested that combining the theoretical results with observations should allow us to constrain the degree of dust evolution and the cosmic-ray ionization rate in dense cores, and to help in discriminating between different regimes of cosmic-ray transport in molecular clouds. In particular, assuming a canonical MRN distribution of grain sizes, our theory demonstrates that the gas temperature measurements in the pre-stellar core L1544 are consistent with an ionization rate as high as s-1, an order of magnitude higher than previously thought.
Subject headings:
ISM: clouds – dust, extinction – cosmic raysI. Introduction
Pre-stellar cores set the initial conditions for the process of star formation (see, e.g., Shu et al., 1987; Bergin & Tafalla, 2007), and therefore determine the properties of the future stars and stellar systems which will form in their centers. Unveiling the physical and chemical structure of the cores puts stringent constraints on dynamical/chemical models (e.g., Keto et al., 2014, 2015; Vasyunin et al., 2017; Sipilä & Caselli, 2018; Caselli et al., 2019). Specifically, measuring volume density and gas/dust temperature profiles is crucial to provide information about the heating by the interstellar radiation field (ISRF) (e.g., Zucconi et al., 2001; Launhardt et al., 2013; Steinacker et al., 2016; Harju et al., 2017; Hocuk et al., 2017) and cosmic rays (CRs) (e.g., Goldsmith, 2001; Keto & Caselli, 2010), as well as about dust evolution (Sadavoy et al., 2016; Chacón-Tanarro et al., 2019). These processes critically affect the dynamical and chemical evolution of pre-stellar cores, as they regulate the ionisation fraction (e.g., McKee, 1989) and surface chemistry/freeze-out rates (e.g., Zhao et al., 2018; Shingledecker et al., 2018).
The physical characteristics of pre-stellar cores exhibit significant variations. Typical values of the gas density in the center of pre-stellar cores exceed cm-3 (e.g., Keto & Caselli, 2008; Keto et al., 2015). The gas cooling in this case is determined by collisions with dust grains, while the direct cooling by CO line emission (dominating at lower densities) becomes inefficient (Goldsmith, 2001; Galli et al., 2002). Densities of up to cm-3 have been reported (Keto & Caselli, 2010; Caselli et al., 2019), while the actual peak density in contracting cores is expected to reach much higher values before a protostar forms. The magnitude of the CR ionization rate measured in the outer envelopes of molecular clouds (in a range of the gas column densities around cm-2) varies significantly from one object to another (Indriolo & McCall, 2012; Neufeld & Wolfire, 2017; Bacalla et al., 2019). Given uncertainties in the leading transport regime(s) governing the CR penetration into the clouds (Ivlev et al., 2018; Silsbee & Ivlev, 2019), this introduces significant uncertainty in the value of near the center; available theories (Padovani et al., 2018b) predict s-1 for cm-2.
The usual approach to calculate the gas and dust temperatures in dense cores (see, e.g., Zucconi et al., 2001; Hocuk et al., 2017; Chacón-Tanarro et al., 2019) relies on the assumption that the temperature of dust grains, , is determined from the balance of their radiative heating (by absorbing far-IR interstellar radiation penetrating into the cores) and cooling (via the continuum emission). Below we refer to this approach as the standard model, where the gas temperature is controlled by the CR heating and cooling on the dust surface, proportional to the difference . The available analytical models (e.g., Goldsmith, 2001; Galli et al., 2002; Galli & Padovani, 2015) usually make further simplification, assuming the dust grains to be monodisperse, i.e., to all have the same size. Even though the term describing the gas-dust thermal coupling is added to the dust energy balance in certain cases (Goldsmith, 2001; Woitke et al., 2009; Akimkin et al., 2013), to the best of our knowledge such calculations never account for an explicit dependence of the resulting dust temperature on the grain size. At the same time, this dependence immediately follows from the very fact that the thermal coupling term is proportional to the grain area, while the radiative absorption and emission terms scale with the grain volume in the Rayleigh-Jeans regime.
The aim of the present paper is to develop a self-consistent analytical model for the equilibrium gas temperature and size-dependent dust temperature in dense pre-stellar cores, depending on a given local gas density, local radiation field and the CR ionization rate, and a power-law size distribution of dust grains. We derive compact expressions applicable for typical conditions in dense cores, and compare our results with predictions of the commonly used standard model. Combined with observations, our findings should have important implications – in particular, for constraining the CR ionization rate and the degree of dust evolution in dense cores, for discriminating between different regimes of CR transport in molecular clouds, and for estimating the speed of physical and chemical processes occurring on the surface of grains.
II. Heating and cooling in dense cores
In this section we summarize the main heating and cooling mechanisms of gas and dust, relevant to dense pre-stellar cores, and formulate the respective balance equations.
II.1. Balance equation for dust
The UV and visible radiation of the ISRF are practically completely attenuated in dense cores (see, e.g., Hocuk et al., 2017, and references therein). Therefore, dust is heated by absorbing photons from the far-IR part of the spectrum, still able to penetrate into the cores.111As discussed by Zucconi et al. (2001), UV and optical radiation is converted into far-IR radiation in a photodissociation layer surrounding the core. This could contribute to the far-IR heating, but typically is not taken into account in radiative transfer models. This is usually assumed to be the only heating mechanism, which is balanced by the modified black-body radiative cooling of dust grains. In the present paper, we also include the effect of the gas-dust thermal coupling. This leads to additional collisional heating due to gas particles impinging on the dust surface.222The thermal coupling always leads to dust heating if it is the only mechanism of gas cooling (see Section II.2). Then the energy balance for a dust grain can be written in the following form (Goldsmith, 2001):
| (1) |
where and are the rates of the radiative cooling (emission) and heating (absorption), and is the rate of collisional heating.
The rate of radiative heating of a grain of radius is (Draine, 2011)
where is the specific energy density of the ISRF at the gas column density , is the dust absorption efficiency for the frequency , and is the speed of light. For the radiation dominated by far-IR photons (the spectral index of the dust opacity is assumed to be equal to 2). Hence, , where is a function of .
The rate of radiative cooling is (Draine, 2011)
Here, is the Planck-averaged absorption efficiency of dust, where is the size-dependent dust temperature, is the Stefan-Boltzmann constant, and is a material-dependent numerical factor, equal to K-2 cm-1 for silicate grains (we assume this value for calculations below). We obtain
| (2) |
Then the radiative heating rate can be conveniently presented in the following identical form:
| (3) |
where is the local equilibrium dust temperature from the absorption-emission balance, i.e., when in Equation (1) is neglected.
The gas-dust thermal coupling is characterized by the rate of collisional heating of a dust grain (Draine, 2011; Burke & Hollenbach, 1983),
| (4) |
where is the gas temperature, is the thermal velocity scale of gas particles, is their thermal accommodation coefficient on dust surface, and is Boltzmann’s constant. To include the effect of the ISM elemental composition, we set the density of H2 molecules as the relevant gas density scale . Then the velocity scale,
is determined by the mass numbers of heavier elements and their abundances (with respect to the atomic hydrogen), with being the thermal velocity scale of H2 molecules. For the accommodation coefficient, we adopt (Draine, 2011).
II.2. Balance equation for gas
The gas heating in pre-stellar cores is completely dominated by CRs, whereas the cooling occurs through two mechanisms (Goldsmith, 2001; Galli et al., 2002): Apart from the gas-dust thermal coupling, the molecular lines may contribute to the cooling. The main line coolant in dense cores is the low- rotational transitions of CO molecules, whose catastrophic freeze-out makes this mechanism unimportant for typical densities in the center of dense cores (Caselli et al., 1999; Goldsmith, 2001). Using the gas-grain chemical model by Sipilä et al. (2019) in conjunction with the hydrodynamical model by Sipilä & Caselli (2018), we have concluded that the line cooling can be safely neglected for cm-3, and then we can write the thermal balance as
| (5) |
Here, is the CR heating rate and is the cooling function due to gas-dust thermal coupling.
The heating rate per unit volume can be presented in the following form (Glassgold et al., 2012):
| (6) |
where is the total CR ionization rate per H2 molecule and is the heating energy per H2 ionization. The latter is a very slowly increasing function of , reaching values of eV for dense cores; below we adopt the value of eV.
The gas cooling function is determined by the rate of dust collisional heating,
| (7) |
We generally assume an “evolved MRN” size distribution of grains,
| (8) |
in the range of . The deviation of and from the “canonical” MRN values as well as nonzero parameterize the degree of dust evolution due to possible coagulation in cores (Weingartner & Draine, 2001). The value of is not expected to exceed a few tenths of m, while may increase significantly due to efficient depletion of smaller grains onto bigger ones. The slope variation is usually positive and could be as large as (or even larger). The scale factor in Equation (8) is determined from the relation between the mass densities of dust and gas,
| (9) |
Here, is the mass density of grain material, equal to g cm-3 for compact silicate, and is the dust-to-gas mass ratio where the normalization is by ,
expressed in terms of the standard value of . Below we adopt these values of and .
We stress that the absorption term in Equation (1) is completely determined by the local density of the ISRF, i.e., the coupling to the local thermal radiation of dust is neglected. This approach is justified provided the optical depth of the core is small for the thermal radiation. Using the above expression for , we obtain for the corresponding absorption cross section. Then, utilizing relation (9) and the fact that the cross section scales with , we readily infer the optical depth, , where is the H2 surface density of the core. For cold dense cores with K and the column density of cm-2 (Crapsi et al., 2007; Keto & Caselli, 2010) we estimate . As the peak column density is expected to approximately scale with the square root of the peak volume density (for the Bonnor-Ebert sphere, Bonnor, 1956), our approach should be well applicable for of up to cm-3.
II.3. Additional mechanisms of CR heating
To facilitate the analysis and comparison with previous results, above we only discussed the heating included in the standard model for the equilibrium gas and dust temperatures. Apart from this, there are additional mechanisms of dust and gas heating by CRs, associated with the presence of dust grains. The dust heating is due to direct CR bombardment, leading to the energy deposition into the grains (e.g., Léger et al., 1985; Shen et al., 2004), and due to absorption of UV radiation caused by the CR-induced fluorescence of H2 and He (Prasad & Tarafdar, 1983; Cecchi-Pestellini & Aiello, 1992). Near-IR radiation from vibrationally excited H2 may add to dust heating (Dalgarno et al., 1999), while the UV radiation also contributes to gas heating via photoelectric emission from dust (Draine, 1978). Furthermore, CRs are the only source of atomic hydrogen in dense cores (Padovani et al., 2018a). The energy released in the recombination on the surface of grains is distributed between dust and gas.
The mechanisms of dust heating by CRs require a careful analysis, which is presented in Appendix A. We show that for typical conditions in dense pre-stellar cores (discussed in Section IV.4) this heating is unimportant.
The effect of additional gas heating by CRs is straightforwardly included in Equations (5) and (6), by adding the corresponding energy to . The upper bound for the energy of photoelectric heating can be estimated as a product of the photoelectric yield and the energy of CR-induced UV heating of dust. With the energy of eV (Dalgarno et al., 1999) and the yield of for Lyman-Werner photons and MRN silicate grains (Weingartner et al., 2006), we obtain the photoelectric heating energy of less than 1 eV per H2 ionization. The gas heating due to hydrogen recombination, although uncertain, is expected to give a comparable contribution (Glassgold et al., 2012). As these energies are substantially smaller than the adopted value of , we conclude that the additional gas heating can also be neglected.
III. Equilibrium temperatures
Substituting Equations (2)–(4) in Equation (1), we get the thermal balance equation for dust grains:
| (10) |
The complementary balance equation for gas particles is obtained from Equation (5): To derive , we insert Equation (4) in Equation (7), and calculate the scale factor for the size distribution (8). Substituting the result in Equation (5) and using Equation (6), we get
| (11) | |||
Equations (10) and (11) yield the self-consistent solution for and for given local ionization rate and local conditions in the core.
Below we give the analytical approximation of Equations (10) and (11), allowing us to derive the explicit dependence of the dust temperature on the grain size and better understand the mechanism behind the observed behavior.
III.1. Analytical approximation
Assume is sufficiently small, so that the lhs of Equation (10) can be expanded in a series over . Keeping up to quadratic terms, , ensures accurate results for and leads to a quadratic equation for . Keeping the same accuracy for , we obtain
| (12) |
where and
| (13) |
is the “critical” grain radius. For “overcritical” grains with we have , i.e., their temperature is practically equal to , as usually assumed; on the other hand, for grains with the thermal coupling to gas dominates their energy balance and, hence, their temperature approaches . As a consequence, the contribution of small grains to the gas cooling [determined by the integral in Equation (11)] can be reduced drastically, which should lead to higher gas temperatures compared to the case where is assumed.
The critical radius is determined by the material-dependent absorption factor and by the local conditions in the core (in particular, it depends on via ). Note that increases with faster than linearly, since is a decreasing function of (Evans et al., 2001; Hocuk et al., 2017; Chacón-Tanarro et al., 2019).
We introduce dimensionless parameters
where . Parameter quantifies the relative width of the size distribution, while characterizes the relative importance of the critical radius: for the overall effect of finite is expected to become significant. Substituting Equation (12) in Equation (11) and expanding in a series over , after some manipulation we obtain:
| (14) |
where . Function gives the explicit dependence on the temperature difference as well as on the dimensionless parameters of the size distribution,
| (15) |
where auxiliary functions are determined by Equation (B1) in Appendix B. Thus, Equation (14) provides us with a convenient direct relation between the gas temperature and the ionization rate.
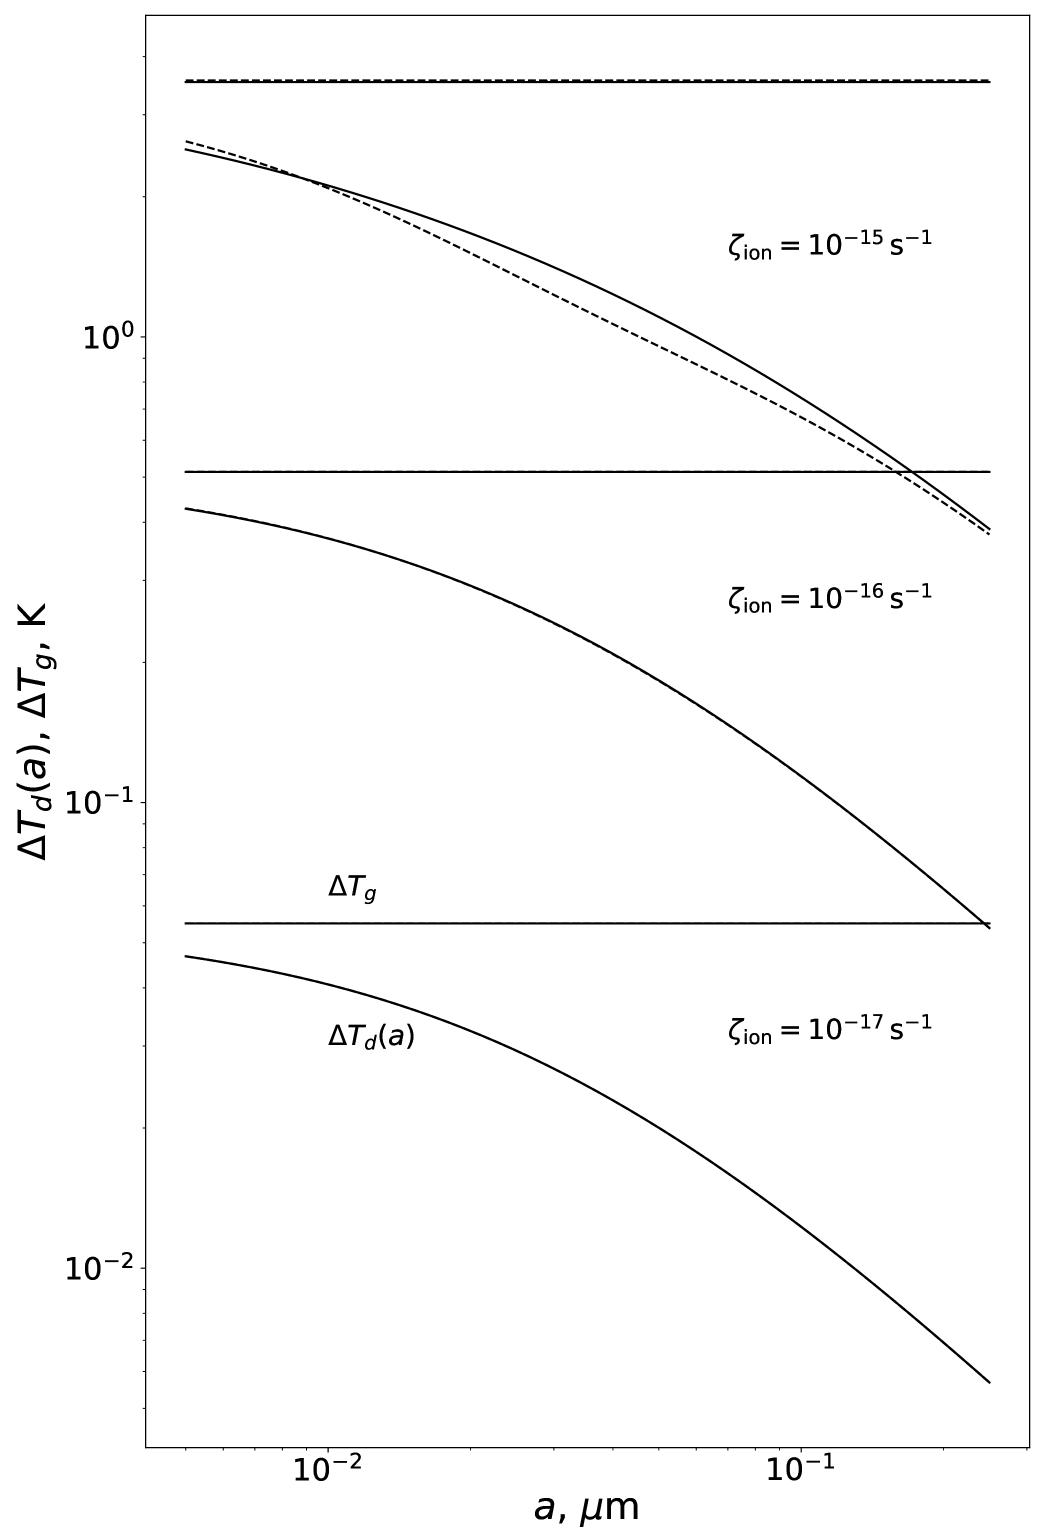
In Figure 1 we compare the exact and analytical solutions. The solid lines represent the solution of Equations (10) and (11) for three different values of , showing (as a function of grain radius) and the corresponding . We set K for the illustration, which is about the value expected from the absorption-emission balance in the center of very dense cores (assuming a typical ISRF, see, e.g., Crapsi et al., 2007). The results are obtained for the canonical MRN distribution and a gas density typical to such cores ( cm-3, see, e.g., Crapsi et al., 2005), demonstrating that the temperature of smaller grains approaches , while for bigger grains it approaches . This trend is observed for all used values of . According to Equation (12), the transition occurs at , which is about m for the chosen conditions. As the critical radius scales (faster than) linearly with the gas density, an increase in by a factor of will make almost equal to for grains below m.
The analytical approximation is depicted in Figure 1 by the dashed lines. We see that Equations (14) and (15) provide excellent accuracy for the gas temperature for all values of used in calculations, so that the dashed and solid lines for are undistinguishable. Some deviation of Equation (12) from the exact solution for (occurring at ) is only seen in the extreme case of s-1.
IV. Discussion
Let us quantify the difference between the standard model for gas temperature and our model for and . To facilitate the analysis, we introduce a concept of effective grain radius and replace the self-consistent dependence , given by Equation (10), with an effective (size-independent) value . The latter is derived by integrating Equation (1) over the size distribution (8) and assuming that does not depend on . The results of this approach should tend to exact results both for small (where the deviation of from is insignificant) and for sufficiently large (where all grains in the MRN size range have the temperature close to ).
IV.1. Effective grain radius
Following the steps of Sec. III.1, we obtain the relation between and in the form of Equation (12), where should be replaced with the effective grain radius . It is determined by
| (16) |
a monotonically increasing function of both variables. For , it is bound between , i.e., . The lower bound corresponds to ; for and we have and , respectively. The case of monodisperse grains is naturally recovered for , where . As discussed in Section IV.2, the value of plays the critical role in determining the value of .
The gas temperature is then derived from Equation (14) where should be replaced with the corresponding effective function,
| (17) | |||
Let us analyze Equation (17). In the limit of small (where the deviation of the dust temperature from is negligible), the factor in the brackets is for the accepted accuracy. This yields
| (18) |
We see that Equation (18) represents the standard model for the gas temperature (Goldsmith, 2001; Galli et al., 2002), which is now generalized to the case of arbitrary power-law size distribution with the effective grain radius .
The absorption-emission balance assumed in the standard model is completely invalid for large (where the effective dust temperature substantially exceeds ). The second line of Equation (17) in this limit represents the first two terms of expansion of over . With the same accuracy, we can write333This expression can be readily obtained from Equation (1) by integrating the latter over the size distribution and equating the resulting rhs to . Then, assuming and utilizing relation (9), we arrive to Equation (19).
| (19) |
For sufficiently small , the rhs of Equation (19) is a factor of smaller than that of Equation (18), as it follows from Equation (17). This implies that for is by this factor larger than the prediction of the standard theory. Furthermore, the nonlinearity in Equation (19) is substantially stronger than that in Equation (18), which is another consequence of the deviation of dust temperature from (neglected in the standard model). A remarkable fact is that Equation (19) is explicitly independent of the gas density and characteristics of the size distribution [an implicit dependence on is via ]. This is a natural consequence of strong gas-dust thermal coupling in the limit , so is a nearly universal function of the column density.
Since the critical grain radius, Equation (13), is an increasing function of (and ), a transition to large occurs at a certain critical density. For the MRN size distribution, Equation (19) is applicable for satisfying the condition , which requires gas densities substantially larger than cm-3.
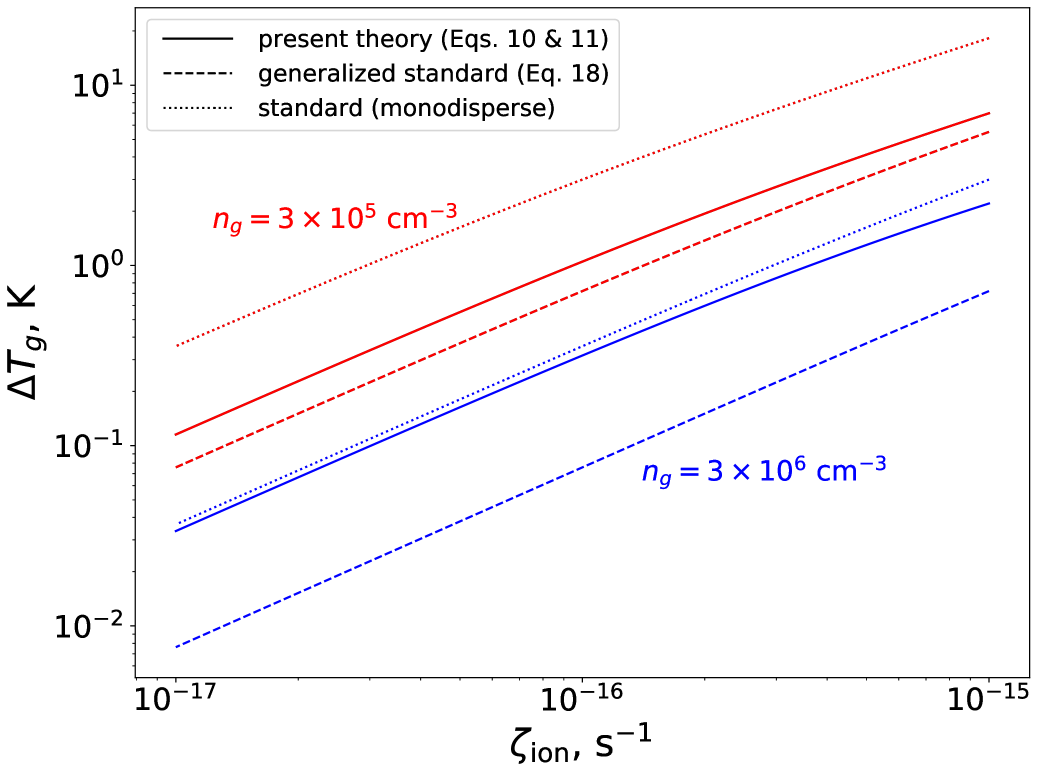
Figure 2 summarizes results for the gas temperature, presenting for cm-3 and cm-3. With the solid lines we plot the exact solution of Equations (10) and (11) [the analytical solution, Equations (14) and (15), is nearly indistinguishable], while the dashed lines depict the generalized standard model described by Equation (18). We see that the latter systematically underestimates . The disparity increases with gas density, as : the exact solution at higher approaches the value given by Equation (19), whereas predicted by the standard model keeps decreasing as .
The dotted lines in Figure 2 highlight the crucial role of the size distribution, showing derived from the standard model where grains are assumed to be monodisperse. Following the original work of Goldsmith (2001), we set the grain radius to the fiducial value of m (while the other parameters entering Equation (18) are kept the same as above). Since this value is a factor of a few larger than m for the MRN dust, for cm-3 the resulting is systematically overestimated and the dotted line lies well above the solid line (while near cm-3 the discrepancy between the exact and the standard models are almost compensated). In the following section we elaborate on the major effect of the size distribution.
IV.2. Impact of dust evolution
Possible dust evolution due to ongoing coagulation of grains (see, e.g., Flower et al., 2005; Chacón-Tanarro et al., 2017) should reduce the total surface area of dust and, hence, the thermal coupling with gas, thus increasing . A reduction of the area is described by the effective grain radius, Equation (16), which is proportional to the dust mass-to-area ratio. As we demonstrated in the beginning of Section IV.1, is a rapidly increasing function of , , and .
To describe the impact of dust evolution on the gas temperature and investigate how accurately the effective radius quantifies this, in Figure 3 we plot as a function of the ratio . We consider a range of gas densities of cm cm-3, representative of very dense pre-stellar cores (Keto & Caselli, 2010; Caselli et al., 2019). This gives the range of the critical radii , as determined by Equation (13) for . Assuming the evolution primarily leads to depletion of smaller grains, we vary in the whole size range of the canonical MRN dust, m m, while is fixed to the maximum value and varies between 0 and 1 (Weingartner & Draine, 2001). This yields varying between m (non-evolved MRN dust) and m (highly-evolved dust, concentrated at the upper bound of the MRN distribution). The exact values of (color-coded dots) are then computed from Equations (10) and (11). The approach of effective grain radius, Equations (14) and (17), is represented by the dashed line.
Figure 3 shows that for sufficiently low gas densities, cm-3, the resulting values of are small. Then the exact does not practically depend on the degree of the dust evolution and tends to the prediction of the generalized standard model – the limit described by Equation (18). The parameters of the size distribution have a fairly weak impact on also at high densities, cm-3, where is large, and the plot tends to the universal asymptote of Equation (19). We note that for K, where the nonlinearity is negligible, the plot simply scales with .
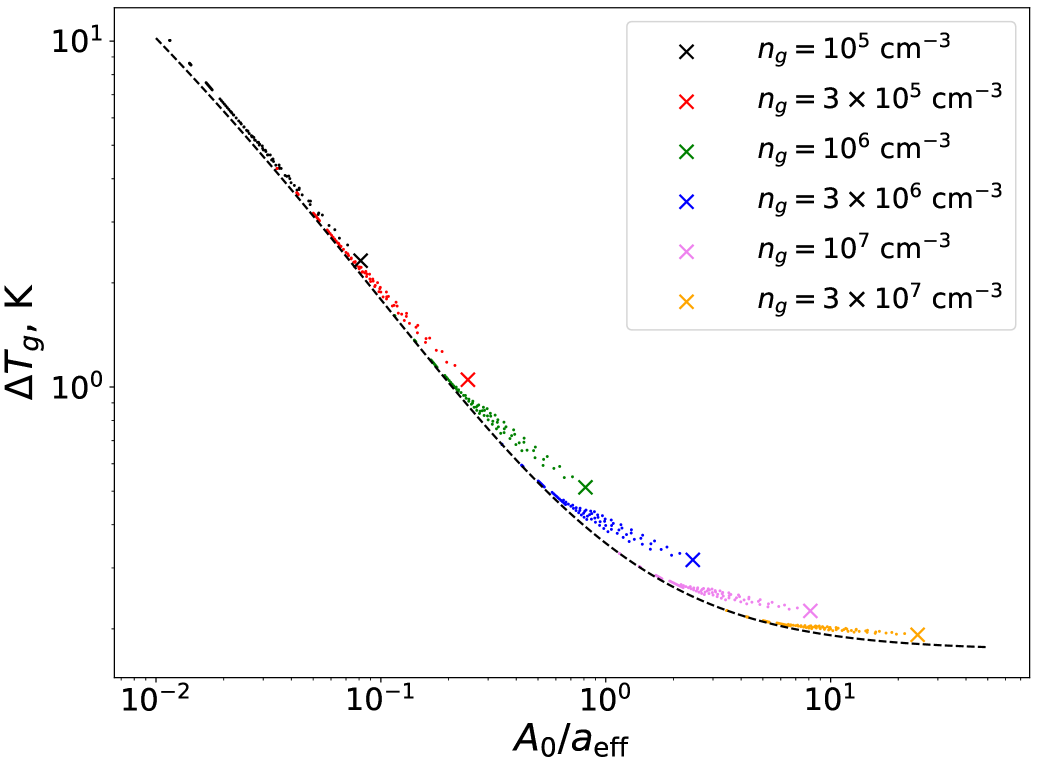
Figure 3 also highlights the fact that the maximum discrepancy between the approach of effective grain radius and the exact results occurs near . The discrepancy does not exceed 30% for the MRN dust and is naturally reduced for evolved dust, since Equation (17) becomes exact for monodisperse grains. As expected, in the limits of small or large the exact results converge to the dashed line.444A marginal deviation of the dashed line from the exact results seen in Figure 3 for K is due to a series expansion of , used to derive Equation (17). In this case, the dependence is perfectly described by Equation (18).
We recall that evolved dust is comprised of aggregates of smaller solid grains, and thus the effective material density of such aggregates is expected to decrease with size. The effective density can be described by adopting a common approach of fractal dust (see, e.g., Okuzumi et al., 2009, and references therein), where the mass of a particle of radius is assumed to scale as , with being the fractal dimension. While the discussion of existing fractal models and the choice of appropriate fractal dimension is beyond the scope of the present paper, we note that our results can, in principle, be generalized for fractal dust, by substituting the corresponding mass scaling into the rhs of Equation (9).
IV.3. Dust emission
The continuum dust emission is another observable to characterize the processes occurring in dense cores (Chacón-Tanarro et al., 2019). The emission is given by Equation (2) averaged over the grain size distribution. The effective temperature of the emission can thus be defined as
| (20) |
where . We obtain from the energy balance for dust grains, by integrating Equation (1) over the size distribution, equating the resulting rhs to , and utilizing relation (9):
| (21) |
One can see that Equation (21) is an inversion of Equation (19) with substituted for , and therefore the two temperatures coincide in the limit of large . We stress, however, that Equation (19) is only applicable in the limit of strong gas-dust coupling, while Equation (21) is appropriate for all conditions where the governing equations of our model are valid. A notable property of is that it depends neither on gas density nor on the grain size distribution.
To explore how accurately the effective dust temperature represents the emission for different values of , we have computed the total emissivity of grains for varying and parameters of the size distribution (similar to that in Figure 3) and compared the results with the modified black-body radiation of grains at . We have found that the deviation of the effective spectral energy distribution from the exact dependence in the Rayleigh-Jeans regime is practically negligible for s-1; a weak dependence on is only seen far in the Planck regime (where the emissivity is already decreased by orders of magnitude). As the higher values of are unlikely in the local cores (Neufeld & Wolfire, 2017), we conclude that the effective temperature determined by Equation (21) provides an excellent universal parametrization of the dust emission.
IV.4. Example: The pre-stellar core L1544
The physical structure of the pre-stellar core L1544 has been studied in detail in many publications (Tafalla et al., 2002; Crapsi et al., 2007; Keto et al., 2015; Chacón-Tanarro et al., 2019; Caselli et al., 2019). We have therefore chosen L1544 to illustrate the results of the present theory, and to compare these with the predictions of the commonly used standard theory.
Depending on the particular model of dust opacity used by different authors for calculating the core structure, the dust temperature () in the core center may vary between 6 and 7 K, while the peak gas density is predicted to be between a few times cm-3 and about cm-3. We adopt the radial distributions for and from Keto et al. (2015), with the peak density of cm-3 and the central dust temperature of 6.3 K (within a radius of 125 au), and calculate the dependencies and . Then we obtain from derived by Padovani et al. (2018b) (their model ), which yields the ionization rate around s-1 for cm cm-3.
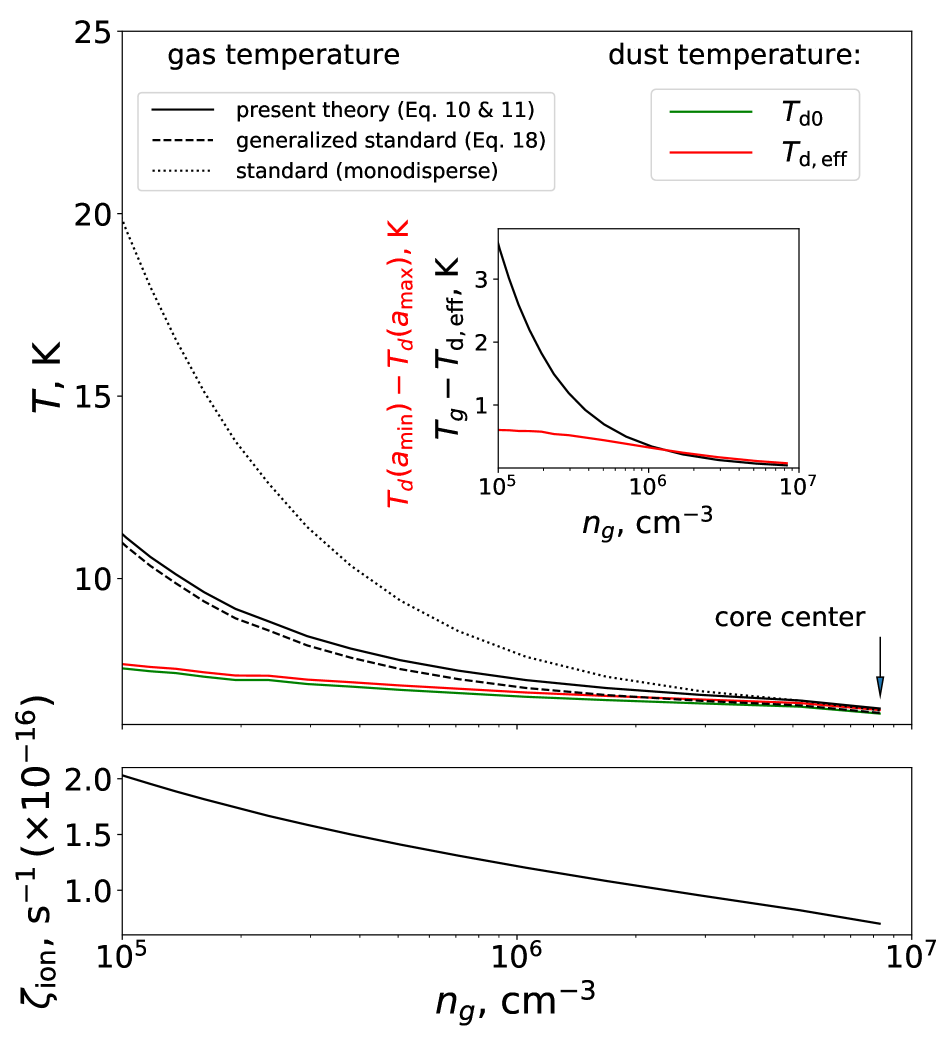
Figure 4 summarizes results for the gas and dust temperatures (upper panel) as well as for the CR ionization rate (lower panel), plotted versus the gas density in L1544. The black lines in the upper panel represent different models for , calculated for the non-evolved MRN dust. As in Figure 2, we compare the results of our exact theory, Equations (10) and (11), with the generalized standard model, Equation (18), and the standard model for monodisperse grains. We see that the generalized standard model (dashed line) provides a fair description, showing a nearly constant deviation of about 0.25 K from the exact results (solid line). The reason can be directly understood from Figure 2, where the temperature difference between the solid and dashed lines is, indeed, about that value for s-1. On the other hand, the standard model by Goldsmith (2001); Galli et al. (2002) (dotted line), assuming all grains to have a certain fiducial size (which is significantly larger than for the MRN dust, see Section IV.1), predicts a gas temperature that is substantially higher than the results of the present theory up to cm-3. At higher densities, the dotted line goes below the solid line, following the trend seen in Figure 2.
Unlike the gas temperature, the effective grain temperature characterizing the continuum emission (see Section IV.3) does not depend on the size distribution. Its deviation from remains very small (about K).
We conclude that for pre-stellar cores in the local ISM, such as L1544, the temperature difference is practically equal to the difference , and the latter is reasonably described by the generalized standard theory, Equation (18). The inset in Figure 4 suggests that its magnitude (black solid line) is expected to be between K and K for cm cm-3, i.e., should be measurable in this density range ( should start decreasing at lower densities, where the line emission becomes the efficient mechanism of gas cooling). Hence, the temperature difference deduced from observational data yields the product , which should allow us in the future to constrain models of both the CR ionization and dust evolution in dense cores.
We point out that the present theory, including the generalized standard model, yields gas temperatures in the central region of L1544 which are very close to the measurements (see, e.g., Figures 4(a) and 5 in Crapsi et al., 2007, for cm-3). A notable fact is that our results are obtained assuming the non-evolved MRN distribution of grains and using the ionization rate from Padovani et al. (2018b), who suggest s-1 for this region, whereas the standard theory (monodisperse grains with m) requires s-1 to provide agreement with the measurements (e.g., Crapsi et al., 2007; Keto & Caselli, 2010; Galli & Padovani, 2015). This reflects the crucial role of the grain size distribution (i.e., of a proper choice for ).
The inset in Figure 4 also demonstrates the difference between the temperatures of the smallest and largest grains, (red solid line). As follows from Equation (12), the difference tends to when the critical radius exceeds (the surface CR heating increases it by the value of , see Equations (A1) and (A3) in Appendix A). For L1544, this occurs at cm-3. At lower densities becomes significantly smaller than ; its magnitude remains almost constant, reaching K at cm-3. This relatively small difference may, nevertheless, have important consequences for the physical and chemical processes occurring on the surface of grains in cold dense cores, due to their extreme temperature dependence.
V. Summary and outlook
In this paper we showed that the gas temperature in dense pre-stellar cores strongly depends on parameters of the grain size distribution. Furthermore, at high gas densities the value of can substantially exceed the predictions of the standard theory, in which the dust temperature is assumed to be size-independent and equal to – the value determined from the balance of radiative heating and cooling of a grain at the column density . Equations (14) and (15) yield an accurate analytical relation between and the CR ionization rate for a given size distribution, valid for gas densities cm-3 (where the gas cooling due to molecular line emission is negligible) and cm-3 (where the coupling to the local thermal radiation of dust can be safely neglected).
We also derived an expression for the effective dust temperature , Equation (21), which provides a parametrization of the spectral energy distribution of the continuum emission (valid for the same range of ). We found that the dust emissivity does not depend on the gas density or the grain size distribution, and is solely determined by the values of and .
To facilitate the use of our model, in Appendix C we present a convenient parametrization for the gas and dust temperatures, applicable for typical conditions in dense cores:
-
1.
Gas temperature. Equation (C1) gives the relation between and , and also depends on the local parameters and as well as on , the relative width of the size distribution. In particular, for s-1, K, and values of chosen for the plot in Figure 3, this relation yields the median curves through the corresponding color-coded points (varying only leads to a slight scatter of the points off the curves, and therefore has a minor effect on the results). The curves connect the crosses (MRN dust) with the dashed line (monodisperse grains) in that figure, thus parameterizing the dependence of on the size distribution.
- 2.
Our findings imply that measuring both and in a range of gas densities between cm cm-3 (where the predicted magnitude of is expected to be above the measurement uncertainty, see Figure 4), one could develop a method for estimating and constraining the ionization rate and the degree of dust evolution. The present theory predicts the values of in the pre-stellar core L1544 which are very close to the measured values (Crapsi et al., 2007), assuming the non-evolved MRN distribution of grain sizes and the ionization rate as high as s-1. In the future we plan to carry out a detailed analysis and check if our results could reproduce the ALMA and JVLA observations of Caselli et al. (2019) and Crapsi et al. (2007) toward L1544. In general, by combining our model with models for initial stages of dust coagulation in dense pre-stellar cores (Flower et al., 2005; Chacón-Tanarro et al., 2017), we will gain deeper insights into fundamental physical processes occurring in these objects and better understand the mechanisms controlling CR penetration into the clouds. For example, comparing the CR ionization in diffuse and dense regions of molecular clouds should allow us to discriminate between different transport regimes of CRs, resulting in largely different attenuation of with the column density (Silsbee & Ivlev, 2019).
Finally, the conclusion that the temperature of smaller grains approaches at higher gas densities, while bigger grains are at may have a profound impact on the speed of physical and chemical processes occurring on the dust surface. The thermally activated desorption of atoms and molecules from the surface as well as the surface diffusion and, hence, the diffusion-limited chemical reactions obey the Arrhenius temperature dependence, with the typical activation energy of the order of hundreds of Kelvin (e.g., Vasyunin et al., 2017). Therefore, the temperature increase by only a few tenths of Kelvin for smaller grains (dominating the dust surface) could lead to a significant acceleration of these processes. Furthermore, given a highly uncertain “average” rate of the CR ionization in the ISM (Indriolo & McCall, 2012), and the fact that the ionization can be very strongly enhanced close to protostars (Ceccarelli et al., 2014; Podio et al., 2014) and supernova remnants (Vaupré et al., 2014) – serving as sources of the local CRs, the surface chemistry could be affected dramatically. The additional dust heating by CRs, discussed in Appendix A, could play especially important role in these environments. This problem will be studied in a separate paper.
We would like to thank Daniele Galli for useful discussions and suggestions, and an anonymous referee for constructive and stimulating suggestions.
Appendix A Appendix A
Additional dust heating by CRs
The CR heating of dust contains both surface (UV absorption, recombination) and volume (IR absorption, CR bombardment) terms. Hence, a sum should be added to the rhs of Equation (1), generalizing the energy balance for a grain. The numerical factors are conveniently determined from
where are the energies per H2 ionization for the surface and volume heating, respectively (see below). We immediately infer that the governing relation between the gas and dust temperatures, Equation (10), remains unchanged after the following replacement:
| (A1) | |||||
| (A2) |
The respective “shifts” due to the surface and volume heating is then obtained from Equation (10),
| (A3) | |||||
| (A4) |
where is the effective grain radius, Equation (16). Replacing with its shifted value in Equation (11), we conclude that this governing equation remains unchanged, too, if the ionization rate is replaced with
| (A5) |
Thus, Equations (A1)–(A5) extend the results of the present paper by including additional CR-induced mechanisms of dust heating.
Note that in governing equations (10) and (11) is to be replaced with its shifted value only where it explicitly enters, i.e., Equation (A1) does not apply to the thermal velocity scale . Consequently, after substituting Equations (A1)–(A5) into the analytical approximation, Equations (14) and (15), term in splits into two: the first two components of in Equation (B1) multiplied with plus the last component multiplied with . Similarly, for the approach of effective grain radius, Equation (17), term inside the square brackets splits into the first component in the parentheses multiplied with plus the second component multiplied with .
The above analysis allows us to understand the relative importance of the surface and volume dust heating by CRs, depending on the value of the critical grain radius . From Equation (12) it follows that the effect of surface heating is weak for grains much larger than , i.e., their temperature is close to and the contribution of is negligible. Hence, for the gas temperature is determined from the generalized standard model, Equation (18), with replaced according to Equation (A2). In the opposite limit of one can rigorously show that , i.e., is negligible, too. The gas temperature in this case is described by Equation (19) with and replaced according to Equations (A2) and (A5). This shows that the surface dust heating by CRs is only important for large , where its effect is merely equivalent to increasing the ionization rate.
A.1. Role of the additional heating for dense cores
In Section IV.4 we show that the generalized standard model reasonably describes for conditions of the pre-stellar core L1544, in the density range where the predicted difference between gas and dust temperatures should be measurable. Therefore, for such cores the gas temperature practically does not depend on the surface heating; could only be affected by the additional volume heating, which leads to higher according to Equation (A2).
The absorption efficiency of the Lyman-Werner photons by silicate grains with m is approximately described by a size-independent (Draine, 2011). Thus, UV radiation due to H2 and He electronic excitation by CRs mostly contributes to the surface heating, with eV per H2 ionization (Dalgarno et al., 1999; Glassgold et al., 2012). (Formation of molecular hydrogen on grains adds to the surface heating, but the resulting value of (of the order of a few eV) is quite uncertain.) Near-IR radiation from vibrationally excited H2 could potentially contribute to (neglecting collisional quenching, see Dalgarno et al., 1999), with up to eV per H2 ionization, while the effect of direct CR bombardment is negligible (unless is extremely high, see Hocuk et al., 2017). By comparing Equation (A4) with (21), noting that , and making use of parametrization (C2) in Appendix C, we conclude that the expected correction to cannot exceed a few percent.
Appendix B Appendix B
Functions
Appendix C Appendix C
Parametrization for and
To calculate the gas temperature, we employ the general analytical approximation, Equations (14) and (15), with from Equation (B2). Figure 3 suggests that for typical conditions in dense cores the nonlinearity in is only significant for small values of , asymptotically described by Equation (18). Therefore, we use for the thermal velocity scale in Equation (14) and neglect the term with in Equation (15); the latter introduces only a small error (of about 6% for s-1) in the regime of large . After some manipulation, we obtain
| (C1) |
where and are in units of Kelvin. Equation (C1) depends on the following three parameters:
determined by , where m is fixed. Parameter is a measure of the size distribution width; the case of monodisperse dust is recovered in the limit , where . For , Equation (C1) tends to the generalized standard model, Equation (18), for it approaches the universal asymptote of Equation (19).
The effective dust temperature is directly obtained from Equation (21):
| (C2) |
where, again, and are in units of Kelvin.
References
- Akimkin et al. (2013) Akimkin, V., Zhukovska, S., Wiebe, D., et al. 2013, ApJ, 766, 8
- Bacalla et al. (2019) Bacalla, X. L., Linnartz, H., Cox, N. L. J., et al. 2019, A&A, 622, A31
- Bergin & Tafalla (2007) Bergin, E. A., & Tafalla, M. 2007, ARA&A, 45, 339
- Bonnor (1956) Bonnor, W. B. 1956, MNRAS, 116, 351
- Burke & Hollenbach (1983) Burke, J. R., & Hollenbach, D. J. 1983, ApJ, 265, 223
- Caselli et al. (1999) Caselli, P., Walmsley, C. M., Tafalla, M., Dore, L., & Myers, P. C. 1999, ApJ, 523, L165
- Caselli et al. (2019) Caselli, P., Pineda, J. E., Zhao, B., et al. 2019, ApJ, 874, 89
- Ceccarelli et al. (2014) Ceccarelli, C., Dominik, C., López-Sepulcre, A., et al. 2014, ApJ, 790, L1
- Cecchi-Pestellini & Aiello (1992) Cecchi-Pestellini, C., & Aiello, S. 1992, MNRAS, 258, 125
- Chacón-Tanarro et al. (2017) Chacón-Tanarro, A., Caselli, P., Bizzocchi, L., et al. 2017, A&A, 606, A142
- Chacón-Tanarro et al. (2019) Chacón-Tanarro, A., Pineda, J. E., Caselli, P., et al. 2019, A&A, 623, A118
- Crapsi et al. (2005) Crapsi, A., Caselli, P., Walmsley, C. M., et al. 2005, ApJ, 619, 379
- Crapsi et al. (2007) Crapsi, A., Caselli, P., Walmsley, M. C., & Tafalla, M. 2007, A&A, 470, 221
- Dalgarno et al. (1999) Dalgarno, A., Yan, M., & Liu, W. 1999, ApJS, 125, 237
- Draine (1978) Draine, B. T. 1978, ApJS, 36, 595
- Draine (2011) —. 2011, Physics of the Interstellar and Intergalactic Medium (Princeton: Princeton University Press)
- Evans et al. (2001) Evans, Neal J., I., Rawlings, J. M. C., Shirley, Y. L., & Mundy, L. G. 2001, ApJ, 557, 193
- Flower et al. (2005) Flower, D. R., Pineau Des Forêts, G., & Walmsley, C. M. 2005, A&A, 436, 933
- Galli & Padovani (2015) Galli, D., & Padovani, M. 2015, arXiv e-prints, arXiv:1502.03380
- Galli et al. (2002) Galli, D., Walmsley, M., & Gonçalves, J. 2002, A&A, 394, 275
- Glassgold et al. (2012) Glassgold, A. E., Galli, D., & Padovani, M. 2012, ApJ, 756, 157
- Goldsmith (2001) Goldsmith, P. F. 2001, ApJ, 557, 736
- Harju et al. (2017) Harju, J., Daniel, F., Sipilä, O., et al. 2017, A&A, 600, A61
- Hocuk et al. (2017) Hocuk, S., Szűcs, L., Caselli, P., et al. 2017, A&A, 604, A58
- Indriolo & McCall (2012) Indriolo, N., & McCall, B. J. 2012, ApJ, 745, 91
- Ivlev et al. (2018) Ivlev, A. V., Dogiel, V. A., Chernyshov, D. O., et al. 2018, ApJ, 855, 23
- Keto & Caselli (2008) Keto, E., & Caselli, P. 2008, ApJ, 683, 238
- Keto & Caselli (2010) —. 2010, MNRAS, 402, 1625
- Keto et al. (2015) Keto, E., Caselli, P., & Rawlings, J. 2015, MNRAS, 446, 3731
- Keto et al. (2014) Keto, E., Rawlings, J., & Caselli, P. 2014, MNRAS, 440, 2616
- Launhardt et al. (2013) Launhardt, R., Stutz, A. M., Schmiedeke, A., et al. 2013, A&A, 551, A98
- Léger et al. (1985) Léger, A., Jura, M., & Omont, A. 1985, A&A, 144, 147
- McKee (1989) McKee, C. F. 1989, ApJ, 345, 782
- Neufeld & Wolfire (2017) Neufeld, D. A., & Wolfire, M. G. 2017, ApJ, 845, 163
- Okuzumi et al. (2009) Okuzumi, S., Tanaka, H., & Sakagami, M.-a. 2009, ApJ, 707, 1247
- Padovani et al. (2018a) Padovani, M., Galli, D., Ivlev, A. V., Caselli, P., & Ferrara, A. 2018a, A&A, 619, A144
- Padovani et al. (2018b) Padovani, M., Ivlev, A. V., Galli, D., & Caselli, P. 2018b, A&A, 614, A111
- Podio et al. (2014) Podio, L., Lefloch, B., Ceccarelli, C., Codella, C., & Bachiller, R. 2014, A&A, 565, A64
- Prasad & Tarafdar (1983) Prasad, S. S., & Tarafdar, S. P. 1983, ApJ, 267, 603
- Sadavoy et al. (2016) Sadavoy, S. I., Stutz, A. M., Schnee, S., et al. 2016, A&A, 588, A30
- Shen et al. (2004) Shen, C. J., Greenberg, J. M., Schutte, W. A., & van Dishoeck, E. F. 2004, A&A, 415, 203
- Shingledecker et al. (2018) Shingledecker, C. N., Tennis, J., Le Gal, R., & Herbst, E. 2018, ApJ, 861, 20
- Shu et al. (1987) Shu, F. H., Adams, F. C., & Lizano, S. 1987, ARA&A, 25, 23
- Silsbee & Ivlev (2019) Silsbee, K., & Ivlev, A. V. 2019, ApJ, 879, 14
- Sipilä & Caselli (2018) Sipilä, O., & Caselli, P. 2018, A&A, 615, A15
- Sipilä et al. (2019) Sipilä, O., Caselli, P., Redaelli, E., Juvela, M., & Bizzocchi, L. 2019, MNRAS, 487, 1269
- Steinacker et al. (2016) Steinacker, J., Bacmann, A., Henning, T., & Heigl, S. 2016, A&A, 593, A6
- Tafalla et al. (2002) Tafalla, M., Myers, P. C., Caselli, P., Walmsley, C. M., & Comito, C. 2002, ApJ, 569, 815
- Vasyunin et al. (2017) Vasyunin, A. I., Caselli, P., Dulieu, F., & Jiménez-Serra, I. 2017, ApJ, 842, 33
- Vaupré et al. (2014) Vaupré, S., Hily-Blant, P., Ceccarelli, C., et al. 2014, A&A, 568, A50
- Weingartner & Draine (2001) Weingartner, J. C., & Draine, B. T. 2001, ApJ, 548, 296
- Weingartner et al. (2006) Weingartner, J. C., Draine, B. T., & Barr, D. K. 2006, ApJ, 645, 1188
- Woitke et al. (2009) Woitke, P., Kamp, I., & Thi, W.-F. 2009, A&A, 501, 383
- Zhao et al. (2018) Zhao, B., Caselli, P., & Li, Z.-Y. 2018, MNRAS, 478, 2723
- Zucconi et al. (2001) Zucconi, A., Walmsley, C. M., & Galli, D. 2001, A&A, 376, 650