A NICER thermonuclear burst from the millisecond X-ray pulsar SAX J1808.4–3658
Abstract
The Neutron Star Interior Composition Explorer (NICER) has extensively monitored the August 2019 outburst of the 401 Hz millisecond X-ray pulsar SAX J1808.4–3658. In this Letter, we report on the detection of a bright helium-fueled Type I X-ray burst. With a bolometric peak flux of erg s-1 cm-2, this was the brightest X-ray burst among all bursting sources observed with NICER to date. The burst shows a remarkable two-stage evolution in flux, emission lines at keV and keV, and burst oscillations at the known pulsar spin frequency, with % fractional sinusoidal amplitude. We interpret the burst flux evolution as the detection of the local Eddington limits associated with the hydrogen and helium layers of the neutron star envelope. The emission lines are likely associated with Fe, due to reprocessing of the burst emission in the accretion disk.
1 Introduction
The proto-typical accreting millisecond X-ray pulsar (AMXP) SAX J1808.4–3658 (hereafter SAX J1808), was first discovered through the detection of a thermonuclear (Type I) X-ray burst with the BeppoSAX satellite in September 1996 (in ’t Zand et al., 1998). With X-ray outbursts recurring every years, this source has been extensively monitored ever since, leading to the first detection of accretion-powered millisecond pulsations (Wijnands & van der Klis, 1998), and the confirmation that X-ray burst oscillations correspond with the stellar spin frequency (Chakrabarty et al., 2003).
In each of the eight outbursts from SAX J1808 that occurred between 1996 and 2015, at least one X-ray burst has been detected (in’t Zand et al., 2001; Bult & van der Klis, 2015; Patruno et al., 2017; Sanna et al., 2017). The majority of these bursts showed burst oscillations (Bilous & Watts, 2018) and were observed near peak luminosity of their respective outbursts, when the accretion rate was yr-1 (Bult & van der Klis, 2015). Detailed modelling of a well sampled burst train observed with the Rossi X-ray Timing Explorer (RXTE) in October 2002 (Galloway & Cumming, 2006) demonstrated that these events are examples of X-ray bursts in the “delayed helium” regime (Narayan & Heyl, 2003; Galloway et al., 2017). In brief, these bursts are due to a thermonuclear flash in a nearly pure helium layer of the neutron star envelope. This layer of helium builds up on a timescale of one to a few days, through a stable -limited CNO cycle at the base of a hydrogen layer. The hydrogen layer, in turn, is replenished by the continuous accretion of gas supplied by a hydrogen-rich brown dwarf companion star, which resides in a 2.01 hour orbit around the pulsar (Chakrabarty & Morgan, 1998; Bildsten & Chakrabarty, 2001).
The X-ray bursts of SAX J1808 have also reliably shown photospheric radius expansion (PRE; see, e.g., Galloway et al. 2008, for a review). Such PRE may drive the ejection of burning ashes, whose presence could cause discrete spectral features in the burst emission (Weinberg et al., 2006; Yu & Weinberg, 2018). Measuring such spectral lines gives a window into the thermonuclear burning reactions, and can potentially be used to constrain the neutron star compactness. Additionally, a large fraction of the burst emission is expected to be intercepted and reprocessed by the accretion disk (Ballantyne & Everett, 2005; Degenaar et al., 2018; Fragile et al., 2018), providing an opportunity to characterize the state of the accretion disk through the spectrum of the reflected burst emission.
Launched in June 2017, the Neutron Star Interior Composition Explorer (NICER; Gendreau & Arzoumanian 2017) combines good spectral resolution with superb time-resolution and high throughput in the keV energy band. These properties make NICER an ideal instrument to study the evolution of PRE in Type I X-ray bursts (see, e.g., Keek et al., 2018a, b; Jaisawal et al., 2019), and search for discrete spectral features (Strohmayer et al., 2019). Hence, when SAX J1808 began a new outburst in August 2019 (Russell et al., 2019; Goodwin et al., 2019b; Parikh & Wijnands, 2019; Bult et al., 2019), we triggered an extensive NICER monitoring campaign. During this campaign we detected two X-ray bursts; the first occurred on August 9 and was relatively faint, the second was seen on August 21 and was much brighter. In this Letter we report on the unusual properties of the August 21 X-ray burst. The detailed analysis of the earlier burst and the full NICER campaign will be presented elsewhere.
2 Observations
On 2019 August 21 at 02:04 UTC, NICER observed a bright X-ray burst from SAX J1808. These data are available under the NICER ObsID 2584010501. We processed the data using nicerdas v6a, which is packaged with heasoft v6.26. We applied standard screening criteria, keeping only those time intervals when the pointing offset was , the Earth limb elevation angle was , the elevation angle with respect to the bright Earth limb was , and the instrument was outside of the geographic region of the South Atlantic Anomaly. Additionally, standard background screening criteria were applied, which reject all epochs where the rate of saturating particle events (overshoots) is greater than ct s-1 detector-1, or greater than 1.52 * cor_sax-0.633, where cor_sax111The cor_sax parameter is based on a model for the cut-off rigidity that was originally developed for the BeppoSAX satellite, and has no specific relation to SAX J1808. gives the cut-off rigidity of the Earth’s magnetic field, in units of GeV c-1. We then applied the barycorr tool to correct the observed event times to the Solar System barycenter, where we used the JPL DE405 planetary ephemeris (Standish, 1998) and the optical coordinates of Hartman et al. (2008). Finally, we estimated the background contributions to our data from NICER observations of the RXTE blank-field regions (Jahoda et al., 2006).
3 Analysis and Results
The X-ray burst onset, , occurred on MJD 58716.089362 TDB, which was into a continuous exposure. In the following we focus our analysis on this exposure and express all times with respect to the noted onset time.
3.1 Light curve and phenomenology
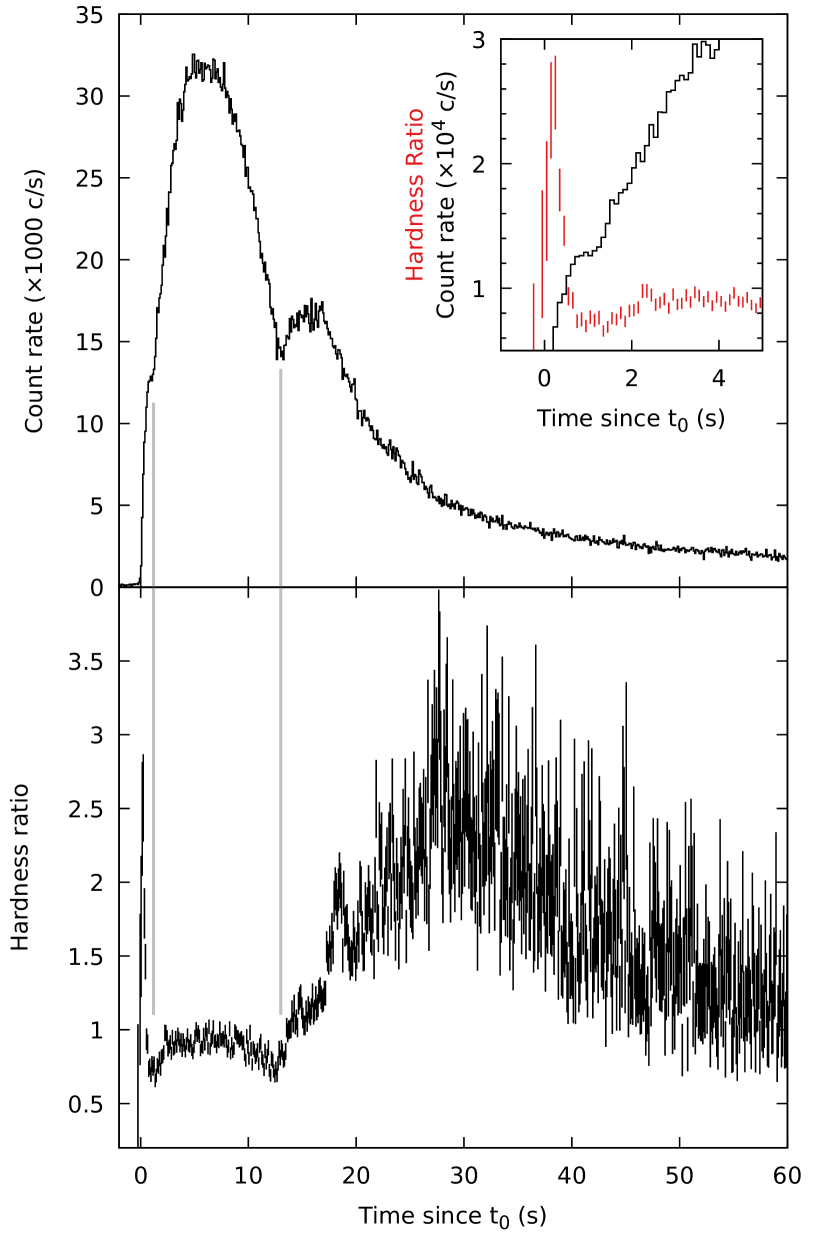
At the keV count-rate increased rapidly from an averaged ct s-1 to ct s-1 over a timespan of . The peak rate was maintained for , before the burst began to decay. The subsequent decay progressed on a minute-long time scale: at the burst rate had dropped to below 5% of the peak rate, and by the end of the available exposure, at , the source flux had fallen to ct s-1. While this rate was slightly higher than the averaged preburst rate, the preburst light curve showed a modest upward trend. If we fit this trend with a linear function, then we find that the burst rate decayed to the extrapolated intensity at .
Two unusual features stand out in the burst light curve (Figure 1). First, it shows a pronounced double peaked structure, with a local minimum of ct s-1 at and a secondary peak of ct s-1 at . While double-peaked X-ray bursts have commonly been observed, these structures are usually caused by PRE: the temperature of the photosphere temporarily shifts out of the instrument passband, causing an apparent dip in the observed X-ray rate (Grindlay et al., 1980). Given its low-energy coverage, NICER is able to follow the temperature of the photosphere throughout the PRE phase, so any observed dip in the light curve is likely due to a dip in bolometric flux (Keek et al., 2018a; Jaisawal et al., 2019). We investigate this in Section 3.4.
Second, there is a noticeable pause during the rise to the first peak. Initially the flux increases rapidly; however, between and , this rise briefly stalls, with the count-rate remaining constant at ct s-1. After this pause, the rate continues to increase toward the maximum, albeit at a slightly slower pace (Figure 1, inset of top panel). Simultaneously, the hardness ratio (the keV rate over the keV rate) evolves dramatically. As the count-rate begins to rise, the hardness ratio spikes. Subsequently, the hardness briefly dips, and then stabilizes. It is during the dip that the pause in count-rate is observed. Additionally, the previously mentioned dip in count-rate (at ), coincides with a similar dip in the hardness ratio, suggesting these two features are related.
3.2 Pre-burst emission
We extracted a spectrum from prior to the burst and modelled it in xspec v12.10 (Arnaud, 1996). Following Di Salvo et al. (2019), we find that the spectrum could be well described with the model
tbabs( diskbb + nthcomp ),
where the tbabs interstellar absorption model (Wilms et al., 2000) was used with the photoelectric cross-sections of Verner et al. (1996), diskbb (Makishima et al., 1986) is a multi-color disk blackbody component, and nthcomp (Zdziarski et al., 1996; Życki et al., 1999) is a thermal Comptonization component. We used an absorption column density of cm-2 (Papitto et al., 2009; Di Salvo et al., 2019), and electron temperature of 30 keV (Di Salvo et al., 2019). We further tied the nthcomp photon seed temperature to the disk temperature. Our best-fit had a reduced () of 1.04 for 375 degrees of freedom (dof), yielding an inner disk temperature of keV and a power-law photon index of . Using the cflux model we further measured the unabsorbed keV flux to be , from which we extrapolate a bolometric flux ( keV) of . Assuming a distance of kpc (Galloway & Cumming, 2006), a 1.4 neutron star mass, and a 10 km radius, this corresponds to a mass accretion rate of yr-1, which is of the Eddington rate.
3.3 Burst spectroscopy
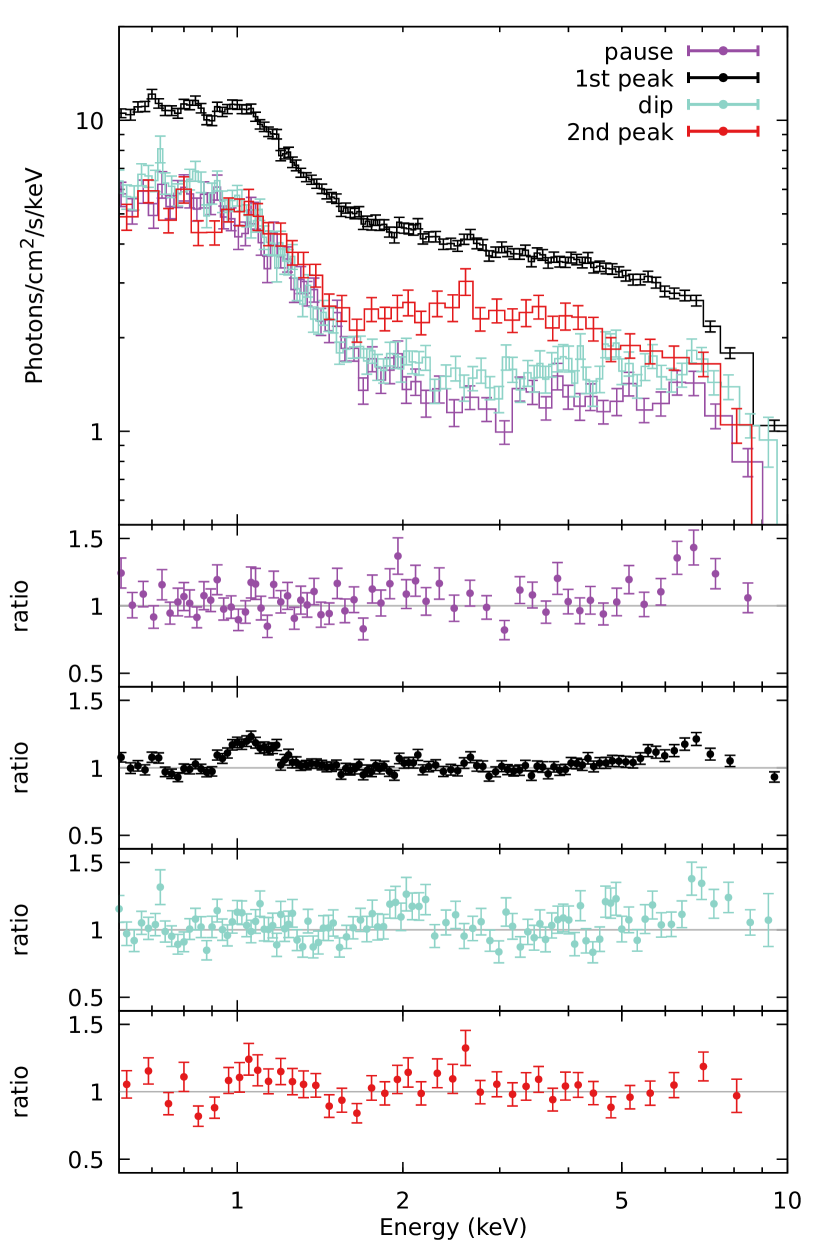
We investigated the spectral shape of the burst emission by extracting a spectrum from a interval at the peak of the burst (Figure 2). We first attempted to model this spectrum by adding a blackbody component to the preburst spectrum model, holding all parameters except for those of the blackbody constant. At a of for 631 dof, this model failed to account for a large excess below 1.5 keV and above 5 keV.
In an attempt to account for the residuals we applied a free scaling factor to the components describing the preburst spectrum (Worpel et al., 2013), so that our model was
tbabs(bbodyrad + f(diskbb + nthcomp)),
where bbodyrad is a blackbody component with its normalization proportional to surface area. At a of 5.4 for 630 dof, this model failed to remove the large residuals. Additionally, at , the magnitude of the obtained scaling factor is not realistic, as it is much larger than the that is typically observed (Worpel et al., 2013).
In an alternative approach to account for the large soft excess, we adopted a model consisting of the fixed preburst model plus two blackbody components. This model provided a much better description of the data ( of 1.11 for 628), yielding a blackbody with keV and km for the soft excess, and keV and km for the higher energy emission (presumably the photosphere). Some structure still remained in the residuals, most prominently at 1.0 keV and 6.5 keV. The fit was significantly improved ( of 1.07 for 624 dof) by adding a diskline component (Fabian et al., 1989) at keV, along with a Gaussian line at keV. The signal strength of the diskline was insufficient to reliably constrain the disk radius and inclination, giving respective limits of and . Instead, we fixed the inner radius to , which is the approximate magnetospheric radius (Bult & van der Klis, 2015), and the inclination to , which is within the range allowed by modelling of the Fe K line in the persistent emission of SAX J1808 (Cackett et al., 2009; Papitto et al., 2009; Di Salvo et al., 2019). We further note that while this inclination is inconsistent with the limit derived by Galloway & Cumming (2006), a more sophisticated analysis of the same burst data yield (Goodwin et al., 2019a). With these parameters held constant, we obtained a line normalization of ph cm-2 s-1. Meanwhile, the 1 keV Gaussian line had a normalization of ph cm-2 s-1 and standard deviation of keV.
In an attempt to apply a physical foundation to our modelling of these data, we also fit the spectrum using the reflection models of Ballantyne (2004). This overall model is summarized as
tbabs( bbodyrad + diskbb + nthcomp
+ rdblur*atable{reflection} )
where rdblur is a convolution component that applies the relativistic effects associated with an accretion disk around a compact object, and the reflection component tabulates reflection spectra calculated for a hydrogen density of , using a grid in temperature (), ionization (), and Fe abundance (). As before, we kept the parameters for the absorption column and preburst components fixed. The temperature parameter of the reflection table was linked to the blackbody temperature, and the rdblur parameters were identical to those of the diskline component discussed above. This model yielded a reasonable description of the continuum ( of 1.2 for 628 dof), but left a large residual at 1 keV. Adding in a Gaussian component gave a good fit to the data at a of 0.95 for 633 dof, with a normalization of ph cm-2 s-1 and standard deviation keV. The best-fit parameters for the reflection component were , , and an unabsorbed bolometric reflection flux of erg s-1 cm-2, indicating the reflection fraction is . Finally, we note that in this model, the photosphere blackbody had a temperature of keV and a radius of km. While the temperature is consistent with the double blackbody model, the radius is significantly smaller.
The double blackbody and reflection models both provide a statistically acceptable description of the spectrum, and give a roughly equivalent interpretation. Since the double blackbody model is phenomenologically simpler, it can be fit robustly to much shorter integration times, yielding a higher time resolution view of the spectral evolution in the burst. In the following we will therefore focus our analysis on this model.
We extracted spectra from three other distinct time intervals during the burst: the pause (0.6 s), the dip (0.7 s), and the second peak (2 s). Each spectrum could be described with the double blackbody spectrum plus keV diskline component. The second peak additionally required an emission line at 1 keV. These spectra are shown in Figure 2 and their best-fit parameters are listed in Table 3.3.
| Component | Parameter | Unit | Main Peak | Pause | Dip | Second peak | |
|---|---|---|---|---|---|---|---|
| Soft blackbody | temperature | keV | 0.233±0.003 | 0.228±0.007 | 0.210±0.005 | 0.22±0.01 | |
| Soft blackbody | normalization | km | 318 ±5 | 240±17 | 297±18 | 236±31 | |
| Hard blackbody | temperature | keV | 1.83±0.03 | 2.5±0.2 | 2.52±0.14 | 1.99±0.11 | |
| Hard blackbody | normalization | km | 14.7±0.3 | 6.2±0.5 | 6.8±0.4 | 10.5±0.7 | |
| Gaussian line | line energy | keV | 1.05±0.02 | 1.05±0.02 | |||
| Gaussian line | standard deviation | keV | 0.05_-0.02^+0.07 | 0.07±0.02 | |||
| Gaussian line | normalization | ph cm-2 s-1 | 0.27±0.07 | 0.26±0.07 | |||
| diskline | line energy | keV | 6.7_-0.3^+0.1 | 6.7±0.1 | 6.7±0.1 | 6.8±0.1 | |
| diskline | inclination | degrees | 65 | 65 | 65 | 65 | |
| diskline | inner radius | GM/c2 | 11 | 11 | 11 | 11 | |
| diskline | normalization | ph cm-2 s-1 | 0.62±0.16 | 0.47±0.14 | 0.5±0.2 | 0.45±0.16 | |
| / dof | 1.07/624 | 1.13/182 | 1.05/264 | 1.17/487 | |||
3.4 Time-resolved spectroscopy
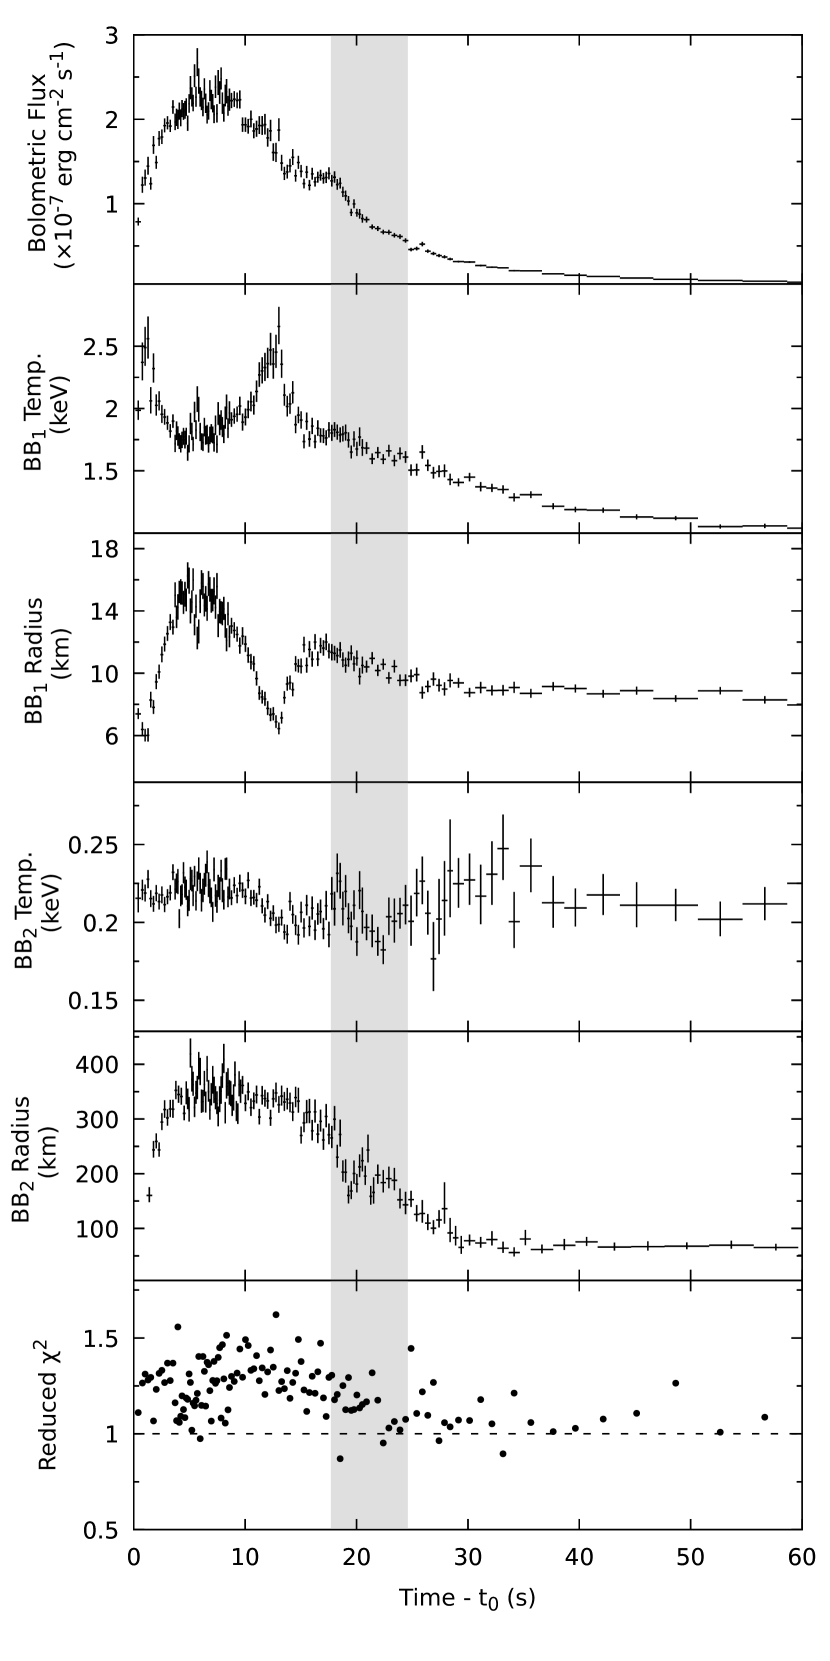
To investigate the full spectral evolution of the X-ray burst, we applied high-resolution time-resolved spectroscopy. We extracted 133 spectra from dynamically allocated intervals. Each interval was constructed to have at least 0.125 s of exposure, and was increased as needed to include a minimum of 2000 counts. Each spectrum was then fit using the double blackbody model. For simplicity we did not include emission line components, giving in slightly poorer fit statistics. The resulting evolution in spectral parameters is shown in Figure 3.
The time resolved spectroscopy demonstrates that the hot ( keV) blackbody in our model can be understood as the emission from a neutron star photosphere that undergoes PRE between and . The radius expansion is moderate, reaching a maximum radius of km. The cool ( keV) blackbody, on the other hand, maintains a stable temperature through the burst, with its emitting area closely tracking the evolution of the overall flux. This trend further supports the idea that the soft excess tracks an interaction between the burst emission and the neutron star environment, such as the disk reflection model discussed in Section 3.3.
Considering the bolometric flux, we see that the burst emission reaches a stable peak of erg s-1 cm-2 when the photosphere is at its largest extent. As the photosphere begins to contract, the flux begins to decrease. This cooling trend, however, is interrupted at . In the following , we see the bolometric flux holding constant, causing an excess over the cooling trend that coincides exactly with the second peak observed in the light curve. Hence, the spectroscopy confirms that the dip and second peak seen in the light curve are indeed astrophysical in origin rather than a passband effect.
Finally, we note a peculiar feature in the spectroscopic results: the temperature evolution of the photosphere shows two peaks, marking the start and end of the PRE phase. These start and end times coincide with the pause and the dip, respectively. Furthermore, both the pause and the dip have the same bolometric flux level of erg s-1 cm-2.
3.5 Burst oscillations
To search for burst oscillations, we constructed a time-resolution light curve in the keV energy band. We then searched for coherent oscillations in a 10 Hz region centered on the known 401 Hz pulsar spin frequency by applying a sliding window search method (see, e.g., Bilous & Watts, 2018, and references therein). Specifically, we used window sizes of , with strides of . For each window position, we computed a power spectrum and searched for a signal power in excess of the expected noise distribution (van der Klis, 1989). We detected a significant oscillation () in all windows between and . The fractional sinusoidal amplitude222Sinusoidal amplitudes are a factor of larger than fractional rms amplitudes. of the burst oscillation was , while the oscillation frequency was Hz and did not show any significant drift.
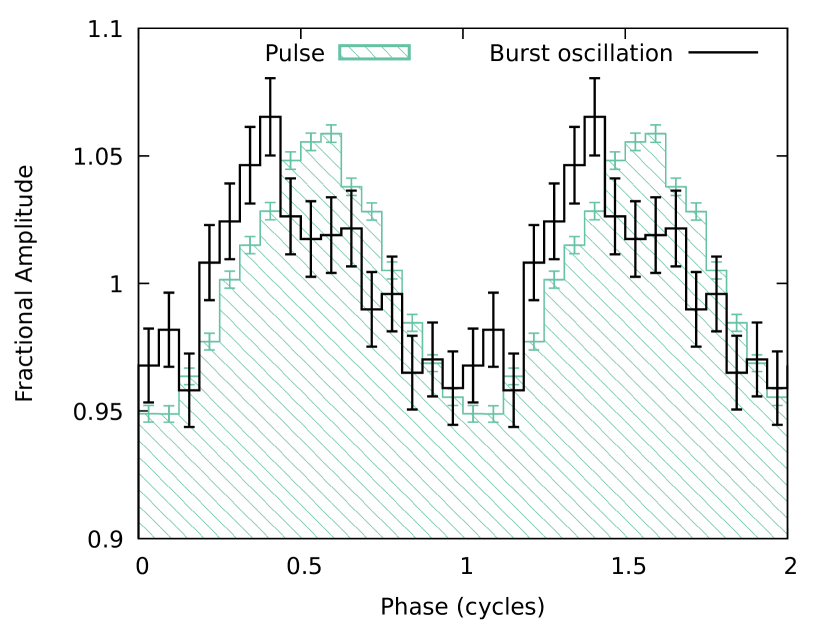
Given the stability of the burst oscillation frequency, we folded the event times within the noted epoch on the pulsar spin period to obtain a waveform for the burst oscillation. For comparison, we also extracted the waveform of the persistent pulsations from the full ObsID, excluding the burst emission (see Bult et al. 2019 for a preliminary ephemeris). Both waveforms are shown in Figure 4. The burst oscillation has a similar profile and amplitude as the persistent pulsation, but appears to lead the pulse by .
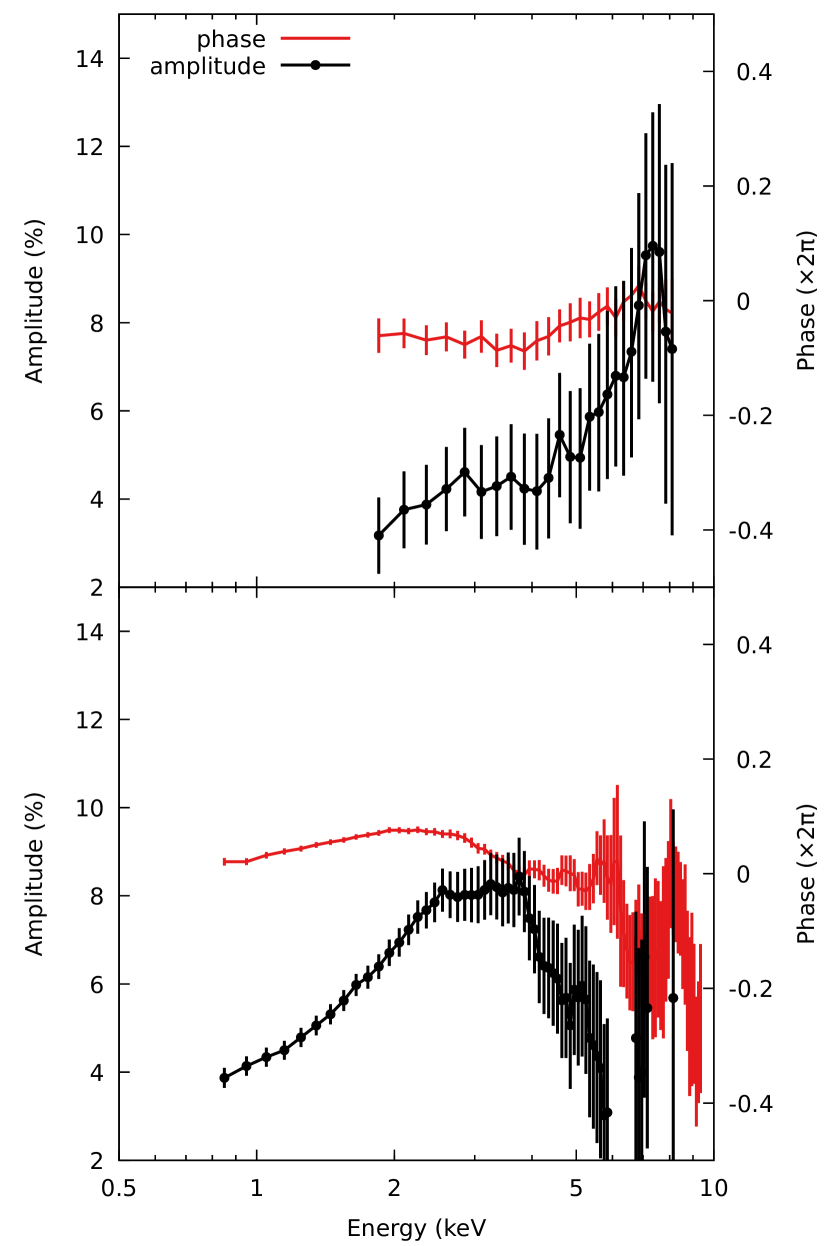
To resolve the burst oscillation with respect to photon energy, we applied a sliding window to the instrument energy channel space, using a window size of 100 channels and strides of 10 channels. At each window position, we folded the selected data and measured the burst oscillation amplitude and phase. We then repeated this method for the non-burst data. The resulting amplitude spectra are shown in Figure 5. Although the averaged profiles are similar, the energy dependence of the burst oscillation is very different from that of the pulsar. Particularly notable is that the burst oscillation amplitude is mostly constant below keV, but rises sharply at keV.
4 Discussion
We detected a bright X-ray burst from SAX J1808 with NICER. The burst showed a peculiar light curve, with a notable pause during the rise and a double-peaked structure. Additionally, we detected significant burst oscillations in the cooling tail of the burst and emission features in the burst spectrum. We now discuss each of these findings.
4.1 Reflection
We find that the burst spectrum shows a strong excess at the lowest energies that requires the inclusion of a second blackbody in the spectral model. A similar strong soft excess was previously observed in SAX J1808 by in ’t Zand et al. (2013). In contrast to that work, however, we also observe emission features at 1 keV and 6.7 keV. A similar complex of emission features has been seen in the intermediate-duration X-ray bursts from IGR J17062–6143 (Degenaar et al., 2013; Keek et al., 2017), which were associated with ionized Fe L and Fe K emission lines. Thus, the detection of these lines provides strong evidence that we are seeing the burst emission reflected from the accretion disk. Applying a physically motivated disk reflection model to our data (Section 3.3) indicates that such a reflection component provides a satisfactory description of the soft excess, but cannot fully account for the emission feature observed at 1 keV. We suggest that this may be due to the presence of additional elements not currently incorporated in these models (e.g. Ne). Additionally, this model fit indicated a strong reflection signal, which may indicate that the accretion disk structure is significantly impacted by the burst (He & Keek, 2016; Fragile et al., 2018).
4.2 Spectral evolution
The X-ray burst light curve shows a double-peaked structure. Given that the second peak in count-rate occurs after the PRE phase, and that this peak is reproduced (albeit less prominently) in the bolometric flux, we conclude that this feature is astrophysical in origin. A very similar double-peaked structure in an X-ray burst from 4U 1608–52 was recently observed with NICER (Jaisawal et al., 2019). Although that burst showed a hotter photosphere and lacked the strong soft excess that we detect in SAX J1808, the rebrightening phase is nearly identical in both bursts. In each case, the end of the PRE phase coincides with a pronounced dip in count-rate, and is followed by a secondary peak.
Jaisawal et al. (2019) considered a number of plausible origins for the rebrightening of the burst flux, including the ignition of fresh material (Keek & Heger, 2017), stalled thermonuclear flame spreading (Bhattacharyya & Strohmayer, 2006), and waiting points in the rp-process (Fisker et al., 2004). Our observation of rebrightening in the X-ray burst from SAX J1808 does not rule out any of these proposed explanations. It does, however, add two new perspectives: first, in SAX J1808 the rebrightening coincides with the onset of burst oscillations, which may be difficult to reconcile a flame spreading model. Second, in SAX J1808 the dip appears related to the pause during the rise. If this relation is real, then whatever physical mechanism underpins these features may also be related to the rebrightening.
4.3 Burst Oscillations
We found that the X-ray burst shows burst oscillations at the expected 401 Hz spin frequency. Comparing these oscillations with the accretion-powered pulsations, we find that the two waveforms are remarkably similar, but the burst oscillations lead the pulsations by . Similar results were reported from RXTE observations of burst oscillations in SAX J1808 observed during the cooling phase of an X-ray burst (Chakrabarty et al., 2003). The fact that the burst oscillations are so closely matched to the persistent pulsations in terms of their waveform, suggests that both must arise from geometrically similar, if not the same, confined emitting region (hot-spot) on the stellar surface. With this in mind, it is interesting to note that the NICER data indicate the waveform energy dependence of the burst oscillations is quite different from that of the persistent pulsations. Some of the difference may simply arise from the strong reflection component, which is likely not pulsed, and thus is expected to dilute the measured burst oscillation amplitude at low energies. A detailed spectral-timing analysis may be able to determine how much each of the spectral components is oscillating. Such an analysis, however, is beyond the scope of this initial work.
4.4 Eddington limits
Finally, we note that our analysis of the light curve, the spectral evolution, and the timing behavior all indicate that each time interval where the NICER count-rate of SAX J1808 is between 13,000 ct s-1 and 14,000 ct s-1 is somehow special. At these count rates, the burst rise pauses, the dip reaches its minimum, and burst oscillations appear. The bolometric flux measured at these times was erg s-1 cm-2, which corresponds to a luminosity of erg s-1. We note that this luminosity is consistent with the expected local Eddington limit of a hydrogen envelope of a neutron star (Lewin et al., 1993).
For spherically symmetric emission, the Eddington luminosity as measured by the observer is predicted as (Lewin et al., 1993; Suleimanov et al., 2017)
| (1) |
where is the neutron star mass, the gravitational constant, the speed of light, and the gravitational redshift. Finally, g-1 is the Thomson electron scattering opacity, with the hydrogen abundance in the atmospheric layer. Hence, we expect that the flux level at which PRE occurs differs depending on the material composition of the neutron star envelope. For a hydrogen layer with cosmic abundances (), the predicted luminosity is erg s-1, whereas the luminosity of a pure helium layer () is larger by a factor of 1.73. In SAX J1808, the ratio in bolometric flux between the peak and pause/dip is .
The following scenario now emerges for the X-ray burst evolution. As the critical ignition point is reached in the helium layer, the flame front quickly spreads across the stellar surface and an intense radiation field starts to diffuse outward. After about 0.5 s, the radiation pressure reaches the local Eddington limit of the hydrogen layer, causing that layer to expand. Meanwhile, the intensity of the radiation field continues to increase, either expelling or diluting the hydrogen layer, so that the observed spectrum becomes dominated the PRE of the helium layer. Over the following 10 s, we observe the full helium PRE cycle, causing the photosphere to cool and then heat, as the envelope expands and then contracts. Once the envelope touches back down on the stellar surface, the burst flux is still comparable to hydrogen Eddington limit, although at the time this touchdown occurs, there will likely have been some mixing of the atmospheric layers. Subsequently, the photosphere cools, while the radius grows, and then, after about , the rebrightening mechanism activates and quickly thereafter the burst oscillations appear. The photosphere continues to cool, and after about 10 s both the rebrightening and oscillations switch off.
The flux levels of the pause and peak are highly suggestive that we are seeing both the hydrogen and helium Eddington limits in a single X-ray burst. The evolution of the hardness ratio around the pause further supports the interpretation that this stall in the rise is related to the expanding hydrogen layer. The link between the pause and the dip is weaker, but highly suggestive, and may yet provide the insight required to uncover the physics behind intrinsic rebrightening during the tail of an X-ray burst.
References
- Arnaud (1996) Arnaud, K. A. 1996, in Astronomical Society of the Pacific Conference Series, Vol. 101, Astronomical Data Analysis Software and Systems V, ed. G. H. Jacoby & J. Barnes, 17
- Ballantyne (2004) Ballantyne, D. R. 2004, MNRAS, 351, 57
- Ballantyne & Everett (2005) Ballantyne, D. R., & Everett, J. E. 2005, ApJ, 626, 364
- Bhattacharyya & Strohmayer (2006) Bhattacharyya, S., & Strohmayer, T. E. 2006, ApJ, 636, L121
- Bildsten & Chakrabarty (2001) Bildsten, L., & Chakrabarty, D. 2001, ApJ, 557, 292
- Bilous & Watts (2018) Bilous, A. V., & Watts, A. L. 2018, arXiv e-prints, arXiv:1812.10684
- Bult & van der Klis (2015) Bult, P., & van der Klis, M. 2015, ApJ, 806, 90
- Bult et al. (2019) Bult, P. M., Gendreau, K. C., Arzoumanian, Z., et al. 2019, The Astronomer’s Telegram, 13001, 1
- Cackett et al. (2009) Cackett, E. M., Altamirano, D., Patruno, A., et al. 2009, ApJ, 694, L21
- Chakrabarty & Morgan (1998) Chakrabarty, D., & Morgan, E. H. 1998, Nature, 394, 346
- Chakrabarty et al. (2003) Chakrabarty, D., Morgan, E. H., Muno, M. P., et al. 2003, Nature, 424, 42
- Degenaar et al. (2013) Degenaar, N., Miller, J. M., Wijnands, R., Altamirano, D., & Fabian, A. C. 2013, ApJ, 767, L37
- Degenaar et al. (2018) Degenaar, N., Ballantyne, D. R., Belloni, T., et al. 2018, Space Sci. Rev., 214, 15
- Di Salvo et al. (2019) Di Salvo, T., Sanna, A., Burderi, L., et al. 2019, MNRAS, 483, 767
- Fabian et al. (1989) Fabian, A. C., Rees, M. J., Stella, L., & White, N. E. 1989, MNRAS, 238, 729
- Fisker et al. (2004) Fisker, J. L., Thielemann, F.-K., & Wiescher, M. 2004, ApJ, 608, L61
- Fragile et al. (2018) Fragile, P. C., Ballantyne, D. R., Maccarone, T. J., & Witry, J. W. L. 2018, ApJ, 867, L28
- Galloway & Cumming (2006) Galloway, D. K., & Cumming, A. 2006, ApJ, 652, 559
- Galloway et al. (2017) Galloway, D. K., Goodwin, A. J., & Keek, L. 2017, PASA, 34, e019
- Galloway et al. (2008) Galloway, D. K., Muno, M. P., Hartman, J. M., Psaltis, D., & Chakrabarty, D. 2008, ApJS, 179, 360
- Gendreau & Arzoumanian (2017) Gendreau, K., & Arzoumanian, Z. 2017, Nature Astronomy, 1, 895
- Goodwin et al. (2019a) Goodwin, A. J., Galloway, D. K., Heger, A., Cumming, A., & Johnston, Z. 2019a, arXiv e-prints, arXiv:1907.00996
- Goodwin et al. (2019b) Goodwin, A. J., Russell, D. M., Galloway, D. K., et al. 2019b, The Astronomer’s Telegram, 12993, ads
- Grindlay et al. (1980) Grindlay, J. E., Marshall, H. L., Hertz, P., et al. 1980, ApJ, 240, L121
- Hartman et al. (2008) Hartman, J. M., Patruno, A., Chakrabarty, D., et al. 2008, ApJ, 675, 1468
- He & Keek (2016) He, C. C., & Keek, L. 2016, ApJ, 819, 47
- in ’t Zand et al. (1998) in ’t Zand, J. J. M., Heise, J., Muller, J. M., et al. 1998, A&A, 331, L25
- in ’t Zand et al. (2013) in ’t Zand, J. J. M., Galloway, D. K., Marshall, H. L., et al. 2013, A&A, 553, A83
- in’t Zand et al. (2001) in’t Zand, J. J. M., Cornelisse, R., Kuulkers, E., et al. 2001, A&A, 372, 916
- Jahoda et al. (2006) Jahoda, K., Markwardt, C. B., Radeva, Y., et al. 2006, ApJS, 163, 401
- Jaisawal et al. (2019) Jaisawal, G. K., Chenevez, J., Bult, P., et al. 2019, arXiv e-prints, arXiv:1908.03373
- Keek & Heger (2017) Keek, L., & Heger, A. 2017, ApJ, 842, 113
- Keek et al. (2017) Keek, L., Iwakiri, W., Serino, M., et al. 2017, ApJ, 836, 111
- Keek et al. (2018a) Keek, L., Arzoumanian, Z., Chakrabarty, D., et al. 2018a, ApJ, 856, L37
- Keek et al. (2018b) Keek, L., Arzoumanian, Z., Bult, P., et al. 2018b, ApJ, 855, L4
- Lewin et al. (1993) Lewin, W. H. G., van Paradijs, J., & Taam, R. E. 1993, Space Science Reviews, 62, 223
- Makishima et al. (1986) Makishima, K., Maejima, Y., Mitsuda, K., et al. 1986, ApJ, 308, 635
- Narayan & Heyl (2003) Narayan, R., & Heyl, J. S. 2003, ApJ, 599, 419
- Papitto et al. (2009) Papitto, A., Di Salvo, T., D’Aì, A., et al. 2009, A&A, 493, L39
- Parikh & Wijnands (2019) Parikh, A. S., & Wijnands, R. 2019, The Astronomer’s Telegram, 13000, ads
- Patruno et al. (2017) Patruno, A., Jaodand, A., Kuiper, L., et al. 2017, ApJ, 841, 98
- Russell et al. (2019) Russell, D. M., Goodwin, A. J., Galloway, D. K., et al. 2019, The Astronomer’s Telegram, 12964, ads
- Sanna et al. (2017) Sanna, A., Di Salvo, T., Burderi, L., et al. 2017, MNRAS, 471, 463
- Standish (1998) Standish, E. M. 1998, JPL Planetary and Lunar Ephemerides, DE405/LE405, JPL Interoffice Memo 312.F-98-048 (Pasadena: NASA Jet Propulsion Laboratory)
- Strohmayer et al. (2019) Strohmayer, T. E., Altamirano, D., Arzoumanian, Z., et al. 2019, ApJ, 878, L27
- Suleimanov et al. (2017) Suleimanov, V. F., Poutanen, J., Nättilä, J., et al. 2017, MNRAS, 466, 906
- van der Klis (1989) van der Klis, M. 1989, in NATO ASI Series, Vol. 262, Timing Neutron Stars, ed. H. Ögelman & E. P. J. van den Heuvel (Dordrecht: Kluwer), 27
- Verner et al. (1996) Verner, D. A., Ferland, G. J., Korista, K. T., & Yakovlev, D. G. 1996, ApJ, 465, 487
- Weinberg et al. (2006) Weinberg, N. N., Bildsten, L., & Schatz, H. 2006, ApJ, 639, 1018
- Wijnands & van der Klis (1998) Wijnands, R., & van der Klis, M. 1998, Nature, 394, 344
- Wilms et al. (2000) Wilms, J., Allen, A., & McCray, R. 2000, ApJ, 542, 914
- Worpel et al. (2013) Worpel, H., Galloway, D. K., & Price, D. J. 2013, ApJ, 772, 94
- Yu & Weinberg (2018) Yu, H., & Weinberg, N. N. 2018, ApJ, 863, 53
- Zdziarski et al. (1996) Zdziarski, A. A., Johnson, W. N., & Magdziarz, P. 1996, MNRAS, 283, 193
- Życki et al. (1999) Życki, P. T., Done, C., & Smith, D. A. 1999, MNRAS, 309, 561