Respiratory Rate Estimation from Face Videos
Abstract
Vital signs, such as heart rate (HR), heart rate variability (HRV), respiratory rate (RR), are important indicators for a person’s health. Vital signs are traditionally measured with contact sensors, and may be inconvenient and cause discomfort during continuous monitoring. Commercial cameras are promising contact-free sensors, and remote photoplethysmography (rPPG) have been studied to remotely monitor heart rate from face videos. For remote RR measurement, most prior art was based on small periodical motions of chest regions caused by breathing cycles, which are vulnerable to subjects’ voluntary movements. This paper explores remote RR measurement based on rPPG obtained from face videos. The paper employs motion compensation, two-phase temporal filtering, and signal pruning to capture signals with high quality. The experimental results demonstrate that the proposed framework can obtain accurate RR results and can provide HR, HRV and RR measurement synergistically in one framework.
Index Terms:
Health monitoring, Remote photoplethysmography, Respiratory rate, Face videosI Introduction
Vital signs monitoring is important for clinical diagnostics and in-home health monitoring. Vital signs such as heart rate (HR), HR variability (HRV), and respiratory rate (RR), are usually measured with non-invasive electrocardiography (ECG) or photoplethysmography (PPG) sensors in clinical examination, or with commercial wearable devices in health monitoring. The measurements in both scenarios often employ contact sensors, which may be inconvenient or cause discomfort in long-term monitoring sessions. For example, it is hard to put sensors on young children and ask them to keep still during the monitoring session.
Some pioneering works reveal a possible approach of remote vital signs measurement with contactless sensors. The studies [1, 2] extracted HR from face videos, based on the small color change on the face that is consistent with the pulse signal. This technology is called remote PPG (rPPG). The studies in [3, 4, 5, 6] proposed algorithms to deal with motion and illumination variations in realistic resting scenarios or under movement during fitness training. In addition, a skin subspace model was explored in [7] to enhance the signal-to-noise ratio (SNR) of the extracted rPPG.
Compared to remote HR measurement, remote RR measurement has not yet gained as much attention in contact-free health monitoring research. This physiological modality is important, as an abnormal respiratory rate is a predictor of potentially serious clinical events [8]. In this paper, we focus on remote RR measurement. There have been several studies exploring remote RR measurement from various sources:
-
•
Periodical motions on chest region. Due to the volume change of the lungs during breathing cycles, motion analysis around chest region in video sequences [9, 10] were proposed for remote RR measurement from color or depth videos. In addition, radio frequency signal [11] is another tool to measure the tiny movement around the chest area, similar to RF ranging. However, these methods inevitably are motion sensitive and vulnerable to subjects’ voluntary movements.
-
•
Thermal imaging. Infrared cameras can capture the temperature variation around the nostril areas [12], which is caused by nasal airflow during inspiration and expiration. However, this method requires special equipment which can be expensive currently for wide deployment, especially for home care.
Reference [1, 2, 3, 4, 5, 6] have demonstrated that color cameras are promising contactless sensors for measurement of HR-related signals, i.e. rPPG. HRV has also been shown to be a benign and natural phenomenon in heartbeats that is influenced by breathing [13]. A person’s heart rate tends to increase when he/she breathes in, and fall when he/she exhales. While the studies in [14, 15] have demonstrated that ECG and PPG signals can be good sources to measure HRV and RR, few research has been conducted to extract RR systematically from rPPG signals.
In this paper, we establish a systematic framework to measure RR from face videos. We employ motion compensation, a two-phase temporal filtering, and signal pruning to capture high-quality HRV and RR signal. In addition, the proposed framework incorporates modules of multiple vital signal measurements, including HR, HRV and RR. Experimental results show the feasibility and effectiveness of remote RR measurement from face videos.
II framework
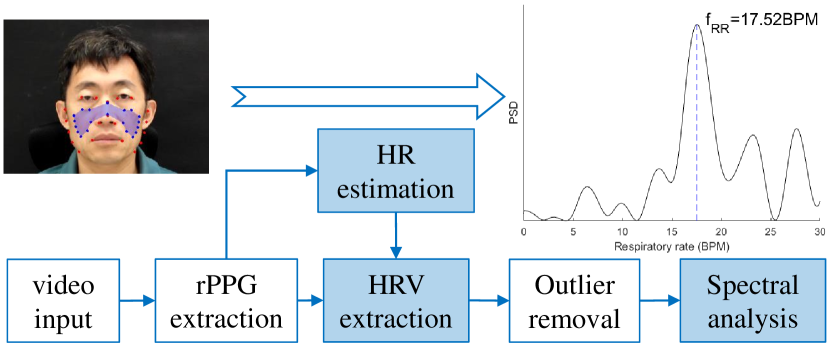
Our proposed framework, as illustrated in Fig. 1, provides simultaneous tracking of three basic and important vital signs, namely, HR, HRV and RR. The framework is composed of the following four main steps. First, we track the region-of-interest (ROI) on the face in the video sequence, and extract the pulse signal, i.e., the rPPG signal. Second, temporal filtering is applied to the rPPG signal to exclude the energy out of the typical HR range. We compute the inter-beat interval (IBI) from the filtered rPPG signal and then obtain HRV. Since HRV obtained based on rPPG is vulnerable to noise contamination caused by such factors as motion, illumination variations, we prune the obtained HRV samples and discard outliers before extracting RR. Thus, in the third step, we model HRV samples with the assumption of a Gaussian distribution and remove the outliers in HRV samples. Finally, spectral analysis is applied on HRV to estimate RR. The details of each step are explained in the following subsections.
II-A Rigid Motion Compensation and rPPG Extraction
The aim of rigid motion compensation is to alleviate the noise introduced by the subject’s voluntary movement during rPPG extraction. We use the Tasks-Constrained Deep Convolutional Network (TCDCN) [16] to detect 68 facial landmarks and define the ROI. Fig. 1 shows an example of the ROI with the location of 20 facial landmarks. Then, a tracking process is employed to automatically select the corresponding ROI in each video frame. In the tracking process, feature points are first detected inside the face region using the “good feature to track” algorithm [17], and then tracked through the following frames using the Kanade-Lucas-Tomasi (KLT) algorithm [18]. We denote the locations of tracked feature points as and the locations of ROI boundary points as in the -th frame. We estimate the 2D geometric transformation of the face between two consecutive frames by minimizing the least square error:
| (1) |
We then obtain the location of ROI in the next frame from the current frame by . Finally, the rPPG signal is extracted by averaging the pixel intensity in the tracked ROI, and is processed with Plane-Orthogonal-to-Skin (POS) algorithm [7] for signal detrending, normalization, and denoising.
II-B HRV Extraction
To capture the fluctuation of HR, we estimate the HR curve and IBIs from rPPG signal. Since the previous work in [3, 4, 5] has studied the robust HR measurement from face videos, here we will not discuss HR measurement in detail. Unlike the former studies[3, 4, 5] that provide only one heart rate value for a video segment, we track HR throughout the duration of the video via the Adaptive Multi-Trace Carving (AMTC) [19], and obtain the HR curve. AMTC is a robust algorithm for tracking weak signals in severe noise and distortion.
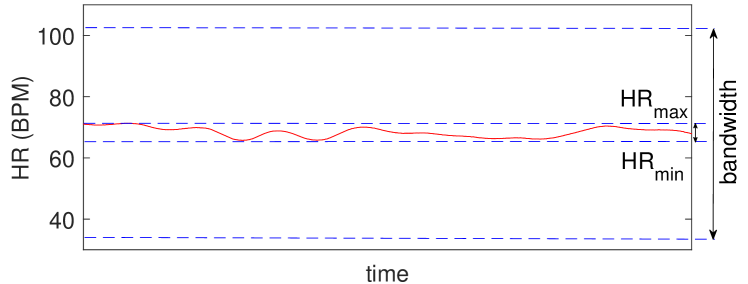
Note that a temporal bandpass filtering was applied in the former studies [1, 2, 3, 4, 5] to confine the frequency of the rPPG signal within HR range, (i.e., from 0.7 Hz to 4 Hz) to facilitate HR extraction. Although the filtered signal can help perform robust HR estimation, it may not be good enough for HRV extraction, since HRV extraction generally requires the full time domain waveform with high signal quality and clean peaks, and is much more challenging than HR estimation. Therefore, we employ a second temporal filter, an infinite impulse response (IIR) filter with narrower bandpass, and apply it to the rPPG signal to enhance the signal quality. Given the dynamic range of HR from to , we choose the bandpass for the second filter from offset to offset, where offset is an empirical parameter and should be chosen to exclude as much noise as possible but still preserve the frequency components of HRV. In this paper, We set the offset to 30 breaths per minute (BrPM), to balance the inclusion of HRV components and the exclusion of noise. Fig. 2 illustrates the bandpass of the second filter. To avoid phase distortion, we apply zero-phase filtering in the second filtering, which filters the input signal forward first and then filters the output backward again. The aim of the process is to preserve the location of beats after the filtering and facilitate HRV extraction.
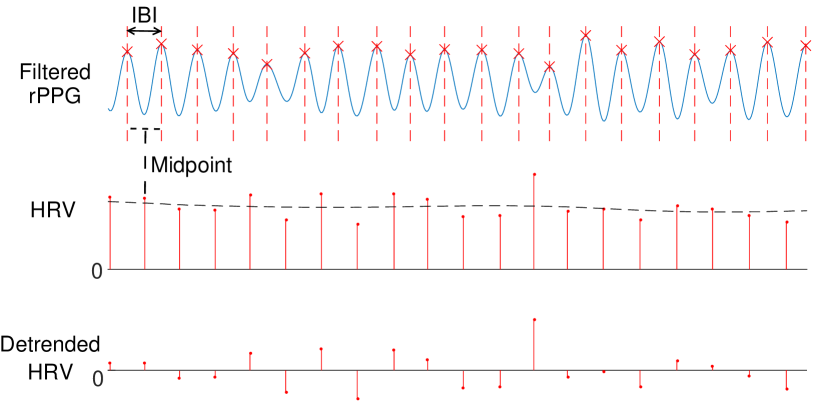
After the second filtering, the peaks in the filtered rPPG signal are detected. Unlike the relatively high sampling frequency in PPG and ECG (usually more than 100 Hz), the frame rate of videos is normally around 30 Hz, which limits the accuracy of the peak locations. We refine the peak locations by interpolating quadratically around the peaks. After the refinement, IBIs are computed from adjacent peaks, with the unit of second. We set the time of the IBI sample as the middle time of the corresponding consecutive peaks. HRV is the reciprocal of IBI: , with the unit of beats per minute (BPM). We subtract the HRV signal with the HR curve to extract the fluctuation, and refer to it as detrended HRV in the following.
II-C Outlier Removal
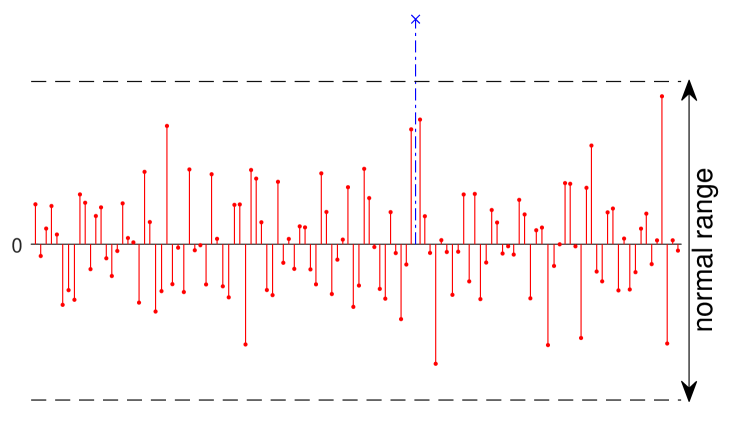
Although the second filtering helps us obtain HRV signal in better quality, the signal may still contain some outliers due to noise and error in peak detection. Therefore, the aim of module “outlier removal” is to eliminate the bad detrended HRV samples. We examine the detrended HRV samples and eliminate the possible outliers. We first model the detrended HRV samples with Gaussian distribution , where and can be estimated by maximum likelihood estimation (MLE). Then, we remove the sample if it is outside the range , where is a hyperparameter. In this paper, we choose , according to the “three-sigma rule”. Fig. 4 illustrates the process of outlier removal.
II-D Spectral Analysis
One of the primary fluctuation sources in HR is respiratory sinus arrhythmia, which is associated with breathing cycles. Hence, employing spectral analysis on detrended HRV can estimate RR. As the obtained detrended HRV sequence is unevenly sampled, we estimate the power spectral density (PSD) of detrended HRV using the Lomb-Scargle periodogram [20, 21]. The Lomb-Scargle periodogram is a spectral analysis tool dealing with unevenly sampled data, and is based on a least-squares fit of sinusoids to the data samples. The respiratory rate is obtained by selecting the frequency with the maximal energy response in normal RR range of to BrPM.
III Experiments
We evaluated on a set of self-collected face videos to demonstrate the feasibility of remote RR measurement. The dataset contains 60 color video segments from 6 subjects, and each segment lasts around 30 seconds. Each video segment captured the subject’s frontal face using a Canon camera affixed on a tripod in a well-lit laboratory. During the data collection, the subjects were asked to sit in front of the camera in rest, but were allowed to have small motions and expressions. In the meantime, the subjects wore a PPG sensor on the fingertip and a respiration belt on the chest, and PPG signals and breathing signals were collected at sampling rate 100 Hz. The breathing signals from respiratory belt were processed by spectral analysis with periodogram to extract RR as the ground truth (GT). PPG-derived RR is obtained using [15] as an anchor reference.
Using the proposed framework, we obtained RR from each video segment and compare it with the corresponding GT from the respiration belt. Bland-Altman plot [22] is used to evaluate the video-based RR measurement. To demonstrate the effectiveness of the interpolation in peak finding and outlier removal in the proposed framework, we also conducted experiments with different module combinations. The two modules, for simplicity, are denoted as Interp and OR, respectively.
To evaluate the performance of the proposed method, we consider the metrics in remote HR analysis [3, 5]. Specifically, we define the measurement error , i.e., the difference between the measured RR and the ground truth RR from respiration belt . The respiration belt measures the variation of the chest volume with a pressure sensor. As shown in Table I, we report the mean and the standard deviation of among all sequences, root mean squared error (RMSE), the mean of error-rate percentage , where is the number of the video sequences and is the video index. In respiratory rate monitoring, we consider an absolute error of less than 1 BrPM is acceptable. Hence, we present the percentage of estimation where the absolute error was less than 1 BrPM (), as an indicator of the successful rate of RR estimation from videos. Fig. 5 presents Bland-Altman plots for conformance testing of the measurement vs. GT obtained from respiration belt.
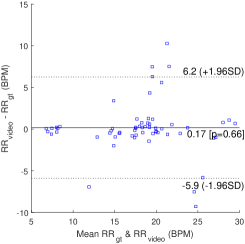
(a) No Interp, no OR
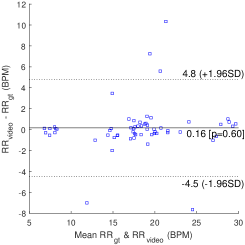
(b) Only Interp, no OR
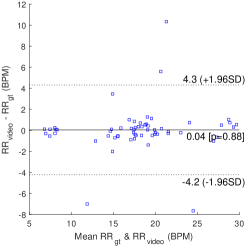
(c) Interp+OR (proposed)
| Method | RMSE | % | ||
|---|---|---|---|---|
| PPG-derived (anchor) | -0.04 (0.15) | 0.15 | 0.77% | 100% |
| No Interp, no OR | 0.17 (3.10) | 3.08 | 9.30% | 68.33% |
| Only Interp, no OR | 0.16 (2.37) | 2.35 | 6.67% | 76.67% |
| Interp+OR (proposed) | 0.04 (2.18) | 2.16 | 5.92% | 78.33% |
From the results in Table I, we see that PPG-derived RR is an accurate approach to measure RR from heartbeat-related signals, and it also indicates the feasibility of extracting RR from these test subjects using heartbeat-related signal. As shown in Fig. 5, the proposed frameworks with different module combinations can all measure RR accurately in most cases. However, Interp and OR modules can enhance the robustness of remote RR measurement, reducing the number of large error cases outside confident interval. From Table I, we can also see Interp and OR modules help decrease from to BrPM, from to BrPM and from to . The successful rate of estimation also increases from to . Therefore, we include these two modules in our overall framework. As a whole, the results demonstrate the feasibility of remote RR measurement from face videos.
IV Conclusion
In this paper, we have developed a systematic framework for remote RR monitoring using face videos. We apply motion compensation, a two-phase filtering, and signal pruning to enhance the robustness of RR measurement. We incorporate HR, HRV, and RR measurement into the proposed framework, aiming to construct a comprehensive system for remote vital signs measurement. Experimental results show that our proposed method is feasible and effective in measuring RR remotely in rest case. Poor signal quality in pulse signal extraction is still a challenge in remote vital sign extraction. How to alleviate the negative influence of voluntary motions and expressions, and illumination changes on pulse signal extraction from the videos is a direction of the future work.
Acknowledgement: The authors would like to thank Dr. Christopher Scully from FDA, for helping obtain PPG and respiration belt data.
Disclaimer: The mention of commercial products, their sources, or their use in connection with material reported herein is not to be construed as either an actual or implied endorsement of such products by the U.S Department of Health and Human Services.
References
- [1] Wim Verkruysse, Lars O Svaasand, and J Stuart Nelson, “Remote plethysmographic imaging using ambient light.,” Optics Express, vol. 16(26), pp. 21434–21445, 2008.
- [2] Ming-Zher Poh, Daniel J McDuff, and Rosalind W Picard, “Advancements in noncontact, multiparameter physiological measurements using a webcam,” IEEE Trans. on Biomedical Engineering, vol. 58(1), 2011.
- [3] Xiaobai Li, Jie Chen, Guoying Zhao, and Matti Pietikainen, “Remote heart rate measurement from face videos under realistic situations,” in IEEE Conf. on Computer Vision and Pattern Recognition, 2014.
- [4] Antony Lam and Yoshinori Kuno, “Robust heart rate measurement from video using select random patches,” in IEEE Intl. Conf. on Computer Vision, 2015.
- [5] Sergey Tulyakov, Xavier Alameda-Pineda, Elisa Ricci, Lijun Yin, Jeffrey F Cohn, and Nicu Sebe, “Self-adaptive matrix completion for heart rate estimation from face videos under realistic conditions,” in IEEE Conf. on Computer Vision and Pattern Recognition, 2016.
- [6] Qiang Zhu, Chau-Wai Wong, Chang-Hong Fu, and Min Wu, “Fitness heart rate measurement using face videos,” in IEEE Intl. Conf. on Image Processing, 2017.
- [7] Wenjin Wang, Albertus C den Brinker, Sander Stuijk, and Gerard de Haan, “Algorithmic principles of remote PPG,” IEEE Trans. on Biomedical Engineering, vol. 64(7), pp. 1479–1491, 2017.
- [8] Michelle A Cretikos, Rinaldo Bellomo, Ken Hillman, Jack Chen, Simon Finfer, and Arthas Flabouris, “Respiratory rate: the neglected vital sign,” Medical Journal of Australia, vol. 188(11), pp. 657, 2008.
- [9] Flavia Benetazzo, Alessandro Freddi, Andrea Monteriù, and Sauro Longhi, “Respiratory rate detection algorithm based on RGB-D camera: theoretical background and experimental results,” Healthcare Technology Letters, vol. 1(3), pp. 81–86, 2014.
- [10] Daniel Myklatun Tveit, Kjersti Engan, Ivar Austvoll, and Øyvind Meinich-Bache, “Motion based detection of respiration rate in infants using video,” in IEEE Intl. Conf. on Image Processing, 2016.
- [11] Zhicheng Yang, Parth H Pathak, Yunze Zeng, Xixi Liran, and Prasant Mohapatra, “Vital sign and sleep monitoring using millimeter wave,” ACM Trans. on Sensor Networks, vol. 13(2), pp. 14, 2017.
- [12] Carina Barbosa Pereira, Xinchi Yu, Michael Czaplik, Rolf Rossaint, Vladimir Blazek, and Steffen Leonhardt, “Remote monitoring of breathing dynamics using infrared thermography,” Biomedical Optics Express, vol. 6(11), pp. 4378–4394, 2015.
- [13] B McA Saykrs, “Analysis of heart rate variability,” Ergonomics, vol. 16(1), pp. 17–32, 1973.
- [14] Shishir Dash, Kirk H Shelley, David G Silverman, and Ki H Chon, “Estimation of respiratory rate from ECG, photoplethysmogram, and piezoelectric pulse transducer signals: a comparative study of time–frequency methods,” IEEE Trans. on Biomedical Engineering, vol. 57(5), pp. 1099–1107, 2010.
- [15] Walter Karlen, Srinivas Raman, J Mark Ansermino, and Guy A Dumont, “Multiparameter respiratory rate estimation from the photoplethysmogram,” IEEE Trans. on Biomedical Engineering, vol. 60(7), 2013.
- [16] Zhanpeng Zhang, Ping Luo, Chen Change Loy, and Xiaoou Tang, “Learning deep representation for face alignment with auxiliary attributes,” IEEE Trans. on Pattern Analysis and Machine Intelligence, vol. 38(5), pp. 918–930, 2016.
- [17] Jianbo Shi and Carlo Tomasi, “Good features to track,” in IEEE Conf. on Computer Vision and Pattern Recognition, 1994.
- [18] Carlo Tomasi and Takeo Kanade, “Detection and tracking of point features,” 1991.
- [19] Qiang Zhu, Mingliang Chen, Chau-Wai Wong, and Min Wu, “Adaptive multi-trace carving based on dynamic programming,” in Asilomar Conference on Signals, Systems and Computers, 2018.
- [20] Nicholas R Lomb, “Least-squares frequency analysis of unequally spaced data,” Astrophysics and space science, vol. 39(2), 1976.
- [21] Jeffrey D Scargle, “Studies in astronomical time series analysis. ii-statistical aspects of spectral analysis of unevenly spaced data,” The Astrophysical Journal, vol. 263, pp. 835–853, 1982.
- [22] J Martin Bland and Douglas G Altman, “Measuring agreement in method comparison studies,” Statistical Methods in Medical Research, vol. 8(2), pp. 135–160, 1999.