Ultra-Sensitive Radio Frequency Biosensor at an Exceptional Point of Degeneracy induced by Time Modulation
Abstract
We exploit the premises of exceptional points of degeneracy (EPDs) induced in linear time-periodic (LTP) systems to achieve extremely sensitive biosensors. The EPD is formed in a single LC resonator where the total capacitance is comprised of a time-varying capacitor in parallel to a biosensing capacitor. We use the time-periodic variation of a system parameter (e.g., capacitance) to achieve a second order EPD aiming at improving the sensitivity of liquid based radio frequency biosensors, leading to an intrinsic ultra sensitivity. We show the emergence of EPDs in such a system and the ultra sensitivity of the degenerate resonance frequency to perturbations compared to conventional RF sensors. Moreover, we investigate the capacitance and conductance variations of an interdigitated biosensing capacitor to the changes in the concentration of a biological material under test (MUT), leading to subsequent large changes in the resonance frequency of the LTP-LC resonator. A comparison with a standard LC resonator demonstrates the ultra-high sensitivity of the proposed LTP-LC based biosensor. In addition, we show the scalability of the biosensor sensitivity across different frequency ranges.
I Introduction
Analytical biosensors play a tremendous role in modern medicine through enabling the monitoring of biomarkers in human health. The applications of these sensors are diverse as they form the core of many point-of-care, wearable, and diagnostic tools utilized in pathology, nutrition, fitness, biomedical science, and more [1, 2, 3, 4, 5]. Traditionally, an analytical biosensor is composed of two main elements: a bioamplifier (such as a bioreceptor), and a transducer (converting the biological signal into an electrical one). Various number of modalities exist to monitor biomarkers [6, 7], including but not limited to electrochemical impedance spectroscopy [8, 9, 10], piezoelectric microcantilever [11, 12, 13], surface plasmon resonance [14, 15, 16, 17], immunoelectrophoresis [18, 19], fluorescence [20, 21], enzyme-linked immunosorbent assay (ELISA) [22, 23, 24, 25]. While many of these techniques have found critical roles in a variety of applications, a majority are encumbered by limitations in system size and weight, sample preparation requirements, power consumption, and limited capabilities in wireless operation.
Dielectric-RF sensors (that sense the presence of analytes via permittivity shifts) possess traits that address many issues that have limited traditional biosensors, however these sensors have limited use in modern devices. The reason for this is two-fold: these sensors possess low sensitivity (signal change due to input) and low selectivity (discrimination of an analyte from interferents). Moreover, RF biosensors having various capabilities are attractive among other sensing methods and gained a lot of attention since their working principle is dependent on the change of dielectric properties of a medium which is a label free fast detection method compare to other methods such as electrochemical or piezoelectric sensors which requires complex wiring. While there are potential strategies to improve RF-biosensor selectivity [26, 27, 28, 29], here we examine a new electromagnetic amplification strategy to improve biosensor sensitivity.
One of the most recent methods to dramatically enhance sensors sensitivity is to design the RF sensor to operate at the so called exceptional point of degeneracy. The EPD represents the coalescing point of the degenerate resonance frequencies and it emerges in a system when two or more eigenmodes of the system coalesce into a single degenerate eigenmode in both their eigenvalues and eigenvectors [30, 31, 32, 33, 34, 35, 36]. The system at an EPD shows an inherent ultra sensitivity, specially for small perturbation, that can be exploited to enhance the sensitivity of the liquid-based radio frequency biosensor [37, 38, 39, 40, 41, 42]. In addition to high sensitivity, EPDs are associated with other unique properties such as enhancing the gain of active systems [43], lowering oscillation threshold [44], etc.
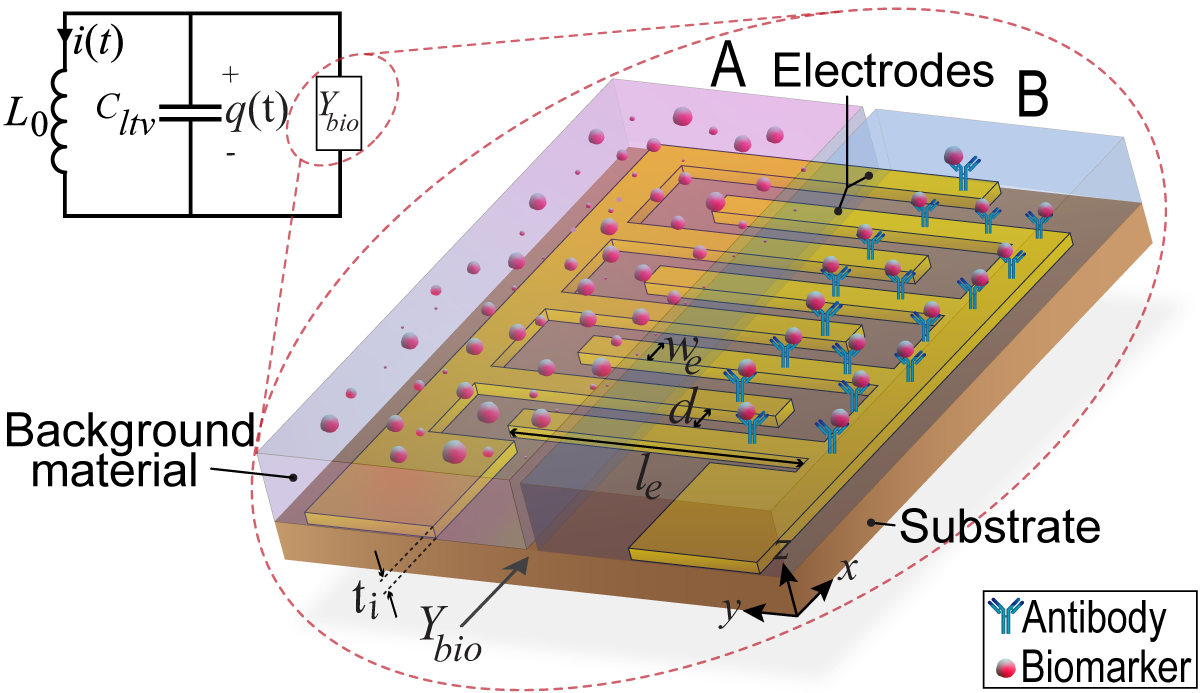
Recently, EPD-induced sensitivity based on the concept of parity-time (PT) symmetry in multiple, coupled resonators has been investigated [45, 46]. EPDs realized in PT-symmetric systems would require at least two coupled resonators, and precise knowledge of gain and loss in the system. In contrast, in this paper we employ EPDs directly induced via time modulation of a component in a single resonator [37, 47] to conceive a new class of biosensors. EPDs induced by time modulation-only require a single resonator and are easily tuned by changing the modulation frequency of a component which is a viable strategy to obtain EPDs since varying frequency in a precise manner is common practice in electronic systems. In this paper, we use the concept of an EPD that occurs in a single resonator and it is not based on PT-symmetry [37]; this new method is used to generate a second order EPD induced by time-periodic variation of a system parameter [37] aiming at improving the sensitivity of liquid based radio frequency biosensors, leading to an intrinsic ultra sensitivity. The concept of an EPD in a single resonator obtained by simply applying a time domain modulation was shown in [37] and the experimental demonstration of the occurrence of such EPD has been shown in [47]. The proposed biosensor shown in Fig. 1 is comprised of an LC resonator where the capacitor is time-variant and is in parallel to the biosensing capacitor, i.e., the capacitor whose capacitance is function of the concentration of the MUT. The biosensing capacitor is implemented using an interdigitated capacitor (IDC) as shown in Fig. 1. In this system, the change in the concentration of the MUT will change the capacitance of the IDC that can be measured through the shift in the resonance frequency of the system and this shift is boosted when the system operates at an EPD. We study two different biosensing scenarios based on the IDC in Fig. 1: (i) a uniformly dissolved MUT in the background material above the IDC, and (ii) a thin layer of MUT placed on top of the electrodes which are denoted by A and B in Fig. 1. Note that these two scenarios are combined into one figure for brevity, however, for the analysis we consider each scenario separately.
In the following, we first show the behavior of a LTP-LC resonator through the dispersion relation of the resonance frequency versus modulation and we discuss the occurrence of EPDs in such a system. The analysis accounts for losses in the system. In section III we design and investigate the performance of an IDC which is integrated in the system as the biosensing capacitor. We show the effect of the concentration of the MUT on the capacitance and the conductance of such capacitor for two cases of uniformly dissolved MUT and effective MUT layer. Finally, in section IV, we show the sensitivity of the designed system to perturbation, i.e., the concentration of the MUT, and we characterize the proposed biosensor performance across different designs and frequencies. Moreover, to show the advantages and the superiority of the proposed EPD biosensor, we compare its sensitivity with that of conventional biosensors.
II Enhancing the sensitivity of biosensors in an LTP system with EPDs
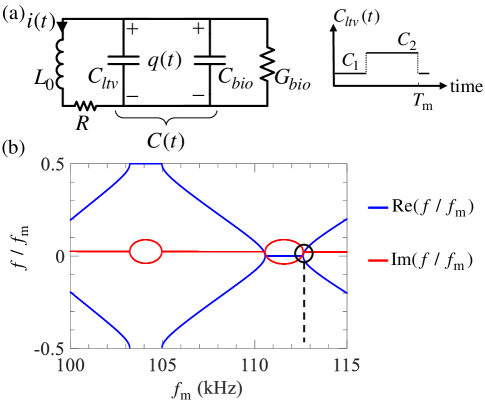
In this section, we demonstrate how to boost the sensitivity of conventional biosensors using a LTP-LC resonator as indicated in Fig. 2(a) where the time-periodic variation is introduced in the system through the time-varying capacitor, . The two-dimensional state vector describes this system, where denotes the transpose operator, and are the capacitor charge on both the capacitors in Fig. 2(a) and inductor current, respectively. The temporal evolution of the state vector obeys the two-dimensional first-order differential equation [37]
| (1) |
where is the time-varying system matrix. Assuming that the time-variation of the capacitance is a two level piece-wise constant, periodic, function as shown in the subset of Fig. 2(a), the time-variant system matrix reads
| (2) |
where , with represents the two values of the piece-wise constant time-varying capacitance and is the capacitance of the biosensing capacitor. The linear time-varying capacitance is for and for . Losses in the system are represented by the series resistance of the inductor and the parallel conductance of the biosensing capacitor. The conductance represents losses in the background medium and in the MUT.
Considering that the LTP sensor is periodic with period , we can translate the state vector from the time instant to as through the state transition matrix [37, 48]. In addition, the state vector satisfies in a periodic systems, hence we constitute the eigenvalue problem as
| (3) |
where is the identity matrix. Considering the eigenvalue problem derived in (3), we find the eigenvalues of the state transition matrix , hence the circuit eigenfrequencies that are the resonance frequencies of the circuit. Figure 2(b) shows the dispersion of these LTP-LC resonant frequencies versus modulation frequency . The small asymmetry of the real and imaginary parts of the resonance frequencies with respect to the center is due to the small losses in the circuit components. Such a dispersion diagram is obtained for the circuit parameters set as , , , . The parameters of the biosensing capacitor are derived based on the first order model described in Section III and set as and . It is observed from Fig. 2(b) that the time-periodic LC resonator exhibits second order EPDs (the band edges of each band gap) for selected modulation frequencies, i.e., when two resonance frequencies coalesce at a specific modulation frequency . Note that the LC resonator is time-periodic, therefore for a resonance frequency there exist all the correspondent Fourier harmonics , where . The EPDs occur either at the center or at edge of the Brillouin zone (BZ) (we use this term in analogy to what happens in periodic electromagnetic waveguides [42]) as it can be inferred from Fig. 2(b). For instance, one of the EPDs in Fig. 2(b) is indicated with a black circle: at the modulation frequency the LTP-LC resonance frequencies are . The one in the black circle corresponds to the harmonic , and the small imaginary part is due to losses in the circuit.
The resonance frequencies of such a system operating at an EPD are highly sensitive to perturbation of any system parameter. In general, a perturbation of a system parameter leads to a perturbed transition matrix that in turn generates two perturbed resonant frequencies , with , slightly away from the degenerate resonance frequency of the system operating at the second order EPD. It has been demonstrated that the perturbation of the eigenvalues of (3), hence the perturbation of the resonant frequencies, cannot be represented with a Taylor expansion of the degenerate resonant frequency around [49, chapter II.1.1]. The first order approximation of near the EPD is derived by a Puiseux series [49, chapter II.1.1] (also called “fractional power expansion”) using the explicit recursive formulas given in [50, 47] as
| (4) |
where and the signs correspond to EPDs at the center or edge of the BZ. Equation (4) indicates that for a small perturbation , the resonance frequencies change dramatically from their original degenerate frequency due to the square root function. As an example, a perturbation generates a resonance frequency shift proportional to , that is much larger than that in standard LC resonators, where such shift would be simply proportional to .
Note that in our proposed scheme with a single LTP resonator, perturbation of a system parameter (typically the sensing capacitance) perturbs the system away from the EPD and this results in two shifted resonances from the EPD frequency . The two shifts are real valued and, as discussed above, a small imaginary part in the EPD frequency is present because of losses. This is in contrast to what occurs in a two-coupled resonator system operating at an EPD based on PT symmetry: indeed, in the PT symmetric system, perturbing the sensing capacitor on the lossy (sensing) side only, disqualifies the system as being PT symmetric and as a result both of the resonant frequencies become complex. Therefore, in order to maintain the PT symmetry and exceptional sensitivity, the prior knowledge of the sensing capacitance change is required to vary also the capacitance on the active part of the PT symmetry circuit. Finally, note that depending on the choice of the operating EPD, in our proposed scheme one may have purely real or purely imaginary resonant frequency shifts, depending on the sign of , which will be discussed in more details in Sec. IV.
III Analysis of biosensing capacitor
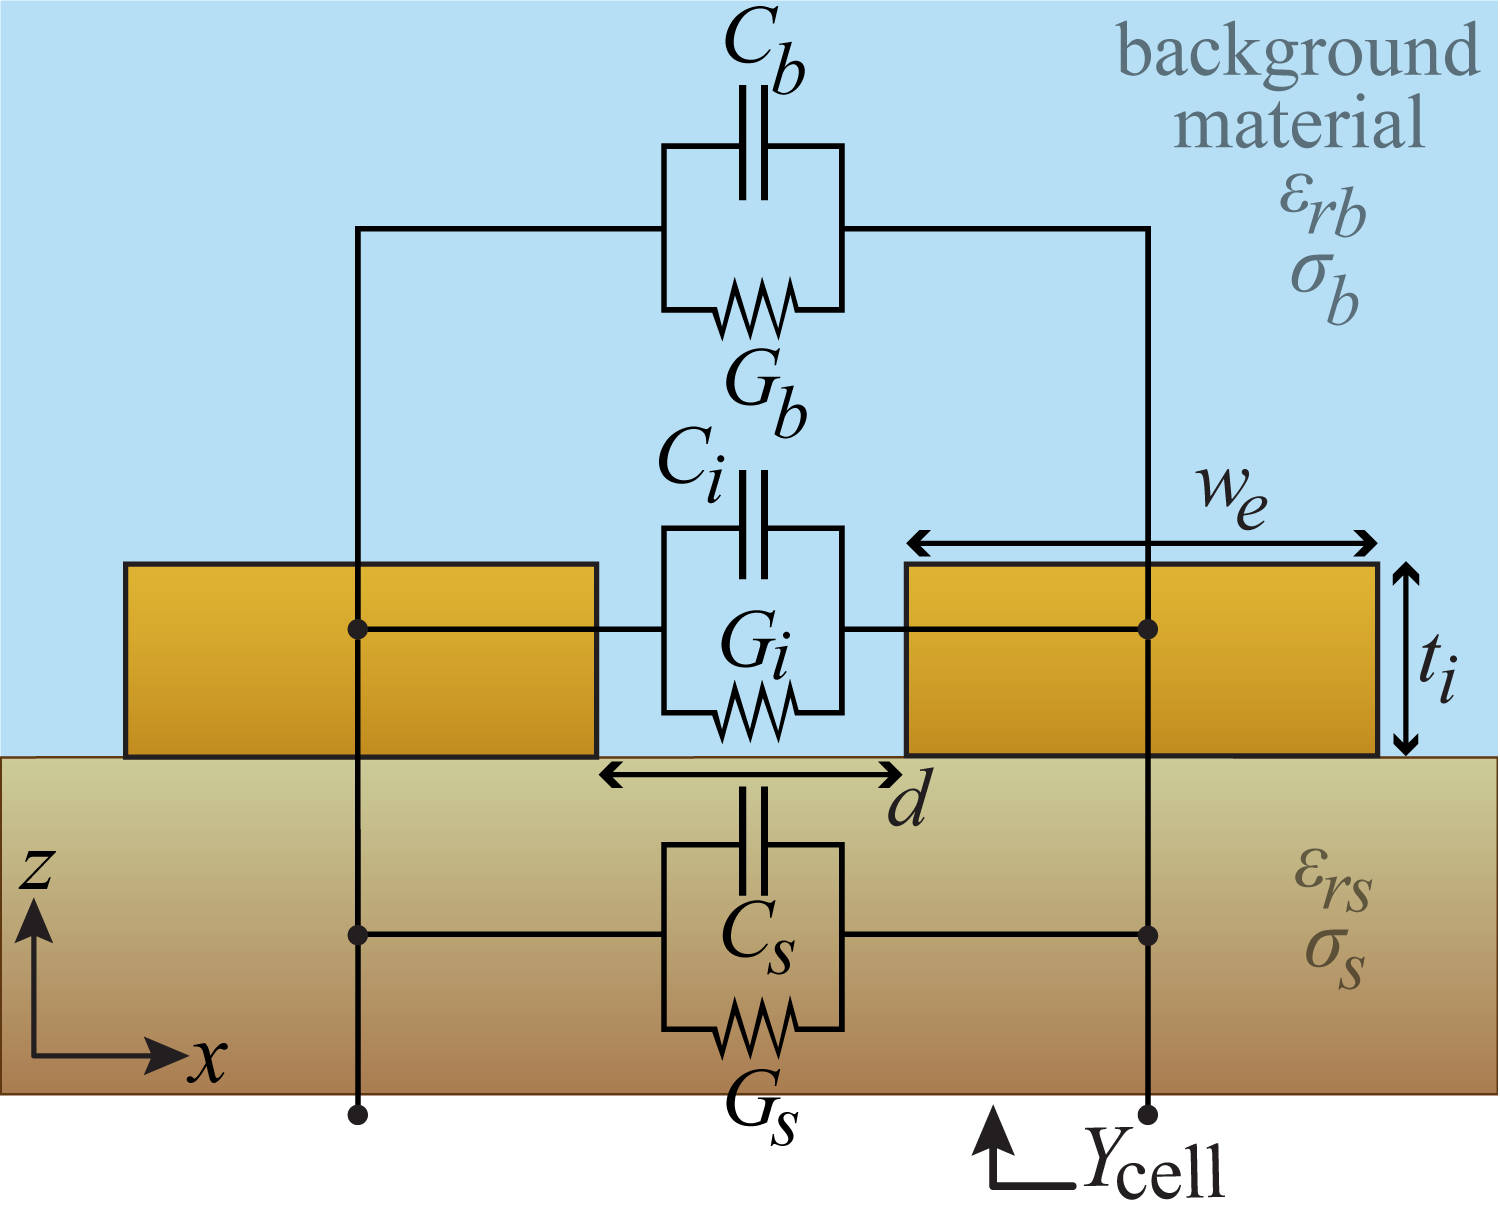
An IDC is considered here as a reliable candidate to realize the biosensing capacitor . The capacitance and conductance of the IDC depend on the geometrical design and the electromagnetic properties of the various materials used to fabricate the capacitor. We propose an equivalent circuit model for the IDC that easily describes the sensor’s port admittance as shown in Fig. 3, and that will be used for the perturbation analysis in the next subsection.
In order to simplify the analysis of the IDC and obtain an equivalent circuit model, we divide the media surrounding the electrodes into several domains based on their electromagnetic properties and electric field distribution. Hence, we model each domain by a parallel capacitance and conductance, placed along the direction of the electric field. The cross section of the biosensing capacitor showing the different domains is illustrated in Fig. 3(a) where only two electrodes of the interdigitated capacitor are shown. The domains are the substrate, the inter-electrode layer, and the background material above the electrodes. The equivalent circuit models of such domains are in parallel (see Fig. 3(a)). In practice, the background and the substrate domains are significantly thicker than the inter-electrode gap, hence they are approximated by two infinite half-spaces. The fringing electric field distribution between two electrodes of the IDC cell is similar to that of a pair of parallel strip lines. We derive analytical formulas for capacitances and conductances of the equivalent circuit model of the cell shown in Fig. 3(a) by fitting the result of the admittance formula of two parallel strip lines to that of numerical simulations. The numerical results are obtained by finite element method (FEM) simulations implemented in COMSOL Multiphysics [51]. Typically, the geometrical ratios in strip lines are different from IDC, and to derive accurate ad-hoc formulas, we add correction factors in the analytic expressions for the capacitance and conductance of the parallel strip lines (whose approximation is available in [52]):
(a)
(b)
| (5) |
| (6) |
where and represent the length and width of each electrode, respectively, is the gap between the two adjacent electrodes, and are the relative permittivity and the conductivity of the background medium, respectively, and is the permittivity of vacuum. We anticipate that the constant coefficients , and are obtained from the fitting procedure based on the IDC parameters given hereafter for the IDC biosensor shown in Fig. 1.
Note that the equivalent capacitance and conductance of the substrate domain are derived from (5) and (6), simply by replacing the background material parameters with those of the substrate, i.e., replacing and with and , respectively.
We assume that the inter-electrode domain is filled with the background material and due to the small (compared to the wavelength) parallel side walls of the adjacent electrodes, the inter-electrode domain experiences a uniform electric field distribution, hence the equivalent capacitance and conductance of the inter-electrode domain are estimated by [53]
| (7) |
| (8) |
Here , and are the thickness of the electrode, the relative permittivity, and conductivity of the inter-electrode domain, respectively. The IDC is comprised of cells repeated in the direction and the equivalent circuits of the cells are in parallel. According to the operative frequency range and also due to the parallel connection of the electrodes, it is observed that the IDC shows a negligible inductance at its terminals in the considered frequency range. With a reasonable approximation, the admittance of a single cell of the interdigitated capacitor is approximated as
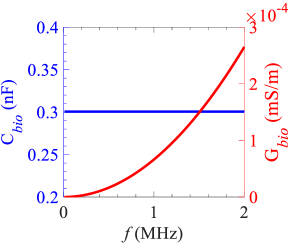
hence, the total admittance of the biosensing capacitor is derived as . Figure 3(b) shows an example of a designed IDC where the total capacitance is and the total conductance is at . In order to meet the required design values of the time-periodic LC sensor that exhibits an EPD, we optimize the IDC using (5)-(8). For the aforementioned design, the geometrical parameters are set as , , , , and . We use deionized water with , and (at 100 MHz) as background and inter-electrode materials, and quartz with , as substrate. The frequency dependent behavior of the materials is considered using the Debye model in [54].
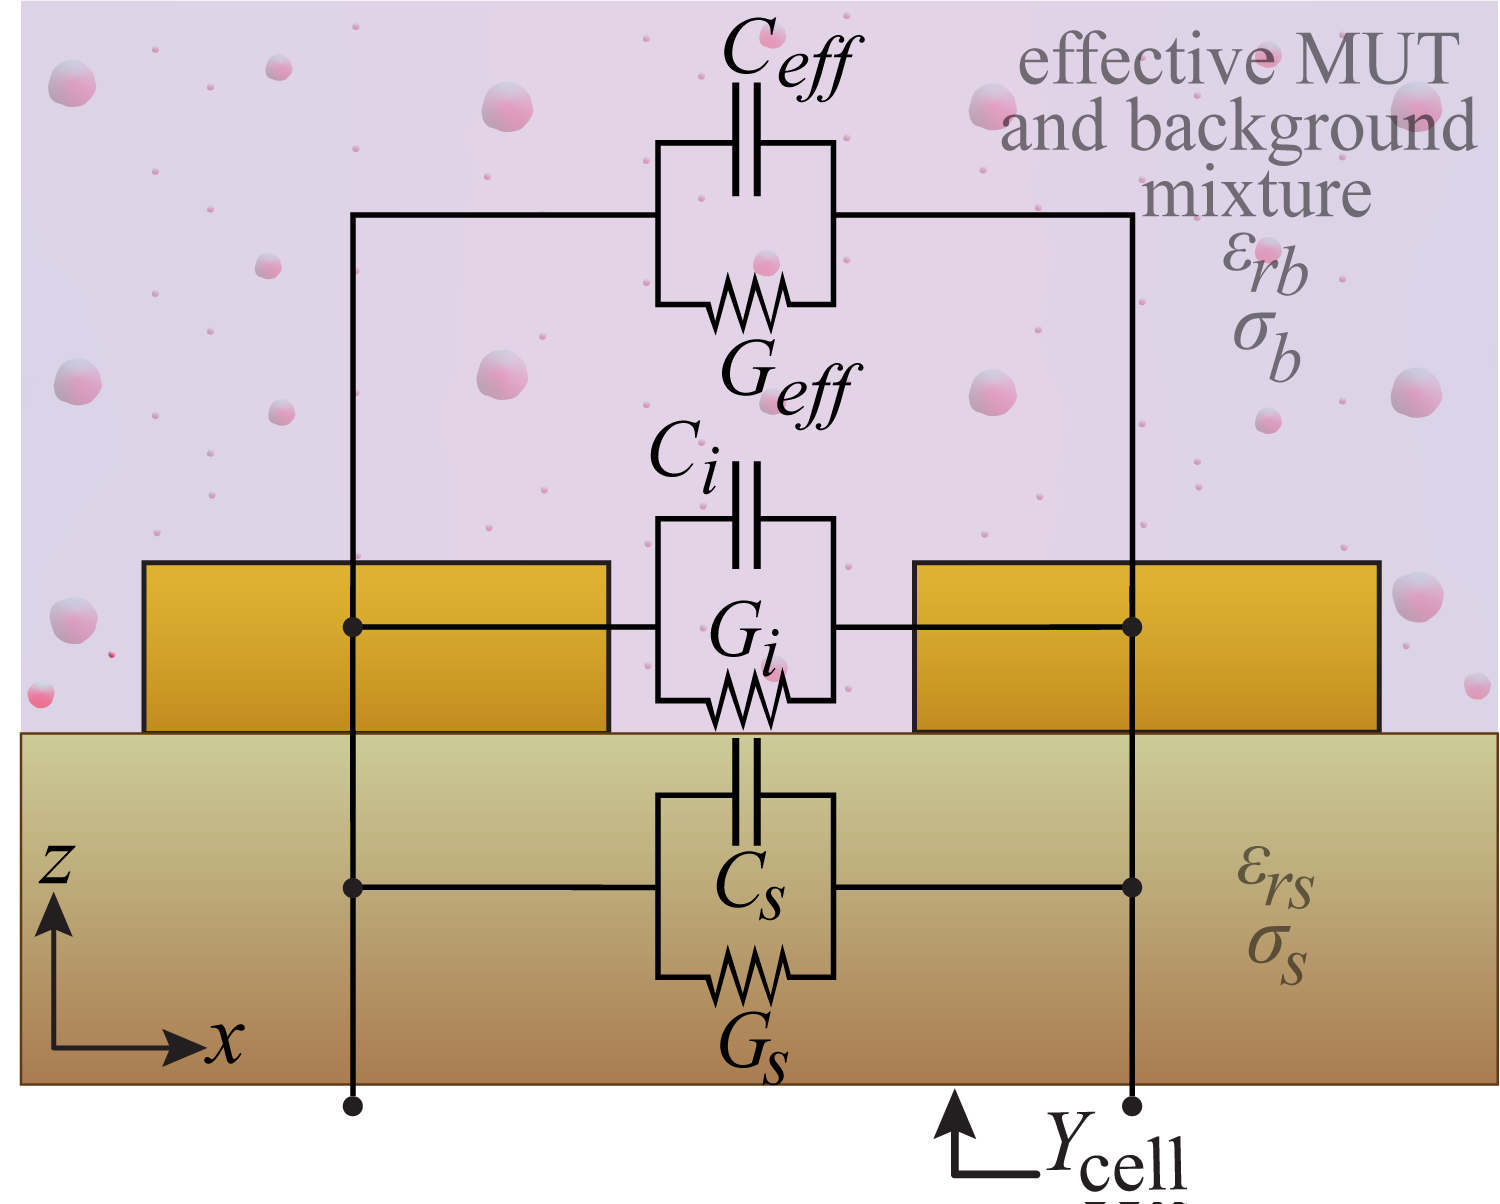
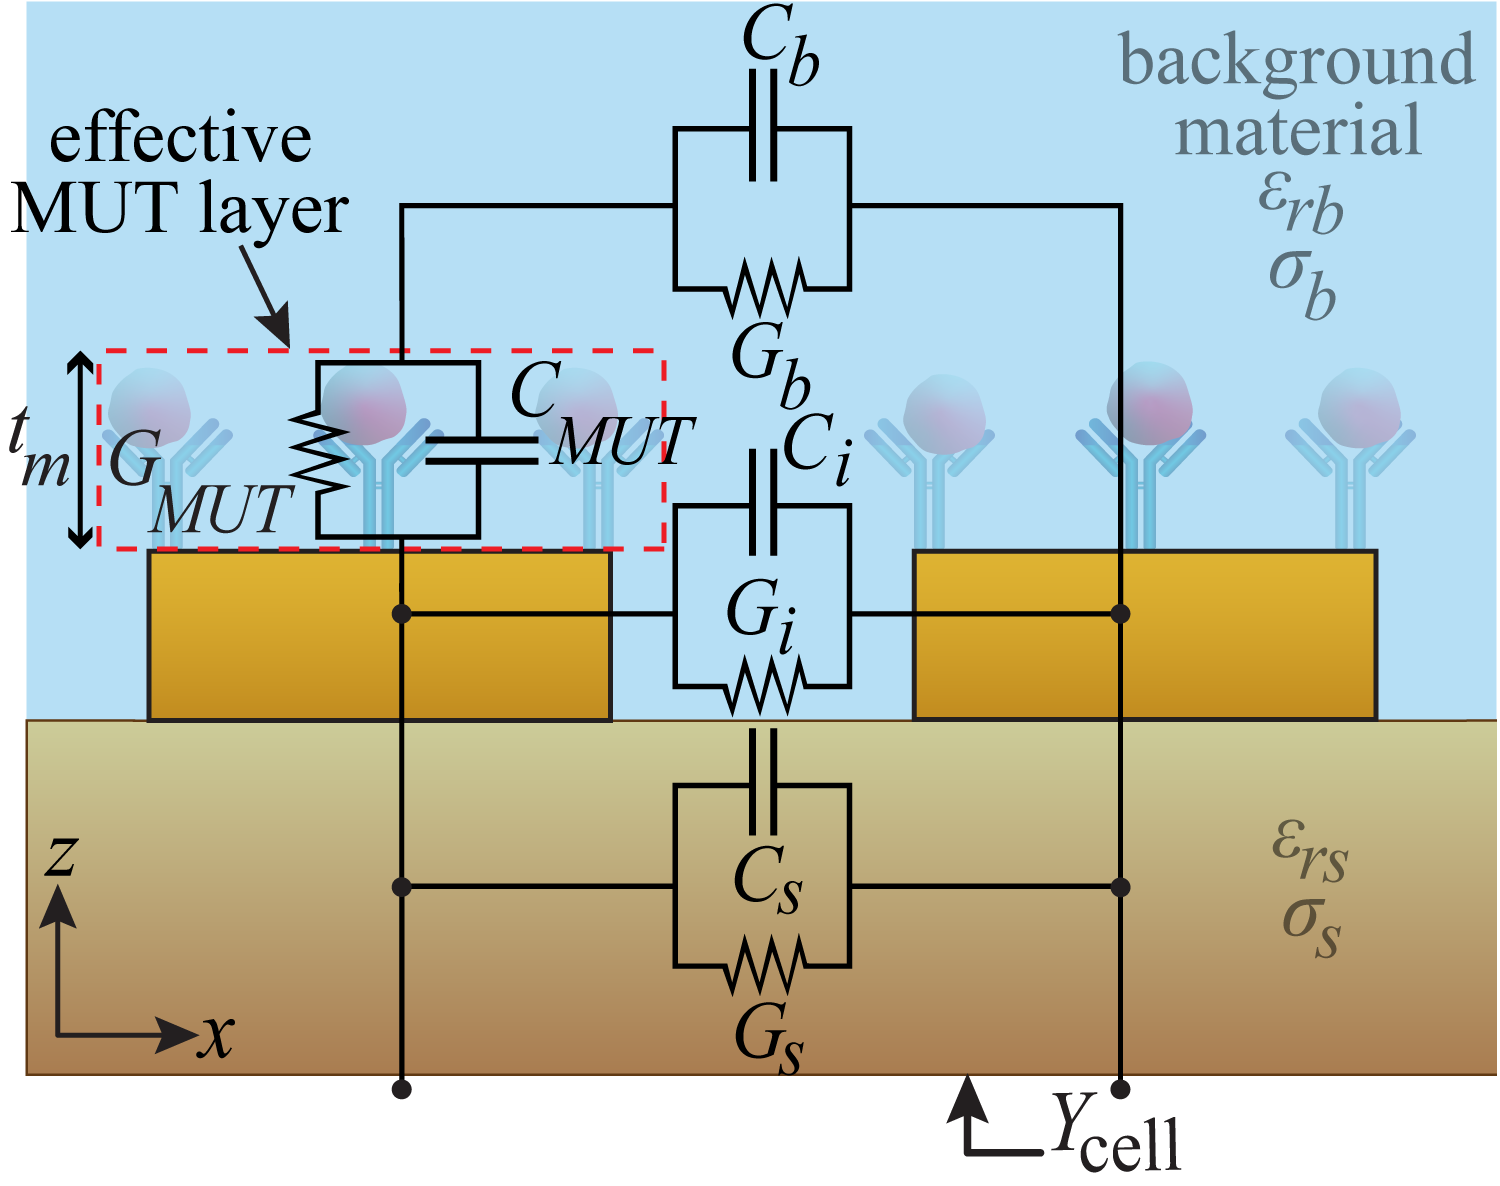
Next, we investigate the variation of the capacitance and conductance of the IDC based on the variation of the MUT concentration by using the derived model. According to the type of the MUT, there are two common bionsensing modes: (i) the MUT (e.g. glucose) dissolves in the background material uniformly changing the electromagnetic properties of the background material, and (ii) a thin layer of the MUT (e.g. proteins) covers the exposed surface of the electrodes. The cross section of the perturbed biosensing capacitors for both sensing scenarios are depicted in Fig. 4(a) and (b), respectively. Note that in an experimental scenario, the interdigitated capacitance is typically encapsulated in a silicone chamber such as Polydimethylsiloxane (PDMS) or Ecoflex which the temperature and humidity are kept under control, i.e., isolating the experiment from outside [27].
(a)
(b)
(c) (d)
The perturbation in each biosensing scenario is defined as the relative volumetric concentration of the MUT in the background material where represents the unperturbed structure (i.e., only the background material is present) and means that the entire background material is replaced by the MUT. Such a uniform mixture of the MUT and background material can be described by an effective permittivity and conductivity using the linear mixture formula for composite media [55, 56, 57]
| (9) | |||||
| (10) |
where and represent the relative permittivity and conductivity of the MUT, respectively.
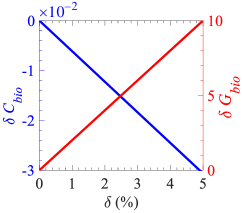
To find the equivalent capacitance and conductance of the first biosensing scenario in Fig. 4(a), we substitute the effective parameters of the composite mixture formula (9) and (10) into (5) and (6) to derive the equivalent circuit parameters of the perturbed biosensor capacitor shown in Fig. 4(a). The change in the capacitance and conductance values of the perturbed equivalent circuit biosensor capacitor and are respectively denoted by and are reported in Fig. 4(c). The result in this Figure is based on the assumption that the MUT is glucose described with and in the considered frequency range [58].
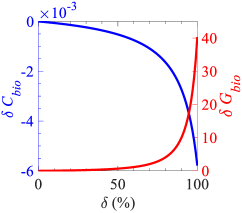
In the second biosensing scenario, Fig. 4(b), we consider a thin MUT layer (i.e., typically a protein layer) with relative volumetric concentration , that adheres to the top surface of the electrodes and is surrounded by the background material as shown in Fig. 4(b). Therefore, a layer made of MUT and background material is formed (referred to as effective MUT in the following) and it covers the entire electrodes’ surface through which the fringing electric field passes. Hence, the effective layer is modeled by a circuit comprised of a capacitance in parallel with a conductance , where such circuit in turn is in series with the background domain’s equivalent circuit. Since the effective MUT layer thickness is only a few nanometers, the electric field distribution is uniform in the this layer. The equivalent circuit parameters of the effective MUT layer is obtained from and where and are given by the linear mixture formula in (9) and (10), respectively. Considering the equivalent circuit model of different domains represented in Fig. 4(b), we derive the variation in the values of the perturbed equivalent circuit parameters and ( and ) reported in Fig. 4(d). The result in this figure is based on the assumption that the MUT is made of Keratin with and , [59].
IV Characterization of the biosensor performance
We characterize the sensitivity of the biosensor system operating at an EPD, based on a LTP-LC resonator made of the parallel arrangement of the biosensing capacitor in section III and a time-varying capacitor.
IV-A Sensitivity comparison with conventional biosensors
We start by showing a comparison between the sensitivity of a biosensor based on a LTP-LC resonator operating near an EPD and a conventional biosensor based on a linear time-invariant (LTI)-LC resonator, i.e., a standard LC resonator. The values of the LTP-LC resonator are the same as those in the previous sections. To assess a fair comparison, we assume that the capacitance in the LTI-LC resonator is equal to the time average capacitance in the LTP-LC resonator, i.e., , and all the other parameters are the same as those of the LTP-LC case in Section II, i.e., , , and .
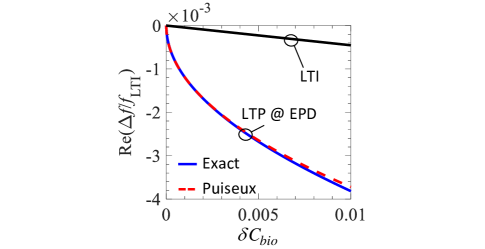
Figure 5 illustrates the change in the real part of a resonance frequency versus relative perturbation , for both the LTI (standard case) and LTP (EPD case) biosensors. Therefore, for the LTP-LC biosensor, describes the shift of the resonance frequency in the perturbed biosensor with respect to the 6th harmonics () of the degenerate resonance frequency, i.e., of the unperturbed biosensor (i.e., working at an EPD). Similarly, for the LTI-LC case shows the shift of the resonance frequency with respect to unperturbed resonance frequency . The change in the biosensing capacitance is due to the change in the MUT concentration in the background material, shown in Figs. 4(c) and (d) for the two biosensing scenarios.
The change of the resonance frequency based on the EPD perturbation is well described by the Puiseux series in (4), truncated to the first order. Indeed this approximation is in very good agreement with the “exact” result for the LTP case obtained by solving Eq. (3), showing the analytical nature of the ultra sensitivity concept of the EPD-based sensor. In Fig. 5 we have normalized the perturbation of the resonance frequency for both the LTP-LC and LTI-LC resonators to the resonance frequency of the lossless unperturbed LTI-LC resonator that is calculated as . This Figure shows the highly remarkable sensitivity associated with the biosensor designed to operate at an EPD of the LTP-LC system. Such ultra-sensitivity of the LTP-LC resonator operating at a second order EPD was observed experimentally in [47] in general terms, hence here we investigate the sensitivity to the variation of a MUT in a biosensing scenario. A comparison with the state of the art RF sensors such as [26, 27, 28, 29] shows that our designed biosensor operating at an EPD has very high sensitivity for the same MUT concentration. For instance in [28] the authors achieve relative resonance frequency shift of for whereas our biosensor shows relative resonance frequency shift of for the same MUT concentration. One may note that the value of in Eq. (4) can significantly affect the sensitivity of the LTP-LC resonator and it is determined by the parameters of the system. Considering the values used in this paper, . Moreover, it can be inferred from the fractional power expansion of the resonance frequencies in Eq.(4) that for an imaginary value of , a perturbation implies that only the real part of the resonance frequency changes while the imaginary part is constant (i.e. there are two purely real frequencies), whereas a perturbation implies that the imaginary part is the one changing while the real part remains constant. Future work shall focus on how to maximize this value based on the design of the circuit parameters.
IV-B Sensing scalability across different frequencies
As mentioned in the introduction, a system operating at an EPD exhibits an enormous sensitivity to any perturbation to the system. In such a system, shown in Fig. 2, we have different EPD resonances for different modulation frequencies, hence we can design a sensor with exceptional sensitivity to operate at any of them. In order to illustrate the exotic performance of the described sensing system, we assume that the biosensing capacitor is experiencing a increase in the concentration of the MUT, hence the biosensing capacitance value is perturbed as , and its relative change follows the behavior shown in Figs. 4(c) and (d), for the two sensing scenarios shown in Fig. 4. In turn, a relative positive increment perturbs the LTP-LC resonator operating at an EPD, generating two real resonance frequencies, whereas a negative , generates two resonance frequencies that deviate in their imaginary part, following the dispersion diagram in Fig. 2(b). These features are better shown in Fig. 6 that illustrates such ultra-sensitivity of the resonance frequency to small values of , considering three case with three different modulation frequencies . Fig. 6(a) and (b) show the real and imaginary shifts of the resonance frequencies, respectively, where the solid-blue curve represents a design with a modulation frequency , the dashed-red curve and green circles represent a scaled designs of the biosensor with modulation frequencies and , respectively.
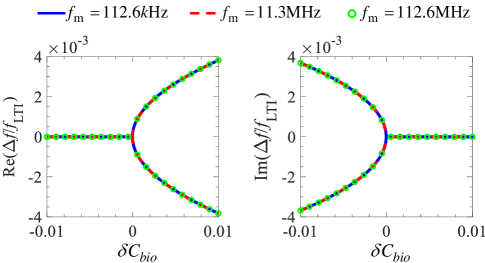
We conclude from the figure that the real and imaginary parts of the resonance frequency are sharply sensitive to the external perturbation (e.g., the concentration of the MUT). We also conclude that this sensitivity property is valid (it is actually the same) regardless of the chosen modulation frequency which indicates a freedom in the choice of the circuit components, and that the concepts presented in this paper are scalable to any operating frequency.
V Conclusion
We have exploited the concept of EPDs induced in linear time-periodic systems to achieve extremely sensitive biosensors based on the detection of a resonant frequency shift. We use a single time-varying LC resonator whose capacitance is given by the parallel arrangement of a time-variant capacitor and the biosensing capacitor. In our proposed scheme with a single LTP resonator, the perturbation of the sensing capacitance perturbs the system away from the EPD and results in two real-frequency shifts from the EPD one. This is in contrast to what occurs in a two-coupled resonator system operating at an EPD based on PT symmetry; indeed, in a PT symmetric system, perturbing the sensing capacitor on the lossy (sensing) side only, disqualifies the system as being PT symmetric and as a result both of the system resonant frequencies become complex. Furthermore, we have developed a model of interdigitated capacitors that well describes changes of capacitance due to the variations in the concentration of an MUT and investigated how sensitive is the LTP-LC biosensor to such changes. We have considered two different sensing scenarios, and an unprecedented sensitivity to the perturbations of the time-variant LC resonator at an EPD is illustrated. The sensitivity of the resonance frequency in a single, time-varying, LC resonator working at an EPD to perturbations has been demonstrated to be much higher than that of a single, time-invariant (i.e., standard), LC resonator. The practical implementation of this sensing technology seems straightforward since the time-modulated capacitance can be realized with a simple multiplier controlled by a modulated voltage pump [47] for example. The working principle for the proposed ultra-sensitive biosensor is general and can be easily implemented in existing systems to enhance sensitivity, paving the way to a new class of ultra-sensitive sensors.
Acknowledgment
This material is based upon work supported by the National Science Foundation under Award No. ECCS-1711975.
References
- [1] J. Wang, “Electrochemical biosensors: towards point-of-care cancer diagnostics,” Biosensors and Bioelectronics, vol. 21, no. 10, pp. 1887–1892, 2006.
- [2] X. Wei, T. Tian, S. Jia, Z. Zhu, Y. Ma, J. Sun, Z. Lin, and C. J. Yang, “Microfluidic distance readout sweet hydrogel integrated paper-based analytical device (DiSH-PAD) for visual quantitative point-of-care testing,” Analytical chemistry, vol. 88, no. 4, pp. 2345–2352, 2016.
- [3] J. Mandl, T. Meszaros, G. Banhegyi, L. Hunyady, and M. Csala, “Endoplasmic reticulum: nutrient sensor in physiology and pathology,” Trends in Endocrinology & Metabolism, vol. 20, no. 4, pp. 194–201, 2009.
- [4] G. Lopez, V. Custodio, and J. I. Moreno, “LOBIN: E-textile and wireless-sensor-network-based platform for healthcare monitoring in future hospital environments,” IEEE Transactions on Information Technology in Biomedicine, vol. 14, no. 6, pp. 1446–1458, Nov 2010.
- [5] Y. M. Huang, M. Y. Hsieh, H. C. Chao, S. H. Hung, and J. H. Park, “Pervasive, secure access to a hierarchical sensor-based healthcare monitoring architecture in wireless heterogeneous networks,” IEEE Journal on Selected Areas in Communications, vol. 27, no. 4, pp. 400–411, May 2009.
- [6] J. Kim, A. S. Campbell, B. E.-F. de Avila, and J. Wang, “Wearable biosensors for healthcare monitoring,” Nature biotechnology, p. 1, 2019.
- [7] V. B. C. Lee, N. F. Mohd-naim, E. Tamiya, and M. U. Ahmed, “Trends in paper-based electrochemical biosensors: From design to application,” Analytical Sciences, vol. 34, no. 1, pp. 7–18, 2018.
- [8] D.-M. Shin, Y.-C. Shin, J.-H. Lee, T.-H. Kim, D.-W. Han, J.-M. Kim, H. K. Kim, K. Kim, and Y.-H. Hwang, “Highly sensitive detection of epidermal growth factor receptor expression levels using a capacitance sensor,” Sensors and Actuators B: Chemical, vol. 209, pp. 438–443, 2015.
- [9] J. Halliwell, A. C. Savage, N. Buckley, and C. Gwenin, “Electrochemical impedance spectroscopy biosensor for detection of active botulinum neurotoxin,” Sensing and Bio-Sensing Research, vol. 2, pp. 12–15, 2014.
- [10] A. Ramanavicius, A. Finkelsteinas, H. Cesiulis, and A. Ramanaviciene, “Electrochemical impedance spectroscopy of polypyrrole based electrochemical immunosensor,” Bioelectrochemistry, vol. 79, no. 1, pp. 11–16, 2010.
- [11] L. Loo, W. Wu, W. Y. Shih, W.-H. Shih, H. Borghaei, K. Pourrezaei, and G. P. Adams, “A rapid method to regenerate piezoelectric microcantilever sensors (PEMS),” Sensors, vol. 11, no. 5, pp. 5520–5528, 2011.
- [12] L. Loo, J. A. Capobianco, W. Wu, X. Gao, W. Y. Shih, W.-H. Shih, K. Pourrezaei, M. K. Robinson, and G. P. Adams, “Highly sensitive detection of HER2 extracellular domain in the serum of breast cancer patients by piezoelectric microcantilevers,” Analytical chemistry, vol. 83, no. 9, pp. 3392–3397, 2011.
- [13] J. A. Capobianco, W. Y. Shih, Q.-A. Yuan, G. P. Adams, and W.-H. Shih, “Label-free, all-electrical, in situ human epidermal growth receptor 2 detection,” Review of Scientific Instruments, vol. 79, no. 7, p. 076101, 2008.
- [14] M. H. Meyer, M. Hartmann, and M. Keusgen, “SPR-based immunosensor for the CRP detection–A new method to detect a well known protein,” Biosensor and Bioelectronics, vol. 21, no. 10, pp. 1987–1990, 2006.
- [15] G. Ertürk, H. Özen, M. A. Tümer, B. Mattiasson, and A. Denizli, “Microcontact imprinting based surface plasmon resonance (SPR) biosensor for real-time and ultrasensitive detection of prostate specific antigen (PSA) from clinical samples,” Sensors and Actuators B: Chemical, vol. 224, pp. 823–832, 2016.
- [16] T. Guo, F. Liu, X. Liang, X. Qiu, Y. Huang, C. Xie, P. Xu, W. Mao, B.-O. Guan, and J. Albert, “Highly sensitive detection of urinary protein variations using tilted fiber grating sensors with plasmonic nanocoatings,” Biosensors and Bioelectronics, vol. 78, pp. 221–228, 2016.
- [17] K. Sun, N. Xia, L. Zhao, K. Liu, W. Hou, and L. Liu, “Aptasensors for the selective detection of alpha-synuclein oligomer by colorimetry, surface plasmon resonance and electrochemical impedance spectroscopy,” Sensors and Actuators B: Chemical, vol. 245, pp. 87–94, 2017.
- [18] I. M. Yman, A. Eriksson, M. A. Johansson, and K.-E. Hellens, “Food allergen detection with biosensor immunoassays,” Journal of AOAC International, vol. 89, no. 3, pp. 856–861, 2006.
- [19] S. Avrameas, “Coupling of enzymes to proteins with glutaraldehyde: use of the conjugates for the detection of antigens and antibodies,” Immunochemistry, vol. 6, no. 1, pp. 43–52, 1969.
- [20] H.-B. Wang, H.-D. Zhang, Y. Chen, and Y.-M. Liu, “A fluorescent biosensor for protein detection based on poly (thymine)-templated copper nanoparticles and terminal protection of small molecule-linked DNA,” Biosensors and Bioelectronics, vol. 74, pp. 581–586, 2015.
- [21] E. Heyduk and T. Heyduk, “Fluorescent homogeneous immunosensors for detecting pathogenic bacteria,” Analytical biochemistry, vol. 396, no. 2, pp. 298–303, 2010.
- [22] T. B. Ledue and N. Rifai, “High sensitivity immunoassays for C-reactive protein: promises and pitfalls.” Clinical chemistry and laboratory medicine, vol. 39 11, pp. 1171–6, 2001.
- [23] R. De La Rica and M. M. Stevens, “Plasmonic ELISA for the ultrasensitive detection of disease biomarkers with the naked eye,” Nature nanotechnology, vol. 7, no. 12, p. 821, 2012.
- [24] C.-P. Jia, X.-Q. Zhong, B. Hua, M.-Y. Liu, F.-X. Jing, X.-H. Lou, S.-H. Yao, J.-Q. Xiang, Q.-H. Jin, and J.-L. Zhao, “Nano-ELISA for highly sensitive protein detection,” Biosensors and Bioelectronics, vol. 24, no. 9, pp. 2836–2841, 2009.
- [25] T. Holzhauser, O. Stephan, and S. Vieths, “Detection of potentially allergenic hazelnut (Corylus avellana) residues in food: a comparative study with DNA PCR-ELISA and protein sandwich-ELISA,” Journal of agricultural and food chemistry, vol. 50, no. 21, pp. 5808–5815, 2002.
- [26] P. Tseng, B. Napier, L. Garbarini, D. L. Kaplan, and F. G. Omenetto, “Functional, RF-trilayer sensors for tooth-mounted, wireless monitoring of the oral cavity and food consumption,” Advanced Materials, vol. 30, no. 18, p. 1703257, 2018.
- [27] M. Dautta, M. Alshetaiwi, J. Escobar, and P. Tseng, “Passive and wireless, implantable glucose sensing with phenylboronic acid hydrogel-interlayer rf resonators,” Biosensors and Bioelectronics, p. 112004, 2020.
- [28] N.-Y. Kim, K. K. Adhikari, R. Dhakal, Z. Chuluunbaatar, C. Wang, and E.-S. Kim, “Rapid, sensitive, and reusable detection of glucose by a robust radiofrequency integrated passive device biosensor chip,” Scientific reports, vol. 5, p. 7807, 2015.
- [29] A. Hajiaghajani, A. R. Escobar, M. Dautta, and P. Tseng, “Selective manipulation and trapping of magnetically barcoded materials,” Advanced Materials Interfaces, vol. 6, no. 24, p. 1901312, 2019.
- [30] C. M. Bender and S. Boettcher, “Real Spectra in Non-Hermitian Hamiltonians Having PT Symmetry,” Physical Review Letters, vol. 80, no. 24, pp. 5243–5246, Jun. 1998.
- [31] A. Figotin and I. Vitebskiy, “Oblique frozen modes in periodic layered media,” Physical Review E, vol. 68, no. 3, p. 036609, Sep. 2003.
- [32] A. Guo, G. J. Salamo, D. Duchesne, R. Morandotti, M. Volatier-Ravat, V. Aimez, G. A. Siviloglou, and D. N. Christodoulides, “Observation of PT-Symmetry Breaking in Complex Optical Potentials,” Physical Review Letters, vol. 103, no. 9, p. 093902, Aug. 2009.
- [33] M. A. K. Othman, M. Veysi, A. Figotin, and F. Capolino, “Low Starting Electron Beam Current in Degenerate Band Edge Oscillators,” IEEE Transactions on Plasma Science, vol. 44, no. 6, pp. 918–929, Jun. 2016.
- [34] M. A. K. Othman, V. Galdi, and F. Capolino, “Exceptional points of degeneracy and PT symmetry in photonic coupled chains of scatterers,” Physical Review B, vol. 95, no. 10, p. 104305, Mar. 2017.
- [35] M. Veysi, M. A. K. Othman, A. Figotin, and F. Capolino, “Degenerate band edge laser,” Physical Review B, vol. 97, no. 19, p. 195107, May 2018.
- [36] M. Y. Nada, A. F. Abdelshafy, T. Mealy, F. Yazdi, H. Kazemi, A. Figotin, and F. Capolino, “Various topologies of coupled-mode structures exhibiting exceptional points of degeneracy,” in 2018 International Conference on Electromagnetics in Advanced Applications (ICEAA). IEEE, 2018, pp. 627–629.
- [37] H. Kazemi, M. Y. Nada, T. Mealy, A. F. Abdelshafy, and F. Capolino, “Exceptional points of degeneracy induced by linear time-periodic variation,” Phys. Rev. Applied, vol. 11, p. 014007, Jan 2019.
- [38] J. Wiersig, “Enhancing the Sensitivity of Frequency and Energy Splitting Detection by Using Exceptional Points: Application to Microcavity Sensors for Single-Particle Detection,” Physical Review Letters, vol. 112, no. 20, p. 203901, May 2014.
- [39] J. Wiersig, “Sensors operating at exceptional points: general theory,” Physical Review A, vol. 93, no. 3, p. 033809, 2016.
- [40] H. Hodaei, A. U. Hassan, S. Wittek, H. Garcia-Gracia, R. El-Ganainy, D. N. Christodoulides, and M. Khajavikhan, “Enhanced sensitivity at higher-order exceptional points,” Nature, vol. 548, no. 7666, pp. 187–191, Aug. 2017.
- [41] M. Y. Nada, H. Kazemi, A. F. Abdelshafy, F. Yazdi, D. Oshmarin, T. Mealy, A. Figotin, and F. Capolino, “Microwave circuits with exceptional points and applications in oscillators and sensors,” in 2018 18th Mediterranean Microwave Symposium (MMS). IEEE, 2018, pp. 108–111.
- [42] A. F. Abdelshafy, M. A. Othman, D. Oshmarin, A. T. Almutawa, and F. Capolino, “Exceptional points of degeneracy in periodic coupled waveguides and the interplay of gain and radiation loss: Theoretical and experimental demonstration,” IEEE Transactions on Antennas and Propagation, DOI: 10.1109/TAP.2019.2922778, 2019.
- [43] M. A. Othman, M. Veysi, A. Figotin, and F. Capolino, “Giant amplification in degenerate band edge slow-wave structures interacting with an electron beam,” Physics of Plasmas, vol. 23, no. 3, p. 033112, 2016.
- [44] D. Oshmarin, F. Yazdi, M. Othman, J. Sloan, M. Radfar, M. Green, and F. Capolino, “A new oscillator concept based on band edge degeneracy in lumped double-ladder circuits,” IET Circuits, Devices & Systems, 2019.
- [45] M. Sakhdari, M. Hajizadegan, Y. Li, M. Cheng, J. C. H. Hung, and P.-Y. Chen, “Ultrasensitive parity time symmetric wireless reactive and resistive sensors,” IEEE Sensors Journal, vol. 18, no. 23, pp. 9548–9555, Dec 2018.
- [46] P.-Y. Chen, M. Sakhdari, M. Hajizadegan, Q. Cui, M. M.-C. Cheng, R. El-Ganainy, and A. Alu, “Generalized parity-time symmetry condition for enhanced sensor telemetry,” Nature Electronics, vol. 1, no. 23, pp. 297–304, 2018.
- [47] H. Kazemi, M. Y. Nada, F. Maddaleno, and F. Capolino, “Experimental demonstration of exceptional points of degeneracy in linear time periodic systems and exceptional sensitivity,” arXiv:1908.08516, 2019.
- [48] J. A. Richards, Analysis of periodically time-varying systems. Springer Science & Business Media, 2012.
- [49] T. Kato, Perturbation Theory for Linear Operators, 2nd ed. Springer-Verlag, Berlin Heidelberg, 1995.
- [50] A. Welters, “On Explicit Recursive Formulas in the Spectral Perturbation Analysis of a Jordan Block,” SIAM Journal on Matrix Analysis and Applications, vol. 32, no. 1, pp. 1–22, Jan. 2011.
- [51] “Comsol multiphysics reference manual, version 5.3, comsol, inc, www.comsol.com.”
- [52] R. Garg, I. Bahl, and M. Bozzi, Microstrip lines and slotlines. Artech house, Dedham, MA, 1979.
- [53] D. J. Griffiths, Introduction to electrodynamics. Cambridge University Press, New York, NY, 2005.
- [54] C. D. Abeyrathne, M. N. Halgamuge, P. M. Farrell, and E. Skafidas, “An ab-initio computational method to determine dielectric properties of biological materials,” Scientific reports, vol. 3, p. 1796, 2013.
- [55] R. Chan, K. Pathmanathan, and G. Johari, “Dielectric relaxations in the liquid and glassy states of glucose and its water mixtures,” The Journal of Physical Chemistry, vol. 90, no. 23, pp. 6358–6362, 1986.
- [56] R. Simpkin, “Derivation of lichtenecker’s logarithmic mixture formula from maxwell’s equations,” IEEE Transactions on Microwave Theory and Techniques, vol. 58, no. 3, pp. 545–550, 2010.
- [57] D. Bruggeman, “Dielectric constant and conductivity of mixtures of isotropic materials,” Ann. Phys.(Leipzig), vol. 24, pp. 636–679, 1935.
- [58] V. Turgul and I. Kale, “Characterization of the complex permittivity of glucose/water solutions for noninvasive rf/microwave blood glucose sensing,” in 2016 IEEE International Instrumentation and Measurement Technology Conference Proceedings, May 2016, pp. 1–5.
- [59] F. Bibi, M. Villain, C. Guillaume, B. Sorli, and N. Gontard, “A review: Origins of the dielectric properties of proteins and potential development as bio-sensors,” Sensors, vol. 16, no. 8, p. 1232, 2016.