IRDFF-II: A New Neutron Metrology Library
Abstract
High quality nuclear data is the most fundamental underpinning for all neutron metrology applications. This paper describes the release of version II of the International Reactor Dosimetry and Fusion File (IRDFF-II) that contains a consistent set of nuclear data for fission and fusion neutron metrology applications up to 60 MeV neutron energy. The library is intended to support: a) applications in research reactors; b) safety and regulatory applications in the nuclear power generation in commercial fission reactors; and c) material damage studies in support of the research and development of advanced fusion concepts. The paper describes the contents of the library, documents the thorough verification process used in its preparation, and provides an extensive set of validation data gathered from a wide range of neutron benchmark fields. The new IRDFF-II library includes 119 metrology reactions, four cover material reactions to support self-shielding corrections, five metrology metrics used by the dosimetry community, and cumulative fission products yields for seven fission products in three different neutron energy regions. In support of characterizing the measurement of the residual nuclei from the dosimetry reactions and the fission product decay modes, the present document lists the recommended decay data, particle emission energies and probabilities for 68 activation products. It also includes neutron spectral characterization data for 29 neutron benchmark fields for the validation of the library contents. Additional six reference fields were assessed (four from plutonium critical assemblies, two measured fields for thermal-neutron induced fission on 233U and 239Pu targets) but not used for validation due to systematic discrepancies in C/E reaction rate values or lack of reaction-rate experimental data. Another ten analytical functions are included that can be useful for calculating average cross sections, average energy, thermal spectrum average cross sections and resonance integrals. The IRDFF-II library and comprehensive documentation is available online at www-nds.iaea.org/IRDFF/. Evaluated cross sections can be compared with experimental data and other evaluations at www-nds.iaea.org/exfor/endf.htm. The new library is expected to become the international reference in neutron metrology for multiple applications.
I INTRODUCTION
High quality nuclear data are the most fundamental quantities underpinning all neutron metrology applications. The International Atomic Energy Agency (IAEA) Nuclear Data Section (NDS), through several research projects, sponsored an international collaboration to provide a consensus for the recommended evaluated nuclear data for such purposes. This new library, called version II of the International Reactor Dosimetry and Fusion File (IRDFF-II), has undergone an exhaustive verification and validation process and is now being released to the metrology community. It supersedes the previous versions IRDF-2002 IRDF2002 and IRDFF-v1.05 IRDFF105 . This paper describes the content of the library and documents the thorough verification process used in its preparation. It also provides an extensive set of validation data for the library using data gathered from a wide range of neutron benchmark fields.
Well-validated nuclear data evaluation techniques are needed to produce a modern nuclear data evaluated library like IRDFF-II. An overview of nuclear data evaluation methodology can be found in Ref. Smith:1991 ; recent progress has been reviewed in Refs. Capote:2010 ; Smith-Otuka:2012 ; WPEC-SG24 . Nowadays the generalized least-square method is the most common evaluation method, e.g., see GMA ; Smith:1993 ; GLUCS ; KALMAN ; GANDR . A similar least-squares approach Vinogradov:1987 ; Badikov:1992 ; Hermanne:2018 that is based on Padé approximants Pade:1892 ; Graves-Morris:1973 ; Baker:1975 has also been extensively employed by K. Zolotarev to produce many of the new dosimetry evaluations for the IRDFF-II library.
Stochastic (Monte Carlo) evaluation methods have been also investigated by several researchers in the nuclear data field, e.g., see BFMC BFMC , UMC-B UMCB , UMC-G UMCG ; UMCG1 , and BMC BMC methods. These Bayesian approaches enable simultaneous consideration of both experimental data and model-calculated values as well as corresponding experimental and modeling correlations, and have been applied to large amounts of data (e.g., see Refs. HFB-mass ; TENDL-2017 ).
The development of the IRDFF-II dosimetry library has greatly benefited from the availability of the comprehensive TENDL libraries TENDL-2015 ; TENDL-2017 111The TENDL-2015.s60 file of the TENDL 2015 library contains exclusive representations of reactions and associated covariances up to 60 MeV. This file was extensively used for the extension of IRDFF-II evaluations up to 60 MeV., especially to extend the energy range of the existing evaluations for neutron-induced reactions on medium- and heavy-mass targets.
A general purpose neutron evaluated nuclear data file (ENDF) uses the evaluation techniques briefly discussed above to combine model calculations with experimental data to address the assembly of a complete and consistent set of neutron-induced reactions for a given target isotope. In this process an evaluator may need to make some compromises in the recommended nuclear data in order to satisfy consistency constraints on the nuclear data between different reaction channels, e.g., the total cross section must be exactly equal to the sum of the various reaction channel cross sections, while matching as much as possible the available experimental data.
In contrast to a general nuclear data evaluation, an entry in a metrology library is reaction-specific. The evaluation can start from a nuclear model calculation, but relies more heavily on experimental data to obtain recommended energy-dependent cross sections, including full covariance information for that particular reaction channel so that an accurate assessment of the uncertainty in reaction rates can be made for a given neutron spectrum field. Whereas information on the consistency of the evaluated data with integral measurements gathered in various reference neutron fields is not directly taken into account in the actual nuclear data evaluation process, it does influence the decisions to declare a reaction as “recommended” for use in metrology applications.
This paper presents a consistent set of nuclear data intended for neutron metrology that support: a) applications in research reactors; b) safety and regulatory applications in the nuclear power generation in commercial fission reactors; and c) material damage studies in research and development of advanced fusion concepts.
II OVERVIEW OF THE IRDFF-II LIBRARY
The new IRDFF-II library addresses incident neutron energies from 0 to 60 MeV. The library entries, enumerated in Table LABEL:Table_Long_I, include 119 metrology reactions, four cover cross sections used to support shielding corrections, five metrology metrics used by the dosimetry community, seven cumulative fission products yields and corresponding decay data. In support of characterizing the measurement of the residual nuclei from the dosimetry reactions and the fission product decay modes, the library includes decay data, gamma and beta particle emission energies and probabilities for 68 residual nuclei. The library also includes neutron spectral characterization data for 45 neutron benchmark fields that were used to support the validation of the library contents. The following Secs. discuss these entries of the dosimetry library in more detail.
II.1 Neutron Metrology Reactions
There are several requirements for a given reaction to be accepted for use in metrology applications and included in the IRDFF-II library. These requirements include:
-
1.
The existence of a high-fidelity nuclear data evaluation for the reaction channel that is documented and stored in the library;
-
2.
A residual particle from the reaction that is measurable with a technique in use at multiple laboratories, e.g., gamma activation analysis, beta spectroscopy, mass spectrometry;
-
3.
The existence of uncertainty data for the cross section that must come directly from the cross section evaluation process, captured in the form of a covariance matrix, and stored in the library;
- 4.
-
5.
Evidence that the nuclear data evaluation took into consideration the available body of experimental data.
Table LABEL:Table_Long_I summarizes the 119 metrology reactions that meet these requirements and are included in the IRDFF-II library. The list includes all of the reactions that were present in the earlier IRDF-2002 IRDF2002 and IRDFF v1.05 IRDFF105 libraries. The differences between library versions are indicated: column 8 indicates whether IRDFF-v1.05 was updated (new) or not (old) compared to IRDF-2002. Likewise, column 9 indicates whether IRDFF-II was updated compared to IRDFF-v1.05. As seen from the table, several of the dosimetry reactions in the IRDFF-II were updated and many reactions were added, such as 27Al(n,2n)26gAl, 28Si(n,p)28Al, 29Si(n,X)28Al, 113In(n,)114mIn, 238U(n,2n)237U, and 209Bi(n,xn)(210-x)Bi. The extensions were introduced to support specialized dosimetry applications.
High resolution atomic mass spectroscopy is often used to measure alpha production in materials such as 10B and 6Li. Measured alpha particles can originate from reactions other than the (n,) channel, hence the updated IRDFF-II library also includes reactions for the total alpha production cross section, i.e., 10B(n,X)4He and 6Li(n,X)4He reactions. Since boron and lithium are often used with a variety of enrichments in dosimetry applications, nuclear data for the 11B(n,X)4He and 7Li(n,X)4He reactions, as well as the composite elemental-based B(n,X)4He and Li(n,X)4He reactions, are included in the library. The availability of the separate 11B and 7Li alpha-production cross sections enables users to apply the IRDFF-II cross sections to variable enrichment dosimeters that might be employed at various metrology laboratories.
Previous input from users CRP17 of the IRDFF-1.05 library IRDFF105 , which was extended to address the energy range up to 60 MeV, indicated that natural elemental dosimeters, rather than isotopic ones, were usually used in dosimetry applications. Since, at the higher incident neutron energies on natural elemental dosimeters, several contributing reaction channels can produce the same residual nucleus that is used as a dosimetry monitor, the IRDFF-II library has also been extended to explicitly address the composite reactions that produce commonly used residual nuclei.
| Consistency | ||||||||
|---|---|---|---|---|---|---|---|---|
| v2002 | v-1.05 | |||||||
| ID | Reaction | Label | MAT | Energy | Evaluation | Eval. | to | to |
| No. | Interval | source | Date | v-1.051 | IRDFF-II2 | |||
| 1 | Li(n,X)3H | LiH3 | 300 | 0–60 MeV | IRDFF-II Li6H3,Li7H3 | 2019 | – | – |
| 2 | Li(n,X)4He | LiHe4 | 300 | 0–60 MeV | IRDFF-II Li6He4,Li7He4 | 2019 | – | – |
| 3 | 6Li(n,t)4He | Li6t | 325 | 0–1 MeV | IAEA STD 2017 Car18 | 2018 | new | new |
| 325 | 1–2.75 MeV | ENDF/B-VIII.0 | 2018 | new | new | |||
| 325 | 2.75–60 MeV | EAF-2010(r) | 2010 | new | new | |||
| 4 | 6Li(n,X)3H | Li6H3 | 325 | 0–60 MeV | IRDFF-II Li6t | 2019 | – | – |
| 5 | 6Li(n,X)4He | Li6He4 | 325 | 0–20 MeV | MT24–ENDF/B-VIII.0 | 2018 | – | – |
| 325 | 20–60 MeV | EAF-2010(r) (n,2n) | 2010 | – | – | |||
| 325 | 0–20 MeV | MT32–ENDF/B-VIII.0 (n,n’) | 2018 | – | – | |||
| 325 | 20–60 MeV | EAF-2010(r) (n,nd) | 2010 | – | – | |||
| 325 | 0–60 MeV | IRDFF-II Li6t | 2019 | – | – | |||
| 6 | 7Li(n,X)4He | Li7He4 | 328 | 0–60 MeV | MT24–ENDF/B-VIII.0 | 2018 | – | – |
| 328 | 20–60 MeV | EAF-2010(r) (n,2n) | 2010 | – | – | |||
| 328 | 0–20 MeV | MT25–ENDF/B-VIII.0 | 2018 | – | – | |||
| 328 | 20–60 MeV | EAF-2010(r) (n,np) | 2010 | – | – | |||
| 328 | 0–20 MeV | MT33=ENDF/B-VIII.0 (n,n’) | 2018 | – | – | |||
| 328 | 20–60 MeV | EAF-2010(r) (n,n) | 2010 | – | – | |||
| 328 | 0–20 MeV | MT102–ENDF/B-VIII.0 | 2018 | – | – | |||
| 325 | 20–60 MeV | EAF-2010(r) (n,) | 2010 | – | – | |||
| 7 | 7Li(n,X)3H | Li7H3 | 328 | 0–20 MeV | MT33–ENDF/B-VIII.0 (n,n’) | 2018 | – | – |
| 328 | 20–60 MeV | EAF-2010(r) (n,n) | 2010 | – | – | |||
| 8 | B(n,X)3H | BH3 | 500 | 0–60 MeV | IRDFF-II B10H3,B11H3 | 2019 | – | – |
| 9 | B(n,X)4He | BHe4 | 500 | 0–60 MeV | IRDFF-II B10He4,B11He4 | 2019 | – | – |
| 10 | 10B(n,)7Li | B10a | 525 | 0–1 MeV | MT107–IAEA STD 2017 Car18 | 2018 | new | new |
| 525 | 1–60 MeV | EAF-2010(r) (n,) | 2010 | new | new | |||
| 11 | 10B(n,X)4He | B10He4 | 525 | 0–20 MeV | MT22–ENDF/B-VIII.0 (n,n’) | 2018 | – | – |
| 525 | 20–60 MeV | EAF-2010(r) (n,) | 2010 | – | – | |||
| 525 | 0–20 MeV | MT35–ENDF/B-VIII.0 (n,n’) | 2018 | – | – | |||
| 525 | 20–60 MeV | EAF-2010(r) (n,d2) | 2010 | – | – | |||
| 525 | 0–20 MeV | MT106–EAF-2010 (n,3He) | 2010 | – | – | |||
| 525 | 0–60 MeV | IRDFF-II B10a | 2019 | – | – | |||
| 12 | 10B(n,X)3H | B10H3 | 525 | 0–20 MeV | MT113–ENDF/B-VIII.0 MT700 | 2018 | – | – |
| 525 | 20–60 MeV | EAF-2010(r) (n,t) | 2010 | – | – | |||
| 525 | -60 MeV | MT155–EAF-2010 (n,t) | 2010 | – | – | |||
| 13 | 11B(n,X)3H | B11H3 | 528 | 0–20 MeV | MT105–ENDF/B-VIII.0 | 2018 | – | – |
| 528 | 20–60 MeV | EAF-2010(r) (n,t) | 2010 | – | – | |||
| 528 | 0–60 MeV | MT33–EAF-2010 (n,nt) | 2010 | – | – | |||
| 14 | 11B(n,X)4He | B11He4 | 528 | 0–60 MeV | MT11–EAF-2010 (n,2nd) | 2010 | – | – |
| 528 | 0–20 MeV | MT22–ENDF/B-VIII.0(r) (n,n) | 2018 | – | – | |||
| 528 | 20–60 MeV | EAF-2010(r) (n,n) | 2010 | – | – | |||
| 528 | 0–60 MeV | MT24–EAF-2010 | 2010 | – | – | |||
| 528 | 0–60 MeV | MT33–EAF-2010 (n,nt) | 2010 | – | – | |||
| 528 | 0–20 MeV | MT107–ENDF/B-VIII.0 (n,) | 2018 | – | – | |||
| 528 | 20–60 MeV | EAF-2010(r) (n,) | 2010 | – | – | |||
| 528 | 0–60 MeV | MT117–EAF-2010 (n,d) | 2010 | – | – | |||
| 15 | 19F(n,2n)18F | F192 | 925 | -30 MeV | RRDF-2002 | 2002 | old | old |
| 30-60 MeV | TENDL-2010(r) | 2010 | – | old | ||||
| 16 | 23Na(n,2n)22Na | Na232 | 1125 | -60 MeV | INDC(NDS)-0705 | 2017 | old | new |
| 17 | 23Na(n,)24Na | Na23g | 1125 | 0-20 MeV | INDC(NDS)-0705 | 2017 | – | new |
| 20-60 MeV | TENDL-2010(r) | 2012 | – | new | ||||
| 18 | Mg(n,X)24Na | MgNa24 | 1200 | Up to 60 MeV | IRDFF-II Mg24p | 2019 | – | – |
| Minor channels | TENDL-2015(r) | 2019 | – | – | ||||
| 19 | 24Mg(n,p)24Na | Mg24p | 1225 | -21 MeV | INDC(NDS)-0526 | 2008 | new | old |
| 21-60 MeV | TENDL-2010(r) | – | old | |||||
| 20 | 27Al(n,p)27Mg | Al27p | 1325 | -22 MeV | INDC(CCP)-0438 | 2004 | new | old |
| 22-60 MeV | TENDL-2010(r) | – | old | |||||
| 21 | 27Al(n,)24Na | Al27a | 1325 | -30 MeV | INDC(NDS)-0546 | 2009 | old | old |
| 30-60 MeV | TENDL-2010(r) | – | old | |||||
| 22 | 27Al(n,X)24Na | Al27Na24 | 1325 | Up to 60 MeV | IRDFF-II Al27a | 2019 | – | – |
| Minor channels | TENDL-2015 | – | – | |||||
| 23 | 27Al(n,2n)26gAl | Al272g | 1325 | -60 MeV | INDC(NDS)-0705 | 2017 | – | – |
| 24 | 28Si(n,p)28Al | Si28p | 1425 | -21 MeV | INDC(NDS)-0668 | 2014 | – | new |
| 21–60 MeV | TENDL-2015(r) | – | old | |||||
| 25 | 29Si(n,X)28Al | Si29Al28 | 1428 | -60 MeV | IRDFF-II Si29p | 2019 | – | – |
| Minor channels | TENDL-2015(r) | – | – | |||||
| 26 | Si(n,X)28Al | SiAl28 | 1400 | -60 MeV | IRDFF-II Si-28,29 | 2019 | – | – |
| 27 | 31P(n,p)31Si | P31p | 1525 | -21 MeV | INDC(NDS)-0668 | 2014 | new | old |
| 21–60 MeV | TENDL-2015(r) | – | old | |||||
| 28 | S(n,X)32P | SP32 | 1600 | -60 MeV | IRDFF-II S32p | 2019 | – | – |
| 29 | 32S(n,p)32P | S32p | 1625 | -21 MeV | INDC(NDS)-0526 | 2008 | new | old |
| TENDL-2013(r) | – | old | ||||||
| 30 | 45Sc(n,)46Sc | Sc45g | 2125 | -21 MeV | IRDF-2002 | 1991 | old | old |
| 21–60 MeV | TENDL-2010(r) | – | old | |||||
| 31 | 46Ti(n,2n)45Ti | Ti462 | 2225 | -20 MeV | INDC(CCP)-0360 | 1993 | old | old |
| 20–60 MeV | TENDL-2010(r) | – | old | |||||
| 32 | 46Ti(n,p)46Sc | Ti46p | 2225 | -20 MeV | IRDF-2002 | 2005 | old | old |
| 20–60 MeV | TENDL-2010(r) | – | old | |||||
| 33 | 47Ti(n,p)47Sc | Ti47p | 2228 | -20 MeV | RRDF-2002 | 2002 | new | old |
| 20-60 MeV | TENDL-2011(r) | – | old | |||||
| 34 | 48Ti(n,p)48Sc | Ti48p | 2231 | -20 MeV | IRDF-2002 | 2005 | old | old |
| 20–60 MeV | TENDL-2010(r) | – | old | |||||
| 35 | Ti(n,X)45Ti | TiTi45 | 2200 | -60 MeV | IRDFF-II Ti462 | 2019 | – | – |
| Minor channels | TENDL-2015 | – | – | |||||
| 36 | Ti(n,X)46Sc | TiSc46 | 2200 | -60 MeV | IRDFF-II Ti46p | 2019 | – | – |
| Minor channels | TENDL-2015 | – | – | |||||
| 37 | Ti(n,X)47Sc | TiSc47 | 2200 | -60 MeV | IRDFF-II Ti47p | 2019 | – | – |
| Minor channels | TENDL-2015 | – | – | |||||
| 38 | Ti(n,X)48Sc | TiSc48 | 2200 | -60 MeV | IRDFF-II Ti48p | 2019 | – | – |
| Minor channels | TENDL-2015 | – | – | |||||
| 39 | 51V(n,)48Sc | V51a | 2328 | -20 MeV | IRDF-2002 | 2005 | old | old |
| 20–60 MeV | TENDL-2010(r) | – | old | |||||
| 40 | 51V(n,X)48Sc | V51Sc48 | 2328 | -60 MeV | IRDFF-II V51a | 2019 | – | – |
| Minor channels | TENDL-2015 | – | – | |||||
| 41 | Cr(n,X)51Cr | CrCr51 | 2400 | -60 MeV | IRDFF-II | 2019 | – | – |
| Minor channels | TENDL-2015 | – | – | |||||
| 42 | 55Mn(n,2n)54Mn | Mn552 | 2525 | -60 MeV | K.I.Zolotarev | 2019 | new | new |
| 43 | 55Mn(n,)56Mn | Mn55g | 2525 | -60 MeV | ENDF/B-VII.1 Trkov:2011 ; ENDFB71 | 2011 | new | old |
| 44 | Fe(n,X)51Cr | FeCr51 | 2600 | Up to 60 MeV | IRDFF-II Fe54a | 2019 | – | – |
| Minor channels | TENDL-2015 | – | – | |||||
| 45 | Fe(n,X)54Mn | FeMn54 | 2600 | Up to 60 MeV | IRDFF-II Fe54p | 2019 | – | – |
| Minor channels | TENDL-2015 | – | – | |||||
| 46 | Fe(n,X)56Mn | FeMn56 | 2600 | Up to 60 MeV | IRDFF-II Fe56p | 2019 | – | – |
| Minor channels | TENDL-2015 | – | – | |||||
| 47 | Fe(n,X)53Fe | FeFe53 | 2600 | Up to 60 MeV | IRDFF-II Fe542 | 2019 | – | – |
| Minor channels | TENDL-2015 | – | – | |||||
| 48 | 54Fe(n,2n)53Fe | Fe542 | 2625 | -20 MeV | INDC(CCP)-0360 | 1993 | old | old |
| 20-60 MeV | TENDL-2010(r) | – | old | |||||
| 49 | 54Fe(n,p)54Mn | Fe54p | 2625 | -20 MeV | INDC(NDS)-0657 | 2013 | new | old |
| 20-60 MeV | TENDL-2013(r) | – | old | |||||
| 50 | 54Fe(n,)51Cr | Fe54a | 2625 | -20 MeV | IRDFF-2002 | 2005 | old | old |
| 20–60 MeV | TENDL-2013(r) | – | old | |||||
| 51 | 56Fe(n,p)56Mn | Fe56p | 2631 | -20 MeV | INDC(CCP)-0438 | 2004 | old | old |
| 20–60 MeV | TENDL-2011(r) | – | old | |||||
| 52 | 58Fe(n,)59Fe | Fe58g | 2637 | -20 MeV | JEFF-3.1 JEFF31 | 2011 | new | old |
| 20–60 MeV | TENDL-2011(r) | – | old | |||||
| 53 | 59Co(n,2n)58Co | Co592 | 2725 | -20 MeV | INDC(NDS)-0546 | 2009 | new | old |
| 20-60 MeV | TENDL-2010(r) | – | old | |||||
| 54 | 59Co(n,3n)57Co | Co593 | 2725 | -20 MeV | INDC(NDS)-0584 | 2010 | – | new |
| 20–60 MeV | TENDL-2010(r) | – | new | |||||
| 55 | 59Co(n,)60Co | Co59g | 2725 | -20 MeV | IRDF-2002 | 2005 | old | old |
| 20–60 MeV | TENDL-2010(r) | – | old | |||||
| 56 | 59Co(n,p)59Fe | Co59p | 2725 | -20 MeV | INDC(NDS)-0546 | 2009 | new | old |
| 20-60 MeV | TENDL-2010(r) | – | old | |||||
| 57 | 59Co(n,)56Mn | Co59a | 2725 | -20 MeV | IRDF-2002 | 2005 | old | old |
| 20–60 MeV | TENDL-2010(r) | – | old | |||||
| 58 | 59Co(n,X)56Mn | Co59Mn56 | 2725 | Up to 60 MeV | IRDFF-II Fe542 | 2019 | – | – |
| Minor channels | TENDL-2015 | – | – | |||||
| 59 | Ni(n,X)57Ni | NiNi57 | 2800 | Up to 60 MeV | IRDFF-II Ni582 | 2019 | – | – |
| Minor channels | TENDL-2015 | – | – | |||||
| 60 | Ni(n,X)58Co | NiCo58 | 2800 | Up to 60 MeV | IRDFF-II Ni58p | 2019 | – | – |
| Minor channels | TENDL-2015 | – | – | |||||
| 61 | Ni(n,X)60Co | NiCo60 | 2800 | Up to 60 MeV | IRDFF-II Ni60p | 2019 | – | – |
| Minor channels | TENDL-2015 | – | – | |||||
| 62 | 58Ni(n,2n)57Ni | Ni582 | 2825 | -20 MeV | INDC(NDS)-0657 | 2013 | new | old |
| 20–60 MeV | TENDL-2013(r) | – | old | |||||
| 63 | 58Ni(n,p)58Co | Ni58p | 2825 | 0–20 MeV | K.I.Zolotarev (RRDF-2002) | 2002 | old | old |
| 20–60 MeV | TENDL-2013(r) | – | old | |||||
| 64 | 60Ni(n,p)60Co | Ni60p | 2831 | -21 MeV | INDC(NDS)-0526 | 2007 | new | old |
| 21–60 MeV | TENDL-2011(r) | – | old | |||||
| 65 | Cu(n,X)60Co | CuCo60 | 2900 | Up to 60 MeV | IRDFF-II Cu63a | 2019 | – | – |
| Minor channels | TENDL-2015 | – | – | |||||
| 66 | Cu(n,X)62Cu | CuCu62 | 2900 | Up to 60 MeV | IRDFF-II Cu632 | 2019 | – | – |
| Minor channels | TENDL-2015 | – | – | |||||
| 67 | Cu(n,X)64Cu | CuCu64 | 2900 | Up to 60 MeV | IRDFF-II Cu63g | 2019 | – | – |
| Minor channels | TENDL-2015 | – | – | |||||
| 68 | 63Cu(n,2n)62Cu | Cu632 | 2925 | -20 MeV | INDC(NDS)-0526 | 2007 | new | old |
| 20–60 MeV | TENDL-2011(r) | – | old | |||||
| 69 | 63Cu(n,)64Cu | Cu63g | 2925 | -20 MeV | IRDF-2002 | 2005 | old | old |
| 20–60 MeV | TENDL-2011(r) | – | old | |||||
| 70 | 63Cu(n,)60Co | Cu63a | 2925 | -20 MeV | IRDF-2002 | 2005 | old | old |
| 20–60 MeV | TENDL-2011(r) | – | old | |||||
| 71 | 65Cu(n,2n)64Cu | Cu652 | 2931 | -20 MeV | INDC(NDS)-0526 | 2007 | new | old |
| 20–60 MeV | TENDL-2011(r) | – | old | |||||
| 72 | Zn(n,X)64Cu | ZnCu64 | 3000 | Up to 60 MeV | IRDFF-II Zn64p | 2019 | – | new |
| Minor channels | TENDL-2015 | – | new | |||||
| 73 | Zn(n,X)67Cu | ZnCu67 | 3000 | Up to 60 MeV | IRDFF-II Zn67p | 2019 | – | new |
| Minor channels | TENDL-2015 | – | new | |||||
| 74 | 64Zn(n,p)64Cu | Zn64p | 3025 | 0–20 MeV | INDC(NDS)-0526 | 2008 | new | old |
| 20–60 MeV | TENDL-2011(r) | new | old | |||||
| 75 | 67Zn(n,p)67Cu | Zn67p | 3034 | -20 MeV | INDC(NDS)-0526 | 2008 | new | old |
| 20–60 MeV | TENDL-2011(r) | new | old | |||||
| 76 | 68Zn(n,X)67Cu | Zn68Cu67 | 3034 | -60 MeV | INDC(NDS)-0796 | 2018 | – | new |
| 77 | 75As(n,2n)74As | As752 | 3325 | -20 MeV | IRDF-2002 | 2005 | old | old |
| 20–60 MeV | TENDL-2011(r) | – | old | |||||
| 78 | 89Y(n,2n)88Y | Y892 | 3925 | -40 MeV | INDC(NDS)-0584 | 2010 | new | old |
| 40–60 MeV | TENDL-2010(r) | new | old | |||||
| 79 | Zr(n,X)89Zr | ZrZr89 | 4000 | Up to 60 MeV | IRDFF-II Zr902 | 2019 | – | new |
| Minor channels | TENDL-2015 | – | new | |||||
| 80 | 90Zr(n,2n)89Zr | Zr902 | 4025 | -20 MeV | INDC(NDS)-0546 | 2009 | new | old |
| 20–60 MeV | TENDL-2010(r) | new | old | |||||
| 81 | 93Nb(n,2n)92mNb | Nb932m | 4125 | -40 MeV | INDC(NDS)-0584 | 2010 | new | old |
| 40–60 MeV | TENDL-2010(r) | new | old | |||||
| 82 | 93Nb(n,n’)93mNb | Nb93nm | 4125 | -20 MeV | IRDF-2002 | 2005 | old | old |
| 20–60 MeV | TENDL-2010(r) | – | old | |||||
| 83 | 93Nb(n,)94Nb | Nb93g | 4125 | -20 MeV | INDC(NDS)-0657 | 2013 | new | old |
| 20–60 MeV | TENDL-2013(r) | – | old | |||||
| 84 | 93Nb(n,)94mNb | Nb93gm | 4125 | -20 MeV | INDC(NDS)-0657 | 2013 | new | old |
| 20–60 MeV | TENDL-2013(r) | – | old | |||||
| 85 | Mo(n,X)92mNb | MoNb92m | 4200 | Up to 60 MeV | IRDFF-II Zr902 | 2019 | – | new |
| Minor channels | TENDL-2015 | – | new | |||||
| 86 | 92Mo(n,p)92mNb | Mo92pm | 4225 | -40 MeV | INDC(NDS)-0657 | 2013 | new | old |
| 20–60 MeV | TENDL-2010(r) | – | old | |||||
| 87 | 103Rh(n,n’)103mRh | Rh103nm | 4525 | -20 MeV | IRDF-2002 | 2005 | old | old |
| 20–60 MeV | TENDL-2010(r) | – | old | |||||
| 88 | 109Ag(n,)110mAg | Ag109gm | 4731 | 0–60 MeV | JENDL-3.2 | 1994 | – | old |
| 20–60 MeV | TENDL-2010(r) | – | old | |||||
| 89 | In(n,X)114mIn | InIn114m | 4900 | Up to 60 MeV | IRDFF-II In113gm | 2019 | – | new |
| Minor channels | TENDL-2015 | – | new | |||||
| 90 | 113In(n,)114mIn | In113gm | 4925 | 0–20 MeV | INDC(NDS)-0668 | 2015 | – | old |
| 20–60 MeV | TENDL-2015(r) | – | old | |||||
| 91 | 113In(n,n’)113mIn | In113nm | 4925 | -20 MeV | INDC(NDS)-0657 | 2013 | new | old |
| 20–60 MeV | TENDL-2010(r) | – | old | |||||
| 92 | 115In(n,2n)114mIn | In1152m | 4931 | -20 MeV | INDC(NDS)-0526 | 2008 | new | old |
| 20–60 MeV | TENDL-2010(r) | new | old | |||||
| 93 | 115In(n,n’)115mIn | In115nm | 4931 | -20 MeV | IRDF-2002 | 2005 | old | old |
| 20–60 MeV | TENDL-2010(r) | – | old | |||||
| 94 | 115In(n,)116mIn | In115gm | 4931 | 0–20 MeV | INDC(NDS)-0657 | 2013 | new | old |
| 20–60 MeV | TENDL-2010(r) | – | old | |||||
| 95 | 127I(n,2n)126I | I1272 | 5325 | -32 MeV | INDC(NDS)-0526 | 2008 | new | old |
| 32–60 MeV | TENDL-2010(r) | new | old | |||||
| 96 | 139La(n,)140La | La139g | 5728 | 0–20 MeV | INDC(CCP)-0431 | 2002 | old | old |
| 20–60 MeV | TENDL-2010(r) | old | old | |||||
| 97 | 141Pr(n,2n)140Pr | Pr1412 | 5925 | -20 MeV | IRDF-2002 | 2005 | old | old |
| 20–60 MeV | TENDL-2010(r) | – | old | |||||
| 98 | 169Tm(n,2n)168Tm | Tm1692 | 6925 | -40 MeV | INDC(NDS)-0584 | 2010 | new | old |
| 40–60 MeV | TENDL-2013(r) | new | old | |||||
| 99 | 169Tm(n,3n)167Tm | Tm1693 | 6925 | -60 MeV | INDC(NDS)-0657 | 2013 | new | old |
| 100 | 181Ta(n,)182Ta | Ta181g | 7328 | 0–20 MeV | JENDL-3.2 | 1994 | old | old |
| 20–60 MeV | TENDL-2010(r) | – | old | |||||
| 101 | 186W(n,)187W | W186g | 7443 | 0–60 MeV | ENDF/B-VII.1 Trkov:2008 ; ENDFB71 | 2009 | new | old |
| 102 | 197Au(n,2n)196Au | Au1972 | 7925 | -40 MeV | INDC(NDS)-0526 | 2008 | new | old |
| 40–60 MeV | TENDL-2010(r) | new | old | |||||
| 103 | 197Au(n,)198Au | Au197g | 7925 | 0–60 MeV | IAEA STD 2017 Car18 | 2018 | new | new |
| 104 | 199Hg(n,n’)199mHg | Hg199nm | 8034 | -20 MeV | INDC(NDS)-0526 | 2008 | new | old |
| 20–60 MeV | TENDL-2010(r) | new | old | |||||
| 105 | 204Pb(n,n’)204mPb | Pb204nm | 8225 | -20 MeV | INDC(CCP)-0431 | 2002 | new | old |
| 20–60 MeV | TENDL-2011(r) | new | old | |||||
| 106 | 209Bi(n,2n)208Bi | Bi2092 | 8325 | -400MeV | V.G.Pronyaev | 2019 | – | new |
| 107 | 209Bi(n,3n)207Bi | Bi2093 | 8325 | -400MeV | V.G.Pronyaev | 2019 | – | new |
| 108 | 209Bi(n,4n)206Bi | Bi2094 | 8325 | -400MeV | V.G.Pronyaev | 2019 | – | new |
| 109 | 209Bi(n,5n)205Bi | Bi2095 | 8325 | -400MeV | V.G.Pronyaev | 2019 | – | new |
| 110 | 209Bi(n,6n)204Bi | Bi2096 | 8325 | -400MeV | V.G.Pronyaev | 2019 | – | new |
| 111 | 232Th(n,f) | Th232f | 9040 | 0–20 MeV | JENDL-4.0 | 2010 | new | new |
| 20–60 MeV | IAEA CRP CRP-th:2010 ; Trkov:2011 | 2009 | new | old | ||||
| 112 | 232Th(n,)233Th | Th232g | 9040 | 0–60 MeV | IAEA CRP Sirakov:2008 ; CRP-th:2010 ; Trkov:2011 | 2009 | new | old |
| 113 | 235U(n,f) | U235f | 9228 | 0–60 MeV | ENDF/B-VIII.0,CIELO Capote:2018 ; CIELO:2014 ; CIELO:2018 | 2018 | new | new |
| 114 | 238U(n,2n)237U | U2382 | 9237 | -30 MeV | ENDF/B-VIII.0,CIELO Capote:2018 ; CIELO:2014 ; CIELO:2018 | 2018 | new | new |
| 30–60 MeV | TENDL-2015(r) | 2019 | new | old | ||||
| 115 | 238U(n,f) | U238f | 9237 | 0–60 MeV | ENDF/B-VIII.0,CIELO Capote:2018 ; CIELO:2014 ; CIELO:2018 | 2018 | new | new |
| 116 | 238U(n,)239U | U238g | 9237 | 0–60 MeV | ENDF/B-VIII.0,CIELO Capote:2018 ; CIELO:2014 ; CIELO:2018 | 2018 | new | new |
| 117 | 237Np(n,f) | Np237f | 9346 | 0–0.5 MeV | JEFF-3.3 | 2017 | new | new |
| 0.5–20 MeV | IRDFF-v1.05 | 2012 | old | new | ||||
| 20–60 MeV | JENDL-4/HE | 2011 | new | new | ||||
| TENDL-2015(r) covariance | 2019 | new | new | |||||
| 118 | 239Pu(n,f) | Pu239f | 9437 | 0–60 MeV | ENDF/B-VIII.0,CIELO CIELO:2014 ; CIELO:2018 | 2018 | new | new |
| 119 | 241Am(n,f) | Am241f | 9543 | 0–20 MeV | JENDL-3.2 | 1989 | old | old |
| 20–60 MeV | JENDL-4/HE | 2011 | old | new | ||||
| TENDL-2015(r) covariance | 2019 | new | new | |||||
| Cross sections of cover materials: Both , and are tabulated | ||||||||
| 1 | B(n,tot) | Btot | 500 | 0–20 MeV | ENDF/B-VIII.0 | 2018 | old | new |
| 20–60 MeV | TENDL-2010(r) | new | ||||||
| 2 | 10B(n,tot) | B10tot | 525 | 0–20 MeV | ENDF/B-VIII.0 | 2018 | old | new |
| 20–60 MeV | TENDL-2010(r) | new | ||||||
| 3 | Cd(n,tot) | Cdtot | 4800 | 0–20 MeV | JEFF-3.3 | 2018 | old | new |
| 20–60 MeV | TENDL-2010(r) | new | ||||||
| 4 | Gd(n,tot) | Gdtot | 6400 | 0–20 MeV | ENDF/B-VII.1 ENDFB71 | 2011 | old | new |
| 20–60 MeV | TENDL-2010(r) | new | ||||||
| Damage cross sections | ||||||||
| 1 | Si(n,1-MeV) | Si1MeV | 1400 | 0–20 MeV | ASTM E722-14 A722 | 2015 | old | new |
| 2 | Fe(n,X)dpa | FeNRTdpa-A | 2600 | 0–20 MeV | ASTM E693-17 A693 | 2017 | old | new |
| 3 | Fe(n,X)dpa | FeNRTdpa-E | 2600 | 0–60 MeV | JEFF-3.3 | 2017 | old | new |
| 4 | Fe(n,X)dpa | FeNRTdpa-I | 2600 | 0–20 MeV | IRDF-2002 | 2005 | old | old |
| 5 | GaAs(n,1-MeV) | GaAs1MeV-A | — | 0–20 MeV | ASTM E722-14 A722 | 2015 | old | new |
| Decay data fission products (FP) from neutron-induced fission on 232Th, 235,238U, 237Np, and 239Pu targets | ||||||||
| 1 | (n,f)Zr | FPZr95 | — | JEFF-3.3, ENDF/B-VIII.0 | 2018 | old | new | |
| 2 | (n,f)Mo | FPMo99 | — | JEFF-3.3, ENDF/B-VIII.0 | 2018 | old | new | |
| 3 | (n,f)Ru | FPRu103 | — | JEFF-3.3, ENDF/B-VIII.0 | 2018 | old | new | |
| 4 | (n,f)RuRh | FPRu106 | — | JEFF-3.3, ENDF/B-VIII.0 | 2018 | old | new | |
| 5 | (n,f)CsBa | FPCs137 | — | JEFF-3.3, ENDF/B-VIII.0 | 2018 | old | new | |
| 6 | (n,f)BaLa | FPBa140 | — | JEFF-3.3, ENDF/B-VIII.0 | 2018 | old | new | |
| 7 | (n,f)Ce | FPCe144 | — | JEFF-3.3, ENDF/B-VIII.0 | 2018 | old | new | |
| 1 Column (v2002 to v-1.05) marks any change in IRDFF-v1.05 compared to IRDF-2002 as a reference up to 20 MeV. | ||||||||
| 2 Column (v-1.05 to IRDFF-II) marks any change in IRDFF-II compared to IRDFF-v1.05 as a reference. | ||||||||
| Consistency legend: new = new evaluation; old = unchanged; – = not present in reference. | ||||||||
These composite reactions include: Mg(n,X)27Na, Si(n,X)28Al, S(n,X)32P, Ti(n,X)45Ti, Ti(n,X)46Sc, Ti(n,X)47Sc, Ti(n,X)48Sc, Cr(n,X)51Cr, Fe(n,X)53Fe, Fe(n,X)51Cr, Fe(n,X)54Mn, Fe(n,X)56Mn, Ni(n,X)57Ni, Ni(n,X)58Co, Ni(n,X)60Co, Cu(n,X)60Co, Cu(n,X)62Cu, Cu(n,X)64Cu, Zn(n,X)64Cu, Zn(n,X)67Cu, Zr(n,X)89Zr, Mo(n,X)92mNb, and In(n,X)114mIn.
In the new IRDFF-II library the energy range was extended to consistently address incident neutron energies up to 60 MeV, so most of the library cross sections are a composite of separate existing nuclear data evaluations. Columns 5, 6, and 7 of Table LABEL:Table_Long_I provide information on the source of the recommended nuclear data evaluations in the applicable incident neutron energy ranges.
Since clear documentation of the consistency of nuclear data used in an evaluation is important in the use of these data in metrology applications, Column 6 of Table LABEL:Table_Long_I points to supplemental documentation for many of the entries in the IRDFF-II library.
II.2 Reactions on Cover Materials
Activation dosimeters can be used to characterize the neutron spectra through spectrum unfolding McE67 or the least-squares-based spectrum adjustment approaches Sta85 . Frequently they are shielded with cover materials to change the effective threshold energy and to move a dosimeter’s sensitivity from the thermal into the epithermal neutron energy region. Some commonly used approaches to model the effective cover material flux attenuation is to apply exponential attenuation, based on the energy-dependence of the total cross section of the cover material and the thickness of cover used McE67 . Other approaches Gri90 to the cover corrections use a more rigorous treatment based on radiation transport models of the neutron scattering within the cover. In order to support this variety of approaches to the treatment of the cover material, the IRDFF-II library provides the total, elastic and absorption cross sections for commonly used cover materials. Total, elastic, capture (and fission) cross sections are also provided for all monitor materials that exhibit resonance structure so that self-shielding corrections can be made, if needed. Table LABEL:Table_Long_I lists the four cover materials that are addressed within the library.
II.3 Dosimetry Metrics
Various radiation dosimetry metrics are employed in the interpretation of radiation test results that supports various application areas. A dosimetry metric is the result of folding a calculated dosimetry-related energy-dependent response function with the incident neutron energy-dependent fluence. These energy-dependent response functions are treated within the IRDFF-II library in a manner similar to reaction-dependent cross sections. The dosimetry metrics used by the radiation effects community have been demonstrated to provide a correlation between the calculated quantity and a specific damage/failure mode of interest to an application area, i.e., iron embrittlement, that can result in failure of a critical weld in a reactor pressure vessel or gain degradation in a silicon bipolar junction transistor (BJT). Monitor dosimetry measurements used during the radiation testing are frequently combined with knowledge of the neutron spectrum during the irradiation to directly report the radiation dosimetry metrics of interest in the application. Since the IRDFF-II library is intended to support dosimetry applications for the fission and fusion communities, we have elected to include, for reference purposes, the primary radiation dosimetry metrics of interest to this community – but to restrict this inclusion to just those dosimetry metrics that have been endorsed by a national nuclear regulator and/or by an international standards organization. Table LABEL:Table_Long_I lists the five dosimetry metrics, called Damage cross sections, that are included in the IRDFF-II library.
The primary dosimetry metric of interest to the commercial light water reactor (LWR) community is the displacement-per-atom (dpa) in iron. This metric is used to assess the embrittlement of structural materials near the critical structural areas, such as the beltline weld for the pressure vessel wall, where any loss of mechanical strength could result in safety concerns. The neutron energy-dependence of the iron dpa metric is set by the appropriate regulatory body for the nuclear reactor, thus, there are different iron dpa dosimetry metrics used by the community. The IRDFF-II contains the iron dpa damage metric from ASTM E693-17 Standard Practice for Characterizing Neutron Exposures in Iron and Low Alloy Steels in Terms of Displacement Per Atom (DPA) A693 . This damage metric was calculated by looking at the primary Frenkel pair production from each of the four naturally occurring iron isotopes and applying the Norgett-Robinson-Torrens (NRT) damage partition function Nor75 . The IRDFF-II library also contains the JEFF-3.3 library JEFF33 NRT-based iron damage metric and the legacy iron damage metric from the IRDF-2002 library.
In addition to the iron dpa metric, the radiation damage to electronics community has silicon and GaAs displacement damage standards defined in ASTM E722-14 Standard Practice for Characterizing Neutron Fluence Spectra in Terms of an Equivalent Monoenergetic Neutron Fluence for Radiation-Hardness Testing of Electronics A722 . The same E722 silicon response functions are also supported in ASTM E1855-15 Standard Test Method for use of 2N2222A Silicon Bipolar Transistors and Neutron Spectrum Sensors and Displacement Damage Monitors A1855 .
II.4 Nuclear Decay Data
The recommended source of nuclear decay data for the dosimetry community is the series of monographs by the Bureau International des Poids et Mesures (BIPM). This eight volume BIPM-5 Table of Radionuclides represents an international collaboration that captures primary recommended nuclear data for most reactions of interest to the dosimetry community. Updates to the BIPM-5 are coordinated though the Decay Data Evaluation Project (DDEP) DDEP working group led by the Laboratoire National de Metrologie et d’Essais – Laboratoire National Henri Becquerel (LNE-LNHB). The recommended nuclear data are periodically updated in separate volumes of the BIPM-5 and the ongoing recommended values are kept up to date at the DDEP website. Not all nuclides are addressed within the DDEP library. For nuclides that are not present, the recommended values are taken from the ENSDF “ADOPTED” dataset ENSDF 222ENSDF nuclear structure and decay data can be easily extracted, understood and studied in an attractive user-friendly manner by means of LiveChart of Nuclides Livechart and NuDat NUDAT .. While the DDEP/BIPM-5 represents an international consensus on the current recommended decay data to be used for metrology applications, it is critical in dosimetry applications that all nuclear data used in a given application be consistent. This means that it is critical that the nuclear decay data be consistent with the associated cross section data. An evaluator of nuclear reaction cross section data would normally use values that correspond to the BIPM-5 data at the time of the evaluation – but these values may not necessarily correspond to the BIPM-5 recommended values seen by a reader at a later time when the cross sections are being used in a metrology application. There are also cases where the evaluator, after consulting with members of the DDEP community, elected to weigh underlying measurements for the DDEP evaluation in a different way and ended up with slightly different decay data. Thus, in order to assist the users of the IRDFF-II cross sections, the corresponding nuclear decay data that are consistent with the recommended cross sections are also documented within the IRDFF-II library files. Details are given in Sec. IV.3.
II.5 Atomic Mass Data
Metrology applications also require data on the elemental and isotopic mass used for the target materials. The most common metrological application for these data is the determination of the number of target atoms in an activation foil of a given mass.
II.5.1 Elemental
The recommended elemental atomic weights are taken from the International Union of Pure and Applied Chemistry (IUPAC) Commission on Isotopic Abundances and Atomic Weights (CIAAW) CIAAW . These data represents revisions made by the CIAAW in 2017 and published in the Pure and Applied Chemistry.
II.5.2 Isotopic
The recommended atomic weights for individual isotopes are taken from the recommendations of the Atomic Mass Data Center and are represented by the Atomic Mass evaluation 2016 (AME2016) AME2016 . It is noted that geological materials are known for which the element has an isotopic composition that is outside the uncertainties cited here for normal materials. We should also note that many dosimetry applications may use enriched or depleted materials that are the result of isotopic separation techniques, in which case the user has to resort to the isotopic data that are provided.
II.6 Natural Abundance Data
The natural isotopic abundance data are also required in order to convert the densities of target materials into the number densities of the constituting isotopes. The recommended natural abundance data come from the CIAAW recommendations that refer to the 2016 IUPAC Technical Report Abn16 . These values represent the best measurement of isotopic abundances from a single terrestrial source.
II.7 Fission Product Yields
Since many important dosimetry metrics are for fission reactions, it is also important the fission yields used to support the dosimetry measurements be clearly documented. Thus, the recommended nuclear data contained in the IRDFF-II library include the cumulative fission yields for all the relevant fission products used for metrology applications which are listed in Tables 2, 3, and 4 in the three generic incident energy regions.
| Target | Reaction | Cumulative |
| Product | Yield | |
| 235U | 95Zr | 6.5042E-02 1.00 % |
| 99Mo | 6.1399E-02 1.30 % | |
| 103Ru | 3.1118E-02 2.10 % | |
| 106Ru | 4.0958E-03 2.30 % | |
| 137Cs | 6.0897E-02 1.04 % | |
| 140Ba | 6.3444E-02 1.00 % | |
| 144Ce | 5.4781E-02 0.90 % | |
| 237Np | 95Zr | 5.9364E-02 11.80 % |
| 99Mo | 6.6813E-02 6.80 % | |
| 103Ru | 5.8640E-02 7.30 % | |
| 106Ru | 1.5421E-02 19.40 % | |
| 137Cs | 7.0334E-02 11.71 % | |
| 140Ba | 5.8591E-02 9.90 % | |
| 144Ce | 4.2716E-02 12.76 % | |
| 239Pu | 95Zr | 4.8805E-02 1.10 % |
| 99Mo | 6.1410E-02 0.70 % | |
| 103Ru | 6.8709E-02 1.20 % | |
| 106Ru | 4.3404E-02 2.30 % | |
| 137Cs | 6.5796E-02 1.22 % | |
| 140Ba | 5.2880E-02 1.10 % | |
| 144Ce | 3.7623E-02 0.90 % | |
| 241Am | 95Zr | 3.9643E-02 3.00 % |
| 99Mo | 6.5724E-02 3.20 % | |
| 103Ru | 7.1423E-02 6.10 % | |
| 106Ru | 5.0867E-02 16.60 % | |
| 137Cs | 7.2069E-02 6.60 % | |
| 140Ba | 5.8045E-02 2.50 % | |
| 144Ce | 3.3905E-02 3.70 % |
| Target | Reaction | Cumulative |
| Product | Yield | |
| 232Th | 95Zr | 5.4494E-02 2.90 % |
| 99Mo | 2.8740E-02 2.80 % | |
| 103Ru | 1.5179E-03 6.30 % | |
| 106Ru | 5.3236E-04 5.70 % | |
| 137Cs | 6.1790E-02 5.12 % | |
| 140Ba | 7.6222E-02 3.19 % | |
| 144Ce | 7.6334E-02 6.12 % | |
| 235U | 95Zr | 6.4589E-02 1.30 % |
| 99Mo | 5.8957E-02 1.90 % | |
| 103Ru | 3.2809E-02 1.40 % | |
| 106Ru | 4.6597E-03 7.60 % | |
| 137Cs | 5.8572E-02 1.92 % | |
| 140Ba | 6.0586E-02 1.10 % | |
| 144Ce | 5.1578E-02 1.80 % | |
| 238U | 95Zr | 5.2506E-02 1.60 % |
| 99Mo | 6.2147E-02 1.60 % | |
| 103Ru | 6.0331E-02 1.80 % | |
| 106Ru | 2.5063E-02 5.30 % | |
| 137Cs | 6.0045E-02 2.33 % | |
| 140Ba | 6.0457E-02 1.29 % | |
| 144Ce | 4.6916E-02 2.25 % | |
| 237Np | 95Zr | 5.6715E-02 2.70 % |
| 99Mo | 7.7238E-02 16.90 % | |
| 103Ru | 5.3778E-02 11.20 % | |
| 106Ru | 2.2333E-02 10.80 % | |
| 137Cs | 6.2129E-02 3.62 % | |
| 140Ba | 5.7593E-02 2.00 % | |
| 144Ce | 4.1743E-02 4.79 % | |
| 239Pu | 95Zr | 4.6909E-02 2.50 % |
| 99Mo | 5.8366E-02 2.30 % | |
| 103Ru | 6.5709E-02 2.50 % | |
| 106Ru | 4.0375E-02 7.80 % | |
| 137Cs | 6.3098E-02 2.21 % | |
| 140Ba | 5.2916E-02 1.50 % | |
| 144Ce | 3.4994E-02 1.70 % | |
| 241Am | 95Zr | 4.1632E-02 8.20 % |
| 99Mo | 5.3596E-02 5.50 % | |
| 103Ru | 6.5234E-02 6.70 % | |
| 106Ru | 4.8254E-02 6.90 % | |
| 137Cs | 6.2281E-02 18.80 % | |
| 140Ba | 4.8853E-02 4.50 % | |
| 144Ce | 3.4353E-02 6.80 % |
For the measurements of time-integrated fluence rates with fission products up to periods of about six weeks, the most common measured fission product used for fission research reactor dosimetry applications is 140Ba (half-life of 12.7527 days). In order to avoid isotopic separation techniques, the 140Ba activity is often determined by directly counting its daughter product, 140La (half-life of 1.6781 days). The independent fission yields are required to treat the transient equilibrium between the 140La and 140Ba.
Other fission products are commonly used to support reactor irradiations of different periods A704 . The isotope 95Zr (half-life 64.032 days) is commonly used for shorter irradiation durations, up to 6 months while 103Ru (half-life of 39.247 days) is used for irradiations up to 4 months. The isotope 144Ce (half-life 284.91 days) is also a commonly measured fission product in reactor applications and can be used for irradiations periods of 2 to 3 years. The isotope 137Cs (half-life of 30.08 years) is used to support reactor irradiations of 30 to 40 years. The 137Cs activity is often measured by counting the activity in its 137mBa decay product A1005 (half-life of 2.552 minutes). The 106Ru fission product (half-life 371.8 days) is also often counted A1005 . The transient equilibrium of its 106Rh decay product (half-life of 30.07 seconds) with the 106Rh independent yield can be ignored for most applications.
In summary, the relevant fission products currently addressed in dosimetry-related standards applications include the nine isotopes: 95Zr, 99Mo, 103Ru, 106Ru, 137Cs, 137mBa, 140Ba, 140La, and 144Ce, but cumulative fission yields are needed only for seven of them.
| Reaction | Reaction | Cumulative |
| Label | Product | Yield |
| 232Th | 95Zr | 5.0470E-02 13.60 % |
| 99Mo | 1.9747E-02 5.30 % | |
| 103Ru | 8.9252E-03 7.20 % | |
| 106Ru | 1.0873E-02 10.40 % | |
| 137Cs | 6.0482E-02 8.81 % | |
| 140Ba | 5.7087E-02 4.00 % | |
| 144Ce | 4.2355E-02 8.66 % | |
| 235U | 95Zr | 5.0620E-02 4.30 % |
| 99Mo | 5.0301E-02 2.80 % | |
| 103Ru | 3.1210E-02 4.40 % | |
| 106Ru | 1.8000E-02 16.80 % | |
| 137Cs | 5.7013E-02 24.00 % | |
| 140Ba | 4.4929E-02 1.90 % | |
| 144Ce | 3.1575E-02 1.30 % | |
| 238U | 95Zr | 4.6389E-02 1.22 % |
| 99Mo | 5.7713E-02 0.80 % | |
| 103Ru | 4.4881E-02 2.30 % | |
| 106Ru | 2.4945E-02 5.30 % | |
| 137Cs | 5.4359E-02 8.21 % | |
| 140Ba | 4.6437E-02 0.70 % | |
| 144Ce | 3.6147E-02 3.57 % | |
| 237Np | 95Zr | 5.5453E-02 16.00 % |
| 99Mo | 4.8632E-02 11.00 % | |
| 103Ru | 4.3312E-02 16.00 % | |
| 106Ru | 2.9975E-02 23.00 % | |
| 137Cs | 5.1076E-02 23.00 % | |
| 140Ba | 4.8131E-02 11.00 % | |
| 144Ce | 2.9997E-02 16.00 % | |
| 239Pu | 95Zr | 4.3837E-02 6.00 % |
| 99Mo | 5.6556E-02 5.00 % | |
| 103Ru | 5.8641E-02 6.00 % | |
| 106Ru | 3.5345E-02 8.00 % | |
| 137Cs | 5.0107E-02 8.00 % | |
| 140Ba | 4.0556E-02 5.00 % | |
| 144Ce | 2.9598E-02 5.00 % | |
| 241Am | 95Zr | 3.1194E-02 6.00 % |
| 99Mo | 4.3358E-02 6.00 % | |
| 103Ru | 5.0404E-02 6.00 % | |
| 106Ru | 4.0805E-02 6.00 % | |
| 137Cs | 4.2719E-02 6.00 % | |
| 140Ba | 3.3620E-02 6.00 % | |
| 144Ce | 2.4968E-02 6.00 % |
The cumulative yields are used because they are generally known with a higher precision than the independent yields. However, care must be taken to ensure that the cumulative yields reach equilibrium. The typical cooling times that are necessary are listed below: 95Zr The longest lived member of the chain is 95Y at 10.3 minutes. All the others are less than 1 minute. If we wait for 6 half-lives that would be 1 hour. 99Mo Longest half-life has 99mNb at 2.6 m, requiring cooling time of about 15 minutes. 103Ru - 103Tc Half-life 54 s, 103Mo half life 1.13 m, requiring cooling time of about 13 minutes. 106Ru - 106Tc Half-life 36 s, requiring cooling time of about 3.6 minutes. 137Cs - 137Xe Half-life 3.82 m, requiring cooling time of about 23 minutes. 140Ba - 140Cs Half-life 1.06 m, requiring cooling time of about 6 minutes. 144Ce - 144La Half-life 40.7 s, requiring cooling time of about 4.1 minutes. It should also be noted that several radionuclides of these chains have Kr or Xe precursors. This means that part or all of the chain yield can be lost as Kr or Xe gas unless the fissionable material is irradiated in a gas tight container. This is a very well-known effect and actinides are commonly sealed in quartz to avoid losing any Kr or Xe, which would lead to a low reading of the cumulative fission product.
Some activities, such as nonproliferation monitoring NASn ; HDBK , have a wider range of application-specific fission yield products that are monitored. This application area has independently standardized the underlying fission products yields to be used, hence this application area is not addressed by these IRDFF-II fission-yield recommended values.
Work continues in refining the recommended yields and the treatment of their dependence on the energy of the incident neutron. There is an ongoing international collaboration, sponsored through an IAEA coordinated research project (CRP) (project number F42007 approved 19 December 2018), to provide recommended fission yields and to address recommended approaches for handling the energy-dependence of the fission yields. The results of this CRP will not be ready in time for inclusion in the present release of IRDFF-II.
For present dosimetry applications, pending more investigation and validation of the energy-dependent modeling, the recommendation is to map the application need into one of the three generic energy regions supported by the commonly available nuclear data libraries: thermal, fast, and 14 MeV. The thermal energy generally equates to evaluated data for 0.0253 eV incident neutrons. The fast energy equates to evaluated data gathered using a range of broad-spectrum fast fission spectra. Within the commonly available tabulated nuclear data files, the fast region is characterized with a reference energy of 500 keV in the ENDF/B-VIII.0 library and with an energy of 400 keV in the JEFF-3.3 library. The 14 MeV energy equates to evaluated data validated using data gathered from DT fusion neutron sources.
Pending results from ongoing international collaboration on updating the fission product yields, the IRDFF-II library has adopted a set of recommended fission yields. These recommended fission yields are taken from the JEFF-3.3 library, if available. Alternatively, e.g., in the case of the 14 MeV fission yields for 237Np, 239Pu and 241Am, the recommended yields are taken from the ENDF/B-VIII.0 library.
II.8 Neutron Benchmark Fields
As part of the library evaluation and acceptance process for reactions accepted for inclusion within the IRDFF-II library, data validation was addressed using experimental measurements in integral neutron benchmark fields. Such measurements are independent of the differential data (measured as a function of incident energy), used by the evaluators in conjunction with nuclear data models to generate the recommended nuclear reaction cross section data files. Since these neutron benchmark fields are tied to the validation evidence for the IRDFF-II library, the decision was made to include the neutron spectral characterizations for these integral benchmark fields as part of the IRDFF-II package. Table 5 summarizes the 45 neutron fields that were considered in the IRDFF-II validation and provides brief descriptions of the selected 29 neutron benchmark fields. These benchmark fields are addressed in further detail in Secs. VII and VIII on sensitivity, data validation and data consistency in this paper. The IRDFF-II library provides recommended spectra for these neutron fields as well as for several other spectra not selected as benchmarks, but useful in making data comparisons, e.g., a constant spectrum, a linear spectrum, and a 1/ spectrum in the region 0.5 eV 20 MeV. Maxwellian spectra corresponding to different temperatures are also included that cover a range of temperatures (in the laboratory coordinate system) from 25 keV to 60 keV, which are of interest for astrophysics. The spectra are part of the IRDFF-II distribution. Note that the spectra calculated with detailed computational models of the experiments by the Monte Carlo technique (e.g., reactor spectra) are used as prior spectra in the least-squares fit. The uncertainty in the prior spectrum, in addition to being a subjective evaluation at this time, includes large uncertainty contributors which make direct comparison with measured data very difficult due to the large associated uncertainties. The total uncertainty of the calculated prior obviously includes the statistical uncertainty of the calculations, which usually is less than 10 %, except in the tails, where the spectrum approaches zero. The full spectrum covariance matrices from computational models being subjective and not available for all cases, the covariances in IRDFF-II only include the statistical component for cross-checking the uncertainties in the calculated reaction rates of monitor reactions with median energies close to the tails of the spectrum.
| No. | Name | MAT | Description | |
| Measured by Time-of-Flight neutron fields including the 252Cf(sf) standard | ||||
| 1 | 252Cf(sf) | 9861 | 2.121 | Spontaneous fission neutron spectrum from 252Cf |
| 2 | 235U PFNS | 9228 | 2.000 | Thermal-neutron induced prompt fission spectrum from 235U |
| 3 | 9Be(d,n) 16MeV | 9408 | 5.608 | Spectrum of neutrons from 16 MeV deuterons incident on a beryllium target |
| 4 | 9Be(d,n) 40MeV | 9409 | 15.58 | Spectrum of neutrons from 40 MeV deuterons incident on a beryllium target |
| Measured by Time-of-Flight neutron fields not accepted as benchmark fields | ||||
| 1 | 233U PFNS | 9222 | 2.030 | Thermal-neutron induced prompt fission spectrum from 233U |
| 2 | 239Pu PFNS | 9437 | 2.073 | Thermal-neutron induced prompt fission spectrum from 239Pu |
| Neutron benchmark fields from detailed computational models | ||||
| 1 | ACRR-FF-32 | 9010 | 0.575 | ACRR-FF-32 Reactor Extended Cavity Spectrum 640-group |
| 2 | ACRR-CdPoly | 9011 | 0.657 | ACRR-CdPoly Reactor Bucket Spectrum 640-group |
| 3 | ACRR-PLG | 9012 | 0.439 | ACRR-PLG Reactor Bucket Spectrum 640-group |
| 4 | ACRR-LB44 | 9013 | 0.715 | ACRR-LB44 Reactor Bucket Spectrum 640-group |
| 5 | FREC-II | 9015 | 0.545 | FREC-II Spectrum (external cavity attached to ACRR) 640-group |
| 6 | SPR-III | 9014 | 1.251 | SPR-III Reactor Central Cavity Spectrum 640-group |
| 7 | Mol BR1 Mark-III | 9020 | 1.864 | Mol BR1 Mark-III, 235U converter in Cd and Graphite cavity, 640-groups |
| 8 | LR0-Rez | 9032 | 0.646 | Rez-LR0 Reactor spectrum, 640-group |
| 9 | TRIGA-JSI | 9041 | 0.389 | TRIGA Mark-II Pneumatic tube (bare), 640-group |
| 10 | TRIGA-JSI/BN | 9042 | 0.848 | TRIGA Mark-II boron nitride cover, 640-group |
| 11 | TRIGA-JSI/B4C | 9043 | 0.923 | TRIGA Mark-II boron carbide cover, 640-group |
| 12 | TRIGA-JSI/10B4C | 9044 | 1.090 | TRIGA Mark-II enriched boron carbide cover, 640-group |
| 13 | ISNF | 9004 | 1.058 | ISNF Reactor Spectrum 725-group |
| 14 | CFRMF | 9005 | 0.741 | CFRMF Reactor Spectrum from IRDF-2002 |
| 15 | Sigma-Sigma | 9007 | 0.763 | Sigma-Sigma facility in natU and BC spheres inside Graphite column, 725g |
| 16 | HMF001 | 9101 | 1.433 | Godiva, central region, 725-group |
| 17 | HMF028 | 9102 | 1.343 | Flattop-25, central region, 725-group |
| 18 | IMF007 | 9103 | 0.570 | Big-Ten 725-group |
| 19 | FMR001 | 9110 | 1.483 | IPPE-BR1, central region, 725-group |
| 20 | FNS-Grph-096mm | 9201 | 5.267 | FNS-Graphite block with a D-T source and monitors at 96 mm, 725 group |
| 21 | FNS-Grph-293mm | 9202 | 1.957 | FNS-Graphite block with a D-T source and monitors at 293 mm, 725 group |
| ICSBEP spectra not accepted as benchmark fields | ||||
| 1 | PMF001 | 9104 | 1.797 | Jezebel, central region, 725-group |
| 2 | PMF002 | 9105 | 1.747 | Jezebel-240, central region, 725-group |
| 3 | PMF006 | 9106 | 1.589 | Flattop-Pu, central region, 725-group |
| 4 | PMF008 | 9107 | 1.681 | Thor, central region, 725-group |
| Analytical spectrum functions accepted as benchmark fields | ||||
| 1 | Thermal Maxw. | 9901 | Thermal Maxwellian at 293.6 K | |
| 2 | 1/E [0.55eV–2MeV] | 9902 | Pure 1/E between Ecd and E2 ( eV MeV) | |
| 3 | Maxw.(25 keV) | 9925 | Maxwellian at 25 keV | |
| 4 | Maxw.(30 keV) | 9930 | Maxwellian at 30 keV | |
| Analytical spectrum functions not used as benchmark fields | ||||
| 1 | Const. | 9900 | Constant spectrum Phi=1 | |
| 2 | 1/E [0.5eV–20MeV] | 9904 | Pure 1/E between Ecd and E2 (0.5 eV E 20 MeV) | |
| 3 | Maxw.Fiss. | 9905 | Pure Maxwellian fission spectrum at temperature 2.03 MeV | |
| 4 | Linear | 9910 | Linear spectrum Phi=E (1.E-5 eV E 20 MeV) | |
| 5 | Maxw.(32 keV) | 9932 | Maxwellian at 32 keV | |
| 6 | Maxw.(35 keV) | 9935 | Maxwellian at 35 keV | |
| 7 | Maxw.(40 keV) | 9940 | Maxwellian at 40 keV | |
| 8 | Maxw.(45 keV) | 9945 | Maxwellian at 45 keV | |
| 9 | Maxw.(50 keV) | 9950 | Maxwellian at 50 keV | |
| 10 | Maxw.(60 keV) | 9960 | Maxwellian at 60 keV | |
III IRDFF-II FORMAT AND DATA VERIFICATION
In order to support the user community, the cross sections in the IRDFF-II library are distributed in several different formats, described in the sections below.
The baseline library is in the ENDF-6 format, where the full library data file contains several logical files for different nuclides, identified by the so-called MAT numbers. Each nuclide file is further subdivided into subfiles identified by the MF numbers that designate the type of data and the MT numbers that designate the reaction type. A brief extract is given below for convenience. Full details are given in the ENDF-6 manual ENDF-6 .
-
MAT
Material/nuclide identifier is a four-digit number that uniquely identifies the target nuclide.
-
MF
Data type identifier:
-
1
General information. The first section in this subfile is identified by MT=451 and contains evaluation description in plain text, including eigenvalues of the covarince matrices.
-
3
Cross sections and other parameters as a function of incident particle energy.
-
10
Cross sections for the excitation of discrete states, or radionuclide production cross sections.
-
33
Covariance data of the quantities in MF=3.
-
40
Covariance data for the quantities in MF=10.
-
MT
Reaction type number (e.g., 16(n,2n), 102(n,), 103(n,p), etc.). For full details see Appendix B of the ENDF-6 Manual ENDF-6 .
The derived libraries in other formats are generated by processing baseline libraries in point-wise cross-section representation with codes such as NJOY-2016 NJOY2016 or PREPRO PREPRO . At the request of the users, the recommended cross sections are also available in three column format (energy, cross section and the total uncertainty) to be used as reference activation cross sections for relative activation measurements333Note that a full uncertainty propagation of these cross sections for a broad spectrum requires the use of the complete covariance matrix, which is only given in ENDF-6 format.. If a user requires the cross sections at a different temperature, the threshold reactions would be practically unaffected. Reaction cross sections with resonance structure might need additional processing with codes like NJOY or PREPRO.
Note that residual-production covariance matrices in ENDF subfile MF=40 that contain more than one product cannot be processed with the current version of NJOY NJOY2016 . This is applicable to many of the natural element evaluations in IRDFF-II. A way around this problem is to split the evaluated file in such a way that only one product is present at a time, and process the partial files separately. Hopefully, an update to the processing code will be available soon that will support legitimate ENDF-6 format covariance representation.
III.1 ENDF-6 Format Point Cross Sections
The baseline library contains point cross sections at 293.6 K in ENDF-6 format representation that is well-documented and has the flexibility to capture the highest fidelity characterization of neutron cross sections, including the resonance region, as well as the associated covariance files. This format can also be used to capture the nuclear decay data and the neutron spectral characterization data. The ENDF-6 file structure places reaction cross sections in MF=3 and production cross sections in MF=10. Both of these file types are used to capture the cross sections within the IRDFF-II library. The covariance data that correspond to data found in these sections are stored in MF=33 and MF=40, respectively. Radioactive decay data are given in MF=8. The file structure permits the inclusion of in-line documentation using MF=1, MT=451 entries.
III.2 ENDF-6 Format Neutron Spectra
Whereas the ENDF-6 file structure permits the energy distributions of secondary particles to be presented in MF=5 and MF=6, this field does not fit the IRDFF-II characterization for the benchmark neutron spectra. These data appear in a separate IRDFF-II library file in pseudo-ENDF format as MF=3, MT=261 sub-files. The spectra are differentiated by the MAT number. The covariance information is stored in the corresponding ENDF subfiles MF=33, MT=261. This is a non-standard use of the ENDF format, which uses MT=261 that is formally undefined in the ENDF-6 manual . Storing the spectra in this format is convenient because for many operations on the data and for generating the comparison plots the same software can be used as for the cross sections.
III.3 ENDF-6 Format 640 and 725 Group Representation
Whereas a point cross section format is best for capturing the physics-based structure behind the cross section representation, this format does not readily support post-processing of the cross sections and the extraction of spectrum-averaged cross sections, reaction rates from integral neutron fields, or many other relevant material dosimetry metrics. For these applications, a multigroup representation is generally used. An important consideration with multigroup representations is the energy group structure. Whereas few-group representation may be sufficient for some applications, other applications require a fine-group representation.
A common fine-group structure that was found to be sufficient for capturing the energy-dependent shape of most responses relevant to the fission reactor community is the extended SAND-II group structure McE67 . The extension here represented an increase from the original 18 MeV SAND-II maximum energy up to 20 MeV. Thus, this 640-group energy group structure starts at 10-4 eV and goes up to 20 MeV. Since the IRDFF-II library goes up to 60 MeV, in this representation the IRDFF-II data are essentially truncated at 20 MeV and collapsed into the 640-group structure.
The IRDFF-II application addresses the needs of the fusion and low temperature material science communities as well as the fission reactor community, hence a second 725-group representation that extends up to 60 MeV is also used to characterize the data. The energy group structure for this 725-group representation is formed by:
-
•
starting at 10-5 eV and adding 45 groups to cover the energy range from 10-5 eV up to the 10-4 eV, where the 640-group SAND-II structure starts;
-
•
using the same 640-groups between 10-4 eV and 20 MeV;
-
•
adding 20 groups of 0.5 MeV width in energy to extend the range up to 30 MeV;
-
•
adding 10 groups of 1 MeV width in energy to further extend the range up to 40 MeV;
-
•
adding 10 groups of 2 MeV width in energy to further extend the range up to 60-MeV.
In this collapsing of the point cross sections to the 640 or 725 group structure, an energy-dependent weighting function can be used. The two most common weighting functions are:
-
1.
A thermal Maxwellian shape in the thermal region, a 1/ shape in the reactor neutron slowing down region, a fission spectrum shape in the fast fission reactor region, and a fusion peak at high energies of the fusion blanket region. The GROUPR module of the NJOY-2012 code with the IWT=8 weighting function using the default weighting function shape parameters (thermal breakpoint of 0.1 eV, thermal temperature of 0.025 eV, fission breakpoint of 0.1 MeV, fission temperature of 1.4 MeV) can be used to collapse the data that appears in the file. The disadvantage of this weighting function is that it might not be representative of reactor spectra at epithermal energies and could even have a wrong gradient.
-
2.
A flat weighting across the energy bin. Given the fine group nature of the two energy bin structures, this flat weighting is more general at high energies and mostly sufficient at lower energies as well.
In the preparation of the IRDFF-II multigroup data the second option, flat weighting, was used. This collapsing was performed with the GROUPIE module of the PREPRO-2018 data processing package PREPRO . The same procedures are applicable also to the IRDFF-II file of neutron spectra in ENDF-6 format.
III.4 MCNP ACE Format
The ACE (A Compact ENDF) format is a common data format that is used in continuous-energy neutron-photon Monte Carlo codes like MCNP MCNP and SERPENT SERPENT . The virtue of this format is that it can capture the continuous energy nature of the underlying cross section without resorting to a multi-group representation. Since many fission and fusion community applications use the MCNP code to model the neutron spectrum at locations of interest for dosimetry measurements, the inclusion of this format increases the fidelity supported by the application and makes it easy for the user to interface with the recommended IRDFF-II library.
III.5 Data Verification
A critical step in the verification of the formal correctness of the IRDFF-II library files was to ensure that the ENDF-6 format rules were obeyed. For this purpose, the ENDF Utility Codes were employed ENDF_utility , namely:
-
CHECKR
checks the syntax;
-
FIZCON
checks the internal consistency of the data;
-
PSYCHE
does an in-depth checking, particularly regarding the covariance data.
In addition, the COVEIG code COVEIG was used to check for symmetry, large correlation coefficients and negative eigenvalues in the covariance matrices.
The ability to process the files in ENDF-6 format was checked by running the PREPRO codes PREPRO . The following modules are applicable:
-
LINEAR
makes all cross sections linearly interpolable;
-
GROUPIE
generates group-averaged cross sections;
-
COMPLOT
makes graphical comparison with other evaluated data files.
Finally, the NJOY code NJOY2016 was employed to prepare plots of the covariance matrices and to generate the IRDFF-II library in ACE format. Quality assurance procedure INDC(SEC)-0107 INDC(SEC)-0107 was employed to minimize the possibility of data processing errors when generating the files in ACE format.
IV RECOMMENDED NUCLEAR DATA FOR NEUTRON METROLOGY
This Sec. provides a more in-depth examination of the various nuclear data components within the IRDFF-II library and provides details on the process used to arrive at the recommendations.
IV.1 Atomic Mass and Isotopic Natural Abundance Data
| Target | Abundance | Isotopic Atomic | Isotopic Atomic | Elemental weight value |
|---|---|---|---|---|
| nucleus | [atom %] | Mass Excess [keV] | Mass [amu] | or range [amu] |
| 6Li | 7.589 (24) | +14086.8789 (14) | 6015122.8874 (15) | [6.938, 6.997] |
| 7Li | 92.411 (24) | +14907.105 (4) | 7016003.437 (5) | [6.938, 6.997] |
| 10B | 19.82 (2) | +12050.609 (15) | 10012936.862 (16) | [10.806, 10.821] |
| 11B | 80.18 (2) | +8667.707 (12) | 11009305.167 (13) | [10.806, 10.821] |
| 19F | 100. (0) | -1487.4442 (09) | 18998403.1629 (9) | 18.998403 163(6) |
| 23Na | 100. (0) | -9529.8525 (18) | 22989869.2820 (19) | 22.98976928 (2) |
| 24Mg | 78.951 (12) | -13933.569 (13) | 23985041.697 (14) | [24.304, 24.307] |
| 27Al | 100. (0) | -17196.86 (5) | 26981538.41 (5) | 26.9815385 (7) |
| 28Si | 92.22968 (44) | -21492.7943 (5) | 27.9769265350 (5) | [28.084, 28.086] |
| 29Si | 4.68316 (32) | -21895.0784 (6) | 28.9764946653 (6) | [28.084, 28.086] |
| 31P | 100. (0) | -24440.5410 (7) | 30973761.9986 (7) | 30.973761 998 (5) |
| 32S | 95.04074 (88) | -26015.5336 (13) | 31972071.1744 (14) | [32.059, 32.076] |
| 45Sc | 100. (0) | -41071.9 (7) | 44955907.5 (7) | 44.955908 (5) |
| 46Ti | 8.249 (21) | -44127.80 (16) | 45952626.86 (18) | 47.867 (1) |
| 47Ti | 7.437 (14) | -44937.36 (12) | 46951757.75 (12) | 47.867 (1) |
| 48Ti | 73.720 (22) | -48492.71 (11) | 47947940.93 (12) | 47.867 (1) |
| 51V | 99.7503 (6) | -52203.8 (4) | 50 943956.9 (4) | 50.9415 (1) |
| 50Cr | 0.2497 (6) | -50262.1 (4) | 49 946041.4 (5) | 51.9961 (6) |
| 52Cr | 83.7895 (117) | -55419.2 (3) | 51 940505.0 (4) | 51.9961 (6) |
| 55Mn | 100. (0) | -57712.4 (3) | 54938043.2 (3) | 54.938 044 (3) |
| 54Fe | 5.8450 (230) | -56254.5 (4) | 53939608.3 (4) | 55.845 (2) |
| 54Fe | 5.8450 (230) | -56254.5 (4) | 53939608.3 (4) | 55.845 (2) |
| 56Fe | 91.7540 (240) | -60607.1 (3) | 55934935.6 (3) | 55.845 (2) |
| 58Fe | 0.2819 (27) | -62155.1 (3) | 57933273.7 (4) | 55.845 (2) |
| 59Co | 100. (0) | -62229.7 (4) | 58933193.7 (4) | 58.933194 (4) |
| 58Ni | 68.0769 (59) | -60228.7 (4) | 57935341.8 (4) | 58.6934 (4) |
| 63Cu | 69.174 (20) | -65579.8 (4) | 62929597.2 (5) | 63.546 (3) |
| 65Cu | 30.826 (20) | -67263.7 (6) | 64927789.5 (7) | 63.546 (3) |
| 64Zn | 49.1704 (83) | -66004.0 (6) | 63929141.8 (7) | 65.38 (2) |
| 67Zn | 4.0401 (18) | -67880.3 (8) | 66 927127.5 (8) | 65.38 (2) |
| 75As | 100. (0) | -73034.2 (9) | 74 921594.6 (9) | 74.921595 (6) |
| 89Y | 100. (0) | -87708.4 (16) | 88 905841.2 (17) | 88.90584 (2) |
| 90Zr | 51.452 (9) | -88772.54 (12) | 89904698.76 (13) | 91.224 (2) |
| 93Nb | 100. (0) | -87212.8 (15) | 92906373.2 (16) | 92.90637 (2) |
| 92Mo | 14.649 (17) | -86808.58 (16) | 91906807.16 (17) | 95.95 (1) |
| 103Rh | 100. (0) | -88031.7 (23) | 102905494.1 (25) | 102.90550 (2) |
| 109Ag | 48.1608 (51) | -88719.4 (13) | 108904755.8 (14) | 107.8682 (2) |
| 113In | 4.281 (17) | -89367.12 (19) | 112904060.45 (20) | 114.818(1) |
| 115In | 95.719 (17) | -89536.346 (12) | 114903878.774 (13) | 114.818(1) |
| 127I | 100. | -88984 (4) | 126904472 (4) | 126.90447 (3) |
| 139La | 99.91119 (24) | -87226.2 (20) | 138906358.8 (22) | 138.90547 (7) |
| 141Pr | 100.0 (0) | -86015.6 (17) | 140907658.4 (18) | 140.90766 (2) |
| 169Tm | 100.0 (0) | -61275.2 (08) | 168934218.4 (09) | 168.93422 (2) |
| 181Ta | 99.98799 (8) | -48438.3 (14) | 180947999.3 (15) | 180.94788 (2) |
| 186W | 28.4259 (62) | -42508.5 (12) | 185954365.2 (13) | 183.84 (1) |
| 197Au | 100.0 (0) | -31139.7 (05) | 196966570.1 (06) | 196.966569 (5) |
| 199Hg | 16.938 (9) | -29546.1 (05) | 198968281.0 (06) | 200.592 (3) |
| 204Pb | 1.4245 (12) | -25109.9 (11) | 203973043.4 (12) | 207.2 (1) |
| 209Bi | 100.0 (0) | -18258.7 (14) | 208980398.5 (15) | 208.98040 (1) |
| 232Th | 99.998862 (2) | +35446.8 (14) | 232038053.7 (15) | 232.0377 (4) |
| 235U | 0.72041 (36) | +40918.8 (11) | 235043928.2 (12) | 238.02891 (3) |
| 238U | 99.27417 (36) | +47307.8 (15) | 238050787.0 (16) | 238.02891 (3) |
| 237Np | — | +44871.7 (11) | 237048171.7 (12) | — |
| 239Pu | — | +48588.3 (11) | 239052161.7 (12) | — |
| 241Am | — | +52934.4 (11) | 241056827.4 (12) | — |
The atomic weights for the target elements are given in Table 6 in atomic mass units. The reported uncertainties correspond to those for isotopes in the normal terrestrial materials. Column 2 of Table 6 gives the recommended natural abundance value for all targets in the IRDFF-II library. Column 3 of Table 6 shows the isotopic weights – represented as the mass excess in energy units and Column 4 gives the corresponding values in micro-atomic mass units, as quoted in the original publication AME2016 .
IV.2 Dosimetry Cross Sections
The IRDFF-II recommended cross sections are chosen from available ENDF-6 ENDF-6 formatted point cross sections from different sources as discussed below. Whereas some applications, such as radiation transport calculations, require the use of a complete nuclear data evaluation that includes all potential reaction channels, the IRDFF-II neutron metrology library only requires the specification of a cross section for the channels used within the metrology application. However, unlike many applications, it requires a consistent uncertainty characterization for the cross section in the form of an energy-dependent covariance matrix. Because of the demanding requirements on neutron metrology cross sections and corresponding uncertainties, the recommended evaluations, rather than being taken from existing nuclear data evaluations, are often the result of a specifically funded metrology-related activity. Table LABEL:Table_Long_I provides a list of the cross sections addressed within the IRDFF-II library and identifies the source evaluations. Columns 8 of Table LABEL:Table_Long_I also shows how the IRDFF-v1.05 library differs from the previous IRDF-2002. Note that “old” means no change in the data, symbol ”new” means the data were newly evaluated. Otherwise, Column 9 indicates how the current IRDFF-II compares with IRDFF-v1.05. Sometimes the recommended evaluation represents a combination where different energy regions are derived from different evaluated data sources. Column 6 provides reference to auxiliary documentation that describes the derivation of some of the recommended evaluations.
IV.3 Nuclear Decay Data
This Sec. addresses the IRDFF-II recommended nuclear decay data for activation products and for fission products. Tables 7 (beta emitters) and LABEL:Table_Long_XIV (gamma emitters) give the half-lives and emission probabilities associated with the residual nuclei (activation product) for all of the radionuclides according to the detected decay radiation. It also shows the most recent recommended gamma and beta decay data, namely the emission energies and emission probabilities for all of the residual nuclei associated with the reactions addressed within IRDFF-II.
| Beta Data | |||||
| Reaction | Half-life | Half-life | Time | Aver. | Emiss. |
| Product | (recomm.) | (DD eval.) | unit | [keV] | Prob. [%] |
| 3H | 12.32(2) | 12.312(25) | a | 5.68(1) | 100. |
| 32P | 14.263(36) | 14.284(36) | d | 695.5(3) | 100. |
| 106Ru | 371.8(18) | 371.5(21) | d | 10.03(6) | 100. |
Note that recommended data are those used in the IRDFF-II cross-section evaluation. These data agree within uncertainties with the latest decay data evaluations (labeled DD eval. in Table headers). The latest decay data evaluations have been compiled into associated IRDFF-II decay data file that is released together with the IRDFF-II neutron metrology library.
| Gamma/Xray | |||||||
|---|---|---|---|---|---|---|---|
| Reaction | Half-life | Half-life | Time | Gamma/X-ray | Emiss.Prob. [%] | Emiss.Prob. [%] | Source |
| Product | (recomm.) | (DD eval.) | unit | Energy[keV] | (recomm.) | (DD eval.) | Document |
| 18F | 109.77(5) | 109.734(14) | m | 511. | 193.72(38) | BIPM | |
| 0.525 X | 0.013(4) | ||||||
| 0.525 X | 0.007(2) | ||||||
| 22Na | 2.6018(22) | 2.6020 | a | 1274.537(7) | 99.94(13) | 99.940(14) | BIPM |
| 511. | 180.7(2) | 180.76(4) | |||||
| 24Na | 14.997(12) | 14.958(2) | h | 1368.630(5) | 99.9934(5) | 99.9936(15) | BIPM |
| 2754.049(13) | 99.862(3) | 99.855(5) | |||||
| 27Mg | 9.458(12) | m | 843.76(10) | 71.800(20) | 71.8(4) | ENSDF | |
| 1014.52(10) | 28.200(20) | 28.0(4) | |||||
| 26gAl | 717 000(24) | a | 11129.67(10) | 2.5(2) | ENDSF | ||
| 1808.65(7) | 99.76(4) | ||||||
| 511.0 | 163.5(4) | ||||||
| 28Al | (*)2.245(2) | 2.245(2) | m | 1778.987(15) | 100.0 | ENSDF | |
| 31Si | (*)157.36(26) | m | 1266.2(14) | 0.0554(7) | ENSDF | ||
| 46Sc | 83.787(16) | 83.787(16) | d | 889.271(2) | 99.98374(25) | BIPM | |
| 1120.537(3) | 99.97(2) | ||||||
| 47Sc | 3.3485(9) | 3.3485(9) | d | 159.373(12) | 68.1(5) | BIPM | |
| 48Sc | (*)43.67(9) | 43.70 | h | 983.526(12) | 100.1(6) | ENSDF | |
| 1037.522(12) | 97.6(7) | ||||||
| 1312.120(12) | 100.1(7) | ||||||
| 45Ti | (*)184.8(5) | 184.8 | m | 511.0 | 169.6(3) | ENSDF | |
| 51Cr | 27.704 | 27.704 | d | 320.0835(4) | 9.89(2) | BIPM | |
| 54Mn | 312.12(10) | 312.19(3) | d | 834.855(3) | 99.9997(3) | 99.976(1) | BIPM |
| 56Mn | 2.5785(2) | 2.57878(46) | h | 846.7638(19) | 98.85(3) | 98.87(30) | BIPM |
| 1810.726(4) | 26.9(4) | 27.189(791) | |||||
| 2113.092(6) | 14.2(3) | 14.336(395) | |||||
| 53Fe | (*)8.51(2) | m | ENSDF | ||||
| 59Fe | 44.495(9) | 44.494(12) | d | 1099.245(3) | 56.51(31) | 56.6(18) | BIPM |
| 1291.590(6) | 43.23(33) | 43.2(14) | |||||
| 57Co | (*)271.74(6) | 271.81 | d | 14.41295(31) | 9.18(12) | BIPM | |
| 122.06065(12) | 85.49(14) | 85.60(17) | |||||
| 136.47356(29) | 10.71(15) | 10.68(8) | |||||
| 58Co | 70.86(6) | 70.85(3) | d | 810.7602(20) | 99.44(2) | 99.450(10) | BIPM |
| 60Co | 5.2711(8) | 5.2711(8) | a | 1173.228(3) | 99.85(3) | BIPM | |
| 1332.492(4) | 99.9826(6) | ||||||
| 57Ni | 35.60(6) | 35.60(6) | h | 127.164(3) | 16.0(5) | BIPM | |
| 1377.62(4) | 81.2(6) | 81.7(24) | |||||
| 1757.55(3) | 6.1(4) | ||||||
| 1919.62(14) | 12.5(5) | 12.3(4) | |||||
| 62Cu | 9.73(3) | 9.67(3) | m | 1172.97(10) | 0.342 | ENSDF | |
| 511.0 | 195.66(5) | 2 x 94.86(5) | |||||
| 64Cu | 12.701(2) | 12.7004(20) | h | 1345.77(6) | 0.4748(34) | BIPM | |
| 511. | 35.2(4) | 34.8(4) | |||||
| 67Cu | (*)61.83(12) | 61.86 | h | 184.577(10) | 48.7(3) | ENSDF | |
| 74As | (*)17.77(2) | d | 595.83(8) | 59(3) | ENSDF | ||
| 88Y | (*)106.626(21) | 106.63 | d | 1836.070(8) | 99.346(25) | 99.2(3) | BIPM |
| 898.042(11) | 93.7(3) | ||||||
| 89Zr | 78.41(12) | 78.42(13) | h | 908.97(3) | 99.03(2) | 99.04(1) | BIPM |
| 511. | 45.6(6) | 45.5(5) | |||||
| 95Zr | 64.032(6) | 64.032(6) | d | 756.729(12) | 54.38(22) | BIPM | |
| 724.193(3) | 44.27(22) | ||||||
| 95Nb | 34.991(6) | 34.991(6) | d | 765.803(6) | 99.808(7) | BIPM | |
| 94Nb | 20 300(16) | 20 200 | a | 871.091(18) | 99.892(0) | ENSDF | |
| 702.65(6) | 99.814(0) | ||||||
| 94mNb | (*)6.263(4) | m | 871 | 0.50(6) | ENSDF | ||
| 93mNb | 16.1(2) | 16.12(15) | a | 30.77(2) | 0.000591(9) | BIPM | |
| 16.5213 X | 3.32(8) | ||||||
| 16.6152 X | 6.34(15) | ||||||
| 18.67 X | 1.64(4) | ||||||
| 18.967 X | 0.246(11) | ||||||
| 92mNb | 10.15(2) | d | 934.44(10) | 99.15(4) | 99.07(4) | ENSDF | |
| 99Mo | (*)65.924(6) | h | 739.500(17) | 12.20 | ENSDF | ||
| 103Ru | (*)39.247(13) | d | 610.333(10) | 5.76(6) | ENSDF | ||
| 497.085(10) | 91.0(12) | ||||||
| 103mRh | (*)56.114(9) | m | 39.755(12) | 0.068(5) | ENSDF | ||
| 20.073 X | 2.00(18) | ||||||
| 20.215 X | 3.8(3) | ||||||
| 22.699–22.912 X | 1.03(9) | ||||||
| 22.699–23.215 X | 1.20(11) | ||||||
| 23.167–23.172 X | 0.171(16) | ||||||
| 110mAg | 249.78(2) | d | 1505.028(2) | 13.16(16) | BIPM | ||
| 1384.2931(20) | 24.7(5) | ||||||
| 937.485(3) | 34.51(27) | ||||||
| 884.6781(13) | 74.0(12) | ||||||
| 763.9424(17) | 22.31(9) | ||||||
| 706.6760(15) | 16.48(8) | ||||||
| 657.7600(11) | 94.38(8) | ||||||
| 113mIn | (*)99.476(23) | 99.48 | m | 391.698(3) | 64.94(17) | ENSDF | |
| 114mIn | (*)49.51(1) | 49.51 | d | 190.27(3) | 15.56(15) | ENSDF | |
| 24.002 | 9.8(3) | ||||||
| 24.21 | 18.2(6) | ||||||
| 115mIn | 4.486(4) | h | 336.244(17) | 45.9(1) | ENSDF | ||
| 116mIn | 54.29(17) | m | 1293.56(2) | 84.8(12) | ENSDF | ||
| 1097.28(2) | 58.5(8) | ||||||
| 126I | (*)12.93(5) | 12.93 | d | 666.331(12) | 32.9(7) | ENSDF | |
| 388.633(11) | 35.6(6) | ||||||
| 137mBa | (*)2.552(1) | 2.552 | m | 661.657(3) | 90.07(20) | BIPM | |
| 137Cs | (*)30.08(9) | a | 661.657(3) | 84.99(20) | BIPM | ||
| 140La | 1.6781(3) | 1.67855(12) | d | 1596.203(13) | 95.40(5) | 95.40(8) | BIPM |
| 815.784(6) | 23.72(20) | ||||||
| 328.761(4) | 20.8(3) | ||||||
| 140Ba | (*)12.7527(23) | 12.7527 | d | 537.261(25) | 24.6(5) | BIPM | |
| 144Ce | (*)284.91(5) | d | 133.5152(20) | 10.83(12) | BIPM | ||
| 140Pr | (*)3.39(1) | 3.39 | m | 1596.1(2) | 0.49 | ENSDF | |
| 511.0 | 102.0(6) | ||||||
| 39.258 | 3.68(8) | ||||||
| 167Tm | (*)9.25(2) | 9.25 | d | 207.801(5) | 42(8) | BIPM | |
| 168Tm | (*)93.1(2) | d | 815.89(5) | 50.95(16) | 48.99(150) | ENSDF | |
| 447.515(3) | 23.98(11) | 23.06(71) | |||||
| 198.251 (2) | 54.49(16) | 53.4(16) | |||||
| 182Ta | 114.43 | 114.74(12) | d | 1221.395(3) | 27.35(27) | BIPM | |
| 1189.040(3) | 16.66(16) | ||||||
| 1121.290(3) | 35.30(33) | ||||||
| 187W | 23.72(6) | 24.00 | h | 685.81(1) | 33.2(5) | 27.30(93) | ENSDF |
| 551.55(1) | 6.14(10) | ||||||
| 479.53(1) | 26.6(4) | 21.84(71) | |||||
| 196Au | 6.183(10) | 6.1669(6) | d | 333.03(5) | 22.9(9) | ENSDF | |
| 355.73(5) | 87. | ||||||
| 426.10(6) | 6.6 | ||||||
| 198Au | 2.6943(8) | 2.6943(3) | d | 411.80205(17) | 95.62(6) | BIPM | |
| 675.8836(7) | 0.804(7) | ||||||
| 1087.6842(7) | 0.1591(21) | ||||||
| 199mHg | 42.6(2) | 42.67(9) | m | 158.3(1) | 52.3 | ENSDF | |
| 374.1(1) | 13.8(11) | ||||||
| 204mPb | 67.2(3) | 66.93(10) | m | 374.76(7) | 94.20(14) | 89.253(14876) | ENSDF |
| 911.74(15) | 91.5(13) | 90.0691(2999) | |||||
| 204Bi | 11.22(10) | 11.28 | h | 1755.28(6) | 1.23(16) | ENSDF | |
| 1703.27(5) | 2.00(24) | ||||||
| 983.98(3) | 59(6) | ||||||
| 899.15(3) | 99(12) | ||||||
| 670.72(3) | 11.4(13) | ||||||
| 205Bi | 15.31(4) | 15.11 | d | 703.45(5) | 31.1 | ENSDF | |
| 987.66(5) | 16.1(3) | ||||||
| 1764.30(10) | 32.5(7) | ||||||
| 206Bi | 6.243(3) | d | 803.10(5) | 99.0(14) | ENSDF | ||
| 537.45(4) | 30.5(4) | ||||||
| 343.51(3) | 23.5(4) | ||||||
| 207Bi | 32.9(14) | 31.55(4) | a | 1063.656(3) | 74.58(22) | 74.6(5) | BIPM |
| 1770.228(9) | 6.871(26) | 6.87(3) | |||||
| 569.698(2) | 97.76(3) | ||||||
| 208Bi | (*)368 000(4) | a | 2614.5 | 99.785 | ENSDF | ||
| 233Th | (*)21.83(4) | 22.15(8) | m | 595.39(6) | 0.1178(16) | BIPM | |
| 170.60(6) | 0.507(9) | ||||||
| 86.477(10) | 1.843(22) | ||||||
| 233Pa | (*)26.975(13) | 26.98(2) | d | 415.764(5) | 1.97(12) | BIPM | |
| 311.904(5) | 68.9(12) | ||||||
| 300.129(5) | 12.3(4) | ||||||
| 237U | (*)6.752(2) | 6.749(16) | d | 332.376(16) | 1.199(16) | BIPM | |
| 208.00(1) | 21.3(3) | 21.2(3) | |||||
| 59.54091(10) | 34.1(9) | 34.5(8) | |||||
| 239U | 23.46 | m | 844.10(3) | 0.139(3) | BIPM | ||
| 662.28(2) | 0.170(5) | ||||||
| 74.664(1) | 51.6(13) | ||||||
| 239Np | 2.356(3) | d | 106.125(2) | 25.9(3) | BIPM | ||
| 228.183(1) | 11.32(22) | ||||||
| 334.310(3) | 2.04(2) | ||||||
IV.4 Fission Yield Data
The fission cross sections of the actinides included in the IRDFF-II library differ significantly in the thermal and the epithermal neutron energy range, which determines the relative importance of the fission yield data. Comparison of the fission cross sections is given in Fig. 1 for 232Th, 235,238U, 237Np, 239Pu, and 241Am targets.
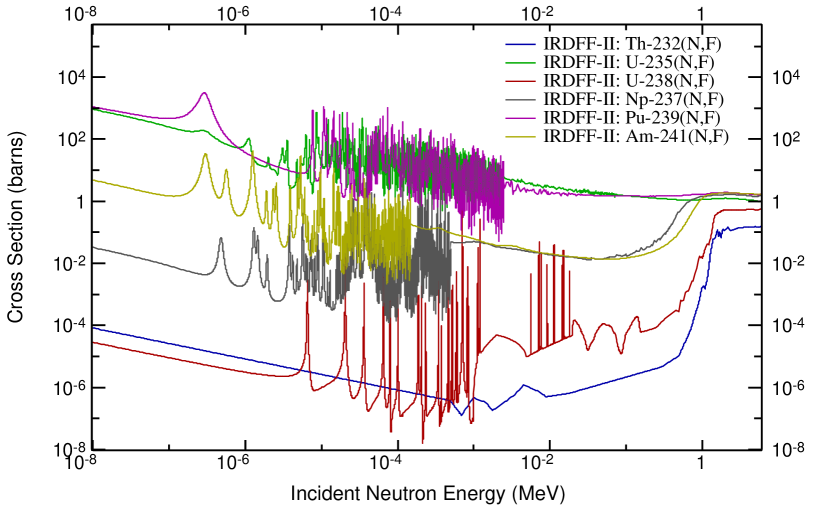
The baseline recommended fission yields for dosimetry applications are taken from the JEFF-3.3 library. These data are modifications to the JEFF-3.1.1 library and are also identified as UKFY3.7 Kel09 . When the fission yields do not appear in the JEFF-3.3 library, e.g., the 14 MeV fission yields for 239Pu and 237Np, the recommended values are taken from the ENDF/B-VIII.0 library.
While the dosimetry community looks forward to the future use of a more refined energy-dependence to the recommended fission yields, the current IRDFF-II library recommendation is based on a selection of the appropriate yield from one of the three energy-dependent groups: thermal, fast (average energy in the range 400 keV to 500 keV), and 14 MeV.
IV.5 Thermal Neutron Cross Sections and Resonance Integrals
Neutron dosimetry is the inverse of neutron activation analysis (NAA). Independent data sets exist like the Kayzero library for NAA by the k0 standardization method Kayzero , for example. There is a direct relation between the constants in the Kayzero data-base and the differential cross sections Trkov:NAA . Since the constants were measured independently of the differential cross sections, the k0 and Q0 constants contained in the Kayzero library can be used for the validation of the thermal capture cross sections and resonance integrals in the IRDFF-II library, in addition to the comparison with other compilations like the Atlas of Resonance Parameters Mug16 . The comparison is discussed and presented in Sec. VI.7.
V CROSS-SECTION COMPARISON BETWEEN AVAILABLE EVALUATIONS FOR SELECTED REACTIONS
The following Secs. provide a commented review and details on some of the recommended cross sections that appear within the IRDFF-II library. The reactions addressed below focus on the new and updated content of the library. Some of the reaction-specific verification evidence is summarized below and comparisons are made with other evaluations. Note that all reaction evaluations present in the IRDFF-II library feature both the evaluated mean values and the corresponding covariance matrices. The definition of the covariance matrix requires that it be positive semi-definite. The eigenvalues of all covariance matrices have been checked to be non-negative in the evaluator’s energy grids; all calculated eigenvalues are listed in the IRDFF-II files in ENDF-6 format in the comment section (MT=451) for each dosimetry reaction. Users should be aware that numerical processing of covariance matrices may introduce very small negative eigenvalues due to round-off errors; processed covariance matrices require to be checked for negative eigenvalues, and regularized if needed by adding a very small number to the diagonal elements.
Whereas the ordering of the nuclear data reaction content in Table LABEL:Table_Long_I is with increasing atomic number of the target nuclei, the ordering of Secs. here is different. This new library includes composite reactions and extends earlier evaluation up to 60 MeV. The ordering of Secs. below is designed to most easily illustrate the verification steps taken in the preparation of the library. It starts with a simple high energy reaction, the 58Ni(n,p)58Co reaction, then proceeds to address the related composite reaction, Ni(n,X)58Co, that is now added to the library. The following Secs. then address more complicated high energy composite dosimetry reactions such as Fe(n,X)54Mn, resonance reactions and new reactions that have a reaction threshold above 20 MeV. The survey of reactions then ends with a discussion of the very complex composite reactions, such as gas-production reactions Li(n,X)4He and B(n,X)4He, where there can be multiple target isotopes and multiple contributing reaction channels.
V.1 Reaction Q-values and Thresholds
Reaction threshold is directly related to its Q-value. As a rule, exothermic reactions do not have a threshold, but in some cases there is an effective threshold due to the Coulomb barrier in the outgoing charged-particle emission, and the probability of the reaction is very small. However, “small” is actually case-dependent, since in “well-thermalised systems ” the neutron flux at thermal energies can be many orders of magnitude higher than the fast flux, where the cross section is significant. The special cases in the IRDFF-II library are listed in Table 9, together with the Q-values and the adopted effective threshold energies.
| ID | Reaction | Label | MAT | Q-Value | Eff. Thr. |
|---|---|---|---|---|---|
| [keV] | [keV] | ||||
| 1 | 10B(n,)7Li | B10a | 525 | 2789.323 | 0.0 |
| 2 | 47Ti(n,p)47Sc | Ti47p | 2228 | 181.580 | 800.0 |
| 3 | 54Fe(n,p)54Mn | Fe54p | 2625 | 85.2127 | 0.0 |
| 4 | 54Fe(n,)51Cr | Fe54a | 2625 | 842.760 | 0.0 |
| 5 | 58Ni(n,p)58Co | Ni58p | 2825 | 400.800 | 400.0 |
| 6 | 59Co(n,)56Mn | Co59a | 2725 | 328.400 | 334.016 |
| 7 | 63Cu(n,)60Co | Cu63a | 2925 | 1714.400 | 2250.0 |
| 8 | 64Zn(n,p)64Cu | Zn64p | 3025 | 203.500 | 500.0 |
| 9 | 67Zn(n,p)67Cu | Zn67p | 3034 | 220.690 | 0.0 |
| 10 | 92Mo(n,p)92mNb | MoNb92pm | 4225 | 425.680 | 1000.0 |
V.2 Description of Selected Cross-Section Evaluations
V.2.1 Ni(n,p)Co
The zero to 20 MeV portion of the selected cross section comes from an IAEA-sponsored evaluation performed by K. Zolotarev in December 2002, documented as part of the RRDF-2002 library, and released within the IAEA-generated IRDF-2002 library. The IAEA sponsored the extension of this library from 20 MeV to 60 MeV, which was incorporated into the evaluation in February 2014. This extension used the model-based sub-library TENDL-2013(s60) of the TENDL-2013 library with explicit representation of reaction cross sections up to 60 MeV, while renormalizing (labelled in this paper as (r)) the calculations in the energy range 20 MeV to 60 MeV to ensure continuity of the data at 20 MeV. The associated IRDFF-II covariance matrices correctly reflect the derivation of the evaluation. These development details can be seen in the entry in Table LABEL:Table_Long_I for this reaction.
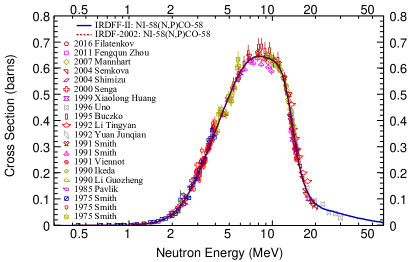
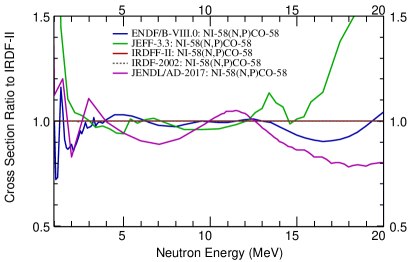
As noted in Sec. I, it is critical that recommended cross sections for dosimetry applications have evidence that the evaluation took into consideration the available body of experimental data. No experimental data exists for neutron energies greater than 30 MeV. Fig. 2(a) shows good agreement of the selected EXFOR data with the IRDFF-II cross sections. This comparison provides strong verification evidence for the consistency of the evaluation with measured differential data.
Fig. 2(a) also shows that the cross sections for this reaction are practically equal to those in the older IRDF-2002. For most fission reactor applications, the relevant 10 %-90 % sensitivity region for this reaction is between 2 MeV and 7 MeV. In order to also illustrate the variations between evaluations within this region, Fig. 2(b) shows the ratio of the various evaluations to the IRDFF-II recommended cross section, namely ENDF/B-VIII.0, JEFF-3.3, and JENDL/AD-2017. Variations on the order of 10 % are observed. The curve for the IRDFF-II ratio is unity by definition in this figure. The JEFF-3.3 evaluation shows significant differences near threshold and above 15 MeV.
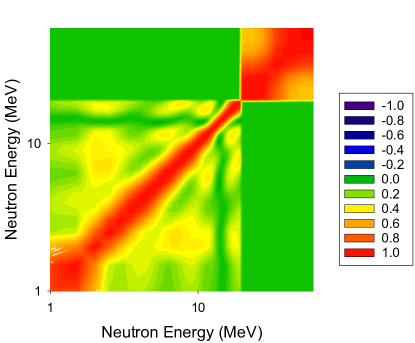

The inclusion of uncertainty data, in the form of a covariance matrix, is a required feature of dosimetry cross sections. Fig. 3(b) shows the energy-dependent 1-sigma uncertainty in the cross section using the energy group structure provided by the evaluator. The energy structure used in the uncertainty characterization is seen to only have a single large-width bin in the 0.4 MeV to 1.5 MeV region, so, due to the correlation of the cross section within this region, the energy-grouped uncertainty in Fig. 3(b) does not exhibit the large uncertainty suggested by the variation between different evaluations in Fig. 2(b). Fig. 3(a) shows the correlation matrix for the evaluation. The covariance matrix elements in the 20 MeV region are seen to be uncorrelated with those at lower energies -– as expected based on the evaluation methodology, since the two regions originate from different evaluations.
As discussed above, the definition of the covariance matrix requires that it be positive semi-definite. In order to verify this mathematical property, the smallest and the largest eigenvalues of the covariance matrix are shown in Table 10 for this reaction; all eigenvalues are positive numbers.
| No. | Row | Eigenvalue |
|---|---|---|
| 1 | 1 | 0.00000E+00 |
| 2 | 11 | 2.98127E-08 |
| 3 | 17 | 3.02008E-08 |
| 4 | 24 | 3.03488E-08 |
| 5 | 20 | 3.17274E-08 |
| 6 | 8 | 3.23051E-08 |
| 7 | 21 | 3.27524E-08 |
| 8 | 22 | 3.37126E-08 |
| 9 | 12 | 3.53861E-08 |
| 10 | 14 | 3.71190E-08 |
| … | ||
| 44 | 39 | 1.16138E-01 |
Another verification step is the comparison of the calculated-to-experimental ratio of the spectrum-averaged cross section (SACS) in the 252Cf spontaneous fission and 235U(nth,f) prompt fission neutron benchmark fields. We emphasize that this, within the context of the evaluation, is treated purely as a verification step since the nuclear data evaluator also commonly examines this metric as part of their verification process for the evaluation. The treatment of validation in these benchmark fields is addressed later in Sec. VII. Table 11 compares the spectrum-averaged cross sections produced with the IRDFF-II library to that reported by the nuclear data evaluator in the evaluation documentation.
| Spectrum | Experiment IRDFF-II | ||||
|---|---|---|---|---|---|
| Cross Section Source | Calculated x.s. | ||||
| (mb) | (mb) | ||||
| 235U(nth,f) | 108.9 | 4.78 % | Man85 | 107.44 | |
| 106.0 | 6.60 % | Hor89 | |||
| 108.5 | 1.29 % | Man99 | |||
| 252Cf(s.f.) | 117.6 | 1.28 % | Man87a | 117.36 | |
| 117.5 | 1.30 % | Man02 | |||
The residual nucleus produced in this reaction is 58Co – which, in addition to its 70.86 day half-life for the ground state, also has a 9.04 hour half-life isomer. It is critical to note that, consistent with adopted notation, this evaluation captures the complete 58Ni(n,p)58(m+g)Co cross section, that is, it represents the combined (n,p) reaction that populates the 58Co ground state and the meta-stable states. An important consideration in the use of this reaction for dosimetry in commercial fission reactors is the consideration of the thermal neutron burn-up correction that can be a factor in long irradiations in the presence of a thermal neutron environment. The effective burn-up cross section, via the 58Co(n,) reaction, is 1650 barns for 58gCo while that for the 58mCo residual nucleus is 1.4x10⁵ barns. The caveats on the need to make thermal neutron burn-up corrections for applications in light water reactors are found in ASTM E264 A264 . The cross sections and the decay data of the metastable isotope 58mCo are not included in the present version of IRDFF-II.
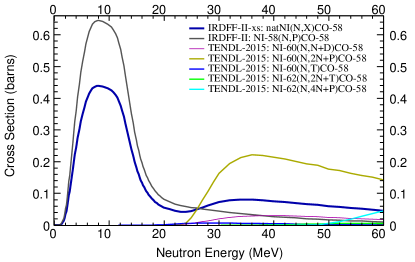
V.2.2 Ni(n,X)Co
Nickel is an element that has several naturally occurring isotopes and many reactions on different isotopes may lead to the same residual. Monitor samples are usually made of natural elements, so it is advantageous to provide the data for the residual production from the element, since production paths may include a multitude of minor channels which a user would need to consider. The cross sections and the covariance data for the Ni(n,X)58Co reaction were assembled from the IRDFF-II evaluation for the 58Ni(n,p) reaction (described in the previous section), which is the dominant contribution at low energies. The contributing reactions at higher energies were taken from the TENDL-2015 library, as shown in Fig. 4.

The covariance plot and the uncertainty are practically the same as for the 58Ni(n,p)58Co reaction except for the high energy part. The 1-sigma standard deviation is shown in Fig. 5.
V.2.3 Ni(n,p)Co
The cross sections and the covariance data for the 60Ni(n,p)60Co reaction in the energy range from threshold to 21 MeV were evaluated by Zolotarev Zol08 in 2008. Extension to 60 MeV was done at the IAEA based on TENDL-2011, renormalizing the cross sections at 21 MeV for continuity. Comparison of the cross sections with experimental data is shown in Fig. 6(a). The figure also shows the comparison between IRDF-2002 and IRDFF-II, which remained unchanged from version IRDFF-v1.05.
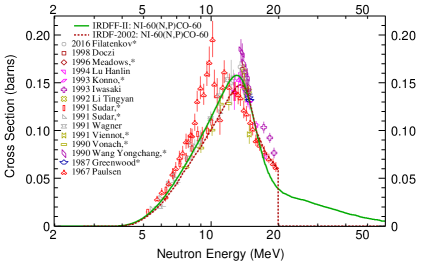
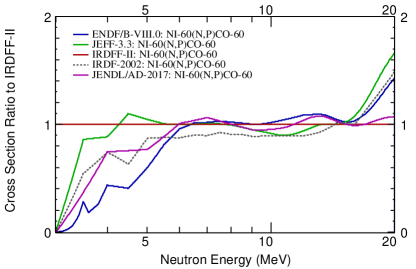
Cross sections in different evaluated libraries differ significantly near threshold as shown in Fig. 6(b), where the ratios of the various evaluations to the IRDFF-II recommended cross section are given. These differences may be important if this reaction monitor is used in reactor spectra. It is interesting that the cross section curves differ also at the plateau of the cross section near 13 MeV. The plot of the 1-sigma uncertainty is shown in Fig. 7(b), and the corresponding correlation matrix for the 60Ni(n,p)60Co reaction is shown in Fig. 7(a).
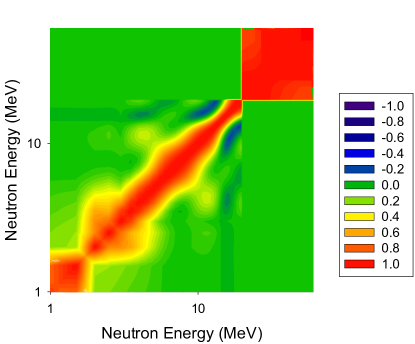

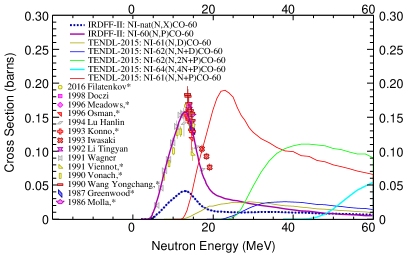
The 60Ni(n,p)60Co cross sections are traditionally included in dosimetry libraries, but the users should note that several neutron induced reactions from the heavier nickel isotopes lead to the same product, as shown in Fig. 8. Although the abundance of 61Ni is about twenty times smaller than the abundance of 60Ni, the latter may start contributing to the 60Co production at energies above 12 MeV through the 61Ni(n,np)60Co reaction. The user is advised to use the Ni(n,X)60Co cross sections that are newly introduced into the IRDFF-II library, noting that the cross sections are not validated for dosimetry purposes in neutron fields with a significant contribution of the flux above 12 MeV.
V.2.4 Fe(n,p)Mn
The 54Fe(n,p)54Mn reaction cross sections and covariances below 20 MeV were evaluated by Zolotarev Zol13 in 2013. Extension to 60 MeV was done at the IAEA based on TENDL-2013, renormalizing the cross sections at 20 MeV for continuity. Comparison of the cross sections with experimental data is shown in Fig. 9(a). The figure also shows the comparison between IRDF-2002 and IRDFF-II, which remained unchanged from version IRDFF-v1.05. Cross sections in different evaluated libraries differ significantly near threshold as shown in Fig. 9(b), where the ratios of the various evaluations to the IRDFF-II recommended cross section are given. These differences may be important if this reaction monitor is used in reactor spectra.
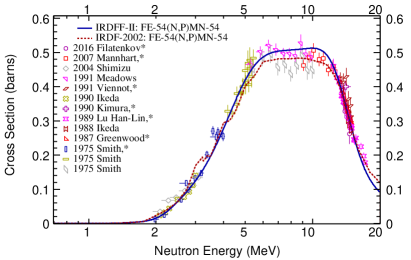
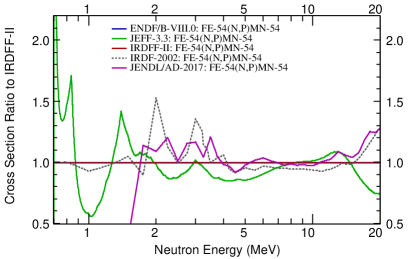
The plot of the correlation matrix for the 54Fe(n,X)54Mn reaction is shown in Fig. 10(a). The plot of the 1-sigma uncertainty is shown in Fig. 10(b).
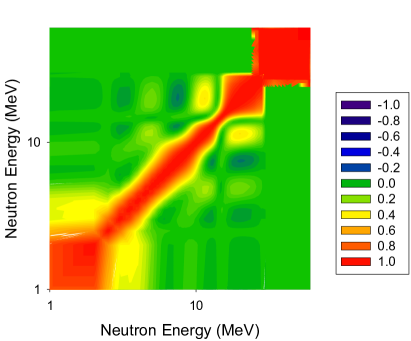

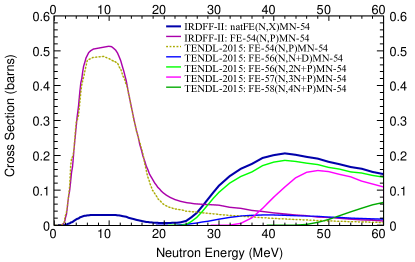
As in the case of nickel, the 54Fe(n,p)54Mn reaction cross sections are traditionally included in dosimetry libraries, but the users should note that several neutron induced reactions from the other isotopes lead to the same product. The thresholds for the competing reactions are fairly high and they become significant only well above 20 MeV. Nevertheless, the user is advised to use the Fe(n,X)54Mn cross sections that are newly introduced into the IRDFF-II library and are described below, noting that the cross sections are not validated for dosimetry purposes in neutron fields with a significant contribution of the flux above 20 MeV.
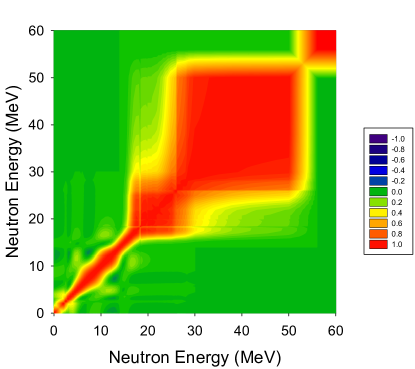

V.2.5 Fe(n,X)Mn
Elemental iron consists mainly of isotope 56Fe, but the minor isotopes are sometimes important as they may lead to reactions that produce the same residual. Monitor samples are usually made of natural elements, so it is advantageous to provide the data for the residual production from the element, since production paths may include a multitude of minor channels which a user would need to consider. The cross sections and the covariance data for the Fe(n,X)54Mn reaction were assembled from the IRDFF-II evaluation for the 54Fe(n,p) reaction (described in the previous section), which is the dominant contribution at low energies. The contributing reactions at higher energies were taken from the TENDL-2015 library, as shown in Fig. 11. Note that above 20 MeV the 54Mn production cross section is dominated by the contributions from reactions on 56Fe. For neutron dosimetry at these energies the use of the elemental radionuclide production cross sections is essential.
V.2.6 Fe(n,)Fe
The 58Fe(n,)59Fe reaction belongs to a minor isotope of iron, with abundance of less than 0.3 % and pronounced resonance structure, hence the measured cross section data are less precise. Through an IAEA-sponsored activity M. Moxon re-evaluated the resonance parameters of 58Fe in 2004 Mox04 , which were adopted in the JEFF and ENDF/B libraries. The evaluation removed some of the discrepancies with the measured thermal capture cross section and the resonance integral. The cross sections of 58Fe up to 60 MeV for IRDFF-II were taken from the JEFF-3.1 library. Comparison of the cross sections with experimental data in the fast energy range is shown in Fig. 13; big discrepancies are shown among different evaluated libraries. The cross section comparison in the resonance range is not shown, since many libraries adopt the Moxon evaluation. The figure also shows the comparison between IRDF-2002 and IRDFF-II, which remained unchanged from version IRDFF-v1.05.
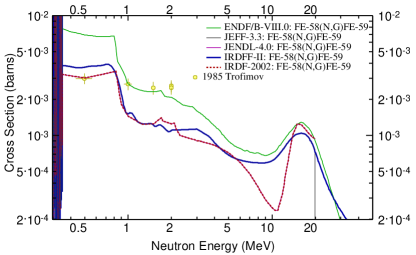
The plot of the correlation matrix for the 58Fe(n,)59Fe reaction is shown in Fig. 14(a). The plot of the 1-sigma uncertainty is shown in Fig. 14(b).
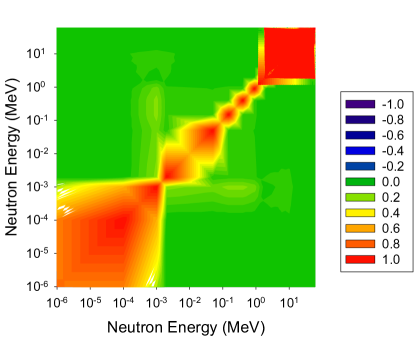

The 58Fe(n,)59Fe reaction is interesting for dosimetry applications because it is “clean” in the sense that it does not have any contributions from other isotopes of the elemental iron. The drawback is its low abundance, which is inherently known with a lower relative precision and this makes precise differential measurements more difficult, because they require enriched samples. The drawbacks are reflected in the lower accuracy of the evaluated cross sections.
V.2.7 S(n,p)P
The residual nuclide from the 32S(n,p)32P reaction is 32P, which, as seen from Table 7, is a pure beta emitter. As with all beta dosimetry, care must be taken in the dosimetry measurement process to ensure that only the 32P, and no other activation products are being counted. Potential interfering reaction products may arise from activation of any of the naturally occurring isotopes in the target material, e.g., 32S, 33S, or 35S. There are many ways to addressing the potential interferents A265 . For beta measurements performed on samples irradiated in fission reactor environments, a common practice for eliminating interference from other beta emitters is to use a cadmium thermal neutron shield to reduce the generation of capture products and to wait 24 hours between irradiation and counting so that residual reaction products, such as 31S, 34P, 31Si, and 37S, can die away before the counting is started. To increase the efficiency of the counting, the irradiated sulfur can also be burned, leaving a residue of 32P that can be counted without the need for corrections to account for absorption of the beta particles by the bulk sulfur in the irradiated material A265 .
The 32S(n,p)32P reaction cross sections and covariances below 20 MeV were evaluated by Zolotarev Zol13 in 2013. Extension to 60 MeV was done at the IAEA based on TENDL-2013, renormalizing the cross sections at 20 MeV for continuity.
Comparison of the cross sections with experimental data is shown in Fig. 15(a). The figure also shows the comparison between IRDF-2002 and IRDFF-II, which remained unchanged from IRDFF-v1.05. Cross sections in different evaluated libraries differ significantly near threshold as shown in Fig. 15(b), where the ratios of the various evaluations to the IRDFF-II recommended cross section are given.
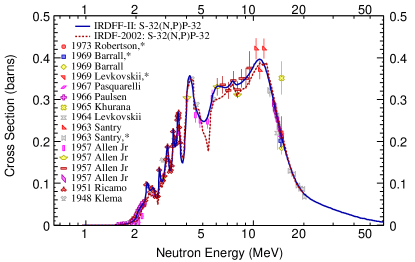
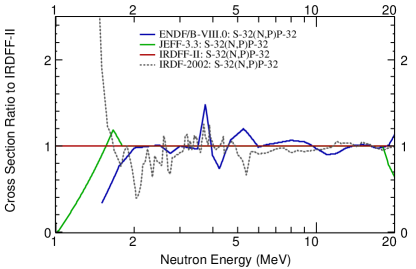
The plot of the correlation matrix for the 32S(n,p)32P reaction is shown in Fig. 16(a). The plot of the 1-sigma uncertainty is shown in Fig. 16(b).
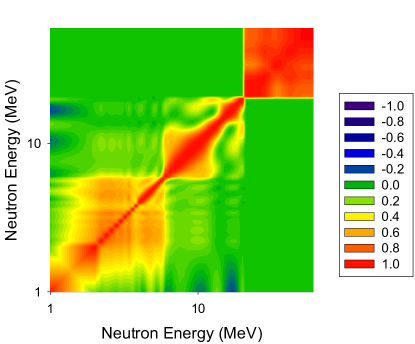

Reactions on the heavier isotopes of sulphur may lead to the same reaction product 32P. In particular, the cross sections for the 33S(n,np)32P reaction rises sharply above 12 MeV, but the natural abundance of 33S is only 0.75 %. However, at energies above 30 MeV the 34S(n,2np)32P may contribute to the 32P production, so the 32S(n,p)32P reaction monitor should not be used for high energy applications. The reaction S(n,X)32P should be used instead.
V.2.8 Zr(n,2n)Zr
The 90Zr(n,2n)89Zr reaction cross sections and covariances below 20 MeV were evaluated by Zolotarev Zol09 in 2009. Extension to 60 MeV was done at the IAEA based on TENDL-2013, renormalizing the cross sections at 20 MeV for continuity. Comparison of the cross sections with experimental data is shown in Fig. 17(a). The figure also shows the comparison between IRDF-2002 and IRDFF-II, which remained unchanged from version IRDFF-v1.05. Cross sections in different evaluated libraries differ significantly near threshold as shown in Fig. 17(b), where the ratios of the various evaluations to the IRDFF-II recommended cross section are given. These differences may be important if this reaction monitor is used in reactor spectra.
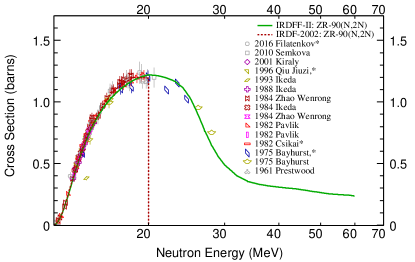
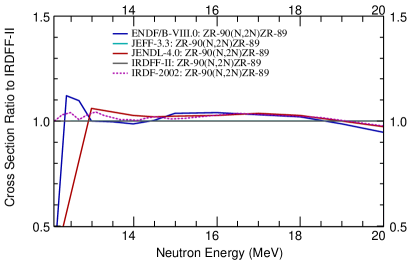
The plot of the correlation matrix for the 90Zr(n,2n)89Zr reaction is shown in Fig. 18(a). The plot of the 1-sigma uncertainty is shown in Fig. 18(b).
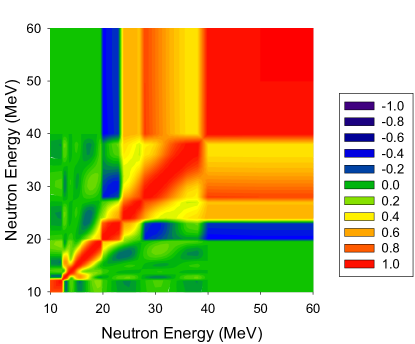

Reactions on the heavier isotopes of Zr may lead to the same reaction product 89Zr. In particular, the cross sections for the 91Zr(n,3n)89Zr reaction rises sharply above 20 MeV. The use of the Zr(n,X)89Zr reaction cross sections, which are present in the IRDFF-II library, is strongly recommended, even though the user should be aware that the minor contributing channels represent a correction and do not meet the dosimetry quality standards, so even the reaction Zr(n,X)89Zr should be used with caution in neutron fields with a significant contribution of neutrons with energies above 20 MeV.
V.2.9 Na(n,2n)Na
Sodium is a mono-isotopic naturally occurring element and is convenient for neutron dosimetry because it does not have competing reactions from different isotopes producing the same residual. The 23Na(n,2n)22Na has a relatively high threshold and the plateau above 20 MeV; it can be used for probing the very high-energy tail of the fission spectrum.
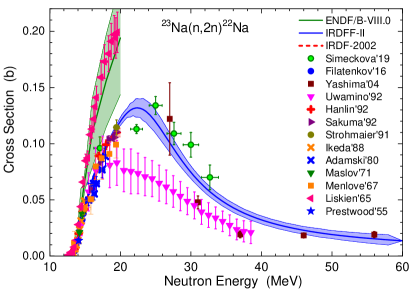
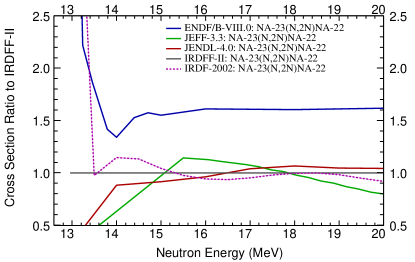
The 23Na(n,2n)22Na reaction cross sections and covariances in the entire energy range up to 60 MeV were evaluated by Zolotarev Zol17 in 2017. In 2019 this reaction cross section was measured at Nuclear Physics Institute of the Czech Academy of Sciences employing the p-Li quasi-monoenergetic neutrons with energies between 17 and 33 MeV Sim19 . As seen in Fig. 19(a), these data confirm the latest Zolotarev evaluation. The figure also shows the comparison between IRDF-2002 and IRDFF-II, which remained unchanged from version IRDFF-v1.05. Cross sections in different evaluated libraries differ significantly near threshold as shown in Fig. 19(b), where the ratios of the various evaluations to the IRDFF-II recommended cross section are given. The ENDF/B-VIII.0 evaluation followed a different set of experimental data. Therefore, differences are observed between evaluations, but also between measurements.
The covariance matrix of the 23Na(n,2n)22Na reaction cross sections is shown in Fig. 20(a) and the corresponding 1-sigma uncertainty in Fig. 20(b).
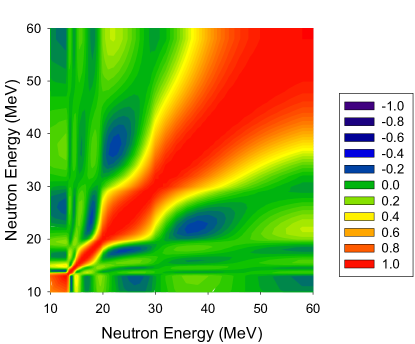

V.2.10 Na(n,)Na
The capture reaction has a strong resonance near 2.8 keV and is highly sensitive to the epithermal energies in reactor spectra. The 23Na(n,)24Na reaction resonance parameters, cross sections and covariances up to 20 MeV were also evaluated by Zolotarev Zol17 . Comparison of the cross sections with experimental data in the fast energy range is shown in Fig. 21(a). The figure also shows the comparison between IRDF-2002 and IRDFF-II, which is different from IRDFF-v1.05. Cross sections in different evaluated libraries differ significantly as shown in Fig. 21(b), where the ratios of the various evaluations to the IRDFF-II recommended cross section are given.
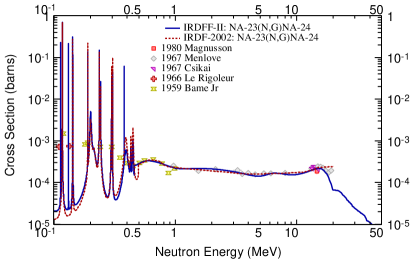
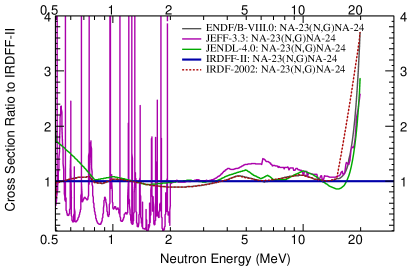
The covariance matrix of the 23Na(n,)24Na reaction cross sections is shown in Fig. 22(a) and the corresponding 1-sigma uncertainty in Fig. 22(b).
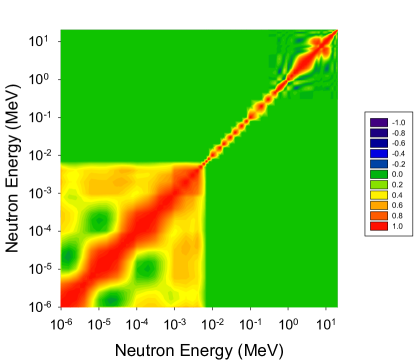

V.2.11 Mg(n,p)Na
The 24Mg(n,p)24Na reaction cross sections and covariances below 21 MeV were evaluated by Zolotarev Zol08 in 2008. Extension to 60 MeV was done at the IAEA based on TENDL-2010, renormalizing the cross sections at 21 MeV for continuity. Comparison of the cross sections with experimental data is shown in Fig. 23(a). The figure also shows the comparison between IRDF-2002 and IRDFF-II, which remained unchanged from version IRDFF-v1.05. Cross sections in different evaluated libraries differ significantly near threshold as shown in Fig. 23(b), where the ratios of the various evaluations to the IRDFF-II recommended cross section are given. These differences may be important if this reaction monitor is used in reactor spectra.
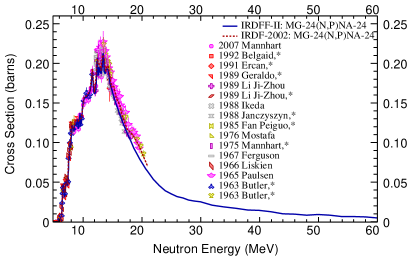
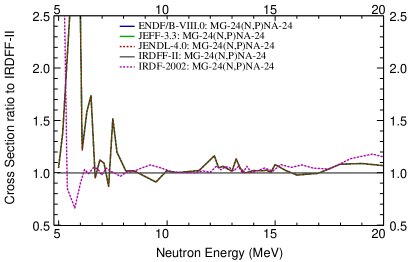
The plot of the correlation matrix for the 24Mg(n,p)24Na reaction is shown in Fig. 24(a). The plot of the 1-sigma uncertainty is shown in Fig. 24(b).
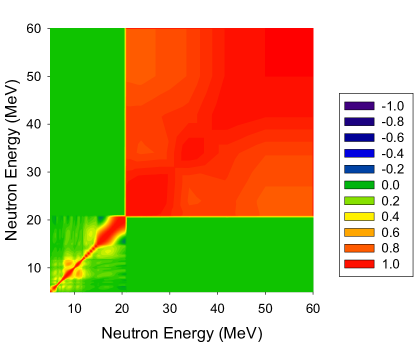

Reactions on the heavier isotopes of Mg may lead to the same reaction product 24Na. In particular, the cross sections for the 25Mg(n,np)24Na reaction rises sharply above 18 MeV. The use of the Mg(n,X)24Na reaction cross sections, which are present in the IRDFF-II library, is strongly recommended, especially for neutron fields that have a significant fraction of neutrons with energies above 18 MeV. However, the user should be aware that the minor contributing channels represent a correction and do not meet the same dosimetry quality standards.
V.2.12 Mg(n,X)Na
The major contribution to the 24Na production comes from the 24Mg(n,p)24Na reaction, which is present in the IRDFF-II library, supplemented by the contributions of other channels, including 25Mg(n,np), 25Mg(n,d), 26Mg(n,2np), 25Mg(n,nd) and 25Mg(n,t) that are taken from the TENDL-2015 library. The contribution from the 25Mg(n,np) rises sharply above about 18 MeV. The uncertainty and the covariance matrix below this energy are practically the same as for 24Mg(n,p)24Na; see the uncertainties plotted in Fig. 26. It is strongly recommended to use Mg(n,X)24Na reaction cross sections, especially in neutron fields with a significant fraction of neutrons with energies above 15 MeV.
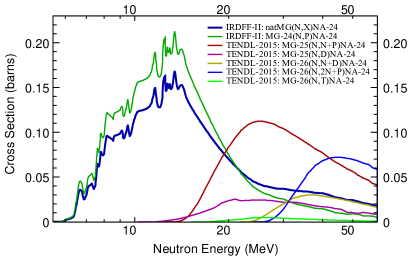

V.2.13 Al(n,p)Mg
The 27Al(n,p)27Mg reaction cross sections were evaluated by Zolotarev up to 22 MeV in 2004 Zol04 . Extension to 60 MeV was done at the IAEA based on TENDL-2010, renormalizing the cross sections at 22 MeV for continuity. Comparison of the cross sections with experimental data is shown in Fig. 27(a). The figure also shows the comparison between IRDF-2002 and IRDFF-II, which remained unchanged from version IRDFF-v1.05.
Cross sections in different evaluated libraries are shown in Fig. 27(b) as ratios of the various evaluations to the IRDFF-II recommended cross section.
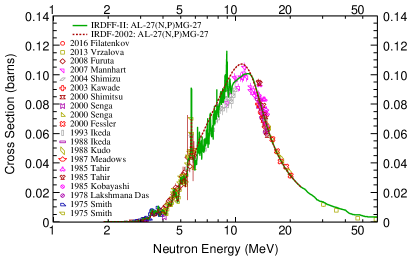
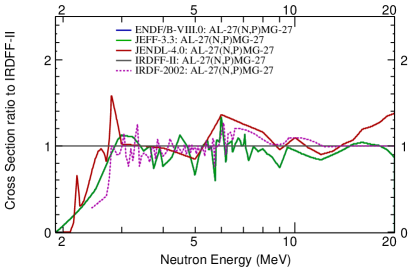
The plot of the correlation matrix for the 27Al(n,p)27Mg reaction is shown in Fig. 28(a). The plot of the 1-sigma uncertainty is shown in Fig. 28(b).
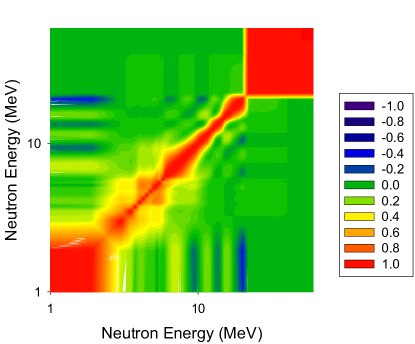

V.2.14 Al(n,)Na
In 2004 the 27Al(n,)24Na reaction cross sections were evaluated by Zolotarev up to 40 MeV Zol09 , but the cross sections had unphysical behaviour above 30 MeV. Extension between 30 MeV and 60 MeV was done at the IAEA based on TENDL-2010, renormalizing the cross sections at 30 MeV for continuity. Comparison of the cross sections with experimental data is shown in Fig. 29(a). The figure also shows the comparison between IRDF-2002 and IRDFF-II, which remained unchanged from version IRDFF-v1.05. Cross sections in different evaluated libraries are shown in Fig. 29(b) as ratios of the various evaluations to the IRDFF-II recommended cross section.
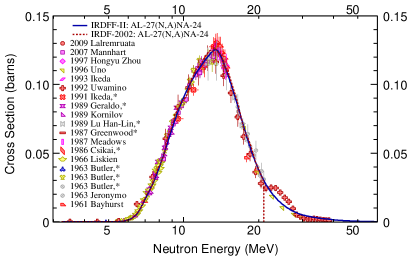
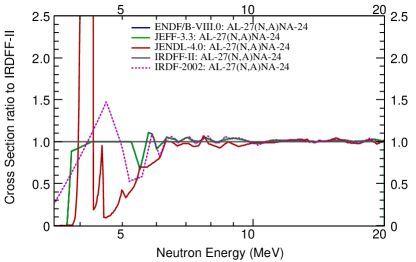
The plot of the correlation matrix for the 27Al(n,)24Na reaction is shown in Fig. 30(a). The plot of the 1-sigma uncertainty is shown in Fig. 30(b).
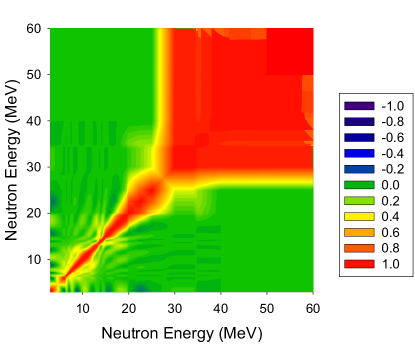

Aluminium is a convenient monitor for neutron dosimetry because it is a mono-isotopic element. However, at energies above 30 MeV there appear competing reactions that produce the same 24Na residual. It is strongly recommended to use 27Al(n,X)24Na reaction cross sections, which are provided in IRDFF-II, especially in neutron fields with a significant fraction of neutrons with energies above 30 MeV.
V.2.15 Ti(n,p)Sc
The 47Ti(n,p)47Sc reaction cross sections were evaluated by Zolotarev up to 20 MeV in 2002 for the Russian Dosimetry Library RRDF-2002 within the BROND-2 project. Extension to 60 MeV was done at the IAEA based on TENDL-2011, renormalizing the cross sections at 22 MeV for continuity. Comparison of the cross sections with experimental data is shown in Fig. 31(a). The figure also shows the comparison between IRDF-2002 and IRDFF-II, which remained unchanged from version IRDFF-v1.05. Cross sections in different evaluated libraries are shown in Fig. 31(b) as ratios of the various evaluations to the IRDFF-II recommended cross section.
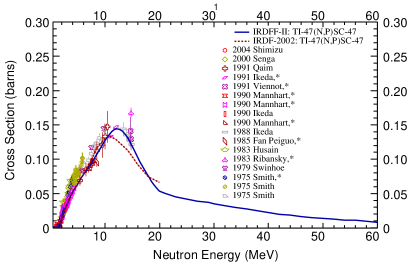
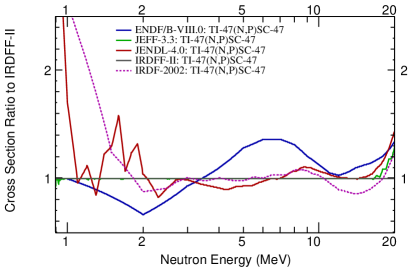
The plot of the correlation matrix for the 47Ti(n,p)47Sc reaction is shown in Fig. 32(a). The plot of the 1-sigma uncertainty is shown in Fig. 32(b).
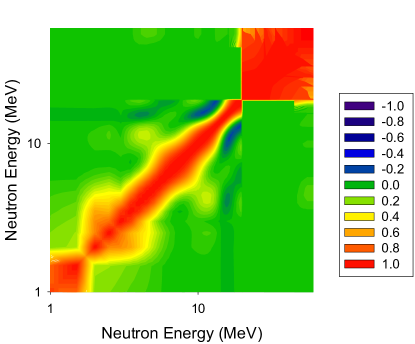

Titanium is a monitor elemental material that has a large number of naturally occuring isotopes that lead to the same residual. The 47Ti(n,p)47Sc reaction is just one example, where the residual 47Sc can be produced from the heavier isotopes in reactions like 48Ti(n,np)47Sc, etc. The heavier isotopes begin to contribute at energies around 14 MeV. For this reason, Reactions like Ti(n,X)47Sc were introduced into the IRDFF-II library, as illustrated in the section below.
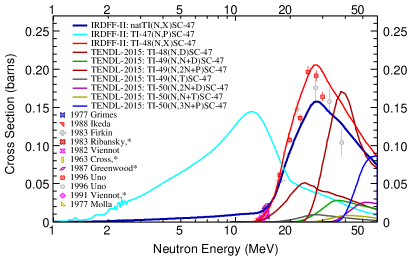
V.2.16 Ti(n,X)Sc
The major contribution to the 47Sc production comes from the 47Ti(n,p)47Sc reaction, which is present in the IRDFF-II library, supplemented by the contributions of other channels, including 48Ti(n,np), 48Ti(n,d), 49Ti(n,2np), 49Ti(n,nd), 49Ti(n,t), 50Ti(n,2nd), 50Ti(n,nt) and 50Ti(n,3np) that are taken from the TENDL-2015 library. Relevant cross sections are compared to the available experimental data in Fig. 33. The contribution from the 48Ti(n,np+pn) rises sharply above about 14 MeV. The uncertainty and the covariance matrix below this energy are practically the same as for the 47Ti(n,p)47Sc reaction. It is strongly recommended to use Ti(n,X)47Sc reaction cross section for neutron dosimetry applications, especially in neutron fields with a significant fraction of neutrons with energies above 14 MeV.
V.2.17 Co(n,2n)Co and Co(n,3n)Co
The 59Co(n,2n)58Co reaction cross sections and covariances in energy range up to 20 MeV were evaluated by Zolotarev Zol09 in 2009. Extension to 60 MeV was done at the IAEA based on TENDL-2010, renormalizing the cross sections at 20 MeV for continuity.
The 59Co(n,3n)57Co reaction cross sections and covariances in energy range up to 20 MeV were evaluated by Zolotarev Zol10 in 2010. Extension to 60 MeV was done at the IAEA based on TENDL-2010, renormalizing the cross sections at 20 MeV for continuity. Comparison of the cross sections with experimental data for both reactions is shown in Fig. 34(a). The reaction cross sections were not present in IRDF-2002. In IRDFF-II they remained unchanged from version IRDFF-v1.05. The 59Co(n,2n)58Co cross sections in different evaluated libraries differ significantly near threshold as shown in Fig. 34(b), where the ratios of the various evaluations to the IRDFF-II recommended cross section are given. The cross sections in JENDL/AD-2017 are significantly lower compared to other evaluations.
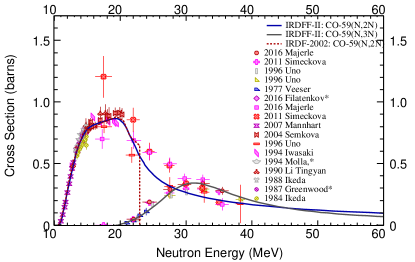
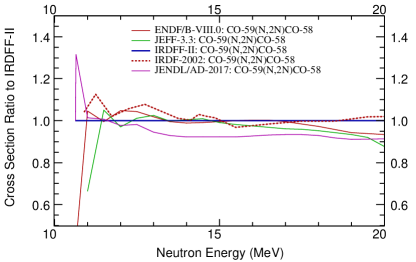

The plot of the 1-sigma uncertainty for the 59Co(n,3n)57Co reaction is shown in Fig. 35.
The plot of the correlation matrix for the 59Co(n,2n)58Co reaction is shown in Fig. 36(a). The plot of the 1-sigma uncertainty is shown in Fig. 36(b).
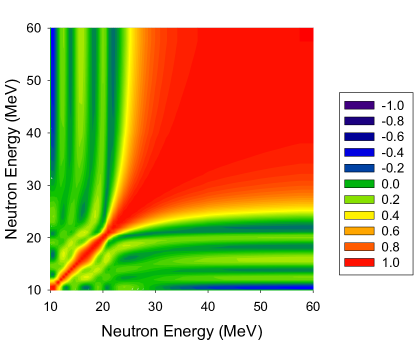

The 59Co(n,2n)58Co and 59Co(n,3n)57Co reactions are examples of monitor reactions that can be used to probe neutron fields at higher energies.
V.2.18 Mn(n,2n)Mn
The 55Mn(n,2n)54Mn reaction cross sections and covariances in energy range up to 20 MeV were evaluated by Zolotarev Zol09 in 2009. Extension to 60 MeV was done at the IAEA based on TENDL-2010, renormalizing the cross sections at 20 MeV for continuity. Comparison of the cross sections with experimental data is shown in Fig. 37(a). The reaction cross sections were not present in IRDF-2002. In IRDFF-II they were updated in version IRDFF-v1.05. The 55Mn(n,2n)54Mn cross sections in different evaluated libraries differ significantly near threshold as shown in Fig. 37(b), where the ratios of the various evaluations to the IRDFF-II recommended cross section are given.
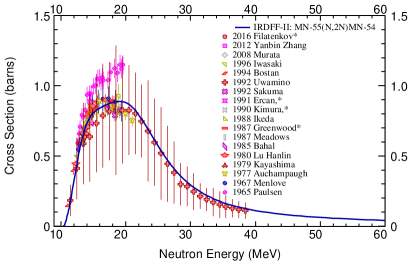
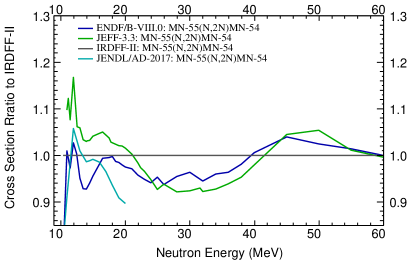
The plot of the correlation matrix for the 55Mn(n,2n)54Mn reaction is shown in Fig. 38(a). The plot of the 1-sigma uncertainty is shown in Fig. 38(b).
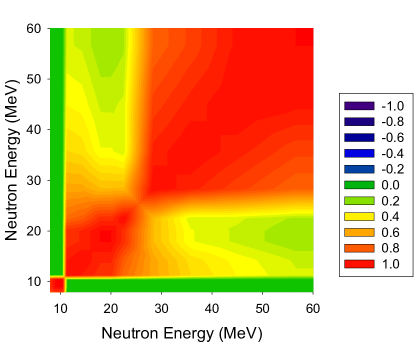

The 55Mn(n,2n)54Mn reaction is also one that can be used to probe neutron fields at higher energies.
V.2.19 Zn(n,p)Cu
The 67Zn(n,p)67Cu reaction cross sections and covariances in energy range up to 20 MeV were evaluated by Zolotarev Zol08 in 2008. Extension to 60 MeV was done at the IAEA based on TENDL-2010, renormalizing the cross sections at 20 MeV for continuity. This reaction is exothermic and has a positive Q-value, therefore it has no real threshold. However, the difference is the relatively large thermal capture cross section. The capture cross sections from JENDL-4 were re-scaled to give a thermal value of 0.00123 barns and adjusted above 600 keV to join smoothly with the (n,p) cross section evaluation by Zolotarev. A fully correlated uncertainty of 25 % was assigned arbitrarily to the cross sections below the pseudo-threshold. The plot of the cross sections is shown in Fig. 39(a). The cross sections for this reaction were not present in IRDF-2002. In IRDFF-II they remained unchanged from version IRDFF-v1.05. The 67Zn(n,p)67Cu cross sections in different evaluated libraries differ significantly, especially near the apparent threshold as shown in Fig. 39(b), where the ratios of the various evaluations to the IRDFF-II recommended cross section are given.
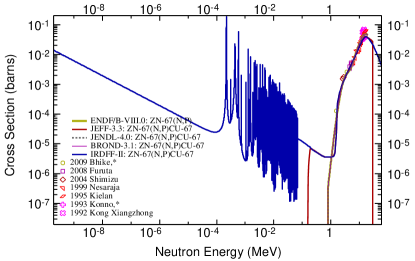
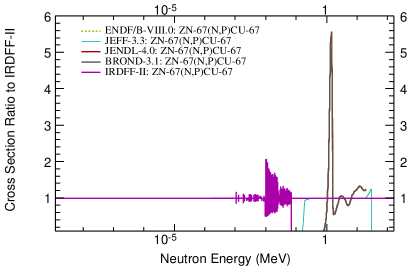
The plot of the correlation matrix for the 67Zn(n,p)67Cu reaction is shown in Fig. 40(a). The plot of the 1-sigma uncertainty is shown in Fig. 40(b).
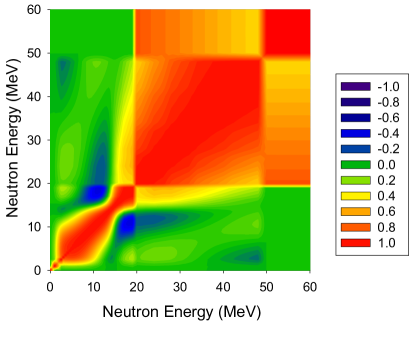

The 67Zn(n,p)67Cu reaction is an example of a reaction with a positive Q-value, where the cross sections were extended down to thermal energies and a resonance evaluation was included.
V.2.20 Hg(n,n’)Hg
The 199Hg(n,n’)199mHg reaction cross sections and covariances in energy range up to 20 MeV were evaluated by Zolotarev Zol08 in 2008. Extension to 60 MeV was done at the IAEA based on TENDL-2010, renormalizing the cross sections at 20 MeV for continuity. Comparison with experimental data is shown in Fig. 41(a). The figure also shows the comparison between IRDF-2002 and IRDFF-II, which remained unchanged from version IRDFF-v1.05. The 199Hg(n,n’)199mHg cross sections represent the excitation of a metastable state and are not present in other major libraries, hence only the comparison with IRDF-2002 is shown in Fig. 41(b), where the ratios to the IRDFF-II recommended cross section are given.
5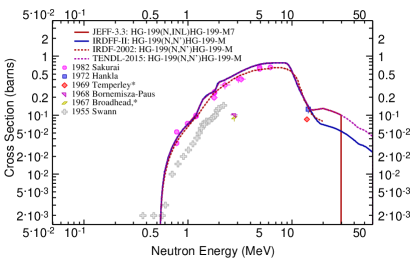
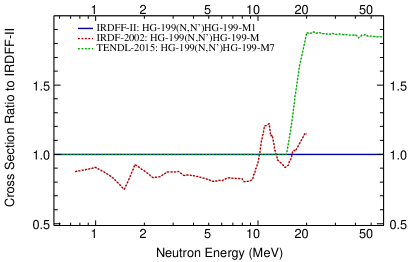
The plot of the correlation matrix for the 199Hg(n,n’)199mHg reaction is shown in Fig. 42(a). The plot of the 1-sigma uncertainty is shown in Fig. 42(b).
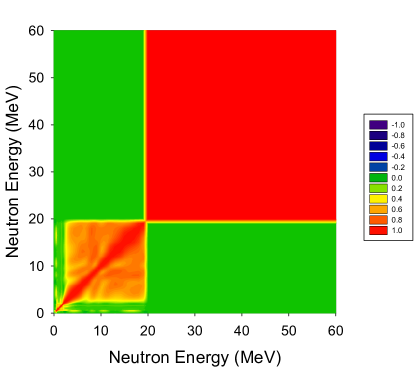

V.2.21 Y(n,2n)Y
The 89Y(n,2n)88Y reaction cross sections and covariances in energy range up to 20 MeV were evaluated by Zolotarev Zol09 in 2009. Extension to 60 MeV was done at the IAEA based on TENDL-2010, renormalizing the cross sections at 20 MeV for continuity. Comparison of the cross sections with experimental data is shown in Fig. 43(a). The figure also shows the comparison between IRDF-2002 and IRDFF-II, which remained unchanged from version IRDFF-v1.05.
The 89Y(n,2n)88Y cross sections in different evaluated libraries differ significantly near threshold as shown in Fig. 43(b), where the ratios of the various evaluations to the IRDFF-II recommended cross section are given.
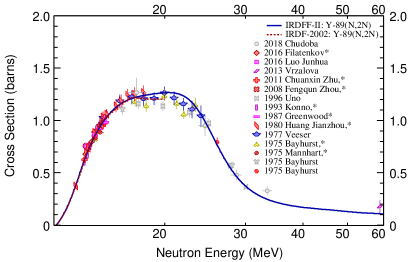
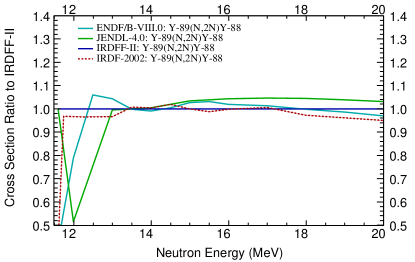
The plot of the correlation matrix for the 89Y(n,2n)88Y reaction is shown in Fig. 44(a). The plot of the 1-sigma uncertainty is shown in Fig. 44(b).
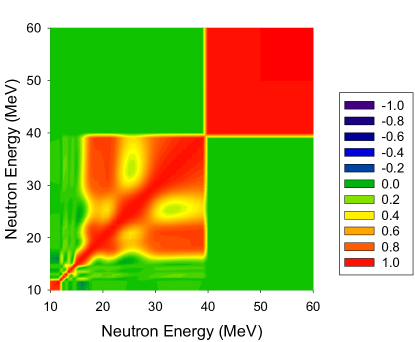

The 89Y(n,2n)88Y reaction is another one that can be used to probe neutron fields at higher energies.
V.2.22 Tm(n,2n)Tm and Tm(n,3n)Tm
The 169Tm(n,2n)168Tm reaction cross sections and covariances in energy range up to 40 MeV were evaluated by Zolotarev Zol10 . Extension to 60 MeV was done at the IAEA based on TENDL-2010, renormalizing the cross sections at 40 MeV for continuity. The 169Tm(n,3n)167Tm reaction cross sections and covariances in energy range up to 60 MeV were evaluated by Zolotarev Zol13 in 2003; no extension in energy was necessary. Comparison of the cross sections with experimental data for 169Tm(n,2n)168Tm and 169Tm(n,3n)167Tm reactions is shown in Figs. 45(a) and 46(a), respectively. The differences in reaction cross sections for 169Tm(n,2n)168Tm from IRDF-2002 are shown, which were unchanged in IRDFF-II. The cross sections for 169Tm(n,3n)167Tm were not present in IRDF-2002; in IRDFF-II they remained unchanged from version IRDFF-v1.05. The 169Tm(n,2n)168Tm cross sections in different evaluated libraries differ near threshold are shown in Fig. 45(b), where the ratios of the various evaluations to the IRDFF-II recommended cross section are given. Differences in the 169Tm(n,3n)167Tm cross sections are even larger. Fig. 46(b) includes experimental data, which tend to support the IRDFF-II evaluation.
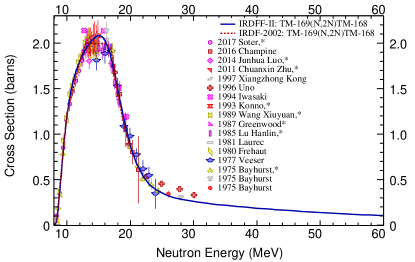
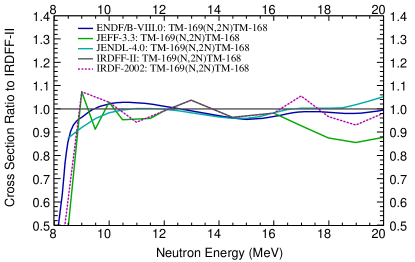
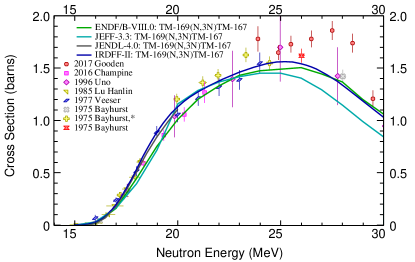
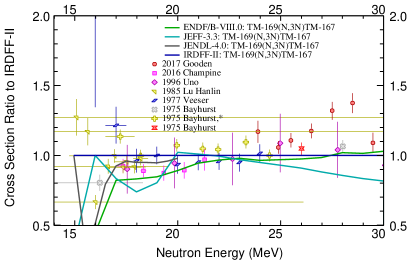
The plot of the correlation matrix for the 169Tm(n,2n)168Tm reaction is shown in Fig. 47(a). The plot of the 1-sigma uncertainty is shown in Fig. 47(b).
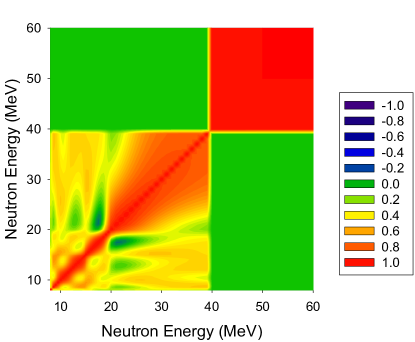

The plot of the correlation matrix for the 169Tm(n,3n)167Tm reaction is shown in Fig. 48(a). The plot of the 1-sigma uncertainty is shown in Fig. 48(b).
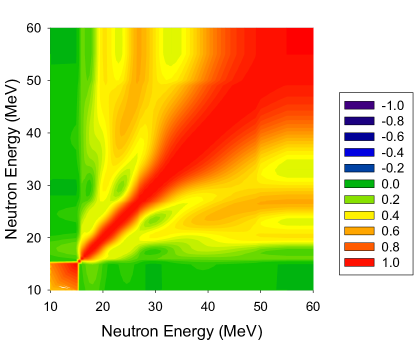

The 169Tm(n,2n)168Tm and 169Tm(n,3n)167Tm reactions are examples of monitor reactions that can be used to probe neutron fields at higher energies.
V.2.23 Bi(n,3n)Bi, Bi(n,4n)Bi, and Bi(n,5n)Bi
The 209Bi reaction cross sections for multiple neutron emission with n=2–6 were evaluated up to 100 MeV by Pronyaev in 2013 using a GMA code and smoothed and extended up to 400 MeV by Pronyaev in 2019. Comparison of the cross sections for 209Bi(n,3n), 209Bi(n,4n) and 209Bi(n,5n) reactions with experimental data is shown in Fig. 49. No comparison with other libraries is given, since the evaluated cross sections from other libraries do not extend to energies above 20 MeV which are supported by the new IRDFF-II library. The cross sections for these reactions were not present in IRDF-2002.
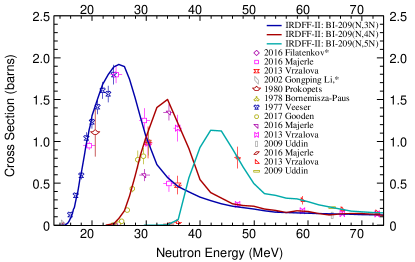
As an example for these reactions, the plot of the correlation matrix for the 209Bi(n,3n)207Bi reaction is shown in Fig. 50(a). The plot of the 1-sigma uncertainty is shown in Fig. 50(b).
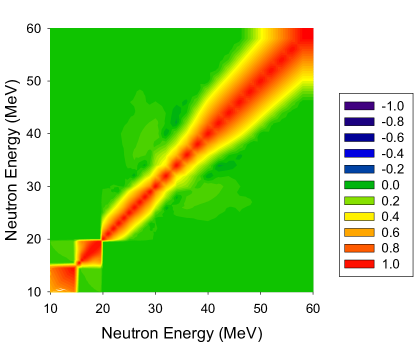

The 209Bi(n,xn) reactions in the IRDFF-II library are examples of monitor reactions that are intended for probing high-energy neutron fields that extend well above 10 MeV up to the maximum energy of 60 MeV.
V.2.24 Np(n,f)
The cross sections for the 237Np(n,f) reaction below 0.5 MeV were taken from the JEFF-3.3 evaluation. In the energy interval 0.5–20 MeV the data were taken from RRDF-2002. Above this energy the JENDL-4/HE evaluation was used, but it does not include the covariances. The difference in the cross sections from TENDL-2015 in 11 subintervals was calculated and the relative difference was added to the diagonal term of the TENDL-2015 covariance matrix in the 20 MeV to 60 MeV energy interval to account for the fact that the original covariances do not correspond to the same cross section evaluation. Comparison of the cross sections with experimental data is shown in Fig. 51(a). The 237Np(n,f) cross sections in different evaluated libraries are shown in Fig. 51(b), where the ratios of the various evaluations to the IRDFF-II recommended cross section are given. Eigenvalues of covariances were checked to be positive, but it is worth noting that the quality of the evaluation above 20 MeV should be improved if this reaction will be used at those energies.
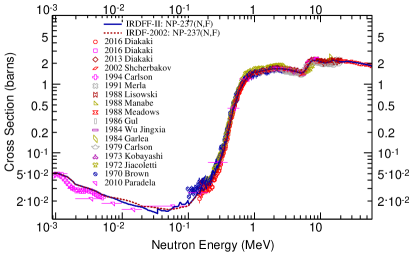
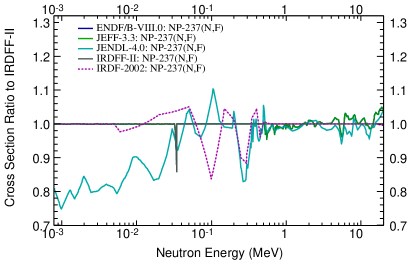
The plot of the correlation matrix for the 237Np(n,f) reaction is shown in Fig. 52(a). The plot of the 1-sigma uncertainty is shown in Fig. 52(b).
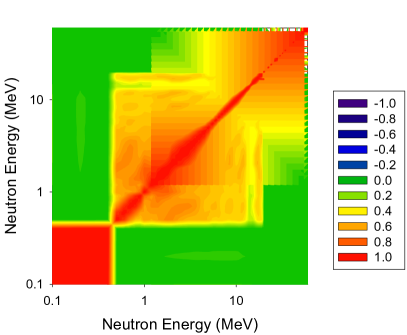

V.2.25 Au(n,)Au, U(n,f), U(n,f), U(n,)U, B(n,)Li, and Li(n,t)He
The reactions in this section are Neutron Standards (or reaction cross section evaluated together with the Standards) in certain limited energy ranges and are described in detail in a previous publication Car18 . What is shown here are examples, where the content of the IRDFF-II library significantly exceeds the energy range of the IAEA Standards 2017.
The 197Au(n,)198Au reaction cross sections are compared to experimental data in Fig. 53(a). The capture cross sections of gold are probably the best known capture cross sections over a broad energy range; this is why they are declared a standard at thermal and in the energy range 0.2 MeV to 2.5 MeV Sch14 . The ENDF/B-VIII.0 evaluation is consistent with the IAEA Standards 2017 for this reaction, hence it was adopted for IRDFF-II. Comparison with other evaluations is shown as ratio to IRDFF-II in Fig. 53(b) for the fast energy range, since the comparison in the resonance range is not meaningful due to the resonances.
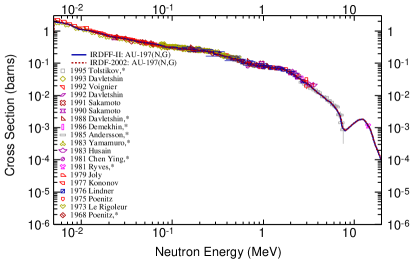
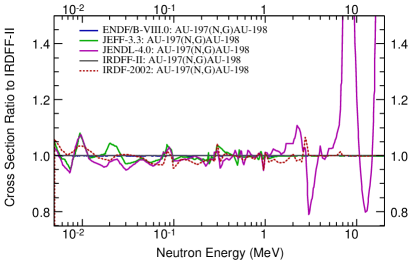
The correlation matrix is given in Fig. 54(a) and the corresponding uncertainty is shown in Fig. 54(b).
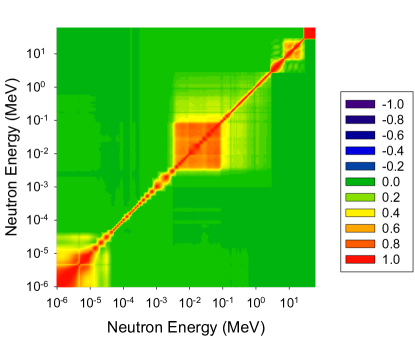

The tritium and 4He production reaction 6Li(n,t)4He has also been evaluated for the IAEA Neutron Standards 2017 in the energy range from 0.0253 eV to 1.4 MeV, being the standard energy region from the thermal point up to 1 MeV. The actual evaluation was performed over a broader energy range and is consistent with the contents of ENDF/B-VIII.0 up to 20 MeV. However, by a careful consideration of available experimental evidence it was concluded that the structure in the cross section near 5 MeV that appears in the ENDF/B-VIII.0 is questionable. Note that this regions is well outside the Neutron Standards range. At 2.75 MeV and between 8 MeV and 20 MeV the ENDF/B-VIII.0 cross sections for this reaction are equal to those in EAF-2010. To smooth out the structure in the ENDF/B-VIII.0 cross sections the data form EAF-2010 were adopted above 2.75 MeV up to 60 MeV. In this respect IRDFF-II differs from ENDF/B-VIII.0. Comparison of the cross sections for the 6Li(n,X)3H reaction with experimental data and with ENDF/B-VIII.0 and IRDFF-II is shown in Fig. 55, from which the anomalous behaviour of the ENDF/B-VIII.0 cross sections can be seen.
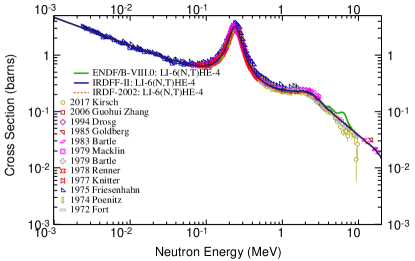
The correlation matrix is given in Fig. 56(a) and the corresponding uncertainty is shown in Fig. 56(b).
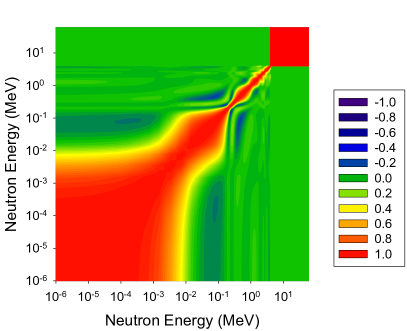

The 10B(n,) reaction cross section was also evaluated as part of the IAEA Neutron Standards 2017 from thermal to 1 MeV Car18 . Both (n,) reactions on the ground and the first excited state of the 10B target were evaluated and coded as MT=800 and MT=801 in ENDF-6 format. The ENDF/B-VIII.0 evaluation is consistent with these Standards.
V.2.26 Li(n,X)H and Li(n,X)He
| MT | LR | Gas | Reaction | Products | Source evaluations of IRDFF-II | ||
|---|---|---|---|---|---|---|---|
| 105 | 3H | 6Li(n,t)4He | 3H + 4He | EAF-2010(r) () | ENDF/B-VIII.0 () | ||
| 24 | 4He | 6Li(n,2n) | 2n + 4He + 1H | EAF-2010(r) () | ENDF/B-VIII.0 () | ||
| 32 | 6Li(n,nd) | n + 2H + 4He | EAF-2010(r) () | ENDF/B-VIII.0 MT51,52,… | |||
| 51,52,… | 32 | 6Li(n,n’) | n + (6Li 2H + 4He) | ENDF/B-VIII.0 () | |||
| 105 | 6Li(n,t)4He | 3H + 4He | EAF-2010(r) () | ENDF/B-VIII.0 () | |||
The gas-production reactions from neutrons incident on light targets were not evaluated separately. Direct tritium production in 6Li, with 4He as the residual was evaluated within IAEA Standards 2017 Car18 and is described in Sec. V.2.25. Other gas-production cross sections were assembled by reviewing existing evaluated data libraries and choosing the most appropriate combination of data, as described below. In particular, the libraries that were considered include ENDF/B-VIII.0, EAF-2010 European Activation File and TENDL-2015 sublibrary ”s60”, which contains explicit cross section representation with covariances up to 60 MeV. The TENDL-2015.s60 library comes from TALYS nuclear model calculations, which are not best suited for light nuclei, but the library was considered because of its completeness in terms of reactions. However, TENDL-2015 library was found inappropriate for neutron induced reactions on boron and lithium isotopes by extensive comparison with available experimental data and other available evaluations, and will not be discussed in this subsection.
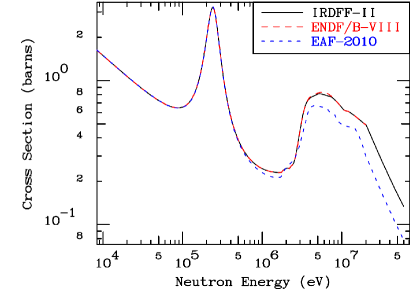
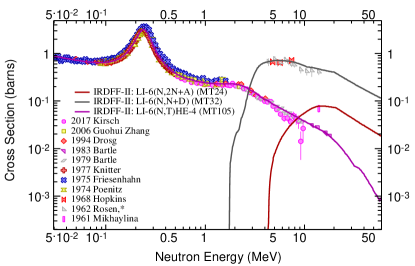
Tritium production from 6Li in IRDFF-II corresponds uniquely to the 6Li(n,t)4He reaction (ENDF-6 MT 105), which is a Neutron Standard up to 1 MeV and was discussed in the previous section; a comparison of the cross section with experimental data and with ENDF/B-VIII.0 is shown in Fig. 55.
Cross sections for the 3He production are only available in the TENDL-2015 library, and were neglected for the assembly of the IRDFF-II library.
Since the neutron metrology community also uses mass spectrometry methods to measure 4He production in materials such as 6Li, the new IRDFF-II library also includes this reaction. The 4He nucleus is the residual of the 6Li(n,t) reaction that is discussed in Sec. V.2.26. There are other reaction channels that can produce 4He, as can be seen in Table 12. As a contributor to the 4He production, all libraries contain the reaction 6Li(n,2n) (MT 24). The ENDF/B-VIII.0 evaluation was adopted up to 20 MeV, and the EAF-2010 library from 20 up to 60 MeV, renormalized for continuity at 20 MeV. The EAF-2010 library contains reaction 6Li(n,nd) MT 32 explicitly, while in the ENDF/B-VIII.0 library this reaction is represented by discrete level inelastic cross sections 6Li(n,n’) of the MT 50 series, with a consecutive break-up of the residual. Note that not all discrete levels contribute to the 4He production, governed by the LR flag in the ENDF file. The MT 32 contribution reconstructed from the discrete inelastic levels in the ENDF/B VIII.0 library was adopted for IRDFF-II, while renormalized EAF-2010 cross sections were adopted from 20 up to 60 MeV. The total 4He production in IRDFF-II is higher than in EAF-2010 library due to the larger cross section from the 6Li(n,n’) channels. Fig. 57(a) compares the 4He gas production cross sections in IRDFF-II, ENDF/B-VIII.0 and EAF-2010 libraries. Fig. 57(b) shows the relative contribution to the 4He production cross section from the various reaction channels in IRDFF-II.
V.2.27 Li(n,X)H and Li(n,X)He
Since elemental Li is composed of both 6Li and 7Li, different enrichments of Li are often used in neutron metrology measurements. Thus, the IRDFF-II library also provides the tritium and 4He gas-production cross sections in 7Li. This enables users to combine the cross sections in a manner that represents the composition of their dosimeters.
The list of reactions contributing to tritium production is shown in Table 13. In the EAF-2010 library the tritium production is represented by reaction 7Li(n,n) MT 22, while in the ENDF/B VIII.0 library this reaction is represented by discrete level inelastic cross sections 7Li(n,n’) of the MT 50 series, with a consecutive break-up of the residual from most of the discrete levels into 3H and 4He. Reaction MT 33 reconstructed from the discrete inelastic levels from ENDF/B VIII.0 was adopted for IRDFF-II, extrapolated above 20 MeV with MT 22 from EAF-2010 since the two reactions produce the same set of emitted particles. The tritium production cross sections are plotted in Fig. 58. The bumps in the cross section near threshold come from the contributions of different discrete levels. The ENDF/B-VIII.0 cross sections are equal to IRDFF-II and are not included in the plot.
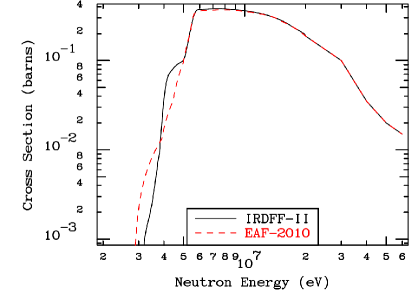
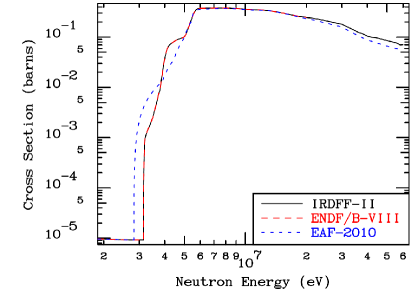
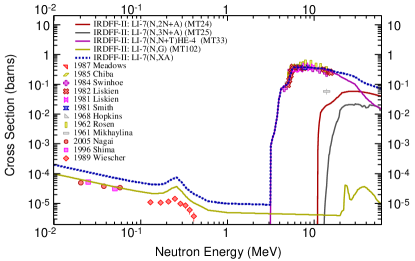
| MT | LR | Gas | Reaction | Products | Source evaluations of IRDFF-II | ||
| 22 | 3H | 7Li(n,n) | n + 4He + 3H | EAF-2010(r) () | |||
| 52,53,… | 33 | 7Li(n,n’) | n + (7Li∗ 3H + 4He) | ENDF/B-VIII.0 () | |||
| 33 | 7Li(n,nt) | n + 3H + 4He | EAF-2010(r) MT22 | ENDF/B-VIII.0 MT 52,53,… | |||
| 24 | 7Li(n,2n) | 2n + 4He + 2H | EAF-2010(r) () | ENDF/B-VIII.0 () | |||
| 25 | 7Li(n,3n) | 3n + 4He + 1H | EAF-2010(r) MT28 | ENDF/B-VIII.0 () | |||
| 28 | 7Li(n,np) | 3n + 4He + 1H | EAF-2010(r) () | ||||
| 22 | 4He | 7Li(n,n) | n + 4He + 3H | EAF-2010(r) () | |||
| 52,53,… | 33 | 7Li(n,n’) | n + (7Li∗ 3H + 4He) | ENDF/B-VIII.0 () | |||
| 33 | 7Li(n,nt) | n + 3H + 4He | EAF-2010(r) MT22 | ENDF/B-VIII.0 MT 52,53,… | |||
| 102 | 7Li(n,) | 8Li (0.8 s) (8Be 2 4He) | EAF-2010(r) () | ENDF/B-VIII.0 () | |||
Cross sections for the 3He production are only available in the TENDL-2015 library. The reaction threshold is near 30 MeV. The absolute magnitude of the cross sections is about 2 mb at the peak, according to TENDL-2015. Considering that the data from TALYS calculations for the gas production data in light elements in TENDL-2015.s60 are not reliable and there is no alternative source for the 3He production reaction cross sections, these cross sections were not included in the IRDFF-II library.
The list of reactions contributing to 4He production is also shown in Table 13. The libraries EAF-2010 and ENDF/B-VIII.0 contain reactions 7Li(n,2n) MT 24 and 7Li(n,) MT 102; the latter is adopted for IRDFF-II. The ENDF/B-VIII.0 library contains discrete inelastic levels where the residual is flagged to break up as 7Li(n,nt) MT 33. The summed contributions from the respective levels are stored in IRDFF-II as MT 33. The EAF-2010 library takes a different approach, it contains the 7Li(n,n) MT 22 reaction, which involves exactly the same outgoing particles. The ENDF/B-VIII.0 library also contains the MT 25 reaction, which has a higher threshold and is not present in EAF-2010. This reaction was adopted from ENDF/B-VIII.0 and extrapolated to 60 MeV with the shape of the 7Li(n,np) reaction, which is mostly equivalent. The contribution of this reaction is mainly responsible for the higher total alpha-production cross section in IRDFF-II compared to EAF-2010. The 4He production cross sections from different libraries are plotted in Fig. 59(a) and the contribution of different reaction channels in IRDFF-II are shown in Fig. 59(b). Note the capture cross section as a contributor to the 4He production at low energies. Two alpha particles are produced after the disintegration of the capture product, hence the 4He production cross section is by a factor of two higher than the capture cross section itself.
There is an issue regarding the 7Li(n,) MT 102 reaction, which is found in all libraries and is also included in IRDFF-II. The residual is 8Li, and this nuclide decays into 8Be with a half-life of 0.5 s, which, in turn, breaks up almost instantaneously into two alpha particles. In general, the contribution of this reaction is small, but it is the only contribution to alpha production at thermal energies –- a region where the cross section is about 0.1 b – and its multiplicity is two. Beware that the contribution of this reaction is not included in the gas production cross sections generated from the ENDF/B-VIII.0 data with the current version of the NJOY-2016 code because the reaction is not flagged for break-up. Due to the very short half-life involved, the radiative capture reaction was included as a contributor to alpha production in the present work for IRDFF-II.
V.2.28 Li(n,X)He
In order to support application of the IRDFF-II library to irradiations that use a lithium dosimeter having naturally occurring lithium with nominal abundances for 6Li and 7Li, the IRDFF-II library also provides an entry for the 4He gas production on elemental lithium. The cross sections for the gas production in natural element lithium were constructed from the isotopic data in IRDFF-II using the recommended natural abundance data. Fig. 60 compares the 4He gas production on 6Li, 7Li, and Li targets. The 4He gas production cross sections of Li are normalized per Li atom of the element with an average mass.
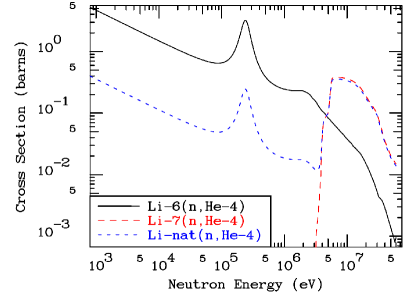
V.2.29 B(n,X)He
Gas production in the boron isotopes is very complex because many reactions contribute and very often the residual nuclei undergo further break-up. The complexity of the gas production cross sections in terms of contributing reactions is captured in Table 14. As in the case of Li, the cross sections from the TENDL-2015 library are not considered in the analysis because boron is a light element and TALYS calculations underlying TENDL-2015.s60 are not appropriate in such cases. The discussion in this section is limited to the 4He production from neutrons incident on 10B, for tritium production relevant contributing reactions are listed in Table 14.
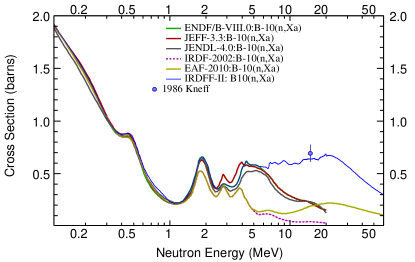
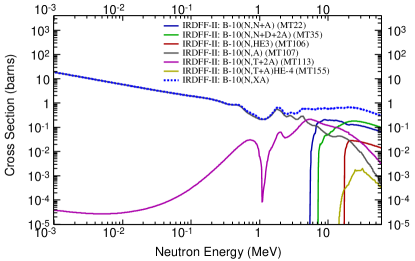
| MT | LR | Gas | Reaction | Products | Source evaluations of IRDFF-II | ||
| 105 | 3H | 10B(n,t) | 3H + (8Be∗ 2 4He) | EAF-2010(r) () | |||
| 700 | 10B(n,t) | 3H + (8Be∗ 2 4He) | ENDF/B-VIII.0 () | ||||
| 113 | 10B(n,t2) | 3H + 2 4He | EAF-2010(r) MT105 | ENDF/B-VIII.0 MT700 | |||
| 155 | 10B(n,t) | 3H + 2 4He | EAF-2010 | ||||
| 106 | 3He | 10B(n,3He) | 3He + (8Li 8Be∗ 2 4He) | EAF-2010 | |||
| 22 | 4He | 10B(n,n) | n + 4He + 6Li | EAF-2010(r) () | ENDF/B-VIII.0 MT55,56,… | ||
| 32 | 10B(n,nd) | n + 2H + (8Be∗ 2 4He) | EAF-2010(r) () | ||||
| 35 | 10B(n,nd2) | n + 2H + 2 4He | EAF-2010(r) MT32 | ENDF/B-VIII.0 MT55,56,… | |||
| 55,56,… | 22 | 10B(n,n’) | n + 4He + 6Li | ENDF/B-VIII.0 () | |||
| 55,56,… | 35 | 10B(n,n’) | n + 2H + 2 4He | ENDF/B-VIII.0 () | |||
| 105 | 10B(n,t) | 3H + (8Be∗ 2 4He) | EAF-2010(r) () | ||||
| 700 | 10B(n,t) | 3H + (8Be 2 4He) | ENDF/B-VIII.0 () | ||||
| 106 | 10B(n,3He) | 3He + (8Li∗ Be∗ 2 4He) | EAF-2010 | ||||
| 107 | 10B(n,) | 4He + 7Li | EAF-2010(r) () | ENDF/B-VIII.0 MT800,801 | |||
| 800 | 10B(n,) | 4He + 7Li | ENDF/B-VIII.0 () | ||||
| 801 | 10B(n,) | 4He + 7Li∗ | ENDF/B-VIII.0 () | ||||
| 113 | 10B(n,t2) | 3H + 2 4He | EAF-2010(r) MT105 | ENDF/B-VIII.0 MT700 | |||
| 155 | 10B(n,t) | 3H + 2 4He | EAF-2010 | ||||
The 10B(n,) reaction cross sections are part of the IAEA Neutron Standards 2017 from thermal to 1 MeV. The ENDF/B-VIII.0 evaluation is consistent with these Standards. The library also contains discrete level inelastic cross sections of the MT 50 series, which are flagged for break-up of the residual, equivalent to the reactions under MT 22 and 35. In addition there are also discrete level cross sections for the 10B(n,t) MT 700 and 10B(n,) MT 800 series, that can be summed into MT 105 and MT 107, respectively. For IRDFF-II the 10B(n,) MT 107 cross sections are taken from the ENDF/B-VIII.0 library up to 1 MeV because these data agree with the IAEA Neutron Standards 2017. Extrapolation to 60 MeV is done using the shape of the 10B(n,) MT 107 cross sections from the EAF-2010 library.
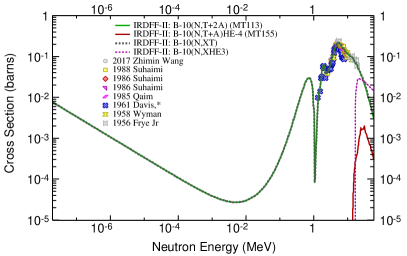
In the IRDFF-II library the 10B(n,n) MT 22 cross sections are taken from the summed contributions of the discrete level inelastic cross sections in ENDF/B-VIII.0 up to 20 MeV. Extrapolation to 60 MeV is done using the shape of the 10B(n,n) MT 22 cross sections from the EAF-2010 library, normalized for continuity at 20 MeV. The data from the ENDF/B-VIII.0 library do not have a dip near 10 MeV, which is observed in the EAF-2010 data.
V.2.30 B(n,X)He
Many reaction channels from neutrons incident on 11B result in 4He production and/or tritium production, as seen from Table 15. There are 7 such reactions in the EAF-2010 library.
| MT | LR | Gas | Reaction | Products | Source evaluations of IRDFF-II | ||
|---|---|---|---|---|---|---|---|
| 33 | 3H | 11B(n,nt) | n + 3H + (8Be2 4He) | EAF-2010 | |||
| 105 | 11B(n,t) | 3H + 9Be | EAF-2010(r) () | ENDF/B-VIII.0 () | |||
| 11 | 4He | 11B(n,2nd) | 2 n + 2H + (8Be 2 4He) | EAF-2010 | |||
| 22 | 11B(n,n) | n + 4He + 7Li | EAF-2010(r) () | ENDF/B-VIII.0(r) () | |||
| 24 | 11B(n,2n) | 2 n + 4He +6Li | EAF-2010 | ||||
| 33 | 11B(n,nt) | n + 3H + (8Be 2 4He) | EAF-2010 | ||||
| 107 | 11B(n,) | 4He + (8Li8Be2 4He) | EAF-2010(r) () | ENDF/B-VIII.0 () | |||
| 117 | 11B(n,d) | 2H + 4He + (6He 6Li) | EAF-2010 | ||||
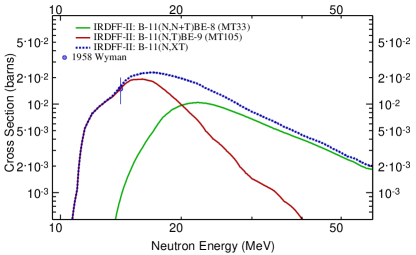
The ENDF/B-VIII.0 library contains only 11B(n,n) MT 22 and 11B(n,) MT 107 reactions; the first one is much higher than the corresponding one in the EAF-2010 library because it was normalized to the measurement by Kneff (EXFOR #10933019); It can be understood from the original article that the measured quantity was actually the total helium production, therefore the normalisation in ENDF/B-VIII.0 is not correct.
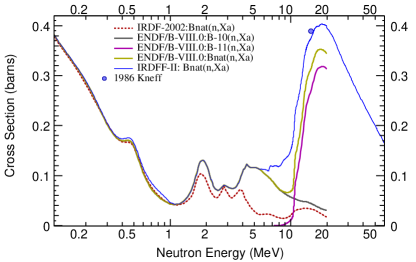
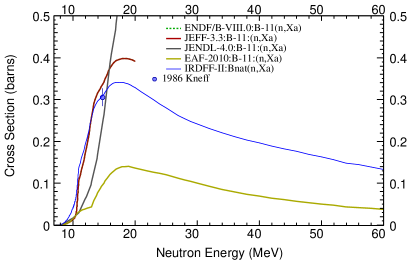
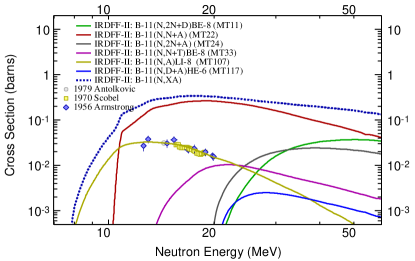
Reactions in the IRDFF-II library are adopted from the EAF-2010 library, except for those that are also present in ENDF/B-VIII.0. The 11B(n,n) MT 22 from ENDF/B-VIII.0 was scaled down by 30 % to agree with the total helium-production measurement by Kneff. The cross sections above 20 MeV are taken from the EAF-2010 library, scaled for continuity at 20 MeV.
V.2.31 B(n,X)He
Since various 10B enrichments can be used for the dosimeter, users of the library can combine 4He gas generation contributions from 10B and 11B to get the dosimeter response. Some dosimeters use the boron in its natural abundance. To serve as a check for how the individual isotopic contributions should be combined, the IRDFF-II library also includes the 4He gas generation cross section from elemental boron with the naturally occurring isotopic abundances. Fig. 64 compares the 4He gas production from the separate isotopes and from the elemental boron file and experimental data at 14 MeV measured by Kneff in 1986 Kne86 . The IRDFF-II is in excellent agreement with measured data.
VI NEUTRON BENCHMARK FIELDS
The following subsections describe the source for the neutron spectral data used to characterize the benchmark neutron fields.
VI.1 Standard Field
A standard benchmark neutron field is defined A170 ; Field as a permanent and reproducible neutron field that is characterized to state-of-the-art accuracy in terms of neutron fluence rate and energy spectra, and one where the associated spatial and angular distributions, and other important field quantities, have been verified by interlaboratory measurements. A given neutron field is considered to be a “standard” only over a specified neutron energy range and there is only one type of “standard neutron field” for a given energy range. The recognized “standard neutron field” is the 252Cf spontaneous fission field. Secs. VII.1 and VIII.1 address how this field is used to provide supporting IRDFF-II validation evidence and how consistent are those evidences.
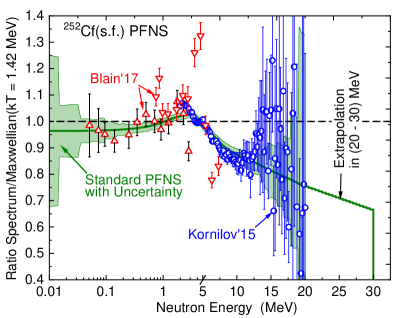
VI.1.1 252Cf(s.f.)
The 252Cf spontaneous fission neutron field is defined to be a standard neutron field over the energy range from 0.1 MeV to 20 MeV.
The standard reference prompt fission neutron spectrum from spontaneous fission of 252Cf(s.f.) Man89 is characterized based on neutron time-of-flight measurements and subsequent model-independent evaluation. This work provided the spectrum definition incorporated into the IRDFF-II library up to 20 MeV. The spectrum was then extrapolated up to 30 MeV of neutron outgoing energies by adding a point at 30 MeV, preserving the energy slope as below 20 MeV. All 252Cf(s.f.) spectrum evaluations are based on original Mannhart work Man87 . There are some minor differences above 10 MeV outgoing neutron energy between IDRFF-II spectrum and the one included in the ENDF/B-VIII.0 library.
Figs. 67(a) 67(b) shows the correlation matrix and the energy-dependent standard deviation for the 252Cf(s.f.) spectrum, correspondingly.
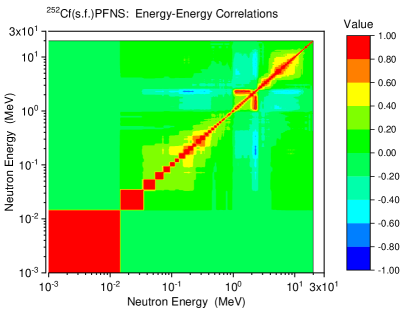
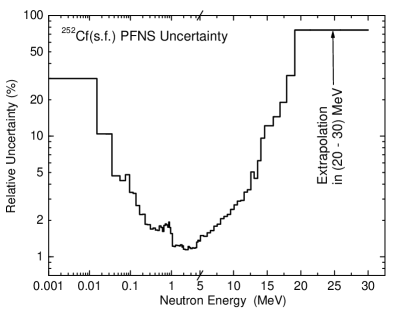
The spectrum is shown in Fig. 66. In the figure the y-axis is shown as a ratio to the Maxwellian distribution with kT = 1.42 MeV to better capture the large variation in neutron population with increasing energy. Since the time-of-flight (TOF) spectral characterization data only addressed the region up to 20 MeV, the higher energy portion of the spectrum is obtained from the extrapolation process described above. Significant increases in the spectral uncertainties are seen above 10 MeV and continuing up to the TOF cut-off energy at 20 MeV. Above this energy, the uncertainty in the extrapolated spectrum is assumed to be the same as that at the 20-MeV last measured value, which is 75 %.
Since the evaluation of the 252Cf(s.f.) prompt fission spectrum performed by W. Mannhart in 1987 Man87 , several new measurements have been carried out by the time-of-flight technique. The two newest measurements are discussed below. In 2015, N. Kornilov has measured the PFNS in the neutron range 2 MeV to 20 MeV Kor15 . In 2017, E. Blain and co-workers have reported two data sets measured by different detectors: from 0.05 to 2.8 MeV and from 0.75 to 7.3 MeV, however both - in arbitrary units Bla17 . Regrettably these new experiments, as seen in Fig. 66, have rather large uncertainties or fluctuations, thus contributing little to the improvement of the existing 252Cf(s.f.) standard.
VI.2 Experimentally Measured Potential Reference Neutron Fields
Reference neutron benchmark fields are defined A170 ; Field as permanent and reproducible neutron fields, less-well-characterized than a standard field, but acceptable as a measurement reference by a community of users. As part of the validation effort, an IAEA-sponsored Coordinated Research Project has focused on addressing improving the fidelity of the spectral characterization at candidate reference benchmark fields and using data gathered in these fields as part of the validation evidence for the IRDFF-II library. The following subsections address the spectral characterization data that have been used in the supporting analysis reported here.
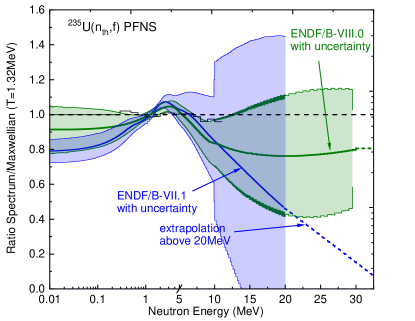
VI.2.1 235U(nth,f)
A new 235U thermal fission spectrum evaluation was developed within an IAEA-sponsored project using a least-square code GMAP in conjunction with shape data relative to the very-well-characterized 252Cf(s.f.) prompt fission neutron spectrum (PFNS). This new spectrum was the result of contributions from the IAEA CIELO collaboration OECD ; CIELO:2014 ; CIELO:2018 ; CIELO-IAEA , the IAEA Neutron Standard committee Car18 , and the IAEA Prompt Fission Neutron Spectra project PFNS1 ; PFNS2 ; PFNS . The spectrum incorporated into the IRDFF-II library was converted from the ENDF/B-VIII.0 MF5/MT18 entry ENDF8 . The associated covariance matrix was taken from the MF35/MT18 entry. Fig. 68 shows this 235U thermal neutron fission spectrum – represented as a ratio to a Maxwellian distribution at a temperature of kT=1.32 MeV.
Figs. 69(a) 69(b) shows the correlation matrix and the energy-dependent standard deviation for the 235U(nth,f) reference spectrum, correspondingly.
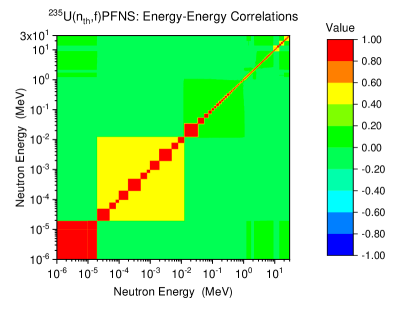

VI.2.2 233U(nth,f) and 239Pu(nth,f)
The PFNS of thermal-neutron induced fission on 233U and 239Pu targets were evaluated together with the PFNS of thermal-neutron induced fission on 235U target within the IAEA CRP on the Prompt Fission Neutron Spectra of Major Actinides PFNS . A very few measured reaction rates are available, one set for the 233U(n,f) PFNS, none for 239Pu(n,f), but some measurements were reported as double ratios of spectral indices to the ratio in PFNS of Pu. Since the spectra are not readily available elsewhere, they are included in the IRDFF-II spectra file. The plot of the 233U spectrum is shown in Fig. 70 as a ratio to a Maxwellian spectrum with temperature =1.30 MeV. The plot of the 239Pu spectrum is shown in Fig. 71 as a ratio to a Maxwellian spectrum with temperature =1.35 MeV. These spectra were not modified above 10 MeV, but the proposed modification of the high-energy tail was described in detail in Ref. PFNS .
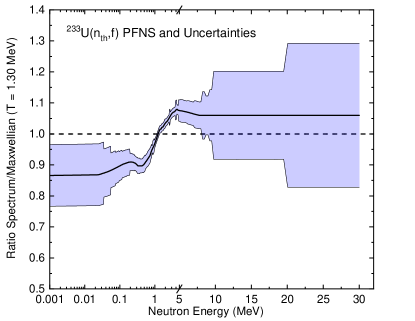
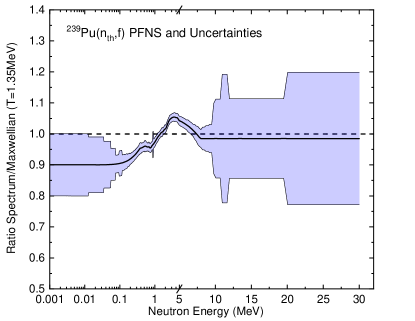
VI.2.3 9Be(d,n) Reaction Neutron Field
The development and qualification of fusion reactor materials requires irradiation in a neutron spectrum that includes very high flux at 14 MeV along with lower energy neutrons to simulate the first wall spectrum at proposed fusion power reactors. Since fusion reactors do not exist for the testing and fission reactors lack any significant flux at 14 MeV, it has been proposed to produce suitable neutron fields by stopping intense deuteron beams produced by particle accelerators in thick Be or Li targets. This produces a very high flux of neutrons over a continuous energy spectrum that can be designed to peak around 14 MeV. The IFMIF (International Fusion Materials Irradiation Facility) IFMIF is being proposed to study radiation damage in candidate fusion reactor materials.
Experiments were performed at deuteron energies of 16 MeV and 40 MeV producing neutron spectra as shown in Fig. 72. The neutron spectrum produced with deuteron energy of 16 MeV was measured at the Argonne National Laboratory tandem accelerator Gre78 . The neutron spectrum produced with deuteron energy of 40 MeV was measured at the Oak Ridge Isochronous Cyclotron (ORIC) Sal77 . The data from this facility can be found in the EXFOR entry No. C1832.002. The neutron spectra were very well characterized by using neutron time-of-flight technique. This method accurately determines the energy of neutrons interacting with a neutron detector at a fixed distance from the beryllium target by measuring the time required for a neutron to be created in the target and then travel to the neutron detector. The deuteron beam is pulsed to provide the start time and the stop time is determined when a neutron is detected. The absolute accuracy of the neutron flux is determined by the efficiency of the neutron detector, which is about 10 %. Dosimetry materials were then irradiated in prepared geometries resulting in accurately measured reaction rates in well-characterized neutron spectra.
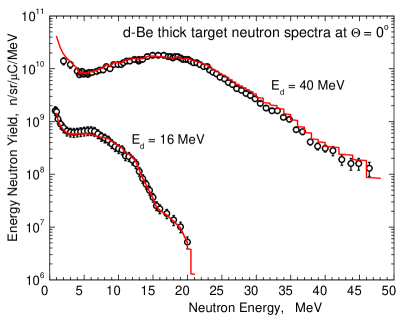
VI.3 Reference Neutron Fields from Detailed Computational Models
VI.3.1 SPR-III Fast Burst Reactor Central Cavity
SPR-III is an advanced fast-burst Godiva-type reactor with a large 16.5-cm central cavity, commissioned in 1975 at Sandia National Laboratory, NM, U.S.A. Gri15a . This is an unmoderated cylindrical assembly of uranium enriched to 93 % 235U and alloyed with 10-wgt-% molybdenum to ensure phase stability. The core consists of eighteen fuel plates mechanically fastened into two halves of nine plates each. The mass of the individual plates varies between 6.8 and 15.4 kg and the total mass of the core is about 258 kg. The nine upper plates are held stationary by the core support structure; the nine lower plates are attached to an electromechanical drive mechanism. Four reflector-type control devices are used; three for control and the fourth is the burst element. The control elements are used to establish a critical configuration of the core and to adjust the pulse yields. Although it was developed primarily for the radiation testing of electronic parts and systems, it has been used in a wide variety of research activities. It is positioned in the centre of an air-filled shield building called a Kiva. SPR-III has a 10B shroud that serves to decouple it from room return. The reactor can be operated in steady-state (up to 10 kW power) or pulsed mode (10 MJ in an 76 s FWHM pulse that yields approximately 5x10¹⁴ n/cm2 in the reactor central cavity).
The reference SPR-III spectrum adopted within the IRDFF-II library characterizes the fuel centreline of the central cavity. High fidelity calculations using the MCNP, version 6.2.0, point cross section Monte Carlo code with the ENDF/B-VIII.0 cross sections and a detailed 3D geometry were performed to provide the best possible calculated neutron spectrum. The reactor, support structures, Kiva, and dosimetry test fixture were modelled in detail. The coupled neutron/photon calculation was performed using the MPI version of the code with 40 processors and using the L’Ecuyer 63-bit random number generator. The calculation used 5015 cycles with 2000000 source neutrons per cycle, of which 15 cycles were used to establish the normal fission distribution before beginning tally accumulation, for a total neutron source tally sample size of 100 billion neutrons. The neutron spectrum was scored in the 640-group SAND-II energy structure.
For this benchmark neutron field to be used to support the validation of the IRDFF-II cross sections, it is important that there be an uncertainty estimate of the calculated “a priori” spectrum, in the form of an energy-dependent covariance matrix, and that this uncertainty estimate be derived independent of the activation measurements that are being used in the intended validation activity. This derivation of an energy-dependent uncertainty for a fine-group calculated spectrum is a very challenging task and a task where existing uncertainty quantification (UQ) methodologies are deficient and active work is still needed by the community. In addition to consideration of the numerical uncertainty, great care must be taken to not only address the uncertainty in the underlying transport cross sections and material geometry used in the radiation transport calculation, but to also investigate existing sources of “model defect”, i.e., potentially correlated sources of uncertainty in the calculational models not directly captured in the user input parameters. A covariance matrix for this calculated spectrum was derived using the methods detailed in Reference Wil98 and subject-matter expertise based on previous modelling activities and subsequent comparison with the results obtained through spectrum adjustment methods. This “a priori” covariance matrix for the reference neutron, derived independent of the reaction activities addressed later in this paper as part of the IRDFF-II validation evidence, is included as part of the IRDFF-II file that was outlined in Sec. II.H. This content from the covariance matrix is seen in Figs. 73 and 74. Fig. 73 shows the energy-dependent uncertainty in the neutron spectrum. Fig. 74 shows the correlation matrix.
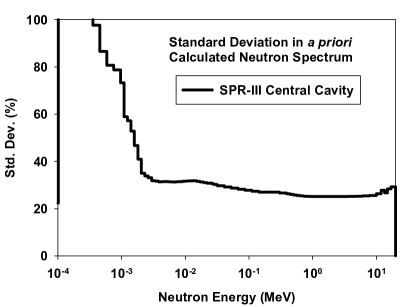
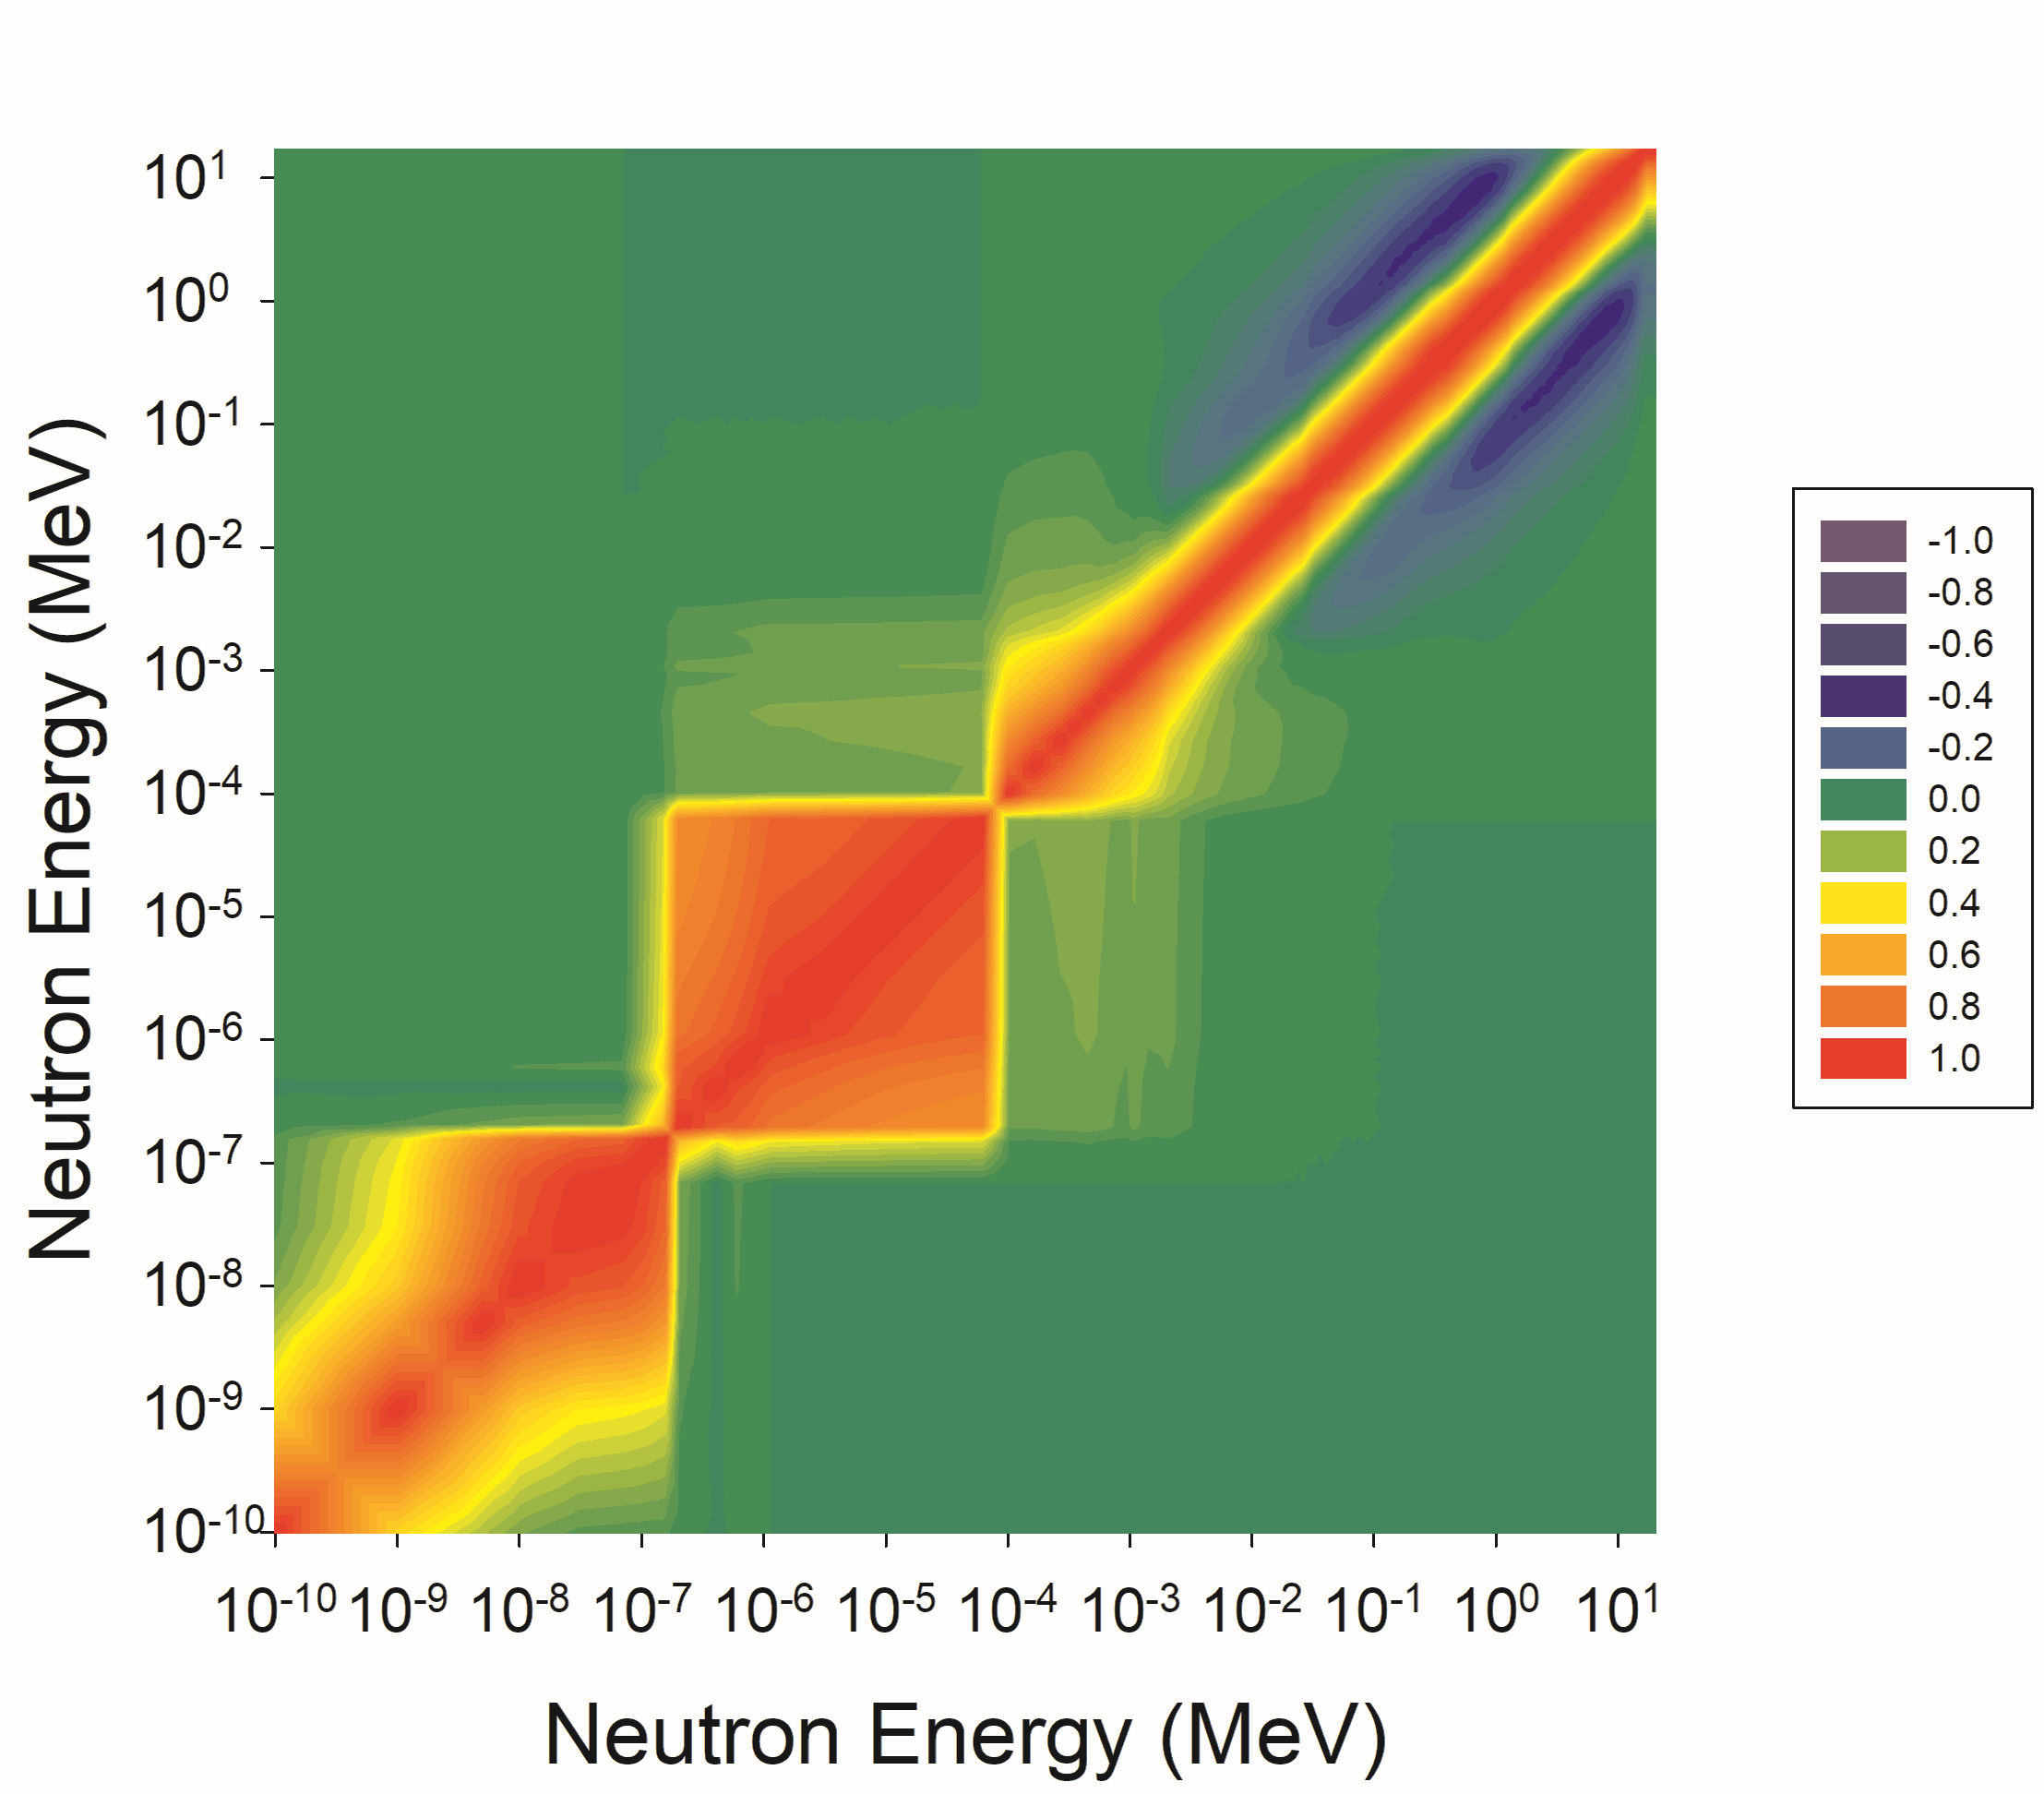
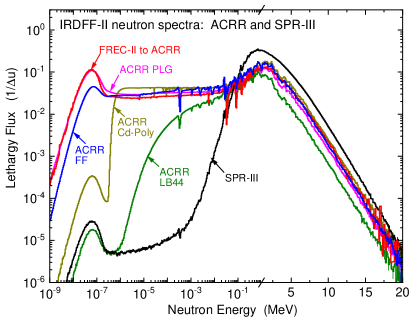
VI.3.2 ACRR Pool-type Reactor Central Cavity
ACRR is a pulse and steady-state, pool-type research reactor located at Sandia National Laboratory, Albuquerque, U.S.A. The ACRR maintains a large, dry irradiation cavity at the centre of its core. ACRR is typically used to perform irradiation testing where a high neutron fluence is required for a short period of time. Historically, ACRR has been used for a wide variety of experiment campaigns including electronics damage testing, nuclear fuels testing, space nuclear thermal propulsion testing, and medical isotope production. ACRR is currently fully operational and is used to add validation evidence for new dosimetry-quality reactions with a response in the epithermal and fast fission energy regions. ACRR’s main attributes include a large, dry central irradiation cavity, epithermal neutron fluence, and large pulsing capabilities that permit a high irradiation and rapid recovery of the dosimeter.
ACRR can operate in a steady-state, transient, or pulse mode. In the steady-state mode, the operating power level is limited to 4 MW. In the pulse mode, a maximum pulse size of 250 MJ with a full-width half-maximum (FWHM) of 6 ms. In the transient mode, the reactor power shape can be tailored to the desired requirements for a total reactor energy deposition of 300 MJ. The transient mode can be used to increase the reactor power quickly; for example, a ramp increase in power level linear with time from low power to high power. ACRR is fueled by a 236 element array of UO2-BeO fuel elements. The fuel is uranium enriched to 35 weight percent 235U, with 21.5 weight percent UO2 and 78.5 weight percent BeO. The ACRR fuel elements are stainless steel clad, 3.747 cm in outer diameter and 52.25 cm in fuel length. Within the elements are niobium cups that hold the UO2BeO fuel pieces. ACRR is controlled by two fuel-followed safety rods, three poison (void-followed) transient rods, and six fuel-followed control rods. The control rods make up part of the 236 elements for the normal core configuration. Further information regarding the ACRR irradiation environment can be found in internal laboratory documents DeP06 .
The ACRR reference spectrum Par15 adopted within the IRDFF-II library characterizes the core centreline of the central cavity with the 32-inch pedestal. High fidelity calculations were performed to provide the best possible calculated neutron spectrum. This is the spectrum that should be used as input to various spectrum adjustment codes, or as the trial spectrum in iterative unfolding codes. The radiation transport was performed with the continuous energy, three-dimensional Monte Carlo particle transport code MCNP MCNP . The MCNP model of the ACRR central cavity with the 32-inch pedestal is shown in Fig. 76. The coupled neutron/photon calculation was performed using the MPI version of the code with 40 processors and using the L’Ecuyer 63-bit random number generator. The calculation used 5015 cycles with 2000000 source neutrons per cycle, of which 15 cycles were used to establish the normal fission distribution before beginning tally accumulation, for a total neutron source tally sample size of 100 billion neutrons. The neutron spectrum was scored in the 640-bin SAND-II energy group structure.
For this benchmark neutron field to be used in support of the validation of the IRDFF-II cross sections, a calculated ”a priori” spectrum, in the form of an energy-dependent covariance matrix, and one that has been developed independent of the activation measurements that are being used in the intended validation activity, is required. The covariance matrix for this calculated spectrum was derived using the methods detailed in Reference Wil98 and subject-matter expertise based on previous modelling activities and subsequent comparison with the results obtained through spectrum adjustment methods. This ”a priori” covariance matrix for the reference neutron, derived independent of the reaction activities is included as part of the IRDFF-II file that was outlined in Sec. II.H. This content from the covariance matrix is seen in Figs. 77 and 78. Fig. 77 shows the energy-dependent uncertainty in the neutron spectrum. Fig. 78 shows the correlation matrix.
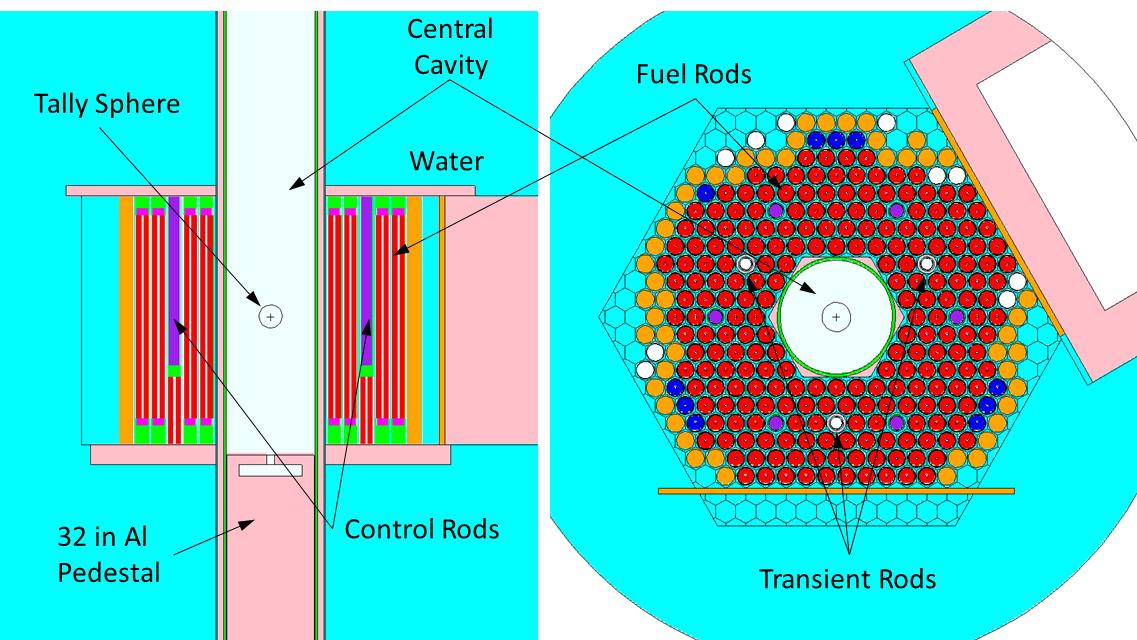
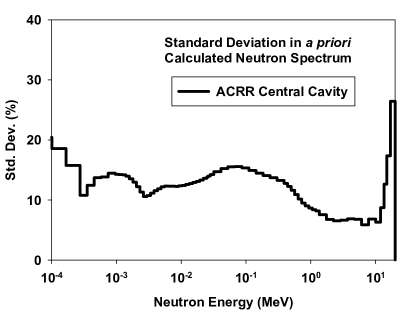
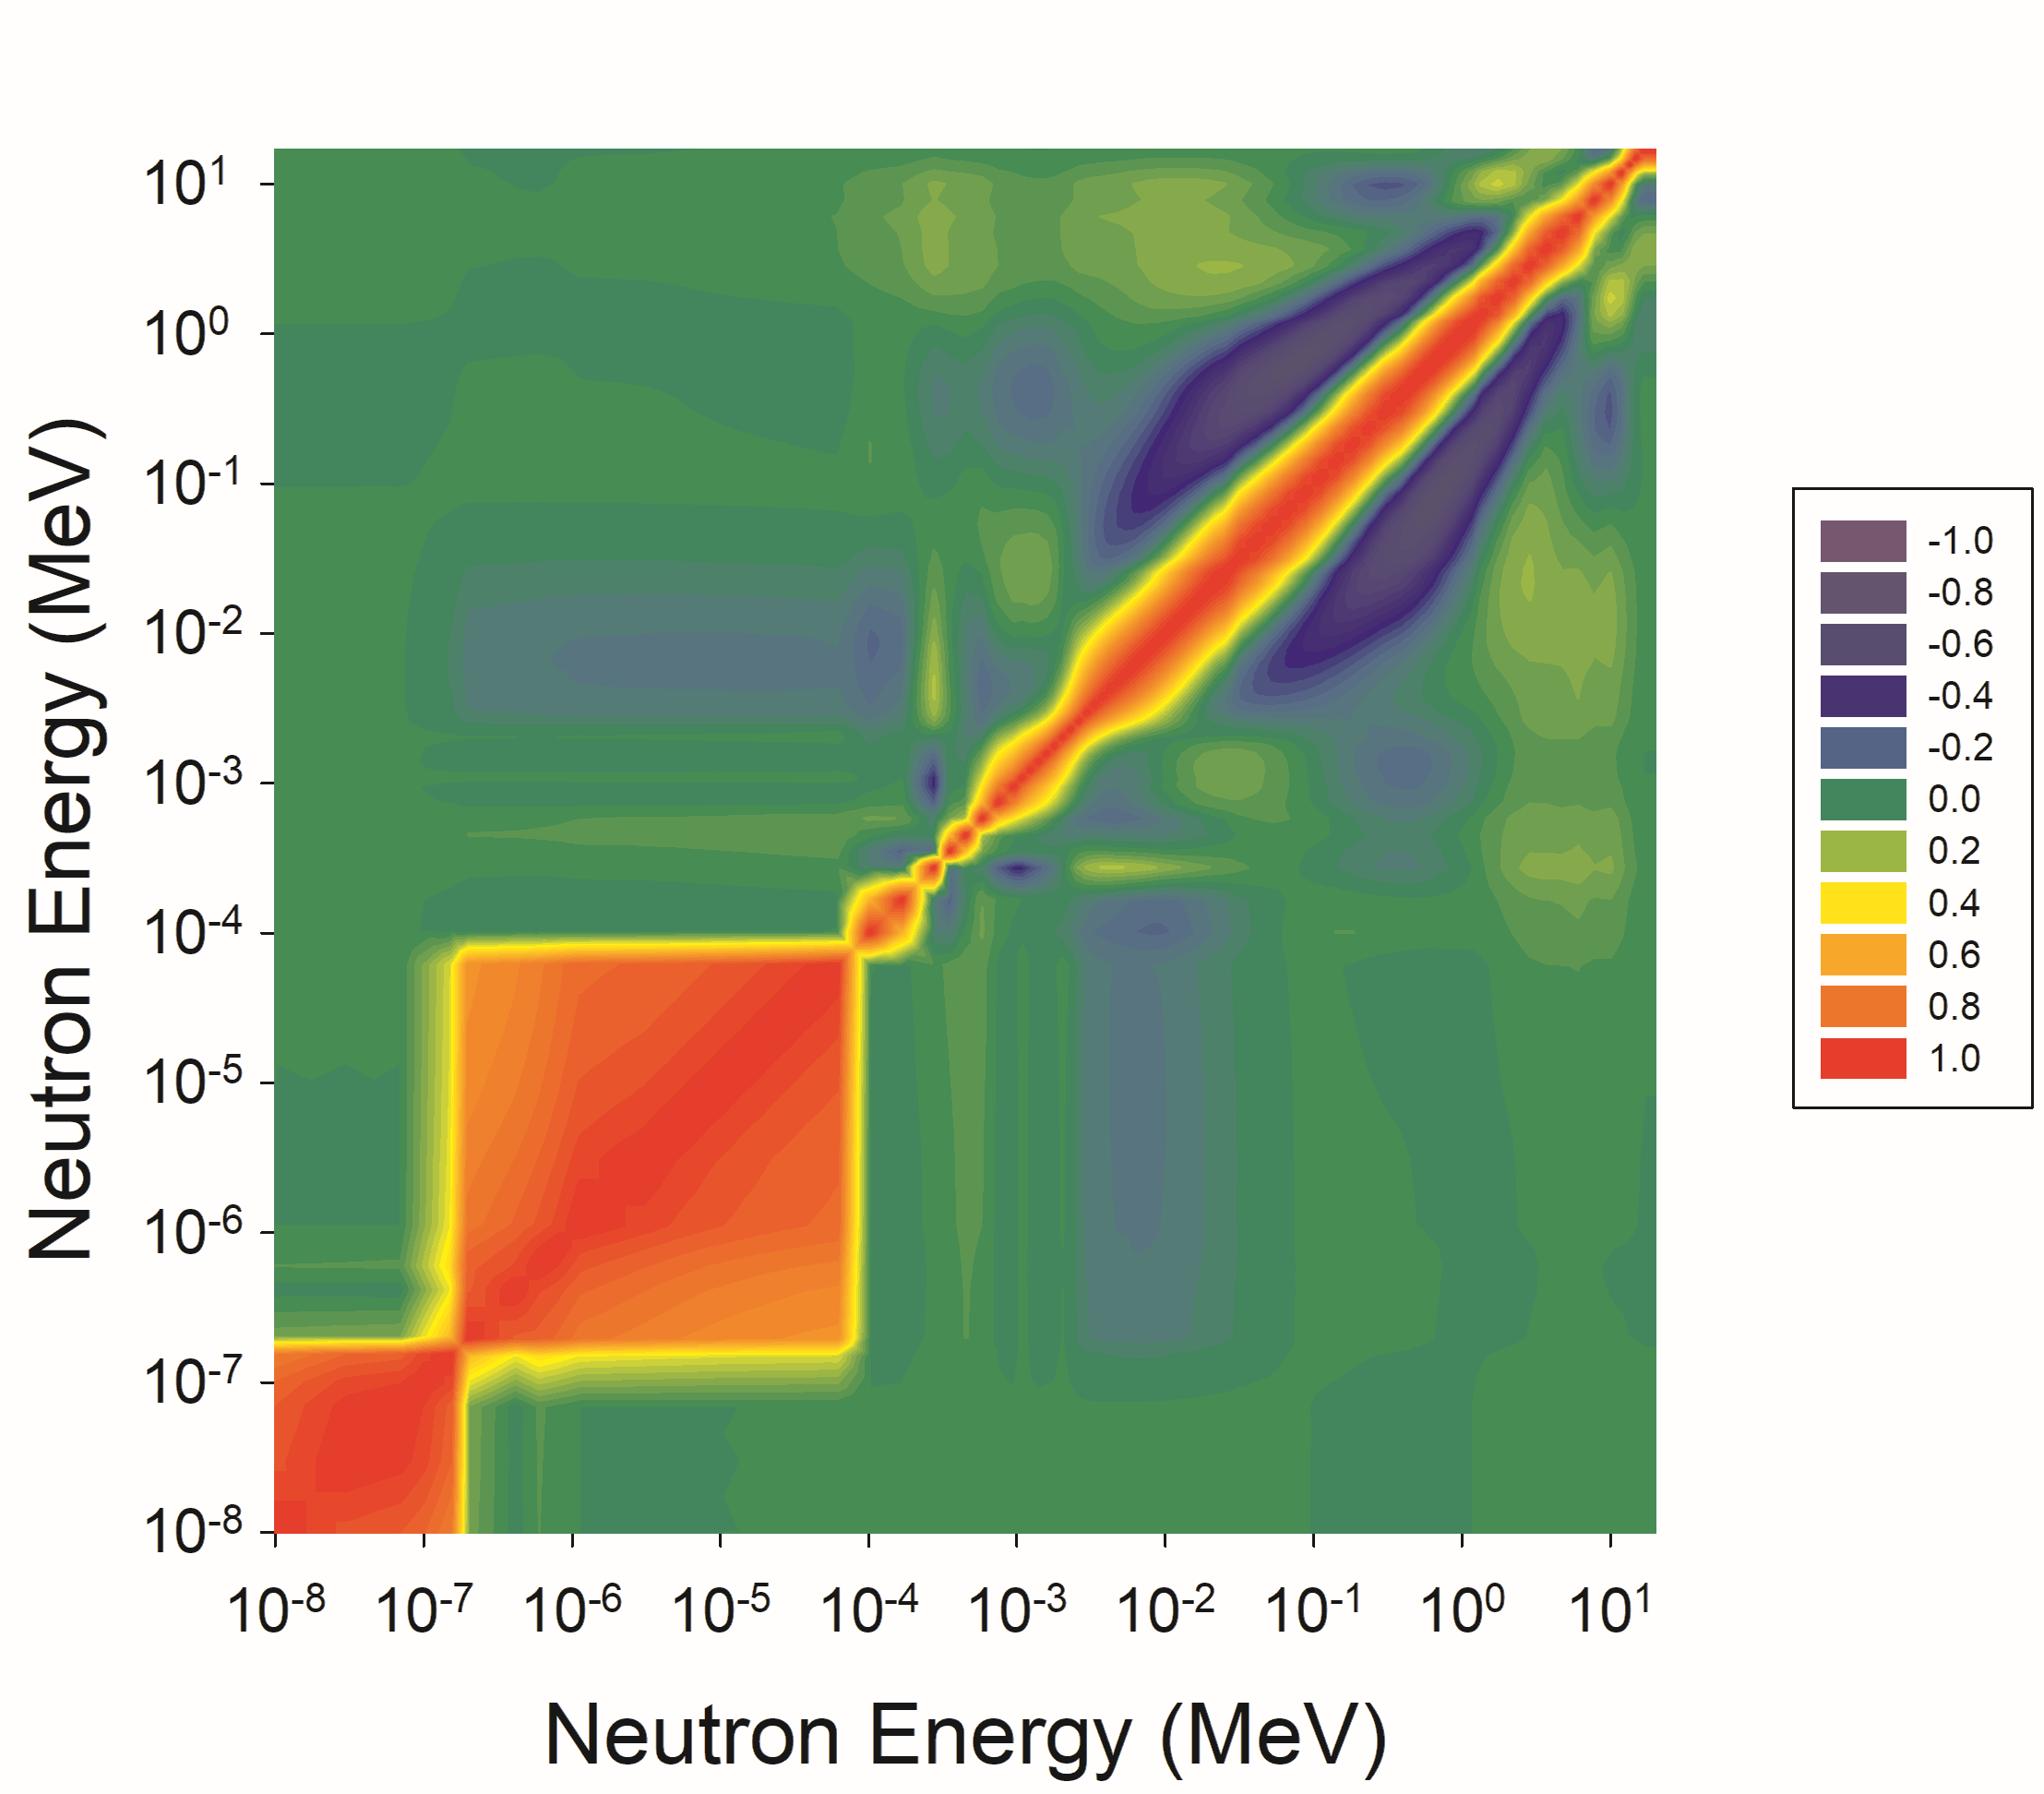
VI.3.3 ACRR Pool-type Reactor Pb-B4C (LB44) Bucket
The ACRR maintains an epithermal neutron fluence spectrum in the core and central cavity. This allows for the neutron energy fluence spectrum to be tailored to the desired specifications of an experiment by introducing various spectrum modifying buckets. Moderators can be used within the cavity to thermalize the neutron spectrum. Boron and lead can be used to increase the fast neutron fluence ratio and decrease the gamma-ray fluence, respectively. The ACRR-LB44 neutron field uses a 44-inch tall lead and B4C “bucket” to moderate neutron field seen at a 5-inch inner diameter experiment location. The primary purpose of this “bucket”, depicted in Fig. 79, is to reduce the thermal component of the neutron spectrum as well as the associated gamma exposure. This neutron spectrum is calculated using the MCNP code in a manner similar to that described in Sec. VI.B.3. The calculated neutron spectrum is shown in Fig. 75.
VI.3.4 ACRR Pool-type Reactor Cd-Polyethylene Bucket
A cadmium-polyethylene insert is used to tailor the neutron spectrum for this field. This Cd-poly “bucket” is designed to enhance the gamma ionization component in the mixed neutron/gamma reactor field by a factor of two. It also significantly reduces the thermal neutron component while leaving the epithermal component of the cavity spectrum. The “bucket” provides an inner experiment diameter of about 7.5-inches and accommodates packages with a height of 30-inches. The outer portion of the bucket is fabricated from high density polyethylene with a thickness of 0.55-inches and the inner cadmium sheet is 0.02-inches. The purpose of the bucket, depicted in Fig. 80, is to provide variation in the neutron-to-gamma radiation field when testing electronic components. The calculated neutron spectrum is shown in Fig. 75.
VI.3.5 ACRR Pool-type Reactor Polyethylene-lead-graphite (PLG) Bucket
A polyethylene-lead-graphite (PLG) insert is used to tailor the neutron spectrum for this field. This PLG bucket is designed to fit within the 23.4-cm diameter ACRR central cavity. The purpose of the bucket, depicted in Fig. 81, is to provide some neutron moderation, reducing the fast neutron component relative to the total neutron fluence. The calculated neutron spectrum is shown in Fig. 75.
VI.3.6 ACRR Fueled Ring External Cavity (FREC-II)
FREC-II is an external cavity attached to the ACRR and it can be “coupled” or “de-coupled” to the ACRR core depending on the experimenter’s desires. In the “de-coupled” mode, FREC-II is tilted away from the core several degrees and the Ni plate is attached to the ACRR. In this configuration, the FREC-II has minimal effect on the neutronic behavior of the reactor. With the FREC-II “coupled,” a significant neutron and gamma-ray flux exists in the 20-inch, dry, FREC-II cavity.
Fig. 82 depicts the FREC-II cavity as it is coupled to the ACRR. The FREC-II uses uranium/zirconium-hydride (U-ZrH) TRIGA fuel. FREC-II is fueled with a 186-element array of UZrHfuel elements. The fuel is 12 weight percent uranium enriched to 20 weight percent U-235. The hydrogen atomic ratio is 1.625 hydrogen atoms per Zr atom. The FREC-II fuel elements are stainless steel clad, 1.5 inches in diameter and 15 inches in fuel length. The UZrH fuel in each element is a single solid cylinder with a 0.25-inch diameter hole at its centre. The centre region maintains a Zr rod with the same diameter. FREC-II has four neutron poison elements that are fuel followed and can be positioned full-in (down position-poison in), full-out (up position-poison out), or any position in between. This feature allows for radial flux tilting in the 20-inch cavity. The FREC-II cavity allows for some advantages compared to the ACRR central cavity for consideration by experimenters: 1) the FREC-II can accommodate larger experiments, since its cavity is 20 inches in diameter compared to the 9-inch diameter central cavity; 2) the neutron and gamma-ray flux can be radially tilted by using the FREC rods and positioning the experiment within the cavity; and 3) the smaller neutron flux allows for a maximum pulse with a short pulse width (8 ms) and smaller total neutron fluence. This same effect could be achieved in the central cavity by positioning the experiment package higher in the cavity.
The calculated neutron spectrum is shown in Fig. 75.
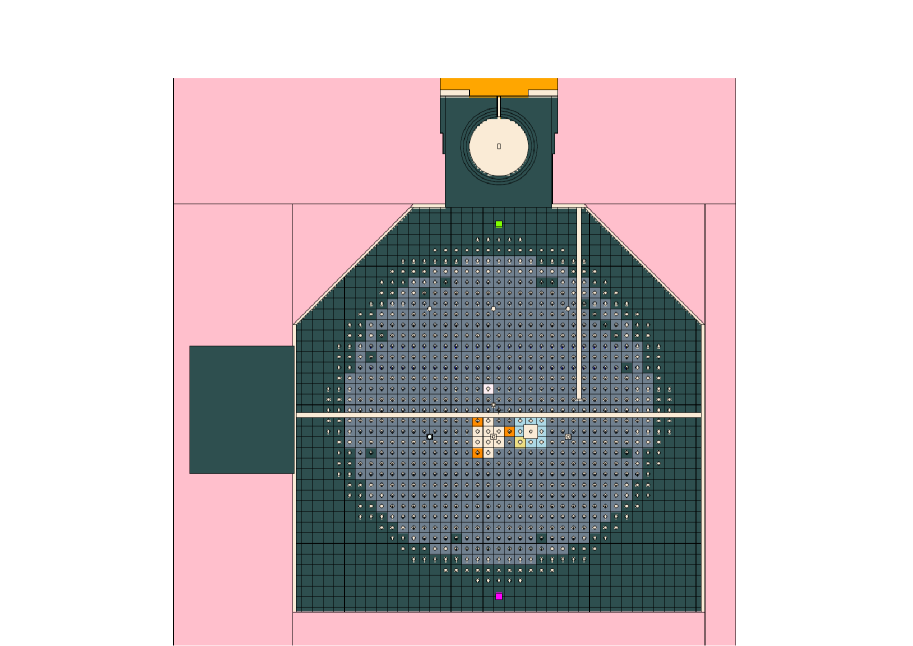
VI.3.7 Mol-BR1 Cavity 235U Fission Spectrum
A number of standard neutron fields were designed in the BR1 reactor at the Belgian Nuclear Research Centre SCKCEN in Mol. They are designated as Mark-I, Mark-II, Mark-IIA or Mark-III. Many measurements of cross sections in these standard fields were reported Fab82 ; Gil84 ; Man85_2 . In particular, most of the measurements of the 235U(nth,f) PFNS spectrum-averaged cross sections were measured in the Mark-IIA neutron field, which is very similar to the current Mark-III. The standard fields are differenced by enrichment, height and thickness of the 235U cylinder and by the thickness of the Al claddings inside and outside of the uranium cylinder. The Mark-III standard neutron field was generated by means of a flexible 235U source arrangement located at the centre of a spherical cavity in the graphite thermal column Fab82 . The large 100 cm diameter cavity has minimized the wall return corrections while permitting a large volume for active instruments. The access to the centre of the field is enabled through a long 1 mm thick Cd tube, which is loaded with the irradiation samples. The source of fission neutrons is a 235U cylinder wrapped around the cadmium tube. The Mark-III configuration was re-analysed recently Wag16 and the computational model of the core layout is shown in Fig. 83, with the irradiation facility at the top of the figure.

To refer the dosimetry reaction rates measured in the cavity centre to the ones in the 235U(nth,f) PFNS, the neutron field perturbation corrections for the used facility configurations were calculated and applied by the authors of the measurements. The absolute neutron fluence was established relative to the 252Cf source, or reactions of interest were measured as chosen ratios.
The neutron spectrum inside the MARK-III converter loaded in the BR1 cavity, computed by MCNP-6 with ENDF/B-VIII.0 neutron data, is depicted in Fig. 84. The standard fission neutron field at the BR-1 reactor has been made available for international cooperative efforts for neutron metrology. Thus the large fraction of the existing cross sections averaged over the reference 235U(nth,f) prompt spectrum was measured there.
VI.3.8 LR-0 Reactor at Řež
The LR-0 reactor of the Research Centre Řež near Prague, Czech Republic is an experimental zero-power light-water-moderated reactor. The core is placed in a 6.5 m high Al tank with diameter of 3.5 m. The large reactor vessel is a legacy of the former heavy water reactor project which was carried out back in the 60’s. At the end of the 70’s, the refurbishment was accomplished and the reactor core was converted to light-water-moderated to support research in this field. The first criticality of the light water version was reached in December 1982.
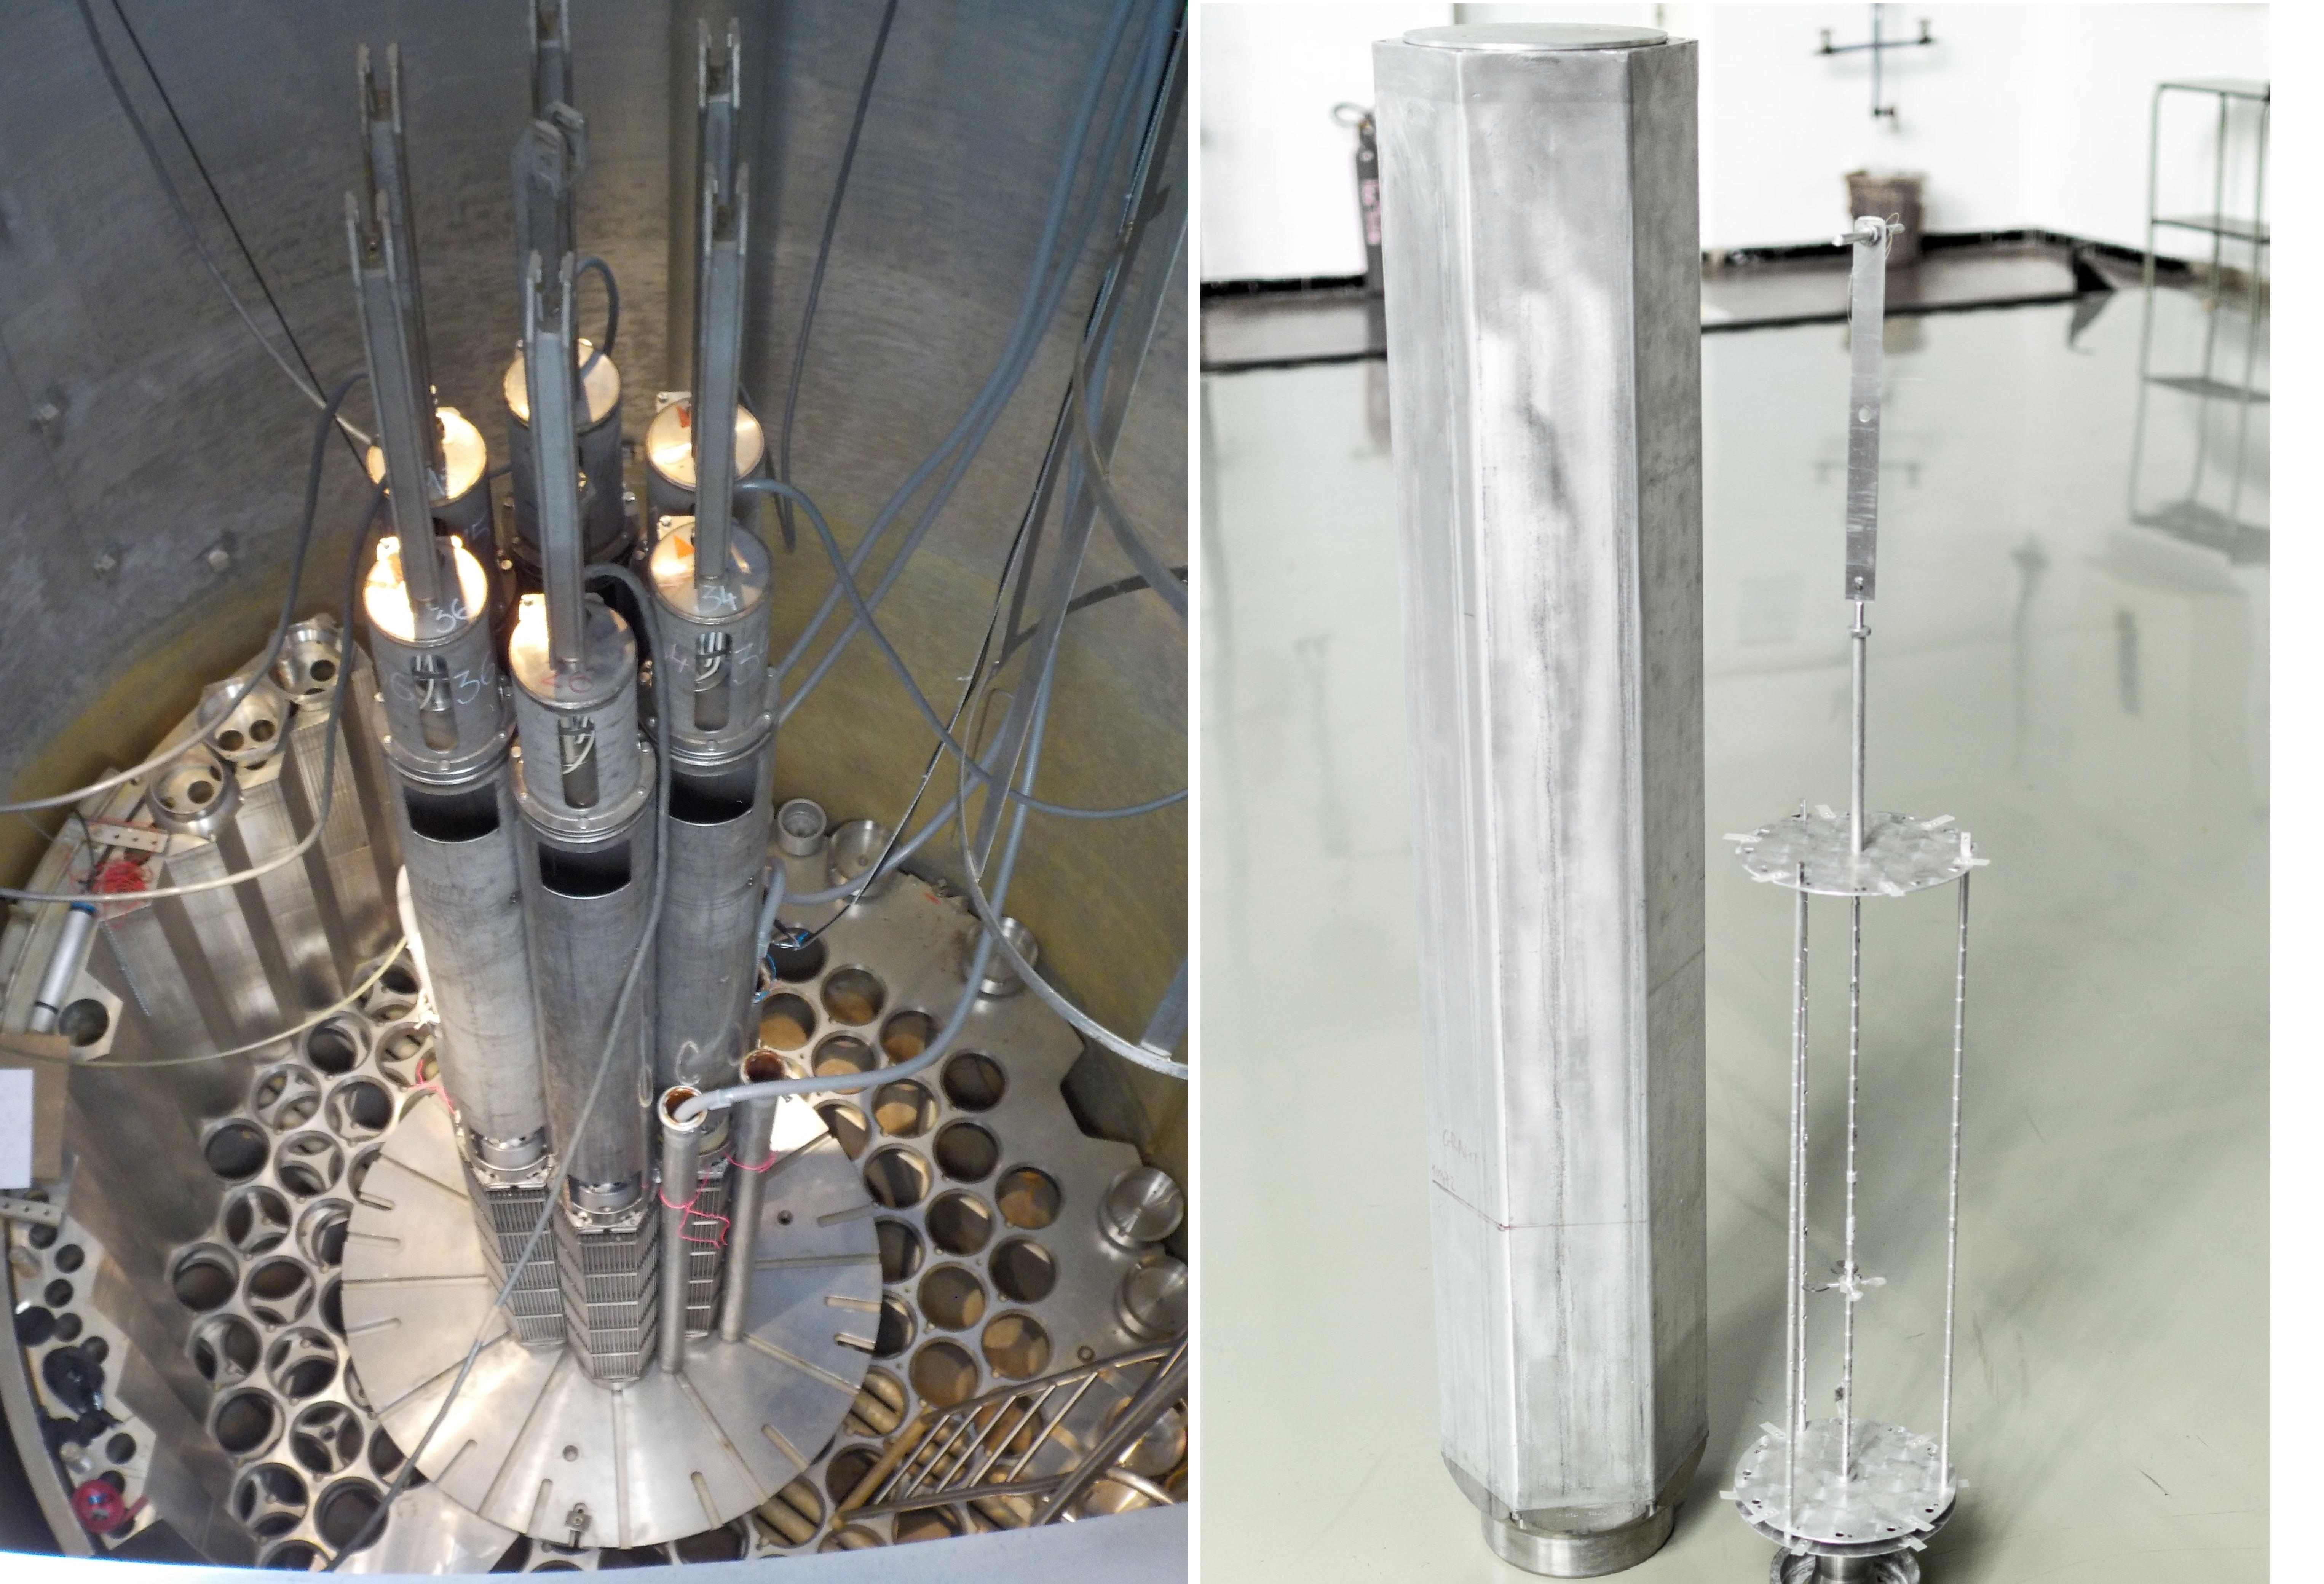

The main scope of the LR-0 research were some lattice studies of the VVER-440 and VVER-1000 reactor. Nominal thermal neutron flux density is 109 n.cm-2.s-1, which corresponds to the thermal power of 1 kW. Thanks to the low power, the fuel is considered to be physically fresh during all experiments. Later, the full-scale reflector segment of the VVER-1000 reflector was installed to the LR-0 vessel. Thus, the so called ”VVER-1000 Mock-up” experiments were enabled. The only significant difference between a real VVER-1000 reactor core and the VVER-1000 Mock-up is the height, because the LR-0 does not need so much fuel as an energy-producing reactor. Despite the shorter fuel assemblies, the LR-0 reactor can be used for VVER-1000 and VVER-440 reactor experiments focused on criticality, neutron transport and dosimetry to support services for utilities. For reproducibility, the full-scale simulators of the VVER-1000 internals are permanently installed in the LR-0 tank (see Fig. 85, left).
The large reactor vessel offers space for the variety of experiments with cores physically and neutronically decoupled from the VVER-1000 Mock-up. Based on this, smaller cores consisting of six hexagonal VVER-1000 fuel assemblies were designed to extend the experimental portfolio. The small core occupying only seven lattice positions is the simplest assembly which can be formed in the LR-0 reactor and it was also benchmarked. This benchmark core contains fuel assemblies with enrichment of 3.3 % surrounding one void hexagonal channel exactly fitting to the fuel lattice. As mentioned, the LR-0 reaches only negligible burn-up, thus redistribution of the fission source does not occur due to this effect and high reproducibility of experiments can be guaranteed.
In the past, neutron spectra Kos18_3 and flux distribution Kos18_4 in the centre of the dry assembly have been validated as well as the criticality Kos16_1 and neutron emission distribution Kos16_2 of the driver core. Therefore, the field in the void assembly can be understood as the reference neutron field. Low flux experiments at 2 n.cm-2.s-1 in flux over 1 MeV with some larger samples have been performed. Only low activities of threshold reactions can be induced in this field, hence closer measuring geometry during gamma spectrometry was selected. This is possible thanks to a well-defined efficiency curve in the used HPGe semiconductor measurement arrangement. More details concerning the core description can be found in the IRPhE Project Handbook Kos18_5 . The spectrum in the centre of the dry assembly of the Řež-LR0 reactor is shown in Fig. 86.
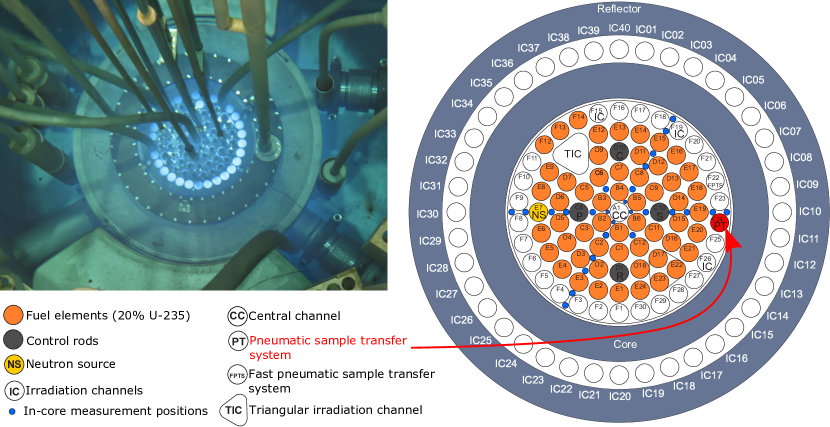
VI.3.9 TRIGA-JSI Pneumatic Tube Irradiation Channel
The Jožef Stefan Institute (JSI) TRIGA reactor in Ljubljana, Slovenia is a 250 kW light-water pool-type TRIGA Mark II reactor with uranium zirconium hydride fuel elements and an annular graphite reflector, cooled by natural convection. The reactor achieved first criticality in 1966. Due to its very well characterized irradiation fields its main applications, at present, are Neutron Activation Analysis (NAA), radiation hardness testing of detectors and electronic components (i.e., reference neutron radiation hardness irradiation facility for the CERN LHC accelerator and other accelerators within the EC H2020 project AIDA-II - Advanced European Infrastructures for Detectors at Accelerators), support for testing of neutron instrumentation detectors (fission chambers, self-powered neutron detectors) support for development of radiation-hard products, code testing and validation.
The JSI TRIGA reactor facility is described in detail in the publications Jeraj_ICSBEP ; Stancar_IRPHE . The reactor core is located at the bottom of a 6.25 m high open tank, 2 m in diameter. The core has a cylindrical configuration with 91 core locations which can be filled either by fuel elements or other components like control rods, a neutron source, irradiation channels, etc. The core lattice has an annular but not periodic structure. The fuel elements are arranged in six concentric rings: A, B, C, D, E and F, with 1, 6, 12, 18, 24 and 30 fuel locations per ring, respectively. The graphite reflector surrounding the reactor core is enclosed in aluminum casing and also houses a special irradiation facility, the rotary specimen rack, with 40 irradiation positions.
The reactor core is supported by a two 3/4-inch aluminium grid plates, which provide accurate axial and lateral positioning of the core components. The fuel elements are cylindrical with stainless steel (SS-304) cladding. Their total length is approximately 28 inches, their diameter is 1.478 inches. The fuel material in each element is 15 inches in length. The fuel elements are equipped with cylindrical graphite inserts at the top and bottom ends, 2.6 inches and 3.7 inches in length, respectively, which act as axial reflectors. In the centre of the fuel material there is a 0.25-inch-diameter hole which is filled by a zirconium rod. Between the fuel meat and the bottom graphite insert there is a 1/32-inch-thick molybdenum disc. The fuel itself is a homogeneous mixture of uranium and zirconium hydride with 12 wt.% uranium, enriched to 20 %.
Three control rods of the fueled-follower type are used in the reactor, i.e., the Regulating (R), Shim (C), and Safety (S) control rods, identical in geometry and composition. A fourth control rod, the Transient Rod (T), is equipped with a pneumatic ejection system and enables reactor pulse operation. It is similar to the fueled-follower control rods, but with a so-called air follower, which replaces the fuel part in the fueled-follower control rods. The purpose of the air-follower is to reduce power peaking that could appear when the transient rod is in its fully withdrawn position during steady state operation.
During normal operation the reactor core is equipped with 7 irradiation channels. Six of the irradiation channels occupy one core position: the Central Channel (CC), located in the reactor core centre (A1), and five irradiation channels located in the outer F core ring (F15, F19, F22, F24 and F26). Two of these irradiation channels are equipped with pneumatic sample transfer systems, i.e., the channel in position F22, also denoted as Fast Pneumatic Transfer System (FPTS), and in position F24, also denoted as Pneumatic Tube (PT). One channel, the Triangular Irradiation Channel (TIC) is larger and occupies three core positions (D8, E10 and E11), arranged in a triangle, and enables irradiations of objects with maximal lateral dimensions of approximately 50 mm. Fig. 87 displays a photograph of the TRIGA-JSI reactor core and a schematic diagram of the core configuration.
| Filter | Outer | Height | Inner | Inner |
|---|---|---|---|---|
| diameter | diameter | height | ||
| [mm] | [mm] | [mm] | [mm] | |
| Cd (1st campaign) | 10 | 6 | 8 | 4 |
| BN (1st campaign) | 13 | 14 | 5 | 6 |
| BN (2nd campaign) | 13 | 14 | 5 | 5 |
| B4C (2nd campaign) | 13 | 15 | 5 | 5 |
| 10B4C (2nd campaign) | 13 | 13 | 5 | 5 |
| (10B enrichment 96 %) |
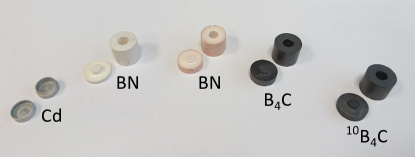
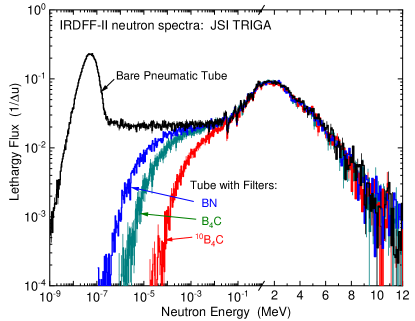
The measured quantities in the experiments were reaction rate ratios, either unfiltered relative to filtered, or one reaction rate relative to another, derived from activation measurements with gamma spectrometry. Irradiations were performed in two experimental campaigns in the TRIGA-JSI reactor, both in the Pneumatic Tube (PT) irradiation channel. In the first campaign, cadmium (Cd) and boron nitride (BN) filters were employed. The objectives of the campaign were two: firstly the characterization of the neutron spectrum in the PT irradiation channel, and secondly, to investigate the suitability of boron nitride filters to shift the energy sensitivity of radiative capture reactions to the epithermal energy range, for cross-section validation Radulovic_NIMA-2016 . In the second campaign, boron nitride (BN), boron carbide (B4C) and enriched boron carbide (10B4C) filters were employed. The objective of the campaign was to investigate new candidate radiative capture reactions, which are sensitive to the epithermal energy range (broadly between 1 keV and 1 MeV) under boron filters Radulovic_NENE2018 , which could be applicable for epithermal neutron dosimetry. The filter dimensions are reported in Table 16. Fig. 88 displays the filters. Fig. 89 shows the spectra with and without covers.
VI.3.10 ISNF
The ISNF facility is set up in the spherical cavity inside the graphite column of the reactor. Eight enriched 235U fission discs, symmetrically mounted in the cavity, convert the thermal neutron flux with an average energy E = 0.0253 eV to the fast fission spectrum. The summary flux is transmitted by the enriched 10B shell and it produces the standard’ neutron field at the centre of the cavity.
The effective spectrum range E - E, where the fraction of spectrum equals 5 % and 95 % of the total neutron fluence, lies between 8 keV and 4.1 MeV, an averaged energy E equals to 970 keV. The spectrum-averaged cross sections were measured at ISFN assembly operated at the research reactor of the U.S. National Bureau of Standards (Gaithersburg) Gru78 ; Oli84 ; Lam88 .
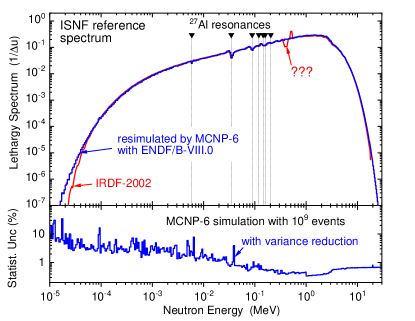
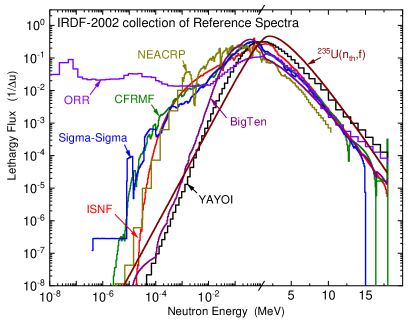
The ISNF spectrum available in IRDF-2002, as seen in Figs. 90 and 91, has obviously unphysical irregularities in the vicinity of 0.4 MeV marked with question marks in Fig. 90. Failing to find the original data, we went back to the available description of the facility Gru78 . The detailed information documented there gave us an opportunity to conduct a re-analysis of the spectrum using the MCNP-6 code with neutron transport cross sections including 235U(nth,f) PFNS from the ENDF/B-VIII.0 library. The calculated neutron energy distribution within the irradiation volume is shown in Fig. 90. This figure shows that the recalculated energy distribution is very close to the ISNF spectrum representation given in the IRDF-2002 library. It indeed exhibits resonances caused by the Al cap of the boron shell, but no longer exhibits the oscillations in the vicinity of 0.4 MeV.
This re-simulated ISFN spectrum, calculated in the 725-groups presentation, is used to compute the SACS and to support the validation of the IRDFF-II cross sections (see Sec. VII.12 for details). The indicated numerical uncertainties only capture the statistical uncertainty of the Monte Carlo simulation and do not represent the complete spectrum uncertainty. To reach a similar numerical uncertainty over the whole neutron energy range, at the 1 % level, variance reduction techniques were used. The impact on statistical uncertainty of the variance reduction is shown in the bottom panel of Fig. 90.
VI.3.11 Sigma–Sigma
Sigma-Sigma is a thermal-fast coupled spherical source assembly located within a conventional graphite thermal column of fission reactor. The column is a source of thermal neutrons that produce the fast fission spectrum in the spherical natural uranium shell (thermal-fast convertor). The inner boron carbide shell shapes the neutron low-energy tail in such a way to increase the reaction rates within an appropriate energy range.
The effective spectrum range, E - E fluence metric, is 20 keV – 3.7 MeV, with an averaged energy E = 730 keV. The Sigma-Sigma assemblies were operated at the Imperial College of Science and Technology (London) Bes73 ; Han78 , at the Belgian Nuclear Research Centre SCKCEN, in Mol (Belgium) Fab75 ; Fab78 , and at the Institute for Nuclear Technology (Bucharest) in cooperation with SCKCEN Gar78a ; Gar81 .
The Sigma-Sigma reference spectrum available in IRDF-2002 exhibits a suspicious spectrum shape below 10 keV, as seen in Fig. 91. The paper of A. Fabry and co-workers in 1975 Fab75 provided a tabulated spectrum which was based on the measurement and discrete ordinate calculation with nuclear data available at that time. Comparison of these two spectra shown in Fig. 92 confirms the unreliability of the IRDF-2002 data below 10 keV.
Fortunately, several papers Fab75 ; Fab71 ; Oli82 have documented detailed specifications of the Sigma-Sigma assemblies. Using this information, we have constructed an MCNP model and re-simulated the neutron spectrum for this facility while employing the modern neutron fission and transport data from the ENDF/B-VIII.0 library. The computed spectrum is close to the original one by Fabry and the IRDF-2002 spectrum over most of the energy range. However, substantial differences are observed below 1 keV, the region where the resonances of the 238U(n,tot) cross sections produce a fine structure in the spectrum. The newly simulated Sigma-Sigma spectrum was used for the validation of IRDFF-II cross sections, as reported in Sec. VII.12. The indicated uncertainties only represent the numerical statistical contributions and have been reduced to a few percent by applying variance reduction techniques.
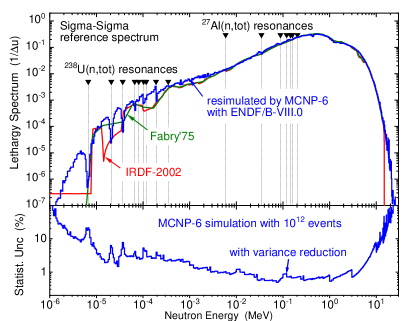
VI.3.12 FNS–Graphite Neutron Field with a D-T Source
An experiment was performed at the JAEA-FNS facility in Tokai-mura, Ibaraki-ken, Japan to measure spectral indices in a graphite block irradiated with a D-T source. Reactor-grade graphite blocks were stacked to form a pseudo-cylindrical assembly of 31.4 cm in equivalent radius and 61.0 cm in thickness. The average density of the graphite blocks was 1.64 g/cm3. The graphite assembly was placed at a distance of 20.3 cm from the DT neutron source. Several foils for the reaction rate measurement of forty dosimetry reactions were inserted into small spaces between the graphite blocks along the central axis of the assembly; the reaction rates of the 93Nb(n,2n)92mNb, 115In(n,n’)115mIn and 197Au(n,)198Au reactions were measured at four points (9.6, 19.3, 29.3 and 39.5 cm in depth) in the graphite assembly in order to check the reproducibility of the previous in situ experiment on graphite, while those of the other reactions were measured at two points (9.6 and 29.3 cm in depth). The plot of the spectra corresponding to the two depths in graphite are shown in Fig. 93.
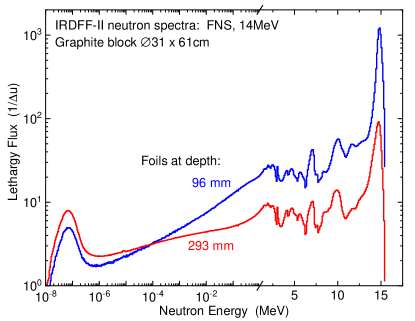
VI.3.13 Godiva Neutron Field from the ICSBEP Handbook
The Los Alamos National Laboratory HEU-MET-FAST-001 (i.e., Godiva) critical assembly LaB02 consists of a number of discrete highly-enriched uranium metal pieces that produce a near spherical assembly when joined into a critical configuration. This assembly is modelled as a bare sphere with a 8.7404 cm radius. Reaction rate measurements were made at the assembly centre using a combination of fission counters and foils. Flux and reaction rate tallies were extracted from a detailed MCNP 6.2 MCNP calculation. The tally region consists of a 0.5 cm diameter sphere centered within the critical assembly and the calculated flux and reaction rates result from a 10 billion neutron history job (50 warm-up cycles followed by 4 000 active cycles with 2 500 000 neutrons per cycle). Cross sections for the criticality transport calculation are from ENDF/B-VIII.0 ENDF8 using 293.6 K ACE files generated by the MCNP Data Team Con18 . Godiva’s calculated flux spectrum for this central region is shown in Fig. 94.
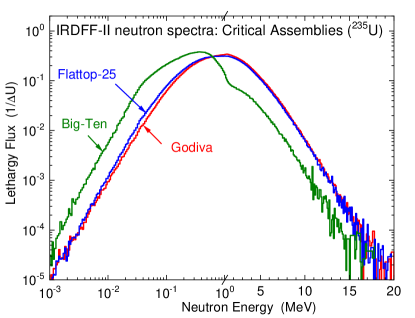
VI.3.14 Flattop-25 Neutron Field from the ICSBEP Handbook
The Los Alamos National Laboratory HEU-MET-FAST-028 (i.e., Flattop-25) critical assembly Bre99 consists of a highly-enriched uranium metal central core surrounded by a large natural uranium metal reflector. When assembled in a critical configuration the core and reflector are nearly spherical in shape. Hence this assembly is modelled as a bare sphere of highly-enriched uranium surrounded by a large, spherical natural uranium reflector. The central core radius is 6.1156 cm while the spherical reflector radius is 18.0086 cm. There is no gap between the central core and the reflector in the computer model. Reaction rate measurements were made using fission counters and foils at or near the core centre with selected measurements performed at various radial distances from the core centre extending into the reflector. In this report we focus on the central core. The tally region consists of a 0.5 cm diameter sphere centered within the critical assembly and the calculated flux and reaction rates result from a 5 billion neutron history MCNP 6.2 job (50 warm-up cycles followed by 2 000 active cycles with 2 500 000 neutrons per cycle). Cross sections for the kcode transport job are from ENDF/B-VIII.0 ENDF8 using 293.6 K ACE files generated by the MCNP Data Team Con18 . The Flattop-25 central region multigroup calculated flux spectrum is shown in Fig. 94.
VI.3.15 Big-Ten Neutron Field from the ICSBEP Handbook
The Los Alamos National Laboratory IEU-MET-FAST-007 (i.e., Big-10) critical assembly Sap99 is a large cylindrical assembly consisting of a heterogeneous mix of solid and annular uranium metal plates with enrichments vary from “depleted” to highly-enriched. The assembly has a central region consisting of 10 % enriched uranium where reaction rate and flux measurements were made. The calculational model incorporates the uranium metal plates so that the various “depleted””, normal uranium, 10 % enriched uranium and highly-enriched uranium regions are accurately portrayed. For calculated flux and reaction rate tallies a small, 0.5 cm diameter sphere is situated within the 10 % enriched region where the fission counters and foils were positioned. The MCNP 6.2 calculation was run for 5 billion active histories (50 warm-up cycles followed by 2 000 active cycles with 2 500 000 neutrons per cycle). Cross sections for the kcode transport job are from ENDF/B-VIII.0 ENDF8 using 293.6 K ACE files generated by the MCNP Data Team Con18 . The calculated multigroup flux spectrum within this tally sphere is shown in Fig. 94.
VI.3.16 CFRMF
The Coupled Fast Reactivity Measurements Facility (CFRMF) is located at Idaho National Laboratory (INL) in Idaho Falls, Idaho, U.S.A. The CFRMF is a zoned core critical assembly with a fast-neutron spectrum zone in the centre of an enriched 235U and 10B annulus inside the uranium block Rog75 ; Rog77 ; Rog78 . The water moderated thermal driver zone are conventional plate-type fuel elements of fully enriched uranium clad in aluminum.
In the past there was a continuing effort to improve the characterization of the CFRMF spectrum both through calculation and spectrometry measurements. Different deterministic and Monte-Carlo radiation transport computer codes have been employed in the calculations. J.W. Rogers and co-workers Rog78 have published the results of a one-dimensional calculation with S6/P1 approximation and 71-group average cross sections from ENDF/B-IV covering the energy range 16 MeV to epithermal. This spectrum, as seen in Fig. 95, agrees with the spectrum assigned for CFRMF in the IRDF-2002 which is represented there at 461 energy points. Exceptions include three points that deviate from the smooth shape above 10 MeV as seen in Fig. 91.
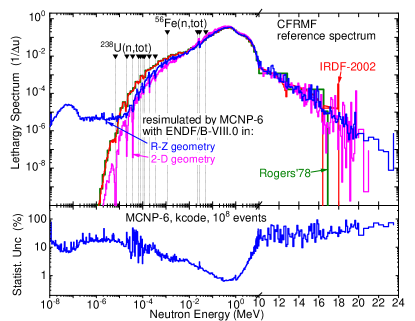
The one-dimensional model of the CRFMF facility is documented in a published paper Rog75 . We used this model to re-calculate the CFRMF critical assembly by the MCNP-6 code and employing up-to-date data from ENDF/B-VIII.0. As seen in Fig. 95, the newly calculated spectrum demonstrates more fine structure resulting from the strongest resonances in the neutron total cross section for 235U and 56Fe (component of stainless steel claddings). However, our calculation is lower than the IRDF-2002 and Roger Rog78 spectra for energies below 10 keV. Another and more realistic model in the R-Z geometry was published in Rog78 . It resulted in a representation of the CFRMF spectrum that is very similar to the cylindrical representation, shown in Fig. 95, but additionally brings in the thermal and epithermal neutrons, which penetrate through the bottom and top ends of the access tube that accommodates the activation samples.
Since the reason for this systematic difference is not clear at this time, we are investigating refinements in the model geometry and have continued to use use the IRDF-2002 spectrum (after correction of values at energies 12.7, 16.3 and 17.9 MeV) for the calculation of the spectrum-averaged cross sections. Calculation of the spectrum with this model predicts that the 5 % and 95 % limits are between 15 keV and 2.8 MeV and its average energy equals 741 keV.
VI.3.17 IPPE–BR1 Neutron Field from the ICSBEP Handbook
The Institute of Physics and Power Engineering FUND-IPPE-FR-MULT-RRR-001 is a Pu metal fuelled critical assembly Kho09 located in Obninsk, Russia. The core consists of (i) an empty centre tube where foils to be irradiated are located, (ii) 77 Pu metal rods are set on a hexagonal pitch, (iii) 31 peripheral copper metal rods to fill out the inner core region, (iv) annular uranium metal cylinders used for reactivity control and as radial reflectors, and (v) axial reflectors of uranium metal (lower) and copper metal (upper). The active fuel region is 13.1 cm tall. The MCNP 6.2 model includes a tally region at the core mid-plane in the voided centre rod position. This tally region is 1 cm tall. The MCNP 6.2 model was run for 5 billion active histories (50 warm-up cycles followed by 2 000 active cycles with 2 500 000 neutrons per cycle). Cross sections for the kcode transport job are from ENDF/B-VIII.0 ENDF8 using 293.6 K ACE files generated by the MCNP Data Team Con18 . The calculated multigroup flux spectrum within this tally sphere is shown in Fig. 96.
VI.4 Potential Reference Neutron Fields from Detailed Computational Models
The neutron fields for several well-known Pu-fuelled critical assemblies are shown in this section; namely the LANL “Jezebel” (a bare, mostly 239Pu, sphere), “Jezebel-240” (a bare Pu sphere with higher 240Pu content), “Flattop-Pu” (a Jezebel-like Pu spherical core reflected by natural Uranium) and “Thor” (a Jezebel-like Pu sphere reflected by Thorium). Criticality calculations yield accurate predictions but as will be shown in Sec. VII.11 the reaction rate C/E results exhibit trends not seen in the Uranium fuelled assemblies. This suggests that some aspect of these Pu-fuelled assemblies, perhaps the 239Pu PFNS, has unrecognized deficiencies. Hence while we present our calculations for these assemblies, the reader is cautioned that these neutron fields are not judged to be of benchmark quality at this time.
VI.4.1 Jezebel Neutron Field from the ICSBEP Handbook
The Los Alamos National Laboratory PU-MET-FAST-001 (i.e., Jezebel) critical assembly Fav16 consists of a number of discrete Pu metal pieces that, when assembled into a critical configuration, is nearly spherical in shape. The Pu metal is greater than 95 % 239Pu with an approximate 1 % Ga alloy for phase stabilization. This benchmark evaluation has undergone significant revisions in recent years which allow for the development of complex computer models representing the individual Pu metal pieces. In addition, the simpler legacy model, a simple sphere with one material has been retained. This simple model, with its updated core radius and material data, is used here. Although the core model is 6.39157 cm in radius and the flux and reaction rate tallies are obtained for a 0.5 cm diameter spherical tally region located at the core centre. The MCNP 6.2 calculation was run for 25 billion active histories (50 warm-up cycles followed by 10 000 active cycles with 2 500 000 neutrons per cycle). Cross sections for the kcode transport job are from ENDF/B-VIII.0 ENDF8 using 293.6 K ACE files generated by the MCNP Data Team Con18 . The calculated multigroup flux spectrum within this tally sphere is shown in Fig. 96.
VI.4.2 Jezebel-240 Neutron Field from the ICSBEP Handbook
The Los Alamos National Laboratory PU-MET-FAST-002 (i.e., Jezebel-240) critical assembly Del99 is similar to the PMF001 assembly described above; the primary difference being in the Pu metal isotopic content. Whereas Jezebel is 95 % 239Pu, the Jezebel-240 assembly is a little less than 80 % 239Pu, approximately 20 % 240Pu and includes smaller amounts of 241Pu and 242Pu. This assembly is modelled as a bare sphere 6.6595 cm in radius. Once again a small, 0.5 cm diameter, tally region is defined at the core centre where the various measurements were made. The MCNP 6.2 calculation was run for 10 billion active histories (50 warm-up cycles followed by 4 000 active cycles with 2 500 000 neutrons per cycle). Cross sections for the kcode transport job are from ENDF/B-VIII.0 ENDF8 using 293.6 K ACE files generated by the MCNP Data Team Con18 . The calculated multigroup flux spectrum within this tally sphere is very similar to the one of Jezebel in Fig. 96 and is not shown explicitly.
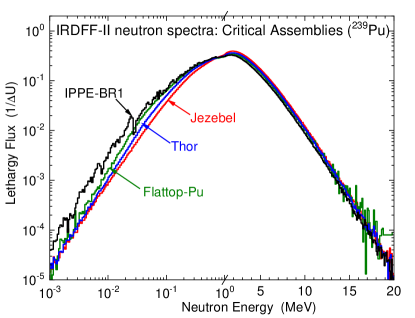
VI.4.3 Flattop-Pu Neutron Field from the ICSBEP Handbook
The Los Alamos National Laboratory PU-MET-FAST-006 (i.e., Flattop-Pu) critical assembly Bre99_1 is similar to the Flattop-25 assembly described previously with the exception that the central core is Pu metal rather than highly enriched uranium. The spherical Pu core radius is 4.5332 cm and the outer reflector radius is 24.1420 cm. As with Flattop-25 there is no gap between the central core and the reflector in the computer model. The central core flux and reaction rate tallies are obtained for a 0.5 cm diameter sphere at the located at the centre of the core. An MCNP 6.2 calculation was run for 1 billion histories (50 warm-up cycles followed by 400 active cycles with 2 500 000 neutrons per cycle). Cross sections for the kcode transport job are from ENDF/B-VIII.0 ENDF8 using 293.6 K ACE files generated by the MCNP Data Team Con18 . The calculated multigroup flux spectrum within this tally sphere is shown in Fig. 96.
VI.4.4 THOR Neutron Field from the ICSBEP Handbook
The Los Alamos National Laboratory PU-MET-FAST-008 (i.e., THOR) critical assembly Bre99_2 is similar to the Flattop-Pu assembly described previously with the exception that the heavy metal reflector is a cylinder of Thorium metal. The spherical Pu core radius is 5.310 cm and centered in the Thorium cylinder whose diameter and height are both 53.34 cm. Once again there is no gap between the core and reflector in the computer model. The MCNP 6.2 job includes a small, 0.5 cm diameter sphere in the centre of the core for flux and reaction rate tallies and was run for 5 billion active histories (50 warm-up cycles followed by 2 000 active cycles with 2 500 000 neutrons per cycle). Cross sections for the kcode transport job are from ENDF/B-VIII.0 ENDF8 using 293.6 K ACE files generated by the MCNP Data Team Con18 . The calculated multigroup flux spectrum within this tally sphere is very similar to the one of Jezebel in Fig. 96.
VI.5 Legacy Reference Neutron Fields
The reference spectra incorporated within the IRDFF-II library build upon the spectra collected in earlier dosimetry libraries. The reference neutrons fields generated at the research reactors, and frequently used for measurement of the spectrum-averaged dosimetry cross sections, were collected and documented in the IRDF-2002 database Spectra02 . Some of these reference spectra were transferred over from the IRDF-90 IRDF90 . The IRDF-2002 library included 9 spectra. The spectra, and associated references are:
-
•
two 235U thermal induced fission spectra, one from NBS (J. Grundl, private communication), second – from the ENDF/B-V evaluation;
-
•
Intermediate-energy Standard Neutron Field (ISNF) Gru78 ;
-
•
Coupled Fast Reactivity Measurement Facility (CFRMF) Gru78 ;
-
•
10 % enriched Uranium critical assembly (Big-Ten) Gru78 ;
-
•
Coupled thermal/fast uranium and boron carbide spherical assembly (Sigma-Sigma) Gru78 ;
-
•
Oak Ridge Research Reactor (ORR) [L. Greenwood, private communication];
-
•
YAYOI reactor [L. Greenwood, private communication];
-
•
Central zone flux of the NEACRP Benchmarks [B. Goal, private communication].
No uncertainties or associated correlation matrices for these spectra were provided in IRDF-2002. In 2005, the 252Cf spontaneous fission neutron spectrum and its covariance matrix, evaluated by H. Mannhart Man08 , were added to IRDF-2002.
All compiled IRDF-2002 spectra were displayed in Fig. 91 above. It is worthwhile to stress that systematic measurements of SACS were carried out and consequently the corresponding data were compiled in the EXFOR database only for the following reference spectra: ISNF, CFRMF, Sigma-Sigma.
Only a subset of these spectra was used for the verification of the IRDFF-II cross sections. Big-Ten critical assembly, ISNF and Sigma–Sigma reactor facilities were re-simulated using the latest ENDF/B-VIII.0 evaluation as described in Sects. VI.3.10, VI.3.11, and VI.3.15, respectively. The CFRMF spectrum could not be reproduced in full, but because of the large number of measurements in this field the original spectrum provided by the authors for IRDF-2002 was adopted as described in Sec. VI.3.16.
In ORR and YAYOI spectra unexplained structures are observed and the information describing the irradiation set-up is insufficient to develop new models. Therefore those IRDF-2002 spectra were not considered for validation. The Central zone flux of the NEACRP Benchmarks is not a real benchmark field and was discarded.
VI.6 Analytical Reference Neutron Fields
VI.6.1 Thermal Maxwellian
The thermal Maxwellian spectrum can be used to calculate spectrum-averaged cross sections in a well-thermalised spectrum. The spectrum corresponds to a temperature of 0.0253 eV and is normalised to so that the averaged cross section can be compared to the cross section value at 0.0253 eV, the ratio being the Westcott -factor.
VI.6.2 1/ Spectrum in the Energy Range 0.55 eV to 2 MeV
From neutron slowing-down theory it can be shown that high-energy neutrons in an ideal non-absorbing moderator with a constant cross section follow a 1/ distribution down to thermal energies. This is a reasonable approximation for a reactor spectrum. Cadmium has a very strong resonance near 0.2 eV. A cadmium cover of thickness 1 mm effectively filters thermal neutrons below 0.55 eV. At high energies the fission spectrum in a reactor falls off rapidly above 2 MeV. The 1/ spectrum defined in the energy range 0.55 eV to 2 MeV is a reasonable approximation for resonance integral calculations in a reactor spectrum under a cadmium cover, which can be compared to measured values by the cadmium ratio method, for example.
VI.6.3 1/ Spectrum in the Energy Range 0.5 eV to 20 MeV
Some authors prefer different energy boundaries to define the resonance integral. In the Atlas of Resonance Parameters by Mughabghab Mug16 , the integration boundaries are from 0.5 eV to 20 MeV. For convenience, both forms of the 1/ neutron spectrum are included in the spectra file of IRDFF-II.
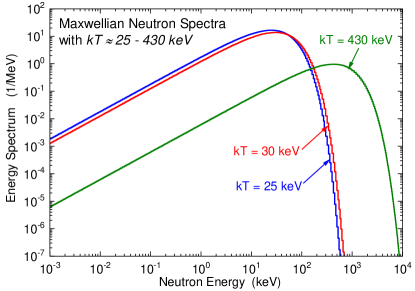
VI.6.4 High Temperature Maxwellian
A set of high temperature quasi-Maxwellian neutron spectra, 25–60 keV, are frequently used for studying the neutron capture reactions along the astrophysical s-process path Pau19 . While the ideal spectra are defined by the analytic form, these neutron spectra can be approximately realized using the thick target 7Li(p,n) reaction for incident proton energies near 2 MeV with modulation of the proton beam. The Maxwellian Averaged Cross Sections (MACS) for activation reactions are typically reported by the astrophysical community, but it must be remembered that the spectrum temperature is expressed in the centre-of-mass (CM) coordinate system, while the incident particle energy is normally given in the Lab system. Fortunately, the conversion is fairly straightforward. It can be shown that:
| (1) |
where is the ratio of the target mass to that of a neutron. For example, for hydrogen:
| (2) |
A range of Maxwellian neutron spectra, with ranging from thermal to 60 keV, are defined within the IRDFF-II library and can be used to support validation activities. Fig. 97 shows a representative sample of these spectra.
VI.6.5 Constant
The constant is a trivial field that allows simple averages to be calculated with the same tool. Namely, it allows the calculation of flat-spectrum average cross sections or the spectrum integrals when applied to the IRDFF-II library of neutron spectrum fields.
VI.6.6 Linear
The linear spectrum is a trivial field that allows the calculation of the average spectrum energy when applied to a spectrum in the library of spectrum fields in ENDF-6 format.
VI.7 Thermal Cross Sections and Resonance Integrals
For all of the non-threshold reactions, the thermal cross sections and resonance integrals in the IRDFF-II library entries have been compared to the data from the 2016 Atlas of Thermal Neutron Capture Cross Sections Resonance Integrals and Thermal Cross Sections Mug16 . Since in many cases these data were considered in the development of the underlying nuclear data evaluations, this data comparison constitutes a verification step in the library development.
An independent comparison can be made to the values derived from the Kayzero data-base for neutron activation analysis (NAA) by the k0 standardization method.
The Kayzero data-base is a library of nuclear constants that has been developed over many years and has been extensively tested in practical application for analytical work in certified laboratories. Most of the and factors in the library have been measured independently of any differential cross section, so they provide a convenient source of information for the validation of thermal capture cross sections and resonance integrals. The factors are related to the cross sections:
| (3) |
where is the molar mass, is the isotopic abundance, is the gamma-emission probability and is the cross section. Subscript stands for the measured nuclide and for the gold standard.
The factors are simply the ratios of the resonance integral in a pure spectrum and the thermal cross section:
| (4) |
Comparison of the cross sections and resonance integrals in the IRDFF-II library to the values derived from the Kayzero data-base Kayzero provides an alternative source of validation for the thermal constants and the resonance integrals and augments the comparison with information provided in the Atlas of Resonance Parameters by Mughabghab Mug16 .
In this implementation of k0-based metrics, the factors from the Kayzero library, the natural abundances and the gamma emission probabilities from the IRDFF-II decay data library are combined and used to reconstruct the thermal cross sections and resonance integrals. In principle, the derived values correspond to idealized thermal reactor spectrum with a Maxwellian thermal component and a 1/ epithermal component. The deviation from a 1/ behaviour of the cross sections in the thermal range, deviation from the 1/ spectrum shape in the epithermal range and the non-ideal cadmium filter are taken into account (although not rigorously in all cases), but these are corrections that are usually smaller than the experimental uncertainties. The thermal cross sections and resonance integrals derived from the Kayzero library were taken as the reference for comparison with the Atlas values and the quantities as extracted from the IRDFF-II library. Results from this validation step are presented in Sec. VII.13.
| Status | ||||
|---|---|---|---|---|
| # | Metric | Good | Acceptable | Poor |
| 1 | C/E | std. dev. | 3 std. dev. | 3 std. dev. |
| 2 | C/E Interval | within [0.9,1.1] | within [0.8,1.25] | outside [0.8,1.25] |
| 3 | Experimental Uncertainty | 15 % | 30 % | 30 % |
| 4 | Total Uncertainty | 25 % | 40 % | 40 % |
VII VALIDATION DATA – COMPARISON OF INTEGRAL METRICS IN STANDARD AND REFERENCE NEUTRON BENCHMARK FIELDS
One of the most powerful metrics employed in the validation of the IRDFF-II cross sections is the comparison of calculated-to-experimental (C/E) spectrum-averaged cross sections in various standard and reference benchmark neutron fields. Since an absolute determination of the neutron fluence can be difficult to assess for some of the reactor fields, a spectral index (SI), or the ratio of the activity for a given reaction to that for a common monitor reaction, is often used. The C/E ratio for the spectral indices is then the relevant metric used for validation. Another metric that supports validation is a comparison of the consistency of the relative activity for a set of measurements gathered in a given well-characterized neutron field. The following sections address the consideration of these integral metrics in the benchmark neutron fields.
The criteria that were adopted to characterize the quality of the validation evidence based on the comparison of the measured and calculated of the spectrum-averaged cross section are shown in Table 17. A “good” validation status requires, as a baseline criterion, that the calculated-to-experimental (C/E) ratio of the spectrum-averaged cross section be within two standard deviations of unity and, in addition, that it lies within the interval of [0.9: 1.1]. In addition to this characteristic, in order to ensure the experimental measurement had adequate fidelity we required that the experimental uncertainty be less than 15 %. The total uncertainty in the C/E must reflect the root-mean-squared sum of the measurement uncertainty, the spectrum uncertainty, and the cross-section uncertainty. To be sure that the benchmark neutron field was adequately characterized, we also required that the total uncertainty be less than 25 %.
A “good” validation status is color-coded green. An “acceptable” validation status is color-coded yellow and reflects a C/E ratio within three standard deviations of unity, a value within the interval [0.8, 1.25], a measurement uncertainty less than 30 %, and a total uncertainty less than 40 %. A “poor” validation status is color-coded as red and corresponds to a C/E that is more than three standard deviations from unity, or a value that is outside the interval [0.8, 1.25]. A measurement uncertainty greater than 30 % or a total uncertainty greater than 40 % does not necessarily reflect a “poor” validation state, but it does reflect an absence of a meaningful validation. These fields are left uncolored to reflect unknown status due to the poor quality of available information – either the measurement uncertainty or the neutron field characterization.
VII.1 252Cf SFNS
The standard 252Cf SFNS spectrum was evaluated purely from differential time-of-flight data and is independent of SACS. Therefore, the spectrum can be used to validate SACS (and vice versa). The SACS in the standard 252Cf SFNS spectrum were evaluated mostly by Mannhart Man06 . It is assumed that all acceptable SACS measurements available at the time were included in the evaluation. The measured values and the C/E values as a function of representative neutron energy (energy at which the reaction rate integral reaches 50 % of the integral over the full energy range) are shown in Table 18 and Fig. 98.
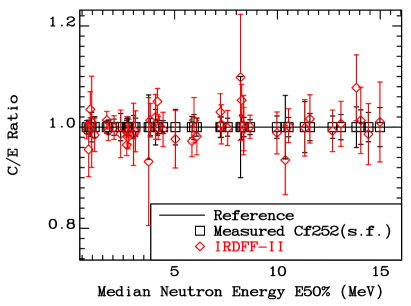
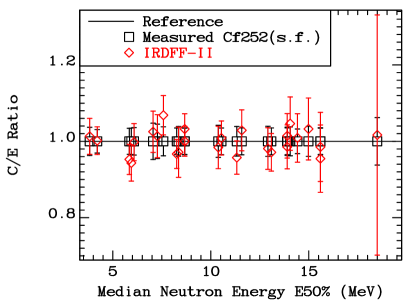
More recently, new measurements were performed at Řež to confirm Manhhart evaluations. The intense 252Cf source (about n/cm2/s) at Řež is well characterized, and the activation measurements achieved low uncertainties Sch19_2 . The results are shown in Table 19 and Fig. 99. The C/E uncertainties are colour-coded as defined in Table 17. The SACS in the standard 252Cf SFNS spectrum have practically no outliers and no trend in energy is observed. A special case is the 169Tm(n,3n) reaction (Tm1693) , which has a very high threshold, with median energy 18 MeV, where the assigned uncertainty of the 252Cf(s.f.) spectrum is very large due to the lack of measured data, and represents the dominant contribution to the large SACS uncertainty. Still, the C/E for that very special reaction is excellent.
| Reaction | Measured | Unc. | Calculated | Tot.Unc. | X.S.Unc. | C/E | Uncert. | Diff. | ||
|---|---|---|---|---|---|---|---|---|---|---|
| Notation | [MeV] | SACS [mb] | [%] | Reference | SACS [mb] | [%] | [%] | [%] | [%] | |
| Au197g | 0.724 | 75.5000 | 1.3 | Man11 | 74.9780 | 0.90 | 0.52 | 0.9931 | 1.85 | -0.69 |
| Ta181g | 0.818 | 87.3000 | 1.4 | Man11 | 83.4430 | 5.47 | 5.41 | 0.9558 | 5.64 | -4.42 |
| Th232g | 0.930 | 87.0000 | 1.8 | Man11 | 93.4500 | 3.80 | 3.77 | 1.0741 | 4.22 | 7.41 |
| Cu63g | 0.964 | 10.3000 | 2.9 | Man11 | 10.4090 | 8.44 | 8.41 | 1.0106 | 8.93 | 1.06 |
| In115gm | 1.116 | 125.6000 | 2.1 | Man06 | 123.6800 | 2.64 | 2.61 | 0.9847 | 3.46 | -1.53 |
| U235f | 1.703 | 1210.0000 | 1.2 | Man06 | 1226.7000 | 1.21 | 1.21 | 1.0138 | 1.70 | 1.38 |
| Pu239f | 1.774 | 1812.0000 | 1.4 | Man06 | 1797.8000 | 1.25 | 1.25 | 0.9922 | 1.85 | -0.78 |
| Np237f | 2.053 | 1361.0000 | 1.6 | Man06 | 1359.8000 | 1.70 | 1.69 | 0.9991 | 2.33 | -0.09 |
| Rh103m | 2.380 | 734.3000 | 2.7 | Man08 | 724.9200 | 3.95 | 3.94 | 0.9801 | 2.39 | -1.99 |
| In115nm | 2.673 | 197.4000 | 1.4 | Man06 | 190.4800 | 1.70 | 1.66 | 0.9649 | 2.18 | -3.51 |
| Nb93nm | 2.685 | 147.5000 | 1.7 | Zol10 | 146.0300 | 2.61 | 2.59 | 1.0002 | 4.31 | 0.02 |
| In113nm | 2.730 | 161.2000 | 2.0 | Man08 | 157.9900 | 1.24 | 1.18 | 0.9801 | 2.39 | -1.99 |
| U238f | 2.768 | 325.7000 | 1.6 | Man06 | 321.5400 | 1.29 | 1.22 | 0.9872 | 2.09 | -1.28 |
| Th232f | 3.006 | 84.5500 | 2.3 | Csi78 | 83.3500 | 5.80 | 5.78 | 0.9864 | 8.20 | -1.36 |
| Hg199nm | 3.098 | 298.4000 | 1.8 | Man06 | 295.9400 | 3.66 | 3.63 | 0.9918 | 4.08 | -0.82 |
| BH3 | 3.737 | 11.0000 | 6.4 | Cse78 | 10.2500 | 11.97 | 11.96 | 0.9318 | 13.56 | -6.82 |
| Ti47p | 3.817 | 19.2700 | 1.7 | Man06 | 19.5330 | 2.80 | 2.73 | 1.0136 | 3.26 | 1.36 |
| S32p | 4.074 | 72.5400 | 3.5 | Man06 | 74.0150 | 2.59 | 2.48 | 1.0203 | 4.35 | 2.03 |
| Zn64p | 4.167 | 40.5900 | 1.6 | Man06 | 42.6470 | 1.86 | 1.69 | 1.0376 | 3.67 | 3.76 |
| Ni58p | 4.203 | 117.5000 | 1.3 | Man06 | 117.3100 | 1.89 | 1.74 | 0.9984 | 2.29 | -0.16 |
| Fe54p | 4.438 | 86.8400 | 1.3 | Man06 | 86.4490 | 3.16 | 3.06 | 0.9955 | 3.43 | -0.45 |
| Pb204nm | 5.041 | 20.8700 | 3.5 | Man06 | 20.3740 | 4.67 | 4.57 | 0.9772 | 5.07 | -2.28 |
| Al27p | 5.843 | 4.8800 | 2.1 | Man06 | 4.7445 | 2.35 | 2.05 | 0.9722 | 3.18 | -2.78 |
| Co59p | 5.943 | 1.6900 | 2.5 | Man06 | 1.7132 | 3.65 | 3.46 | 1.0137 | 4.41 | 1.37 |
| Ti46p | 6.081 | 14.0700 | 1.8 | Man06 | 13.8140 | 3.28 | 3.05 | 0.9818 | 3.73 | -1.82 |
| Si28p | 7.226 | 6.9000 | 2.0 | Zol14 | 7.1069 | 2.85 | 2.47 | 1.0300 | 3.46 | 3.00 |
| Cu63a | 7.274 | 0.6887 | 2.0 | Man06 | 0.6925 | 3.28 | 2.97 | 1.0055 | 3.82 | 0.55 |
| Fe56p | 7.579 | 1.4650 | 1.8 | Man06 | 1.4626 | 2.98 | 2.60 | 0.9984 | 3.47 | -0.16 |
| U2382 | 8.208 | 19.2000 | 10. | Bli87 | 21.0920 | 5.34 | 5.10 | 1.0442 | 12.13 | 4.42 |
| Mg24p | 8.260 | 1.9960 | 2.4 | Man06 | 2.1020 | 1.78 | 0.80 | 1.0531 | 3.02 | 5.31 |
| Ti48p | 8.354 | 0.4247 | 1.9 | Man06 | 0.4264 | 5.53 | 5.30 | 1.0039 | 5.84 | 0.39 |
| Co59a | 8.372 | 0.2218 | 1.9 | Man06 | 0.2210 | 3.87 | 3.54 | 0.9963 | 4.30 | -0.37 |
| Al27a | 8.668 | 1.0160 | 1.5 | Man06 | 1.0167 | 1.77 | 0.71 | 1.0007 | 2.18 | 0.07 |
| V51a | 9.975 | 0.0390 | 2.2 | Man06 | 0.0386 | 3.56 | 3.02 | 0.9885 | 4.19 | -1.15 |
| Tm1692 | 10.400 | 6.6900 | 6.3 | Man02 | 6.2551 | 3.77 | 3.21 | 1.069 | 5.64 | +6.90 |
| Au1972 | 10.542 | 5.5060 | 1.9 | Man06 | 5.5213 | 2.75 | 1.87 | 1.0028 | 3.30 | 0.28 |
| Nb932m | 11.328 | 0.7910 | 5.1 | Man06 | 0.7899 | 2.38 | 0.84 | 0.9986 | 5.02 | -0.14 |
| I1272 | 11.580 | 2.0690 | 2.7 | Man06 | 2.1027 | 3.83 | 3.03 | 1.0163 | 4.70 | 1.63 |
| Cu652 | 12.680 | 0.6582 | 2.2 | Man06 | 0.6533 | 3.52 | 1.89 | 0.9926 | 4.16 | -0.74 |
| Co592 | 13.090 | 0.4051 | 2.5 | Man06 | 0.4078 | 3.66 | 1.52 | 1.0066 | 4.44 | 0.66 |
| Cu632 | 13.840 | 0.1844 | 4.0 | Man06 | 0.1987 | 4.51 | 1.38 | 1.0778 | 6.02 | 7.78 |
| F192 | 14.052 | 0.0161 | 3.4 | Man06 | 0.0163 | 5.50 | 2.90 | 1.0133 | 6.45 | 1.33 |
| Zr902 | 14.424 | 0.2210 | 2.9 | Man06 | 0.2179 | 5.39 | 0.91 | 0.9861 | 6.12 | -1.39 |
| Ni582 | 14.986 | 8.56E-3 | 3.6 | Man08 | 8.65E-3 | 6.79 | 1.29 | 1.0102 | 7.81 | 1.02 |
| Reaction | Measured | Unc. | Calculated | Tot.Unc. | X.S.Unc. | C/E | Uncert. | Diff. | ||
|---|---|---|---|---|---|---|---|---|---|---|
| Notation | [MeV] | SACS [mb] | [%] | Reference | SACS [mb] | [%] | [%] | [%] | [%] | |
| Ti47p | 3.817 | 19.2800 | 3.70 | Sch19a | 19.5330 | 2.80 | 2.73 | 1.0131 | 4.64 | 1.31 |
| Ni58p | 4.203 | 117.1000 | 3.07 | Sch19a | 117.3100 | 1.89 | 1.74 | 1.0018 | 3.61 | 0.18 |
| Al27p | 5.843 | 4.9800 | 3.41 | Sch18_1 | 4.7445 | 2.35 | 2.05 | 0.9527 | 4.14 | -4.73 |
| Co59p | 5.943 | 1.8160 | 3.47 | Sch19 | 1.7132 | 3.65 | 3.46 | 0.9434 | 5.04 | -5.66 |
| Ti46p | 6.081 | 13.8450 | 3.60 | Sch19a | 13.8140 | 3.28 | 3.05 | 0.9978 | 4.87 | -0.22 |
| Ni60p | 7.054 | 2.7300 | 4.76 | Sch18_1 | 2.7985 | 2.27 | 1.81 | 1.0251 | 5.28 | 2.51 |
| Cu63a | 7.274 | 0.6833 | 4.49 | Sch19a | 0.6925 | 3.28 | 2.97 | 1.0135 | 5.56 | 1.35 |
| Fe56p | 7.579 | 1.3690 | 3.80 | Sch19a | 1.4626 | 2.98 | 2.60 | 1.0684 | 4.83 | 6.84 |
| Mg24p | 8.260 | 2.1740 | 3.50 | Sch19a | 2.1020 | 1.78 | 0.80 | 0.9669 | 3.92 | -3.31 |
| Ti48p | 8.354 | 0.4389 | 3.90 | Sch19a | 0.4264 | 5.53 | 5.30 | 0.9715 | 6.76 | -2.85 |
| Al27a | 8.668 | 0.9851 | 3.45 | Sch18_1 | 1.0167 | 1.77 | 0.71 | 1.0321 | 3.88 | 3.21 |
| Al27a | 8.668 | 1.0165 | 3.49 | Sch19a | 1.0167 | 1.77 | 0.71 | 1.0002 | 3.92 | 0.02 |
| Tm1692 | 10.400 | 6.3570 | 4.20 | Sch19 | 6.2551 | 3.77 | 3.21 | 0.9840 | 5.64 | -1.60 |
| Au1972 | 10.542 | 5.4740 | 3.49 | Sch19 | 5.5213 | 2.75 | 1.87 | 1.0086 | 4.44 | 0.86 |
| Nb932m | 11.328 | 0.8250 | 3.88 | Sch19 | 0.7899 | 2.38 | 0.84 | 0.9574 | 4.55 | -4.26 |
| I1272 | 11.580 | 2.0440 | 3.52 | Sch18_2 | 2.1027 | 3.83 | 3.03 | 1.0287 | 5.20 | 2.87 |
| Mn552 | 12.900 | 0.4820 | 3.94 | Sch19 | 0.4729 | 3.92 | 2.32 | 0.9811 | 5.56 | -1.89 |
| Co592 | 13.090 | 0.4199 | 3.50 | Sch19 | 0.4078 | 3.66 | 1.52 | 0.9712 | 5.06 | -2.88 |
| Y892 | 13.902 | 0.3410 | 3.52 | Sch18_1 | 0.3459 | 4.53 | 1.24 | 1.0144 | 5.74 | 1.44 |
| Y892 | 13.902 | 0.3510 | 3.70 | Sch19 | 0.3459 | 4.53 | 1.24 | 0.9855 | 5.85 | -1.45 |
| F192 | 14.053 | 0.0156 | 3.78 | Sch18_1 | 0.0163 | 5.50 | 2.90 | 1.0464 | 6.67 | 4.64 |
| Zr902 | 14.424 | 0.2160 | 3.24 | Sch18_1 | 0.2179 | 5.39 | 0.91 | 1.0089 | 6.29 | 0.89 |
| Ni582 | 14.987 | 8.37E-3 | 3.94 | Sch19a | 8.65E-3 | 6.79 | 1.29 | 1.0324 | 7.85 | 3.24 |
| Na232 | 15.597 | 8.70E-3 | 3.45 | Sch18_1 | 8.57E-3 | 8.52 | 1.28 | 0.9854 | 9.19 | -1.46 |
| Na232 | 15.597 | 8.98E-3 | 3.56 | Sch18_2 | 8.57E-3 | 8.52 | 1.28 | 0.9547 | 9.24 | -4.53 |
| Tm1693 | 18.506 | 0.0145 | 6.21 | Sch19a | 0.0147 | 30.32 | 5.76 | 1.0166 | 30.95 | 1.66 |
VII.2 235U(nth,f) PFNS
The reference prompt fission neutron spectrum (PFNS) for 235U(nth,f) PFNS ; PFNS1 ; PFNS2 was shown in Fig. 68 as ratio to the Maxwellian distribution with MeV. The uncertainties in that evaluated spectrum were constrained at high energy by the use of 90Zr(n,2n) SACS point. Recommended SACS in the 235U(nth,f) PFNS are listed in Table 20. The C/E ratios of SACS in the reference 235U(nth,f) PFNS as a function of representative neutron energy are shown in Fig. 100. For the 235U(nth,f) PFNS field no trend in energy is observed. An outlier is the tritium production reaction on 10B (B10H3) measured by Wyman in 1958.Measurements of the capture SACS are usually subject to large corrections for room-return and multiple scattering, which might be the cause of some discrepancy in the U238g reaction. Poorer (but acceptable) agreement is also noted for 63Cu(n,2n), 238U(n,2n) and 204Pb(n,n’) reactions. New extensive measurements of SACS in the reference 235U(nth,f) neutron field are on-going.
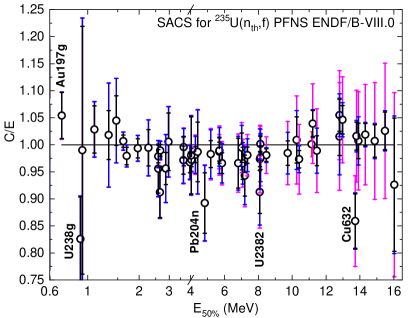
| Reaction | E50% | Measured SACS | Calculated SACS | C/E | |||||
|---|---|---|---|---|---|---|---|---|---|
| Notation | MeV | Value, mb | Unc.,% | Reference | Value, mb | XS Unc.,% | Sp.Unc.,% | Tot.Unc.,% | |
| Au197g | 0.705 | 7.400E+01 | 4.05 | Fab68 | 7.8011E+01 | 0.51 | 0.80 | 0.95 | 1.054 4.16 % |
| U238g | 0.907 | 8.500E+01 | 9.41 | Fab68 | 7.0197E+01 | 1.97 | 0.69 | 2.09 | 0.826 9.64 % |
| Cu63g | 0.932 | 1.080E+01 | 23.15 | Fab68 | 1.0693E+01 | 8.57 | 0.64 | 8.60 | 0.990 24.70% |
| In115gm | 1.095 | 1.245E+02 | 4.25 | Zol13 | 1.2805E+02 | 2.61 | 0.58 | 2.67 | 1.029 5.02 % |
| B10He4 | 1.329 | 5.410E+02 | 4.44 | Oli82 | 5.5077E+02 | 8.35 | 0.54 | 8.37 | 1.018 9.47 % |
| Li6He4 | 1.472 | 4.560E+02 | 4.39 | Oli82 | 4.7641E+02 | 6.03 | 0.60 | 6.06 | 1.045 7.48 % |
| U235f | 1.618 | 1.217E+03 | 1.12 | Man08 | 1.2253E+03 | 1.21 | 0.36 | 1.26 | 1.007 1.69 % |
| Pu239f | 1.691 | 1.831E+03 | 1.65 | Man08 | 1.7933E+03 | 1.25 | 0.37 | 1.30 | 0.979 2.10 % |
| Np237f | 1.965 | 1.350E+03 | 1.78 | Man08 | 1.3413E+03 | 1.58 | 0.47 | 1.75 | 0.994 2.43 % |
| Rh103nm | 2.267 | 7.103E+02 | 3.38 | Kob92 ; Hor89 ; Gri83 | 7.0643E+02 | 3.95 | 0.53 | 3.99 | 0.995 5.23 % |
| Nb93n | 2.589 | 1.476E+02 | 4.74 | Zol99 | 1.4109E+02 | 2.63 | 0.66 | 2.71 | 0.956 5.46 % |
| In115nm | 2.589 | 1.878E+02 | 1.23 | Man08 | 1.8383E+02 | 1.68 | 0.69 | 1.82 | 0.979 2.20 % |
| In113nm | 2.651 | 1.668E+02 | 5.13 | Zol13 | 1.5217E+02 | 1.19 | 0.72 | 1.39 | 0.912 5.31 % |
| U238f | 2.659 | 3.094E+02 | 1.13 | Man08 | 3.0618E+02 | 1.22 | 0.75 | 1.43 | 0.990 1.82 % |
| Th232f | 2.867 | 8.186E+01 | 3.10 | Gil84 | 7.8267E+01 | 5.79 | 0.78 | 5.84 | 0.956 6.61 % |
| Hg199nm | 2.972 | 2.787E+02 | 5.30 | Zol08 | 2.8024E+02 | 3.68 | 0.77 | 3.76 | 1.006 6.50 % |
| B10H3 | 3.533 | 3.023E+01 | 6.70 | Wym58 | 4.7915E+01 | 12.37 | 0.85 | 12.40 | 1.585 14.09% |
| P31p | 3.633 | 3.586E+01 | 2.68 | Zol14 | 3.4842E+01 | 3.47 | 1.06 | 3.63 | 0.972 4.51 % |
| Ti47p | 3.647 | 1.784E+01 | 1.99 | Man08 | 1.7765E+01 | 2.79 | 0.99 | 2.96 | 0.996 3.57 % |
| S32p | 3.967 | 6.908E+01 | 1.97 | Man08 | 6.6846E+01 | 2.53 | 1.14 | 2.78 | 0.968 3.41 % |
| Zn64p | 4.036 | 3.889E+01 | 7.25 | Zol08 | 3.8133E+01 | 1.74 | 1.20 | 2.12 | 0.981 7.55 % |
| Ni58p | 4.051 | 1.082E+02 | 1.30 | Man08 | 1.0519E+02 | 1.75 | 1.14 | 2.09 | 0.972 2.46 % |
| Fe54p | 4.294 | 7.809E+01 | 1.50 | Zol13 | 7.6659E+01 | 3.16 | 1.24 | 3.39 | 0.982 3.71 % |
| Zn67p | 4.421 | 9.660E-01 | 5.59 | Zol13 | 9.5344E-01 | 5.52 | 1.19 | 5.64 | 0.987 7.94 % |
| Pb204nm | 4.839 | 1.946E+01 | 6.27 | Kim71 ; Bro77 | 1.7364E+01 | 4.66 | 1.42 | 4.87 | 0.892 7.94 % |
| Mo92pm | 5.190 | 6.687E+00 | 2.53 | Zol13 | 6.5723E+00 | 3.83 | 1.49 | 4.11 | 0.983 4.83 % |
| Al27p | 5.700 | 3.902E+00 | 1.77 | Man08 | 3.8527E+00 | 3.49 | 12.23 | 2.66 | 0.987 3.20 % |
| Co59p | 5.703 | 1.396E+00 | 2.36 | Man08 | 1.3812E+00 | 3.59 | 1.68 | 3.97 | 0.989 4.62 % |
| Ti46p | 5.862 | 1.151E+01 | 1.99 | Man08 | 1.1118E+01 | 3.19 | 1.74 | 3.64 | 0.966 4.15 % |
| Ni60p | 6.811 | 2.180E+00 | 4.77 | Man11 | 2.1062E+00 | 1.98 | 2.10 | 2.88 | 0.966 5.57 % |
| Cu63a | 7.019 | 5.173E-01 | 2.74 | Man08 ; Kos19_1 | 5.1459E-01 | 3.09 | 2.16 | 3.77 | 0.995 4.66 % |
| Si28p | 7.079 | 5.470E+00 | 3.07 | Zol14 | 5.2831E+00 | 2.53 | 2.28 | 3.41 | 0.966 4.59 % |
| Fe54a | 7.205 | 8.650E-01 | 4.02 | Sua97 ; Hor89 ; Bus87 | 8.1560E-01 | 4.02 | 2.25 | 4.59 | 0.943 6.10 % |
| Fe56p | 7.362 | 1.079E+00 | 1.54 | Man08 | 1.0583E+00 | 2.68 | 2.38 | 3.59 | 0.981 3.91 % |
| U2382 | 8.087 | 1.600E+01 | 4.34 | Kob76 ; Has78 ; Sha83 | 1.4604E+01 | 5.10 | 2.92 | 5.87 | 0.913 7.30 % |
| Ti48p | 8.103 | 3.014E-01 | 1.46 | Man08 ; Kos19_1 | 2.9347E-01 | 5.57 | 2.84 | 6.25 | 0.974 6.42 % |
| Mg24p | 8.125 | 1.449E+00 | 1.43 | Man08 ; Kos19_1 | 1.4512E+00 | 0.83 | 2.85 | 2.97 | 1.002 3.30 % |
| Co59a | 8.127 | 1.563E-01 | 2.25 | Man08 | 1.5260E-01 | 3.99 | 2.81 | 4.88 | 0.976 5.37 % |
| Al27a | 8.471 | 7.005E-01 | 1.19 | Man08 ; Kos19_2 | 6.8720E-01 | 0.74 | 3.16 | 3.24 | 0.981 3.45 % |
| V51a | 9.737 | 2.429E-02 | 2.29 | Man08 | 2.3918E-02 | 3.17 | 4.46 | 5.48 | 0.985 5.94 % |
| Tm1692 | 10.265 | 3.735E+00 | 4.23 | Zol10 | 3.7685E+00 | 3.34 | 6.01 | 6.88 | 1.009 8.08 % |
| Au1972 | 10.414 | 3.387E+00 | 1.67 | Man08 ; Kos19_1 | 3.2969E+00 | 1.93 | 6.11 | 6.41 | 0.973 6.62 % |
| Nb932 | 11.210 | 4.348E-01 | 2.32 | Zol13 | 4.5189E-01 | 0.86 | 6.65 | 6.71 | 1.039 7.10 % |
| I1272 | 11.459 | 1.199E+00 | 2.79 | Zol08 ; Bur19 | 1.1860E+00 | 3.16 | 6.60 | 7.32 | 0.989 7.83 % |
| Mn552 | 12.796 | 2.356E-01 | 2.81 | Man08 ; Bur19 | 2.4852E-01 | 2.48 | 6.84 | 7.28 | 1.055 7.80 % |
| As752 | 12.797 | 3.207E-01 | 3.47 | Zol99 ; Kos18 ; Kos19_1 | 3.2561E-01 | 6.07 | 6.87 | 9.16 | 1.015 9.80 % |
| Co592 | 12.974 | 2.028E-01 | 2.51 | Man08 | 2.1220E-01 | 1.65 | 6.98 | 7.17 | 1.046 7.60 % |
| Cu632 | 13.721 | 1.160E-01 | 5.88 | Gru68 | 9.9640E-02 | 1.44 | 7.69 | 7.82 | 0.859 9.80 % |
| Y892 | 13.797 | 1.697E-01 | 2.34 | Rau68 ; Ste70 ; Boj92 ; Kos18 ; Kos19_1 | 1.7274E-01 | 1.30 | 7.87 | 7.97 | 1.015 8.37 % |
| F192 | 13.911 | 8.056E-03 | 3.26 | Man08 ; Kos16 ; Kos19_2 | 8.1151E-03 | 2.99 | 7.86 | 8.41 | 1.007 9.02 % |
| Zr902 | 14.320 | 1.041E-01 | 2.02 | Man08 ; Kos18 ; Kos19_2 | 1.0607E-01 | 0.92 | 8.84 | 8.89 | 1.019 9.12 % |
| Ni582 | 14.879 | 4.076E-03 | 2.98 | Kob80a ; Hor91 ; Sek81 ; Man85_2 | 4.1047E-03 | 1.29 | 10.23 | 10.31 | 1.007 10.73% |
| Na232 | 15.483 | 3.860E-03 | 3.39 | Kos16 ; Kos18_2 | 3.9599E-03 | 1.27 | 11.65 | 11.72 | 1.026 12.20% |
| Al272 | 16.023 | 3.760E-03 | 13.30 | Zol17 | 3.4823E-03 | 2.06 | 1.69 | 12.72 | 0.926 18.40% |
VII.3 Ratio of 252Cf SFNS to 235U(nth,f) PFNS Spectrum-averaged Cross Sections
The activation cross sections in the 252Cf SFNS and 235U(nth,f) PFNS benchmark neutron fields discussed in Secs. VII.1 and VII.2 form the foundation for the IRDFF-II validation. In addition to these two separate sets of validation data for a fission neutron spectrum, the smooth behaviour, i.e., the systematics, of the ratios of these spectrum-averaged cross sections, as a function of the response energy for a given reaction, provides another good indicator of the fidelity of the cross sections. This ratio is independent of the gamma emission probability, which is a significant source of measured SACS uncertainties. The application of this metric and a systematic of this ratio is addressed in Ref. Cap18 . The systematic can be used also to assess the quality of experimental data in one of the reference fields Cap18 . The actual status of C/E ratios computed with IRDFF-II is depicted in Fig. 101. The ratio for the reaction 63Cu(n,2n) is an outlier indicating that one or both of the SACS measurements used to calculate the ratio are likely wrong. Indeed, it can be seen that the corresponding C/E of this particular reaction in the 235U(nth,f) PFNS neutron field is 0.859(9.8%) pointing out to a possible experimental issue. A similar situation is found for the 238U(n,2n) reaction, where the C/E in the 235U(nth,f) PFNS neutron field is 0.913(7.3%), which also points to a potential experimental problem. Corresponding C/E in the 252Cf SFNS field show good agreement for these two reactions.
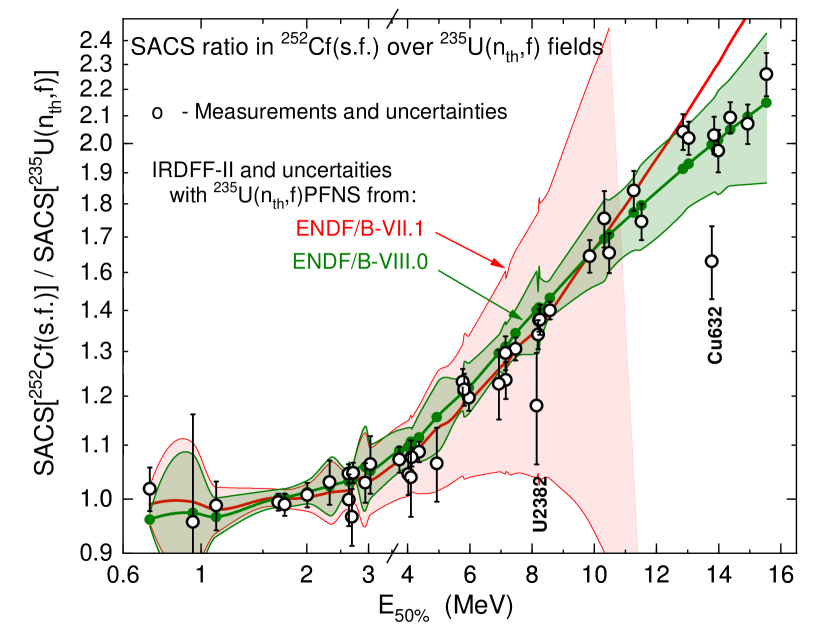
VII.4 Measurements in the SPR-III Fast Burst Reactor Central Cavity
The baseline measured quantities in this reference benchmark field are end-of-irradiation (EOI) spectrum-averaged cross sections measured in operation #13127, which was a 16-minute steady-state operation that took place on 1/27/2006 and represented a total facility-reported reactor integrated power of 125 MJ.
Although a baseline set of activation foils were used in this reactor operation #13127, it was desirable to add more reactions to the set of measured data, so additional reactor exposures of activation foils were conducted. In order to eliminate the effect of variations in the reactor power during the other exposures, a 58Ni(n,p)58Co monitor activity was used to facilitate a renormalization of data gathered in the other operations to the baseline exposure. When required, corrections were made in the measured activities of other foils to convert them to represent the end-of-irradiation from the baseline 16-minute uniform power operation. The other reactor operations are detailed in Table 21.
| Date | Oper. | Reactor | Comment |
|---|---|---|---|
| [d/m/y] | No. | Power | |
| 19/01/2006 | 13090 | 10 kW, 250 s | 3x3 grid Foils Set #1 |
| 19/01/2006 | 13091 | 10 kW, | 235U foil |
| 19/01/2006 | 13092 | 10 kW, | 239Pu foil |
| 26/01/2006 | 13117 | 5 kW, 275 s | 237Np foil |
| 26/01/2006 | 13118 | — | 238U foil |
| 27/01/2006 | 13127 | 125 MJ, 16 min, | Foil Set #2 |
| 10/02/2006 | 13156 | 27.5 MJ, 40 min, | — |
| 14/04/2006 | 13295 | 27.5 MJ, 138 min, | Sc in boron ball |
| 14/04/2006 | 13296 | 127.5 MJ, 217 min, | Mn in boron ball |
| 19/05/2006 | 13368 | 25 MJ, 32 min, | Fe in boron ball |
| 19/05/2006 | 13369 | — | Ag in boron ball |
| 30/06/2006 | 13452 | 25 MJ, 190 min, | 3x3 grid Foils Set #1 |
In some of the cases covers were used to shield the activation foil and shift the sensitivity of the measured response to higher energies. These measurements used the following cover geometries:
-
1.
“bare” indicating a bare foil with a thickness between 5 and 10 mils;
-
2.
“Cd” indicating a cylindrical cadmium cover with thickness of 2.587x10⁻³ atoms/barn;
-
3.
“Cdtk” indicating a cylindrical cadmium cover with thickness of 4.705x10⁻³ atoms/barn;
-
4.
“Cdtk/B4C” indicates an inner thick cadmium cover with an areal thickness of 4.705x10⁻³ atoms/barn and an outer spherical boron ball. The boron ball is a spherical shell with an outer diameter of 4.76 cm and thickness of 1.03 cm. The B4C has a density of 2.5 g/cm2 and used isotopically enriched Boron (91.67 % 10B and 8.33 % 11B).
A detailed description of the covers and of how self-shielding effects are rigorously addressed in their use in the activation measurements can be found in Reference Gri90 . Data were gathered for a total of 40 combinations of reactions and covers in this reference field.
The fission foils were in the form of a sintered oxide (uranium oxide-to-metal ratio of 1.995; plutonium ratio of 1.886) measuring approximately 0.5 inch by 0.03-inch thick, and having an approximate mass of 1 gram. The isotopic mixtures of the various fission foils are given in Table 22.
| Foil | Isotope | Atom Fraction∗ |
| Enriched 235U | 235U | 0.9300 |
| 234U | 0.00981 | |
| 236U | 0.00359 | |
| 238U | 0.0566 | |
| Depleted 238U | 238U | 0.9979 |
| 234U | 0.00001 | |
| 235U | 0.00205 | |
| 236U | 0.00004 | |
| 239Pu | 239Pu | 0.869965 |
| 238Pu | 0.0006798 | |
| 240Pu | 0.115968688 | |
| 241Pu | 0.010797 | |
| 242Pu | 0.00235936 | |
| 235U | 0.000199946 | |
| 237Np | 0.00002999 | |
| ∗ Atom fraction sum of the number of atoms of the prime sensor element is unity. Due to contaminants, the total sum may be greater than 1.0. | ||
The baseline set of end-of-irradiation activity measurements, normalized using the 58Ni(n,p)58Co monitor reaction used in the same reactor operation, are shown in Table 23. We cannot compare these measured activities to the corresponding calculated dosimetry metrics, spectrum-averaged cross sections, in the absence of a known neutron fluence level for the reference operation. Since a spectral index (SI) is defined to be the ratio of the spectrum-averaged cross sections for two specified reactions – where one is generally considered to be a reference monitor reaction – this quantity is independent of the neutron fluence. Thus, we have adopted the C/E for spectral indices, using the 58Ni(n,p)58Co reaction as the reference reaction, as the relevant comparison metric. The C/E spectral index metric, for the reaction “” and the monitor “Ni58p”, is notated as the CoESIα/Ni58p.
Table 23 documents the data in this field for the 40 measured reactions. The entries in the table start with the 58Ni(n,p) normalizing reaction but are then ordered with respect to the increasing mean response energy for the reactions. The table includes:
-
1.
Reaction identifiers;
-
2.
Median response energy in this neutron field for the indicated dosimeter/cover combination;
-
3.
measured end-of-irradiation (EOI) activities with measurement uncertainty;
-
4.
uncertainty contribution in the calculated spectrum-averaged cross sections due to the a priori spectrum;
-
5.
calculated spectral index and associated uncertainty, including the contributions from the cross section and spectrum;
-
6.
calculated-over-experimental (C/E) ratio of the spectral index (SI) and associated uncertainty.
| Measured Act. | Calc. | Spectral | SI C/E | |||||
| Entry Label | Bq/atom or | Unc. | SACS Unc. | Index (SI) | Unc. | Value | Unc. | |
| [MeV] | Fiss./atom | [%] | [%] | [%] | [%] | |||
| Sc45g-Cd | 0.2060 | 1.3720E-20 | 3.30 | 23.14 | 2.0093E-01 | 35.84 | 1.0832 | 36.12 |
| Mn55g-Cd | 0.2348 | 6.6180E-18 | 2.60 | 10.61 | 1.0265E-01 | 35.45 | 0.8926 | 35.68 |
| Au197g-bare | 0.2385 | 7.4140E-18 | 4.50 | 9.87 | 2.8463E+00 | 36.52 | 0.8827 | 36.92 |
| Au197g-Cd | 0.2505 | 6.5740E-18 | 4.50 | 10.11 | 2.7742E+00 | 36.93 | 0.9706 | 37.33 |
| Sc45g-Cdtk/B4C | 0.2515 | 1.1920E-20 | 3.50 | 11.26 | 1.8599E-01 | 39.01 | 1.1540 | 39.29 |
| Na23g-bare | 0.2628 | 7.0870E-20 | 2.10 | 4.21 | 5.8091E-03 | 37.54 | 0.8146 | 37.73 |
| Fe58g-Cd | 0.2883 | 7.9740E-21 | 2.80 | 9.63 | 6.8808E-02 | 35.13 | 1.2018 | 35.38 |
| Na23g-Cdna | 0.2887 | 7.1700E-20 | 2.10 | 3.41 | 5.4893E-03 | 32.59 | 0.7609 | 32.81 |
| Mn55g-Cdtk/B4C | 0.2958 | 4.5570E-18 | 2.70 | 9.18 | 9.0805E-02 | 38.60 | 1.1468 | 38.82 |
| W186g-bare | 0.3215 | 7.4543E-18 | 9.02 | 8.56 | 1.2806E+00 | 34.08 | 1.0769 | 35.39 |
| Cu63g-Cd | 0.3395 | 3.3020E-18 | 2.20 | 7.62 | 3.1820E-01 | 35.77 | 1.1281 | 35.97 |
| Na23g-Cdtk/B4C | 0.3589 | 5.9630E-20 | 2.10 | 5.28 | 6.2782E-03 | 33.33 | 1.0464 | 33.54 |
| U235f-Cdtk | 0.6877 | 1.7550E-11 | 3.00 | 1.27 | 2.4819E+01 | 29.38 | 1.0925 | 29.69 |
| U235f-Cdtk/B4C | 0.7568 | 1.5000E-11 | 3.00 | 0.37 | 2.2920E+01 | 29.39 | 1.1804 | 29.71 |
| Pu239f-Cdtk | 0.8244 | 2.2330E-11 | 2.70 | 1.44 | 3.3176E+01 | 27.33 | 1.1477 | 27.64 |
| Pu239f-Cdtk/B4C | 0.8812 | 1.9120E-11 | 2.70 | 2.33 | 3.0745E+01 | 27.56 | 1.2422 | 27.86 |
| Np237f-Cdtk | 1.3904 | 1.2340E-11 | 2.80 | 11.85 | 1.7581E+01 | 22.87 | 1.1006 | 23.25 |
| Np237f-Cdtk/B4C | 1.3952 | 1.1820E-11 | 2.80 | 12.22 | 1.6182E+01 | 21.34 | 1.0576 | 21.74 |
| In115nm-bare | 2.1498 | 6.2040E-17 | 4.70 | 18.12 | 2.0190E+00 | 15.57 | 1.0779 | 16.55 |
| U238f-Cd | 2.2862 | 2.3170E-12 | 3.20 | 19.29 | 3.2721E+00 | 12.77 | 1.0909 | 13.53 |
| U238f-Cdtk/B4C | 2.2909 | 2.2230E-12 | 3.20 | 19.53 | 2.9664E+00 | 11.44 | 1.0308 | 12.28 |
| Ti47p-Cd | 3.1728 | 2.8820E-19 | 2.70 | 21.61 | 1.7116E-01 | 2.97 | 1.0991 | 5.07 |
| S32p-bare | 3.5235 | 2.5080E-19 | 3.00 | 23.78 | 5.9089E-01 | 1.36 | 1.0221 | 4.52 |
| Ni58p-Cd | 3.5954 | 8.7520E-20 | 3.10 | 23.51 | 1.0000E+00 | 0.00 | 1.0000 | 4.38 |
| Zn64p-Cd | 3.6230 | 3.8820E-18 | 2.20 | 23.89 | 3.5650E-01 | 1.36 | 1.0749 | 4.04 |
| Fe54p-Cd | 3.6969 | 1.4000E-20 | 3.20 | 24.14 | 7.3304E-01 | 1.27 | 1.0396 | 4.63 |
| Al27p-Cd | 5.0886 | 2.8720E-17 | 3.00 | 27.07 | 3.3676E-02 | 11.64 | 1.0675 | 12.41 |
| Co59p-bare | 5.1337 | 1.8835E-21 | 5.18 | 26.70 | 1.3281E-02 | 11.12 | 0.9818 | 12.65 |
| Ti46p-Cd | 5.2634 | 7.3250E-21 | 3.40 | 27.59 | 1.0288E-01 | 12.29 | 1.0389 | 13.13 |
| Cu63a-bare | 6.3286 | 1.6723E-23 | 5.14 | 28.41 | 5.1287E-03 | 16.82 | 0.9873 | 17.86 |
| Fe56p-Cd | 6.6224 | 5.4080E-19 | 2.40 | 29.70 | 1.0197E-02 | 0.01 | 1.0851 | 3.92 |
| Ti48p-Cd | 7.3414 | 8.6840E-21 | 1.20 | 30.16 | 2.9767E-03 | 20.68 | 1.1673 | 20.94 |
| Mg24p-Cd | 7.4113 | 1.2420E-19 | 3.00 | 30.77 | 1.4247E-02 | 21.75 | 1.1400 | 22.18 |
| Al27a-Cd | 7.6839 | 6.1350E-20 | 1.90 | 30.83 | 7.2208E-03 | 22.52 | 1.1696 | 22.81 |
| Nb932-bare | 10.2890 | 2.4821E-21 | 4.72 | 32.61 | 4.5229E-03 | 30.32 | 1.1127 | 30.84 |
| Co592-bare | 12.1390 | 1.6686E-22 | 7.10 | 33.11 | 1.9395E-03 | 33.58 | 1.0172 | 34.46 |
| Mn552-bare | 12.1420 | 4.7562E-23 | 8.13 | 32.36 | 2.0609E-03 | 32.34 | 0.8601 | 33.49 |
| Mn552-Cdtk/B4C | 12.1450 | 4.0170E-23 | 5.01 | 32.40 | 1.9708E-03 | 32.53 | 0.9740 | 33.06 |
| Zr902-Cd | 13.5890 | 1.6160E-21 | 3.40 | 33.12 | 9.9648E-04 | 34.08 | 1.1699 | 34.39 |
| Ni582-bare | 14.0830 | 1.5485E-22 | 5.87 | 33.06 | 4.1111E-05 | 36.92 | 1.0997 | 37.51 |
Column 5 of Table 23 shows the contribution from the a priori spectrum to the uncertainty in the spectrum-averaged cross sections. The a priori spectrum is based solely on a calculation and, while the statistical uncertainty in this Monte Carlo calculation was typically less than 1 % in a given energy bin, the uncertainty in the modeling and in the transport cross sections result is a very large overall spectrum uncertainty - as was seen in Fig. 102. Since the uncertainty in the calculated spectral index has the spectrum appearing in both the numerator and the denominator of the metric, a Monte Carlo approach was used to propagate the spectrum uncertainty through this ratio of integrals. This methodology is described in reference Gri18 . The use of spectral indices to make the C/E comparison means that the spectrum contribution to the SI uncertainty can be much smaller for reactions that have the dominant response in the same spectral region as the reference 58Ni(n,p)58Co reaction. This is clearly seen in the column 7 spectrum contribution to the SI uncertainty. Here the spectrum-contribution to the SI uncertainty becomes zero for the reference reaction, and is much reduced for reactions where the dominant sensor response is similar to that from the reference reaction. For regions where the dosimeter dominant energy-dependent response differs from that of the reference reaction, the spectrum contribution to the SI uncertainty can be more than twice as large as that seen in the calculated SACS.
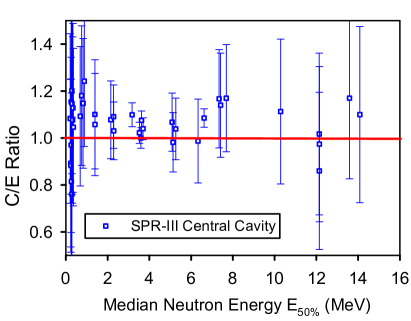
Columns 8 and 9 show the overall calculated-to-experimental (C/E) ratios, CoESI/Ni58p, and associated uncertainties. The CoESIα/Ni58p value is the primary metric reported in this benchmark field. The uncertainty shown for this C/E metric is taken to be the root-mean-square of the measurement uncertainty and the spectrum and cross section contributions to the calculated spectrum-averaged cross section uncertainty. The color-coding in the CoESIα/Ni58p columns corresponds to the criteria appearing in Table 17. Good or acceptable validation evidence was seen for 39 of the 40 measured activities in this reference field. The only discrepant reaction among this set of data were for the 23Na(n,)24Na reaction and, even in this case, the CoESIα/Ni58p was within one standard deviation of unity – but the ratio fell outside the criteria adopted in Table 17 and there was a large spectrum contribution to the CoESIα/Ni58p uncertainty.
Fig. 102 shows the resulting CoESIα/Ni58p ratios for this benchmark neutron field. The x-axis represents the mean response energy for the foil/cover combination in that calculated reference field spectrum. The large uncertainties, due to the a priori spectrum uncertainty, are clearly seen here. A small positive bias in the C/E is also seen. The usefulness of this CoESIα/Ni58p metric in the validation process is limited by the large uncertainty due to the spectrum in this neutron field. Sec. VIII will address another metric that can more rigorously address the uncertainty in the spectrum and thus provide more powerful validation evidence.
VII.5 ACRR Pool-type Reactor Central Cavity
The baseline measured quantities in this reference benchmark field are end-of-irradiation (EOI) spectrum-averaged cross sections measured in operation #10639, which was a 153.2 MJ pulsed operation that took place on 9/19/2013. In order to eliminate the effect of variations in the reactor power during the other exposures, a 58Ni(n,p)58Co monitor activity was used to facilitate a renormalization of data gathered in the other operations to the baseline exposure. When required, corrections were made in the measured activities of other foils to convert them to represent the end-of-irradiation from the baseline 16-minute uniform power operation. The other reactor operations are detailed in Table 24. As discussed in Sec. VII.4, in some of the cases covers were used to shield the activation foil and shift the sensitivity of the measured response to higher energies.
| Date | Oper. | Operation | Comment |
|---|---|---|---|
| [d/m/y] | No. | Type | |
| 18/09/2013 | 10636 | Steady 172.4 MJ | Activation foil set 2: Co, Fe, Sc, Ni, and Ti |
| 19/09/2013 | 10638 | Pulse 157.7 MJ | Activation foil set 3: Zr, Mo, Ag, Au, Au, Au-dilute, and W |
| 02/10/2013 | 10649 | Pulse 148.0 MJ | Activation foil sets 4 and 5: Na, Mg, Mn, Fe, Cu, Zn, In, Nb, and Al |
| 19/09/2013 | 10637 | Pulse 151.5 MJ | Cd covered activation foil sets 6 and 7: Co, Fe, Sc, Ni, Mo, Ag, Au, and Au-dilute |
| 03/10/2013 | 10650 | Pulse 152.8 MJ | Cd covered activation foil sets 8 and 9: Na, Mg, Mn, Fe, In, Cu |
| 08/04/2014 | 10870 | Steady 150 MJ | Depleted U activation foil in Cd cover and B4C ball |
| 08/04/2014 | 10871 | Steady 150 MJ | Enriched U activation foil in Cd cover and B4C ball |
| 08/04/2014 | 10872 | Steady 150 MJ | Np activation foil in Cd cover and B4C ball |
| 08/04/2014 | 10873 | Steady 150 MJ | Pu activation foil in Cd cover and B4C ball |
Data were gathered for a total of 33 combinations of reactions and covers in this reference field. The baseline set of end-of-irradiation activity measurements, normalized using the 58Ni(n,p)58Co monitor reaction used in the same reactor operation, are shown in Table 25. As in Sec. VII.4, a spectral index is defined to be the ratio of the spectrum-averaged cross sections for two specified reactions, where one is generally considered to be a reference monitor reaction. This quantity is independent of the neutron fluence. Table 25 provides the calculated spectrum-averaged cross sections for the measured reactions, with covers, and reports both the spectrum and cross section uncertainty contributions to the calculated spectrum-averaged cross sections. The entries in the table are ordered with respect to the increasing mean response energy for the reactions. The overall calculated-to-experimental (C/E) ratios, CoESIα/Ni58p, are also shown in the table. The uncertainty shown for this C/E metric is taken to be the root-mean-square of the measurement uncertainty and the spectrum and cross section contributions to the calculated spectrum-averaged cross section uncertainty. Several of the table entries have such a large uncertainty that they do not qualify as acceptable validation cases, but they have a good C/E value, so they are also not designated as discrepant. These table entries correspond to measurements that are not of validation quality, typically due to the spectrum uncertainty, and are left uncoloured.
| Measured Act. | Calc. | Spectral | SI C/E | |||||
| Entry Label | Bq/atom or | Unc. | SACS | Index (SI) | Unc. | Value | Unc. | |
| [MeV] | Fiss./atom | [%] | Unc.[%] | [%] | [%] | |||
| Sc45g-bare | 4.7701E-08 | 7.3161E-16 | 2.97 | 43.79 | 8.9065E+01 | 50.05 | 1.0063 | 50.26 |
| Na23g-bare | 6.0353E-08 | 1.8587E-15 | 2.97 | 38.98 | 1.7629E+00 | 45.73 | 1.0532 | 45.96 |
| Mn55g-bare | 6.8033E-08 | 3.4622E-13 | 2.76 | 36.16 | 5.1304E+01 | 42.67 | 0.9531 | 42.91 |
| Fe58g-bare | 7.2933E-08 | 8.3270E-17 | 2.69 | 33.19 | 5.4350E+00 | 39.79 | 1.0160 | 40.03 |
| Co59g-bare | 1.2520E-07 | 5.6707E-17 | 4.83 | 27.78 | 1.7960E+02 | 34.44 | 1.1392 | 25.58 |
| Sc45g-Cd | 1.7900E-06 | 1.1446E-16 | 2.97 | 28.59 | 1.3490E+01 | 34.29 | 0.9746 | 34.59 |
| Au197g-bare | 3.0900E-06 | 5.6538E-13 | 3.77 | 25.63 | 2.4586E+03 | 32.11 | 1.1177 | 32.52 |
| Au197g-Cd | 3.3100E-06 | 4.7342E-13 | 3.77 | 30.74 | 2.1328E+03 | 36.15 | 1.1580 | 36.51 |
| Ag109g-bare | 3.5260E-06 | 8.7524E-17 | 4.30 | 20.00 | 2.9347E+01 | 28.40 | 0.9297 | 28.94 |
| Ag109g-Cd | 4.8240E-06 | 5.7839E-17 | 4.29 | 25.61 | 2.3331E+01 | 31.29 | 1.1184 | 31.77 |
| Na23g-Cd | 6.4680E-06 | 4.2940E-16 | 2.97 | 18.52 | 3.6902E-01 | 24.23 | 0.9544 | 24.67 |
| W186g-bare | 1.1850E-05 | 2.2104E-13 | 2.50 | 18.33 | 3.2344E+02 | 26.52 | 1.0251 | 26.87 |
| Co59g-Cd | 9.5720E-05 | 1.8963E-17 | 4.83 | 13.66 | 6.9245E+01 | 16.41 | 1.3135 | 17.46 |
| Mn55g-Cd | 1.3490E-04 | 9.1556E-14 | 2.76 | 13.37 | 1.2863E+01 | 19.04 | 0.9036 | 19.56 |
| Fe58g-Cd | 1.7710E-04 | 2.5208E-17 | 2.69 | 11.82 | 1.6630E+00 | 16.38 | 1.0270 | 16.96 |
| rmleu-Cdtk/B4C | 3.3292E-01 | 3.1399E-09 | 4.03 | 8.11 | 3.3913E+01 | 4.79 | 0.9324 | 7.18 |
| rmlpu-Cdtk/B4C | 6.9648E-01 | 3.1557E-09 | 4.03 | 7.94 | 3.8531E+01 | 5.16 | 1.0540 | 7.43 |
| Np237f-Cdtk/B4C | 1.4277E+00 | 1.5815E-09 | 4.03 | 8.89 | 1.8067E+01 | 6.30 | 0.9865 | 8.26 |
| rmldu-Cdtk/B4C | 2.1768E+00 | 2.8531E-10 | 4.03 | 9.03 | 3.4254E+00 | 3.78 | 1.0365 | 6.55 |
| Ti47p-bare | 3.0036E+00 | 3.8055E-17 | 3.69 | 9.07 | 1.7495E-01 | 1.13 | 0.9505 | 5.22 |
| S32p-bare | 3.4419E+00 | 2.7894E-17 | 4.12 | 9.29 | 5.8302E-01 | 0.61 | 1.0133 | 5.45 |
| Ni58p-bare | 3.4929E+00 | 9.7808E-18 | 3.52 | 9.14 | 1.0000E+00 | 0.00 | 1.0000 | 4.98 |
| Zn64p-bare | 3.5683E+00 | 4.7963E-16 | 3.69 | 9.35 | 3.5292E-01 | 0.59 | 0.9626 | 5.13 |
| Fe54p-bare | 3.6245E+00 | 1.6954E-18 | 2.97 | 9.18 | 7.2790E-01 | 0.47 | 0.9526 | 4.63 |
| Co59p-Cd | 5.0698E+00 | 1.7965E-19 | 6.13 | 9.49 | 1.2094E-02 | 2.81 | 1.0478 | 7.61 |
| Ti46p-bare | 5.1988E+00 | 7.8515E-19 | 3.05 | 9.21 | 9.6822E-02 | 3.25 | 1.0193 | 5.68 |
| Ni60p-bare | 6.0778E+00 | 6.3203E-21 | 5.66 | 9.36 | 1.8502E-02 | 4.11 | 1.0529 | 7.83 |
| Fe56p-bare | 6.5505E+00 | 5.8136E-17 | 2.69 | 9.23 | 9.1059E-03 | 4.65 | 1.0074 | 6.42 |
| Ti48p-bare | 7.2201E+00 | 8.8424E-19 | 2.44 | 9.38 | 2.5831E-03 | 5.16 | 1.1116 | 6.71 |
| Mg24p-bare | 7.3367E+00 | 1.2890E-17 | 3.05 | 9.38 | 1.2267E-02 | 5.49 | 1.0569 | 7.20 |
| Al27a-bare | 7.6106E+00 | 6.1585E-18 | 3.05 | 9.57 | 6.1899E-03 | 5.62 | 1.1163 | 7.30 |
| Nb932-bare | 1.0266E+01 | 2.5526E-19 | 2.83 | 9.94 | 3.5065E-03 | 7.08 | 0.9372 | 8.40 |
| Zr902-bare | 1.3553E+01 | 1.7102E-19 | 5.48 | 13.77 | 8.2414E-04 | 12.09 | 1.0217 | 13.73 |
Fig. 103 shows the resulting C/E ratios for this benchmark neutron field. The reactions with a dominant high energy response, similar to that of the 58Ni(n,p)58Co reference reaction, show smaller uncertainty bounds and general good agreement. The low energy dominant response reactions show much larger uncertainty bounds and considerable scatter in their central values.
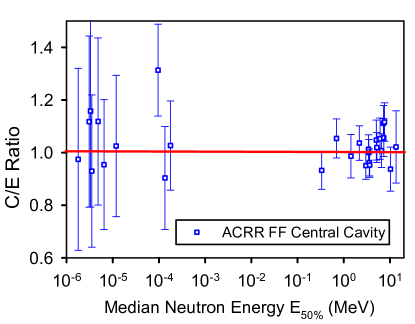
VII.6 Other “Bucket”-Modifying Environments in the ACRR Reference Reactor Fields
C/E ratios for the spectral indices in several other reference reactor fields have been considered. These neutron fields and activity measurements include:
-
1.
ACRR LB44; 35 measured activities
-
2.
ACRR PLG; 35 measured activities
-
3.
ACRR Cd-poly; 31 measured activities
-
4.
FREC-II; 33 measured activities
The utility of these data is best addressed in the context of the consistency of the measured activities in Sec. VIII.6 rather than as isolated spectral indices.
VII.7 Mol-BR1 Mark-III Irradiation Facility
New measurements from the BR1 reactor at the Belgian Nuclear Research Centre SCKCEN in Mol were published recently Wag16 . The aim of the work was to make an update of the Mark-III spectrum and flux, using state of the art computing tools and certified neutron activation measurements. The IRDFF-v1.02 library, which was available at the time, was used. The measured flux calibration factors were scaled by the corresponding calculated cross sections listed in the same publication to recover the measured reaction rates, which in turn were normalized by the 58Ni(n,p) reaction rate to remove the absolute flux dependence. The ratios were compared to the calculated values using the IRDFF-II cross sections, as shown in Table 26 and Fig. 104. The figure undoubtedly displays excellent agreement between measurements and calculations.
| Entry Label | Measured SI | Calculated SI | SI C/E & | ||||
|---|---|---|---|---|---|---|---|
| and monitor | [MeV] | & Unc. [%] | & Unc. [%] | Unc. [%] | |||
| In115nm/Ni58p | 2.54 | 1.816 | 4.34 | 1.798 | 2.43 | 0.990 | 5.0 |
| Fe54p/Ni58p | 4.28 | 0.733 | 4.27 | 0.726 | 3.61 | 0.990 | 5.6 |
| Al27p/Ni58p | 5.71 | 0.037 | 4.34 | 0.036 | 2.70 | 0.986 | 5.1 |
| Fe56p/Ni58p | 7.36 | 9.93E-3 | 4.43 | 0.010 | 3.22 | 1.013 | 5.5 |
| Al27a/Ni58p | 8.45 | 6.44E-3 | 3.57 | 6.53E-3 | 1.90 | 1.015 | 4.0 |
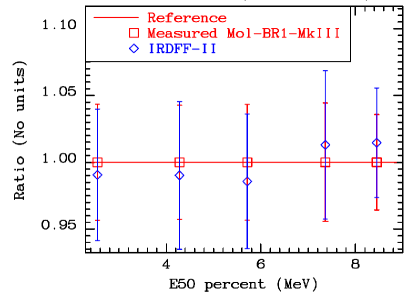
VII.8 LR-0 Reactor at Řež
The measured quantities in the experiments are reaction rate ratios and neutron spectra. Irradiations were carried out at an atmospheric pressure and room temperature, using fairly large samples due to the low neutron flux. It was shown that the neutron energy spectrum above 6 MeV is indistinguishable from the 235U PFNS Kos18_5 . Therefore, when corrected, the cross sections of reactions with the threshold over 6 MeV averaged in the LR-0 spectrum correspond to spectrum-averaged cross sections in 235U PFNS Kos18_3 . Corrections are based on the ratio between the share of neutrons over 6 MeV in LR-0 spectrum and in the 235U PFNS. Another correction, taking into account the difference between LR-0 and PFNS, which is defined as a ratio between cross section averaged in reactor field and the 235U PFNS field, is applied as well Kos17_2 .
The neutron transport in large samples for correct evaluation of significant flux loss effect, as well as correction to flux level, are determined using well validated mathematical model of the irradiation assembly.
The efficiencies of the semiconductor detector were determined using a precise mathematical model of the used HPGe Kos17_2 , which has been compiled using experimentally determined HPGe crystal parameters and its dead layer Dry06 . The same arrangement of the gamma spectrum measurement was used in case of 252Cf irradiation experiments as well (see Table 19, Sch18_1 ). Thanks to the usage of the same arrangement in case of 235U as well as 252Cf experiments, reaction rates ratio obtained in the 235U and 252Cf irradiations can be obtained with low uncertainties. Results are presented in the section on the 235U PFNS and 252Cf SFNS spectrum-averaged cross sections.
VII.9 TRIGA-JSI Pneumatic Tube Irradiation Channel
The measured quantities in the two measurement campaigns were the induced activities after irradiation of bare samples and samples with covers of cadmium, boron nitride, boron carbide and enriched boron carbide. The reported unfiltered relative to filtered reaction rate ratios were derived from gamma spectrometry measurements of samples with the same geometry and material composition, performed with the same detector at the same geometry, and of the same gamma line. Therefore, the uncertainties in the derived unfiltered relative to filtered reaction rate ratios are unaffected by uncertainties in the sample material composition, detection efficiency, coincidence correction factors, or gamma emission probabilities. The uncertainties in the unfiltered relative to filtered reaction rate ratios reflect the uncertainties in the measured peak areas, sample mass and the irradiation, cooling and measurement timing. The uncertainties in the ratios of one reaction rate relative to another, on the other hand, are affected by all the above mentioned sources of uncertainty and indeed are reflected in the magnitude of the uncertainties.
For the JSI TRIGA case, a neutron spectrum adjustment procedure was carried out using the GRUPINT code, developed at the JSI ISRD16 . The code enables the parametrization of the spectrum with a 19-parameter analytical function, and subsequent fitting of selected function parameters to measured reaction-rate ratios. Fine structure present in the spectra due to neutron resonances is taken into account through a form function, which is defined as the ratio of the calculated and the fitted analytical function. Measured reaction rate ratios can be labelled as active in the spectrum parameter fitting, or excluded. The active reaction rate ratios in the JSI TRIGA case were cadmium ratios (defined as the ratios of the bare relative to cadmium filtered reaction rates), for the 197Au and 238U reactions, and the ratios of the 27Al and 27Al reaction rates relative to the 197Au reaction rate. Neutron spectrum adjustment is required in order to improve the thermal to fission peak strength in the spectra resulting from the Monte Carlo calculations. In the present case the adjustment procedure resulted in an increase of the thermal spectrum by about 10 %.
In addition to cadmium filters, filters made from boron nitride (BN), boron carbide (B4C) and enriched boron carbide (10B4C) were employed as well. The filter effect on the neutron spectrum, i.e., the transmission function is modelled in the GRUPINT code as a exponential attenuation function governed by two parameters:
| (5) |
where is the atom density in the filter material and is the effective filter thickness, the first parameter, and is the filter transport cross-section, defined as:
| (6) |
where is the filter absorption cross-section, is the filter scattering cross-section and is the effective scattering fraction, the second parameter. Filtered reaction rates are calculated as:
| (7) |
where is the reaction cross-section, is the filter transmission function and is the neutron spectrum, in the present case the adjusted neutron spectrum, resulting from the adjustment procedure described above.
| React. | , | , | Diff. | , | , | Diff. | , | , | Diff. |
| exp. | calc. | [%] | exp. | calc. | [%] | exp. | calc. | [%] | |
| 197Au | 8.171.2% | 8.288.52% | 1.3 | 27.811.2% | 28.7613.8% | 3.4 | 256.041.1% | 258.654.52% | 1.0 |
| 238U | 2.601.1% | 2.537.01% | -2.7 | 5.441.2% | 5.186.00% | -4.7 | 51.391.0% | 48.284.77% | -6.0 |
| 238U | 2.631.4% | 2.537.01% | -3.7 | 5.321.3% | 5.186.00% | -2.5 | 45.471.3% | 48.284.77% | 6.2 |
| 238U | 2.461.1% | 2.537.01% | 3.1 | 5.331.1% | 5.186.00% | -2.8 | 49.661.0% | 48.284.77% | -2.8 |
| 55Mn | 39.132.5% | 35.835.17% | -8.4 | 48.262.6% | 47.045.54% | -2.5 | 183.113.0% | 147.436.64% | -19.5 |
| 232Th | 4.072.2% | 4.1918.9% | 2.7 | 6.502.2% | 6.4218.2% | -1.2 | 31.132.1% | 30.3911.3% | -2.4 |
| 23Na | 92.772.3% | 87.383.99% | -5.8 | 136.032.2% | 122.644.07% | -9.8 | 283.942.2% | 229.534.46% | -19.2 |
The BN, B4C and 10B4C filter cross sections were generated on the basis of ENDF/B-VIII.0 nuclear data, the filter chemical compositions and the measured filter densities, using the PREPRO-2018 nuclear data processing code package. The effective filter thicknesses were first adjusted so that the transmission function shapes approximately matched the shapes calculated using MCNP, and second, finely adjusted on the basis of the experimental BN, B4C and 10B4C ratios for the 197Au and 238U reactions. The effective scattering fractions , were adjusted on the basis of the filter transmission functions calculated with MCNP; however, the fractions were seen to be very close to zero, implying that neutron scattering has a low impact on the overall filter transmission function. Fig. 105 displays the filter transmission functions calculated using MCNP and adjusted on the basis of experimental data.
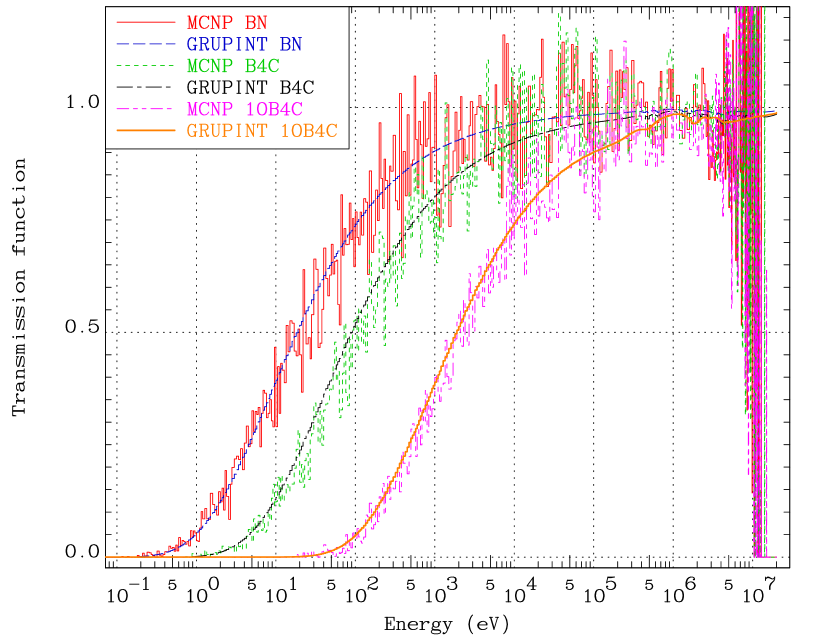
It is very important to note, that since in the TRIGA-JSI case a subset of the experimental data is used for neutron spectrum adjustment or the adjustment of the parameters of the filter transmission functions, these data cannot be part of the TRIGA-JSI data validation case. The relevance of the TRIGA-JSI case is in the comparison of calculated and measured reaction rate ratios for other measured nuclear reactions in the experimental campaigns, which are included in the IRDFF-II library. Additional measurements of a specific selection of reactions of potential interest for epithermal neutron dosimetry were made Radulovic_NENE2018 , but they are outside the scope of the present analysis. Table 27 reports the experimental and calculated BN, B4C and 10B4C reaction rate ratios.
VII.10 Uranium Fueled ICSBEP Assemblies from the ICSBEP Handbook
In this section the C/E results for the spectral indices (SI) for the uranium-fueled ICSBEP assemblies (HMF001, HMF028 and IMF007) are summarized. As indicated earlier the simulation models are derived from the specifications provided in the ICSBEP Handbook. However the Handbook does not provide a summary of experimental reaction rate data. The reaction rate data cited here are derived from a variety of sources (e.g., References CIELO:2014 ; ENDF8 ; You07 ; Fra99 ; ENDF-202 ).
Table 28 provides results for HMF001, with the corresponding SI C/E values shown in Fig. 106. Aside from some scatter in the low energy activation foil capture reactions, where C/E values oscillate between 0.80 and 1.30, the calculated SI C/E are generally in good agreement with experiment, with all values within 10 % of unity for values up to 8 MeV. Even SI C/E for the high energy 63Cu(n,2n) reaction is in good agreement with experiment, given the large measurement and stochastic uncertainties for this reaction.
| Entry Label | Measured | Calculated | SI C/E | Diff | ||||
|---|---|---|---|---|---|---|---|---|
| and monitor | SI and Unc. | SI and Unc. | Value and Unc. | [%] | ||||
| MeV | [%] | [%] | [%] | |||||
| Mn55g/U5f | 0.328 | 2.70E-3 | 7.41 | 3.42E-3 | 21.79 | 1.2673 | 23.02 | 26.73 |
| Au197g/U5f | 0.345 | 0.1000 | 2.00 | 0.0946 | 1.29 | 0.9458 | 2.38 | -5.42 |
| Ta181g/U5f | 0.368 | 0.1230 | 9.76 | 0.1013 | 6.21 | 0.8238 | 11.56 | -17.62 |
| Nb93g/U5f | 0.376 | 0.0300 | 10.00 | 0.0318 | 2.11 | 1.0588 | 10.22 | 5.88 |
| Co59g/U5f | 0.432 | 0.0380 | 7.89 | 5.48E-3 | 2.76 | 0.1442 | 8.36 | -85.58 |
| Cu63g/U5f | 0.450 | 0.0117 | 5.13 | 0.0114 | 10.70 | 0.9780 | 11.86 | -2.20 |
| U8g/U8f | 0.549 | 0.4760 | 0.4695 | 2.20 | 0.9863 | 2.20 | -1.37 | |
| In115gm/U5f | 0.594 | 0.1168 | 0.68 | 0.1266 | 2.48 | 1.0841 | 2.57 | 8.41 |
| La139g/U5f | 0.635 | 7.30E-3 | 8.22 | 6.38E-3 | 5.20 | 0.8736 | 9.73 | -12.64 |
| Pu9f/U5f | 1.051 | 1.3650 | 1.3841 | 1.73 | 1.0140 | 1.73 | 1.40 | |
| Np7f/U5f | 1.614 | 0.8516 | 1.41 | 0.8338 | 2.12 | 0.9791 | 2.53 | -2.09 |
| U8f/U5f | 2.576 | 0.1629 | 0.1584 | 1.71 | 0.9726 | 1.71 | -2.74 | |
| U8f/P31p | 2.576 | 8.9460 | 4.61 | 9.1893 | 3.67 | 1.0272 | 5.89 | 2.72 |
| Al27p/P31p | 5.757 | 0.1126 | 4.88 | 0.1142 | 4.03 | 1.0143 | 6.33 | 1.43 |
| Fe56p/P31p | 7.397 | 0.0310 | 5.80 | 0.0327 | 4.39 | 1.0545 | 7.27 | 5.45 |
| U82/U5f | 8.082 | 7.73E-3 | 4.00 | 7.93E-3 | 5.25 | 1.0260 | 6.60 | 2.60 |
| Al27a/P31p | 8.461 | 0.0203 | 5.91 | 0.0215 | 3.55 | 1.0584 | 6.89 | 5.84 |
| Cu632/P31p | 13.619 | 2.94E-3 | 9.52 | 2.79E-3 | 4.49 | 0.9477 | 10.53 | -5.23 |
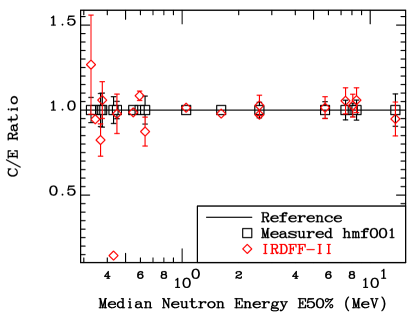
Table 29 provides results for HMF028, with the corresponding SI C/E values shown in Fig. 107. Aside from the 169Tm(n,2n) result (at E50% MeV), which seems anomalous given the excellent 197Au(n,2n) result at nearly the same energy, these C/E results are excellent.
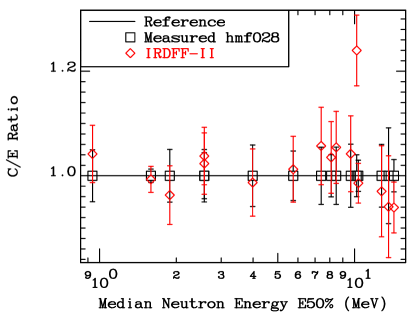
| Entry Label | Measured | Calculated | SI C/E | Diff | ||||
|---|---|---|---|---|---|---|---|---|
| and monitor | SI and Unc. | SI and Unc. | Value and Unc. | [%] | ||||
| MeV | [%] | [%] | [%] | |||||
| Pu9f/U5f | 0.938 | 1.3070 | 4.97 | 1.3615 | 1.73 | 1.0417 | 5.27 | 4.17 |
| Np7f/U5f | 1.590 | 0.7804 | 1.28 | 0.7751 | 2.12 | 0.9932 | 2.48 | -0.68 |
| Am1f/U5f | 1.886 | 0.7540 | 5.04 | 0.7261 | 2.92 | 0.9631 | 5.82 | -3.69 |
| U8f/U5f | 2.575 | 0.1397 | 5.01 | 0.1450 | 1.72 | 1.0377 | 5.30 | 3.77 |
| U8f/P31p | 2.575 | 8.9810 | 4.41 | 9.1903 | 3.67 | 1.0233 | 5.74 | 2.33 |
| S32p/U5f | 3.985 | 0.0306 | 5.88 | 0.0302 | 2.79 | 0.9870 | 6.51 | -1.30 |
| Al27p/P31p | 5.749 | 0.1128 | 4.74 | 0.1135 | 4.03 | 1.0125 | 6.22 | 1.25 |
| Fe56p/P31p | 7.398 | 0.0306 | 5.47 | 0.0324 | 4.39 | 1.0570 | 7.02 | 5.70 |
| U82/U5f | 8.097 | 6.94E-3 | 4.03 | 7.18E-3 | 5.25 | 1.0351 | 6.62 | 3.51 |
| Al27a/P31p | 8.476 | 0.0202 | 5.48 | 0.0213 | 3.56 | 1.0534 | 6.54 | 5.43 |
| V51a/U5f | 9.665 | 1.11E-5 | 6.04 | 1.16E-5 | 3.50 | 1.0420 | 6.98 | 4.20 |
| Tm1692/U5f | 10.200 | 1.47E-3 | 4.01 | 1.82E-3 | 3.71 | 1.2398 | 5.47 | 23.98 |
| Au1972/U5f | 10.351 | 1.61E-3 | 2.98 | 1.59E-3 | 2.46 | 0.9858 | 3.87 | -1.42 |
| As752/U5f | 12.767 | 1.50E-4 | 6.00 | 1.46E-4 | 6.69 | 0.9702 | 8.99 | -2.98 |
| Cu632/P31p | 13.597 | 2.94E-3 | 9.17 | 2.76E-3 | 4.82 | 0.9407 | 10.36 | -5.93 |
| Zr902/U5f | 14.279 | 4.85E-5 | 3.09 | 4.56E-5 | 4.14 | 0.9392 | 5.17 | -6.08 |
Table 30 provides results for IMF007, with the corresponding SI C/E values shown in Fig. 108. As with HMF001 there is a large scatter in the low energy activation foil capture reaction C/E values. This large variation, both below and above unity, suggests a deficiency in the underlying measurements rather than in the source spectrum. Unfortunately many of these measurements were made decades ago making it difficult to know whether details such as gamma transition intensity, decay half-life, possible capture branch to isomers, etc were properly accounted for. Once again the 169Tm(n,2n) SI C/E, near 10.3 MeV, stands out for its marked deviation from unity.Also once again the 197Au(n,2n) result is near unity suggesting the issue is with the measured 169Tm SACS (or a decay data deficiency) rather than problems in the IMF007 spectrum. In general we observe good C/E results with most values being consistent with unity to within their respective uncertainties.
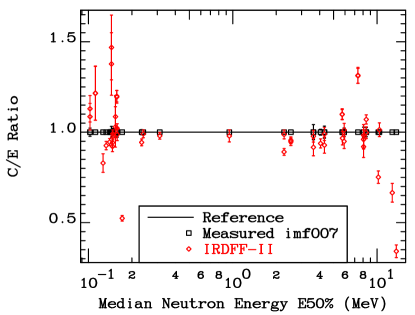
| Entry Label | Measured | Calculated | SI C/E | Diff | ||||
|---|---|---|---|---|---|---|---|---|
| and monitor | SI and Unc. | SI and Unc. | Value and Unc. | [%] | ||||
| MeV | [%] | [%] | [%] | |||||
| Sc45g/U5f | 0.102 | 0.0132 | 2.27 | 0.0143 | 6.36 | 1.0857 | 6.75 | 8.57 |
| Sc45g/Ni58p | 0.102 | 1.1000 | 1.2424 | 6.49 | 1.1295 | 6.49 | 12.95 | |
| Mn55g/U5f | 0.112 | 5.37E-3 | 6.52E-3 | 12.25 | 1.2147 | 12.25 | 21.47 | |
| Mn55g/Ni58p | 0.112 | 0.4650 | 0.5655 | 12.32 | 1.2161 | 12.32 | 21.61 | |
| Ta181g/U5f | 0.126 | 0.2160 | 0.1791 | 6.18 | 0.8293 | 6.18 | -17.07 | |
| W186g/U5f | 0.133 | .05688 | 0.0527 | 2.48 | 0.9259 | 2.48 | -7.41 | |
| B10a/U5f | 0.136 | 1.0110 | 1.38 | 0.9557 | 1.50 | 0.9453 | 2.04 | -5.47 |
| Fe58g/U5f | 0.144 | 3.10E-3 | 3.23 | 4.27E-3 | 12.13 | 1.3773 | 12.55 | 37.73 |
| Fe58g/Ni58p | 0.144 | 0.2520 | 0.3701 | 12.20 | 1.4688 | 12.20 | 46.88 | |
| Co59g/U5f | 0.147 | 9.50E-3 | 2.11 | 8.75E-3 | 2.27 | 0.9209 | 3.10 | -7.91 |
| Co59g/Ni58p | 0.147 | 0.8050 | 0.7585 | 2.61 | 0.9422 | 2.61 | -5.78 | |
| Au197g/U5f | 0.147 | 0.1670 | 1.80 | 0.1655 | 1.29 | 0.9907 | 2.21 | -0.93 |
| Au197g/Ni58p | 0.147 | 14.700 | 14.3431 | 1.83 | 0.9757 | 1.83 | -2.43 | |
| Cu63g/U5f | 0.154 | 0.0164 | 0.61 | 0.0178 | 10.75 | 1.0858 | 10.77 | 8.58 |
| Cu63g/Ni58p | 0.154 | 1.5000 | 1.5437 | 10.83 | 1.0291 | 10.83 | 2.91 | |
| In115gm/U5f | 0.157 | 0.1460 | 0.1750 | 2.64 | 1.1990 | 2.64 | 19.90 | |
| In115gm/Ni58p | 0.157 | 12.700 | 15.1752 | 2.94 | 1.1949 | 2.94 | 19.49 | |
| U8g/U5f | 0.158 | 0.1100 | 2.73 | 0.1086 | 2.09 | 0.9873 | 3.43 | -1.27 |
| U8g/Ni58p | 0.158 | 9.2200 | 9.4151 | 2.45 | 1.0212 | 2.45 | 2.12 | |
| In113gm/U5f | 0.171 | 0.4220 | 0.2210 | 2.95 | 0.5238 | 2.95 | -47.62 | |
| Li6a/U5f | 0.231 | 0.7100 | 1.41 | 0.6544 | 1.35 | 0.9217 | 1.95 | -5.64 |
| U5f/Ni58p | 0.240 | 87.5000 | 86.6913 | 2.14 | 0.9908 | 2.14 | -0.92 | |
| Pu9f/U5f | 0.312 | 1.1936 | 0.70 | 1.1697 | 1.74 | 0.9799 | 1.84 | -2.01 |
| Np7f/U5f | 0.946 | 0.3223 | 1.20 | 0.3156 | 3.14 | 0.9794 | 4.87 | -2.06 |
| In115nm/U5f | 2.269 | 0.0271 | 0.0241 | 2.09 | 0.8909 | 2.09 | -10.91 | |
| In115nm/Ni58p | 2.269 | 2.1200 | 2.0931 | 2.46 | 0.9873 | 2.46 | -1.27 | |
| U8f/U5f | 2.528 | 0.0374 | 0.90 | 0.0357 | 1.73 | 0.9551 | 24.13 | -4.49 |
| U8f/Ni58p | 2.528 | 3.2700 | 3.0957 | 2.16 | 0.9467 | 2.16 | -5.33 | |
| Ti47p/U5f | 3.622 | 2.15E-3 | 4.19 | 1.97E-3 | 3.01 | 0.9166 | 5.16 | -8.34 |
| Ti47p/Ni58p | 3.622 | 0.1748 | 0.1708 | 3.28 | 0.9773 | 3.28 | -2.27 | |
| Ni58p/U5f | 4.061 | 0.0123 | 1.63 | 0.0115 | 2.14 | 0.9378 | 2.69 | -6.22 |
| Fe54p/U5f | 4.318 | 9.00E-3 | 3.33 | 8.35E-3 | 3.38 | 0.9282 | 4.75 | -7.18 |
| Fe54p/Ni58p | 4.318 | 0.7317 | 0.7242 | 3.62 | 0.9920 | 3.62 | -1.03 | |
| Al27p/U5f | 5.732 | 3.88E-4 | 4.26E-4 | 2.45 | 1.0981 | 2.45 | 9.81 | |
| Al27p/Ni58p | 5.732 | 0.0336 | 0.0369 | 2.77 | 1.0993 | 2.77 | 9.93 | |
| Co59p/U5f | 5.757 | 1.58E-4 | 1.53E-4 | 3.81 | 0.9667 | 3.81 | -3.33 | |
| Ti46p/U5f | 5.916 | 1.30E-3 | 2.31 | 1.23E-3 | 3.43 | 0.9491 | 4.13 | -5.09 |
| Ti46p/Ni58p | 5.916 | 0.1057 | 0.1070 | 3.67 | 0.9813 | 3.67 | 1.20 | |
| Fe56p/U5f | 7.378 | 9.12E-5 | 1.20E-4 | 3.11 | 1.3117 | 3.11 | 31.17 | |
| Fe56p/Ni58p | 7.378 | 7.89E-3 | 0.0104 | 3.36 | 1.3144 | 3.36 | 31.44 | |
| U82/U5f | 8.067 | 1.74E-3 | 1.67E-3 | 5.39 | 0.9607 | 5.39 | -3.93 | |
| U82/Ni58p | 8.067 | 0.1510 | 0.1449 | 5.54 | 0.9597 | 5.54 | -4.03 | |
| Ti48p/U5f | 8.068 | 3.60E-5 | 2.78 | 3.31E-5 | 5.87 | 0.9198 | 6.49 | -8.02 |
| Ti48p/Ni58p | 8.068 | 2.92E-3 | 2.87E-3 | 6.01 | 0.9831 | 6.01 | -1.69 | |
| Al27a/U5f | 8.417 | 7.80E-5 | 2.56 | 7.78E-5 | 1.97 | 0.9974 | 3.24 | -0.26 |
| Al27a/Ni58p | 8.417 | 6.30E-3 | 6.74E-3 | 2.36 | 1.0705 | 2.36 | 7.05 | |
| Tm1692/U5f | 10.244 | 5.45E-4 | 4.10E-4 | 4.58 | 0.7515 | 4.58 | -24.85 | |
| Au1972/U5f | 10.380 | 3.52E-4 | 3.57E-4 | 3.74 | 1.0135 | 3.74 | 1.35 | |
| Co592/U5f | 12.753 | 3.14E-5 | 2.09E-5 | 7.77 | 0.6650 | 7.77 | -33.50 | |
| Y892/U5f | 13.602 | 4.67E-5 | 1.59E-5 | 10.33 | 0.3414 | 10.33 | -65.86 | |
VII.11 Plutonium Fueled ICSBEP Assemblies from the ICSBEP Handbook
In contrast to the good SI C/E results for the uranium fueled ICSBEP assemblies that were noted in Sec. VII.10 the results for plutonium fueled ICSBEP assemblies are poor. Measured reaction rates, our calculated values and the corresponding SI C/E results for the PMF001 (Jezebel), PMF006 (Flattop-Pu) and PMF008 (Thor) critical assemblies are given in Table 31.
The SI C/E values, plotted against as has been done with all other results, are shown in Figs. 109, 110 and 111. These figures display a clear trend of increasing C/E with increasing energy. With a similar trend seen for multiple assemblies it seems likely that the source for this trend is in the high energy tail of the 239Pu prompt fission spectrum. However, we have also calculated the ICSBEP FMR001 assembly (more formally designated FUND-IPPE-FR-MULT-RRR-001 in the ICSBEP Handbook), a Pu metal rodded critical assembly with copper and uranium reflectors. The SI measured data, our calculations and the corresponding C/E values are given in Table 32 and the C/E values are shown in Fig. 112. In contrast to the other Pu fueled assemblies these results are quite good, with minimal variation in C/E out to the highest available energy. The large C/E variation seen at low energies is for a variety of capture reactions and mimics the pattern seen in the results for uranium fueled assemblies.
| Entry Label | Measured | Calculated | SI C/E | Diff | ||||
| and monitor | SI and Unc. | SI and Unc. | Value and Unc. | [%] | ||||
| MeV | [%] | [%] | [%] | |||||
| Jezebel | ||||||||
| Au197g/U5f | 0.463 | 0.1012 | 2.47 | 0.0769 | 1.29 | 0.7603 | 2.79 | -23.97 |
| Mn55g/U5f | 0.467 | 2.90E-3 | 6.90 | 2.82E-3 | 24.36 | 0.9728 | 25.32 | -2.72 |
| Nb93g/U5f | 0.484 | 0.0276 | 10.87 | 0.0255 | 2.26 | 0.9252 | 11.10 | -7.48 |
| Cu63g/U5f | 0.656 | 0.0122 | 4.92 | 9.91E-3 | 9.64 | 0.8120 | 10.82 | -18.80 |
| U8g/U5f | 0.715 | 0.0677 | 0.0644 | 2.24 | 0.9506 | 2.24 | -4.94 | |
| In115gm/U5f | 0.834 | 0.1390 | 0.1131 | 2.63 | 0.8140 | 2.63 | -18.60 | |
| La139g/U5f | 0.968 | 8.20E-3 | 5.87E-3 | 5.13 | 0.7153 | 5.13 | -28.47 | |
| Pu9f/U5f | 1.435 | 1.4609 | 0.89 | 1.4274 | 1.73 | 0.9771 | 1.95 | -2.29 |
| Np7f/U5f | 1.865 | 0.9835 | 1.42 | 0.9787 | 2.06 | 0.9951 | 2.50 | -0.49 |
| U8f/U5f | 2.704 | 0.2133 | 1.08 | 0.2121 | 1.71 | 0.9942 | 2.02 | -0.58 |
| U82/U5f | 8.172 | 0.0106 | 0.0132 | 5.24 | 1.2469 | 5.24 | 24.69 | |
| Tm1692/U5f | 10.317 | 3.13E-3 | 3.71E-3 | 3.50 | 1.1868 | 3.50 | 18.68 | |
| Flattop-Pu | ||||||||
| Pu9f/U5f | 1.202 | 1.4150 | 1.3837 | 1.73 | 0.9779 | 1.73 | -2.21 | |
| Np7f/U5f | 1.799 | 0.8561 | 1.40 | 0.8612 | 2.08 | 1.0060 | 2.51 | 0.60 |
| U8f/U5f | 2.691 | 0.1772 | 1.13 | 0.1800 | 1.72 | 1.0158 | 2.06 | 1.58 |
| U82/U5f | 8.178 | 9.02E-3 | 3.99 | 0.0110 | 5.27 | 1.2166 | 6.61 | 21.66 |
| Tm1692/U5f | 10.333 | 2.43E-3 | 3.00 | 3.13E-3 | 3.65 | 1.2900 | 4.73 | 29.00 |
| Thor | ||||||||
| U8g/U5f | 0.619 | 0.0830 | 3.61 | 0.0681 | 2.21 | 0.8209 | 4.24 | -17.91 |
| Th2g/U8g | 0.651 | 1.2000 | 1.3586 | 3.81 | 1.1322 | 3.81 | 10.80 | |
| U5f/U8f | 1.160 | 5.1300 | 5.1445 | 1.71 | 1.0028 | 1.71 | 0.28 | |
| Np7f/U5f | 1.824 | 0.9419 | 1.17 | 0.9169 | 2.07 | 0.9735 | 2.38 | -2.65 |
| Np7f/U8f | 1.824 | 4.6900 | 4.7172 | 2.08 | 1.0058 | 2.08 | 0.58 | |
| U8f/U5f | 2.693 | 0.1962 | 1.10 | 0.1944 | 1.71 | 0.9907 | 2.03 | -0.93 |
| Th2f/U8f | 2.931 | 0.2600 | 0.2575 | 5.91 | 0.9904 | 5.91 | -0.96 | |
| U82/U8f | 8.165 | 0.0530 | 5.66 | 0.0612 | 5.24 | 1.1543 | 7.72 | 15.43 |
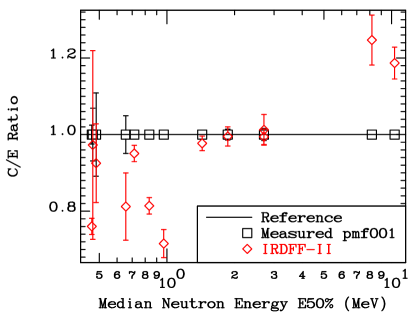
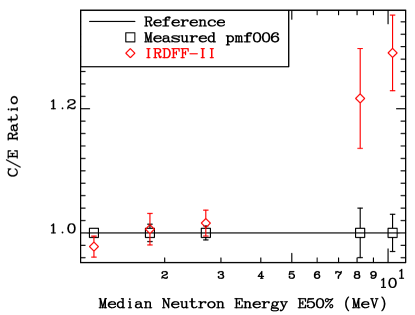
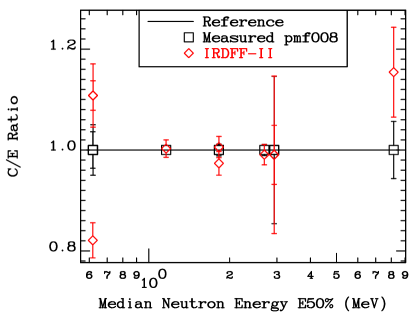
| Entry Label | Measured | Calculated | SI C/E | Diff | ||||
|---|---|---|---|---|---|---|---|---|
| and monitor | SI and Unc. | SI and Unc. | Value and Unc. | [%] | ||||
| MeV | [%] | [%] | [%] | |||||
| Mn55g/U5f | 0.230 | 2.97E-3 | 5.05 | 3.84E-3 | 18.46 | 1.2933 | 19.14 | 29.33 |
| Au197g/U5f | 0.283 | 0.1050 | 4.76 | 0.1000 | 1.29 | 0.9526 | 4.93 | -4.74 |
| Fe58g/U5f | 0.296 | 2.28E-3 | 3.95 | 2.61E-3 | 10.53 | 1.1428 | 11.24 | 14.28 |
| Co59g/U5f | 0.349 | 6.40E-3 | 4.69 | 5.78E-3 | 2.63 | 0.9036 | 5.37 | -9.64 |
| Cu63g/U5f | 0.367 | 0.0114 | 4.39 | 0.0121 | 9.76 | 1.0606 | 10.70 | 6.06 |
| U8g/U5f | 0.468 | 0.0770 | 3.90 | 0.0767 | 2.14 | 0.9967 | 4.44 | -0.33 |
| Th2g/U5f | 0.518 | 0.1090 | 3.67 | 0.1012 | 1.94 | 0.9287 | 4.15 | -7.13 |
| Pu9f/U5f | 1.093 | 1.3300 | 3.01 | 1.3642 | 1.73 | 1.0257 | 3.47 | 2.57 |
| Np7f/U5f | 1.714 | 0.7710 | 2.98 | 0.8191 | 2.11 | 1.0624 | 3.66 | 6.24 |
| Am1f/U5f | 1.982 | 0.8250 | 3.03 | 0.7871 | 2.96 | 0.9541 | 4.24 | -4.59 |
| In115nm/U5f | 2.516 | 0.1020 | 5.88 | 0.1002 | 2.06 | 0.9821 | 6.23 | -1.79 |
| U8f/U5f | 2.629 | 0.1650 | 3.03 | 0.1642 | 1.71 | 0.9953 | 3.48 | -0.47 |
| Th2f/U5f | 2.857 | 0.0430 | 3.02 | 0.0420 | 5.91 | 0.9774 | 6.64 | -2.26 |
| Ti47p/U5f | 3.702 | 9.70E-3 | 5.15 | 9.48E-3 | 2.99 | 0.9772 | 5.96 | -2.28 |
| Ni58p/U5f | 4.129 | 0.0550 | 5.45 | 0.0560 | 2.11 | 1.0183 | 5.85 | 1.83 |
| Fe54p/U5f | 4.383 | 0.0447 | 3.36 | 0.0409 | 3.31 | 0.9145 | 4.72 | -8.55 |
| Al27p/U5f | 5.806 | 2.21E-3 | 6.79 | 2.18E-3 | 2.38 | 0.9862 | 7.19 | -1.38 |
| Co59p/U5f | 5.895 | 8.40E-4 | 4.76 | 7.85E-4 | 3.70 | 0.9343 | 6.03 | -6.57 |
| Ti46p/U5f | 6.044 | 6.60E-3 | 4.55 | 6.33E-3 | 3.31 | 0.9596 | 5.63 | -4.04 |
| Fe54a/U5f | 7.364 | 5.00E-4 | 4.00 | 4.99E-4 | 3.87 | 0.9984 | 5.57 | -0.16 |
| Fe56p/U5f | 7.509 | 6.10E-4 | 3.28 | 6.55E-4 | 2.90 | 1.0743 | 4.38 | 7.43 |
| U82/U5f | 8.161 | 9.16E-3 | 5.46 | 9.39E-3 | 5.24 | 1.0246 | 7.57 | 2.46 |
| Mg24p/U5f | 8.207 | 9.00E-4 | 4.44 | 9.32E-4 | 1.45 | 1.0354 | 4.68 | 3.54 |
| Ti48p/U5f | 8.258 | 1.80E-4 | 4.44 | 1.88E-4 | 5.53 | 1.0442 | 7.10 | 4.42 |
| Co59a/U5f | 8.281 | 9.50E-5 | 4.21 | 9.75E-5 | 3.83 | 1.0263 | 5.69 | 2.63 |
| Al27a/U5f | 8.591 | 4.30E-4 | 4.65 | 4.47E-4 | 1.40 | 1.0391 | 4.86 | 3.91 |
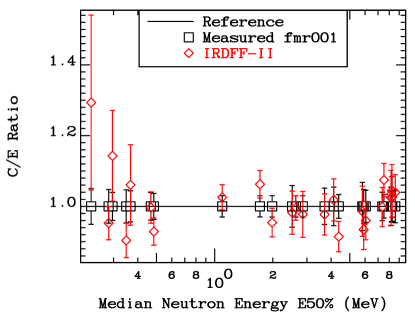
In view of these generally poorer, and certainly conflicting, Pu fueled system results the reader is cautioned that SI results for plutonium fueled systems obtained with current evaluated nuclear data files is subject to larger than expected biases.
VII.12 Legacy Reference Reactor Fields
We have revisited the older reference SACS data obtained at the following reactor facilities: coupled thermal/fast uranium and boron carbide spherical assembly (Sigma-Sigma), Coupled Fast Reactivity Measurement Facility (CFRMF), Intermediate-energy Standard Neutron Fields (ISNF) and Glory hole of the Tokyo University research reactor (YAYOI) Gru86 . Their neutron spectra are available in the IRDF-2002 database Spectra02 which in turn were adopted from the IRDF-90 library IRDF90 ; the latter was assembled in 1993. It is important to notice that the measurements in these neutron fields were not previously incorporated into the evidence package supporting validation of the IRDFF cross section library.
For the present analysis, we selected the facilities and spectra for ISNF and Sigma-Sigma after their spectra were re-calculated based on the transport cross sections from the ENDF/B-VIII.0 library and represented in 725 groups up to 60 MeV, as described in Secs. VI.3.10 and VI.3.11. The CFRMF spectrum in 460 energy groups was adopted directly from IRDF-2002 as we were not able to reproduce it, only the material number was changed from MAT=5 into MAT=9006.
We have examined the use of the YAYOI spectrum from IRDF-2002 (MAT= 9, in 100 energy groups) with the SACS measured by K. Kobayashi et al.Kob76 ; Kob80 for validation with this neutron environment. However practically all C/E ratios turned out to be below unity by 20-50 %. The difference is too large to be attributed to the rather coarse 100-groups representation of the energy spectrum. Most likely there are some unidentified differences in the interpretation of the published measured spectrum-averaged cross section values and the neutron field characterization data. Attempts to use an alternative YAYOI spectrum received through private communications did not improve the agreement, so work in this benchmark field remains for a future study.
The experimental spectrum-averaged reaction cross sections were taken from EXFOR and were also checked against the original publications. Some experimental data are in the form of spectral indices, i.e., the reaction rate ratios measured relative to 235U(n,f), 238U(n,f) or 197Au(n,) – and these data were used in this form. The calculated energy-averaged cross sections were obtained from the IRDFF-II cross sections and facility spectra with the help of the RR_UNC code.
The C/E ratios for SACS or spectral indices are presented in Table LABEL:TableLongSACSreactors and Fig. 113 as a function of the mean response energy . The error bars displayed in Fig. 113 correspond to the sum of the experimental, IRDFF-II cross sections and the spectra uncertainties when the latter were available. It is seen that deviation of C/E from unity lies within two to three-sigma for most reactions and facilities, however with several exceptions which are explicitly labelled in the figure. The agreement seems to be worse for E MeV, i.e., for evaluated IRDFF-II cross sections in the epithermal region.
It is worth noting that the research reactor benchmarks have notably softer spectra than the fission sources 252Cf SFNS or 235U(nth,f) PFNS. Because of this, they are capable of delivering validation data for reactions that augments those obtained in the fission source neutron fields. This is particularly true for the (n,) reaction on targets, such as 45Sc, 55Mn, 58Fe, and 109Ag, where the observed C/E agreement is seen to be within 2–3 standard deviations of unity.
In the case of reactions sensitive to neutron energies above 10 MeV, we see agreement between the C/E values in the Sigma-Sigma and 235U(nth,f) PFNS benchmark neutron fields for the 59Co(n,2n) reaction (E50% = 12.7 MeV): C/E = 0.9000.049 and C/E = 0.9950.044, respectively.
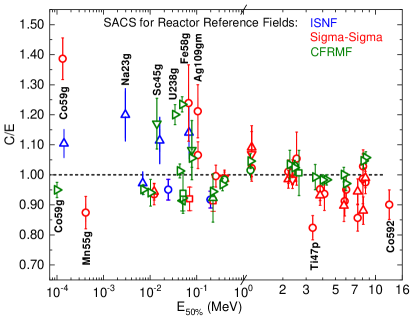
| Experimental SACS or Spectral Index (SI) | Calculated SACS or SI | |||||||
|---|---|---|---|---|---|---|---|---|
| Exp. | Ref. | Sigma | Spect. | C/E | ||||
| Reaction | E50% | SACS [mb] | Unc. | SACS [mb] | Unc. | Unc. | ||
| or SI | [MeV] | or SI ratio | [%] | or SI ratio | [%] | [%] | ||
| Intermediate Energy Standard Neutron Field (ISNF) | ||||||||
| Co59g | 1.416E-04 | 3.630E+01 | 4.13 | Lam88 | 4.009E+00 | 0.85 | 1.13 | 1.104 4.22% |
| Na23g | 2.944E-03 | 1.570E+00 | 6.40 | Lam88 | 1.884E+00 | 9.31 | 1.01 | 1.200 11.2% |
| Au197g | 6.946E-03 | 4.110E+02 | 2.68 | Lam88 | 3.995E+02 | 2.86 | 0.26 | 0.972 4.91% |
| Sc45g | 1.598E-02 | 2.440E+01 | 3.30 | Lam88 | 2.719E+01 | 6.13 | 0.26 | 1.115 6.95% |
| B10He4 | 2.451E-02 | 1.831E+03 | 3.28 | Oli84 | 1.741E+03 | 1.60 | 0.16 | 0.951 3.65% |
| Ag109gm | 6.809E-02 | 2.380E+01 | 3.78 | Lam88 | 2.715E+01 | 6.67 | 0.12 | 1.141 7.67% |
| Li6He4 | 1.963E-01 | 8.310E+02 | 3.01 | Oli84 | 7.625E+02 | 0.40 | 0.10 | 0.918 3.03% |
| In115nm | 2.262E+00 | 9.700E+01 | 2.58 | Lam88 | 9.846E+01 | 1.74 | 0.07 | 1.015 3.11% |
| Secondary Intermediate-Energy Standard Neutron Field (Sigma-Sigma) | ||||||||
| Co59g | 1.330E-04 | 3.640E+01 | 4.95 | Gar81 | 5.047E+01 | 0.78 | 0.10 | 1.387 5.01% |
| Mn55g | 4.153E-04 | 3.550E+01 | 3.38 | Gar81 | 3.103E+01 | 5.18 | 0.10 | 0.874 6.19% |
| Au197g | 1.219E-02 | 4.103E+02 | 3.41 | Gar78 | 3.837E+02 | 1.56 | 0.10 | 0.935 3.75% |
| Au197g/U5f | 1.325E-02 | 2.699E-01 | 2.50 | Han76 | 2.548E-01 | 1.98 | 0.10 | 0.944 3.15% |
| Fe58g | 6.688E-02 | 5.890E+00 | 4.92 | Gar81 | 7.298E+00 | 9.03 | 0.10 | 1.239 10.2% |
| B10He4 | 7.038E-02 | 1.695E+03 | 4.19 | Oli82 | 1.560E+03 | 1.06 | 0.20 | 0.920 4.32% |
| Ag109gm | 1.052E-01 | 2.430E+01 | 3.70 | Gar81 | 2.944E+01 | 6.31 | 0.10 | 1.212 7.32% |
| In115gm | 1.061E-01 | 2.602E+02 | 3.46 | Gar78 | 2.773E+02 | 2.35 | 0.10 | 1.066 4.18% |
| Li6He4 | 2.236E-01 | 9.310E+02 | 3.76 | Oli82 | 8.503E+02 | 0.49 | 0.12 | 0.913 3.79% |
| U235f | 2.558E-01 | 1.512E+03 | 3.51 | Gar78 | 1.506E+03 | 1.11 | 0.10 | 0.996 3.68% |
| Pu9f/U5f | 3.930E-01 | 1.179E+00 | 2.00 | Han76 | 1.164E+00 | 0.43 | 0.10 | 0.987 2.57% |
| Pu9f/U5f | 3.933E-01 | 1.175E+00 | 2.30 | Fab78 | 1.164E+00 | 0.43 | 0.10 | 0.993 2.58% |
| Np237f | 1.163E+00 | 6.030E+02 | 3.65 | Gar78 | 6.164E+02 | 0.00 | 0.10 | 1.022 3.65% |
| Np7f/U5f | 1.163E+00 | 3.830E-01 | 7.06 | Fab78 | 4.094E-01 | 1.67 | 0.10 | 1.071 7.06% |
| Np7f/U5f | 1.165E+00 | 3.751E-01 | 6.29 | Han76 | 4.094E-01 | 1.67 | 0.10 | 1.091 6.38% |
| In115m | 2.201E+00 | 5.480E+01 | 3.47 | Gar78 | 5.537E+01 | 1.72 | 0.10 | 1.010 3.87% |
| In115nm/U5f | 2.202E+00 | 3.731E-02 | 2.50 | Han76 | 3.677E-02 | 1.72 | 0.10 | 0.986 3.23% |
| U238f | 2.368E+00 | 8.346E+01 | 3.95 | Gar78 | 8.417E+01 | 1.22 | 0.10 | 1.009 4.14% |
| U8f/U5f | 2.368E+00 | 5.680E-02 | 2.70 | Fab78 | 5.590E-02 | 0.53 | 0.10 | 0.974 2.96% |
| U8f/U5f | 2.383E+00 | 5.664E-02 | 1.50 | Han76 | 5.590E-02 | 0.53 | 0.10 | 0.987 2.23% |
| Th232f | 2.544E+00 | 1.980E+01 | 6.06 | Gar78 | 2.087E+01 | 5.80 | 0.10 | 1.054 8.39% |
| Ti47p | 3.363E+00 | 5.200E+00 | 4.04 | Gar81 | 4.284E+00 | 2.76 | 0.10 | 0.824 4.89% |
| Ni58p | 3.828E+00 | 2.532E+01 | 3.55 | Gar78 | 2.410E+01 | 1.72 | 0.10 | 0.952 3.95% |
| Ni58p/U5f | 3.828E+00 | 1.718E-02 | 3.10 | Han76 | 1.601E-02 | 1.72 | 0.10 | 0.932 3.71% |
| Fe54p | 4.123E+00 | 1.820E+01 | 4.95 | Gar81 | 1.705E+01 | 3.19 | 0.10 | 0.937 5.88% |
| Al27p/U5f | 5.793E+00 | 6.148E-04 | 5.50 | Han76 | 5.518E-04 | 2.07 | 0.10 | 0.898 5.98% |
| Co59p | 5.870E+00 | 3.250E-01 | 4.00 | Gar81 | 2.965E-01 | 3.64 | 0.10 | 0.912 5.41% |
| Ti46p | 6.040E+00 | 2.510E+00 | 4.78 | Gar81 | 2.387E+00 | 3.21 | 0.10 | 0.951 5.76% |
| Fe56p | 7.361E+00 | 2.800E-01 | 4.29 | Gar81 | 2.398E-01 | 2.72 | 0.10 | 0.856 5.08% |
| Fe56p/U5f | 7.361E+00 | 1.686E-04 | 3.50 | Han76 | 1.593E-04 | 2.72 | 0.10 | 0.945 4.57% |
| Ti48p | 8.051E+00 | 6.700E-02 | 6.27 | Gar81 | 6.610E-02 | 5.59 | 0.10 | 0.987 8.40% |
| Co59a | 8.090E+00 | 3.340E-02 | 3.89 | Gar81 | 3.433E-02 | 3.71 | 0.10 | 1.028 5.38% |
| Mg24p/U5f | 8.112E+00 | 2.472E-04 | 5.10 | Han76 | 2.178E-04 | 0.84 | 0.10 | 0.881 5.28% |
| Al27a | 8.433E+00 | 1.600E-01 | 3.75 | Gar81 | 1.552E-01 | 0.74 | 0.10 | 0.975 3.82% |
| Al27a/U5f | 8.433E+00 | 1.041E-04 | 3.30 | Han76 | 1.031E-04 | 0.74 | 0.10 | 0.990 3.56% |
| Co592 | 1.275E+01 | 4.330E-02 | 5.08 | Gar81 | 3.899E-02 | 2.01 | 0.10 | 0.900 5.46% |
| Coupled Fast Reactivity Measurement Facility (CFRMF) | ||||||||
| Co59g/U5f | 1.000E-04 | 5.890E-02 | 2.30 | Rog78 | 5.594E-02 | 0.75 | 0.10 | 0.950 2.80% |
| Au197g/U5f | 7.100E-03 | 2.730E-01 | 1.00 | Rog78 | 2.596E-01 | 2.52 | 0.10 | 0.951 3.05% |
| Cu63g/U5f | 1.020E-02 | 2.920E-02 | 4.50 | Rog78 | 2.747E-02 | 6.70 | 0.10 | 0.941 8.19% |
| La139g/Au197ng | 1.391E-02 | 4.600E-02 | 0.00 | Har72 | 5.384E-02 | 7.25 | 0.10 | 1.170 7.20% |
| U8g/U5f | 3.400E-02 | 1.190E-01 | 2.40 | Rog78 | 1.429E-01 | 1.13 | 0.10 | 1.201 3.00% |
| Sc45g/U5f | 4.320E-02 | 1.510E-02 | 1.80 | Rog78 | 1.530E-02 | 5.79 | 0.10 | 1.013 6.22% |
| Fe58g/U5f | 4.850E-02 | 3.940E-03 | 1.50 | Rog78 | 4.865E-03 | 8.71 | 0.10 | 1.235 8.95% |
| B10He4 | 4.963E-02 | 1.900E+03 | 3.68 | Far75 | 1.737E+03 | 0.91 | 0.10 | 0.914 3.79% |
| B10He4a/U5f | 4.963E-02 | 1.102E+00 | 1.60 | Rog78 | 1.102E+00 | 0.91 | 0.10 | 0.923 2.31% |
| Th232g | 5.080E-02 | 2.910E+02 | 3.10 | And79 | 2.731E+02 | 6.37 | 0.10 | 0.938 7.08% |
| In115gm/U5f | 7.810E-02 | 1.810E-01 | 2.50 | Rog78 | 1.911E-01 | 2.36 | 0.10 | 1.056 3.71% |
| In115gm/Au197g | 7.810E-02 | 6.800E-01 | 8.82 | Har72 | 7.360E-01 | 2.36 | 0.10 | 1.082 9.12% |
| Li6He4 | 2.007E-01 | 1.004E+03 | 8.67 | Lip73 | 9.268E+02 | 0.84 | 0.10 | 0.923 8.71% |
| Li6He4/U5f | 2.222E-01 | 5.881E-01 | 1.00 | Rog78 | 5.679E-01 | 0.84 | 0.10 | 0.944 1.91% |
| Pu9f/U5f | 3.563E-01 | 1.165E+00 | 1.60 | Rog78 | 1.127E+00 | 1.14 | 0.10 | 0.968 2.41% |
| Pu9f/U5f | 3.930E-01 | 1.145E+00 | 2.30 | Gru75 | 1.127E+00 | 0.42 | 0.10 | 0.984 1.56% |
| Np7f/U5f | 1.139E+00 | 3.560E-01 | 1.90 | Rog78 | 3.724E-01 | 2.23 | 0.10 | 1.046 2.36% |
| Np7f/U5f | 1.139E+00 | 7.340E+00 | 7.06 | Gru75 | 7.451E+00 | 2.23 | 0.10 | 1.015 3.20% |
| In115nm/U5f | 2.258E+00 | 3.190E-02 | 4.40 | Rog78 | 3.300E-02 | 1.70 | 0.10 | 1.034 4.92% |
| U8f/U5f | 2.451E+00 | 4.880E-02 | 1.90 | Rog78 | 4.997E-02 | 1.22 | 0.10 | 1.024 2.66% |
| U8f/U5f | 2.451E+00 | 4.850E-02 | 2.70 | Gru75 | 4.997E-02 | 1.22 | 0.10 | 1.030 1.86% |
| Th232f | 2.651E+00 | 1.960E+01 | 4.70 | And79 | 1.973E+01 | 5.79 | 0.10 | 1.006 7.46% |
| Ti47p/U5f | 3.512E+00 | 2.690E-03 | 4.00 | Rog78 | 2.670E-03 | 2.74 | 0.10 | 0.992 5.05% |
| B10H3 | 3.641E+00 | 7.780E+00 | 8.61 | Lip73 | 1.707E+01 | 16.5 | 0.10 | 2.194 18.6% |
| Ni58p/U5f | 4.006E+00 | 1.560E-02 | 1.00 | Rog78 | 1.534E-02 | 1.73 | 0.10 | 0.983 2.44% |
| Fe54p/U5f | 4.297E+00 | 1.120E-02 | 1.00 | Rog78 | 1.101E-02 | 3.13 | 0.10 | 0.983 3.57% |
| Al27p/U5f | 5.782E+00 | 5.630E-04 | 2.00 | Rog78 | 5.635E-04 | 2.07 | 0.10 | 1.001 3.20% |
| Ti46p/U5f | 6.009E+00 | 1.680E-03 | 2.00 | Rog78 | 1.631E-03 | 3.13 | 0.10 | 0.971 3.97% |
| Ti48p/U5f | 8.153E+00 | 4.430E-05 | 2.00 | Rog78 | 4.638E-05 | 5.54 | 0.10 | 1.047 6.05% |
| Al27a/U5f | 8.488E+00 | 1.040E-04 | 1.20 | Rog78 | 1.100E-04 | 0.73 | 0.10 | 1.057 1.98% |
| Kayzero | Mughabghab | IRDFF-II | |||||||
| Target | Prod. | Unc. | Unc. | Diff. | Unc. | Diff. | |||
| [b] | [%] | [b] | [%] | [%] | [b] | [%] | [%] | ||
| 23Na | 24Na | 0.513 | 0.6 | 0.525 | 1.0 | 2.3 | 0.536 | 1.6 | 4.4 |
| 45Sc | 46Sc | 26.3 | 0.4 | 27.2 | 0.7 | 3.5 | 27.2 | 6.9 | 3.6 |
| 50Cr | 51Cr | 15.18 | 0.6 | 14.7 | 2.7 | -3.2 | 14.4 | 2.0 | -5.0 |
| 55Mn | 56Mn | 13.21 | 0.5 | 13.36 | 0.4 | 1.2 | 13.28 | 1.1 | 0.5 |
| 58Fe | 59Fe | 1.29 | 1.5 | 1.32 | 2.3 | 1.9 | 1.31 | 5.1 | 1.5 |
| 59Co | 60Co | 37.92 | 0.3 | 37.18 | 0.2 | -2.0 | 37.18 | 0.7 | -2.0 |
| 63Cu | 64Cu | 4.6 | 0.8 | 4.5 | 0.4 | -2.6 | 4.47 | 4.1 | -3.3 |
| 93Nb | 94Nb | 1.150 | 22. | 1.15 | 4.3 | 0.0 | 1.149 | 4.0 | 1.1 |
| 93Nb | 94mNb | 0.864 | 12. | 0.853 | 0.9 | 0.0 | 0.862 | 0.9 | |
| 109Ag | 110mAg | 3.909 | 1.3 | 3.95 | 1.3 | 1.1 | 4.211 | 5.1 | 7.7 |
| 113In | 114mIn | 8.733 | 1.7 | 8.1 | 3.7 | -7.2 | 8.134 | 4.6 | -6.9 |
| 115In | 116mIn | 157.5 | 0.7 | 162.3 | 0.4 | 3.1 | 159.8 | 1.0 | 1.5 |
| 139La | 140La | 9.29 | 0.6 | 9.21 | 0.4 | -0.8 | 9.04 | 3.9 | -2.7 |
| 181Ta | 182Ta | 20.3 | 4.7 | 20.4 | 1.5 | 0.3 | 20.7 | 3.0 | 1.6 |
| 186W | 187 W | 34.7 | 3.0 | 38.1 | 1.3 | 9.9 | 38.1 | 5.0 | 9.9 |
| 197Au | 198Au | 98.65 | 0.1 | 98.65 | 0.1 | 0.0 | 98.70 | 0.5 | 0.0 |
| 232Th | 233Th | 7.34 | 0.5 | 7.35 | 0.4 | 0.1 | 7.34 | 5.4 | 0.0 |
| 238U | 239 U | 2.67 | 0.6 | 2.682 | 0.7 | 0.5 | 2.68 | 1.0 | 0.5 |
| Kayzero | IRDFF-II | Mughabghab-2016 | IRDFF-II | ||||||||
| Target | Prod. | Unc. | Unc. | Diff. | Unc. | Unc. | Diff | ||||
| [b] | [%] | [b] | [%] | [%] | [b] | [%] | [b] | [%] | [%] | ||
| 23Na | 24Na | 0.3029 | 4.7 | 0.3041 | 4.5 | 0.4 | 0.3120 | 3.2 | 0.3158 | 4.5 | 1.2 |
| 45Sc | 46Sc | 11.3 | 0.4 | 11.32 | 7.6 | 0.2 | 12.1 | 4.1 | 11.89 | 7.6 | -1.8 |
| 50Cr | 51Cr | 8.047 | 2.5 | 6.528 | 3.9 | -19. | 7.2 | 2.8 | 6.834 | 3.9 | -5.1 |
| 55Mn | 56Mn | 13.91 | 3.0 | 13.25 | 3.8 | -4.7 | 13.3 | 3.8 | 13.53 | 3.8 | 1.7 |
| 58Fe | 59Fe | 1.26 | 1.8 | 1.246 | 4.9 | -1.3 | 1.34 | 12. | 1.275 | 4.9 | -4.8 |
| 59Co | 60Co | 75.58 | 3.0 | 75.01 | 0.8 | -0.8 | 75.8 | 2.6 | 75.80 | 0.8 | 0.0 |
| 63Cu | 64Cu | 5.3 | 0.8 | 4.885 | 4.2 | -7.3 | 4.97 | 1.6 | 4.988 | 4.2 | 0.4 |
| 93Nb | 94Nb | 8.45 | 12. | 8.725 | 3.4 | 3.2 | 8.37 | 4.4 | 8.753 | 3.4 | 4.6 |
| 93Nb | 94mNb | 6.35 | 12. | 6.546 | 3.4 | 3.1 | 6.21 | 6.4 | 6.567 | 3.4 | 5.8 |
| 109Ag | 110mAg | 65.27 | 4.4 | 68.39 | 7.0 | 4.8 | 65.1 | 4.5 | 68.50 | 7.0 | 5.3 |
| 113In | 114mIn | 211.33 | 2.4 | 224.7 | 8.7 | 6.3 | 182.9 | 5.5 | 225.1 | 8.7 | 23.0 |
| 115In | 116mIn | 2645.4 | 2.0 | 2539. | 3.1 | -4.0 | 2650 | 3.8 | 2647. | 3.1 | -0.1 |
| 139La | 140La | 11.52 | 0.6 | 11.92 | 5.5 | 3.5 | 12.1 | 5.0 | 12.11 | 5.5 | 0.1 |
| 181Ta | 182Ta | 677.6 | 4.7 | 659.5 | 3.8 | -2.7 | 655 | 3.1 | 660.0 | 3.8 | 0.8 |
| 186W | 187 W | 474.9 | 3.5 | 483.4 | 4.5 | 1.8 | 480 | 3.1 | 484.2 | 4.5 | 0.9 |
| 197Au | 198Au | 1550. | 1.8 | 1542. | 2.1 | -0.5 | 1550 | 1.8 | 1545. | 2.1 | -0.3 |
| 232Th | 233Th | 84.42 | 3.6 | 84.14 | 19. | -0.3 | 83.3 | 1.8 | 84.29 | 19. | 1.2 |
| 238U | 239 U | 276.0 | 1.4 | 274.9 | 1.1 | -0.4 | 277 | 1.1 | 275.0 | 1.1 | -0.7 |
VII.13 Thermal Reactor Neutron Fields - Thermal Cross Sections and Resonance Integrals
There is a direct relation between average cross sections with 1/ shape and the 2200 m/s value in a Maxwellian thermal reactor spectrum. The resonance integral also represents an idealized epithermal reactor spectrum. These quantities can be compared to compilations such as the Atlas of Resonance Parameters Mug16 . The values of the thermal capture cross sections reported in the Atlas are based on decades of experience with the interpretation of different kinds of experimental data, resonance theory and systematics. There could also be an element of subjective judgement involved, in the case of inconsistent or lacking data. Since the values in the Atlas were often used in the evaluation process, such comparison should be considered as data verification, rather than validation.
The and constants for neutron activation analysis by the k0 standardization method in the Kayzero library were measured independently over the years. The thermal cross sections and the resonance integrals derived from them are representative of an integral measurement in an idealized thermal reactor system. They can be used for data validation purposes.
The k0 factors can be measured quite accurately in irradiation facilities with strongly enhanced thermal spectra. They provide the ratio to the gold standard of the product of the cross section and the gamma-emission probability. In some cases the uncertainty in the gamma-emission probabilities introduces a dominant contribution to the uncertainty in the derived cross section. Other sources of uncertainty originate from detector calibration, measured masses and other details related to the analysis of the measured gamma spectra. The methodology was intended mainly for use with 1/v absorbers. The Westcott g-factors and the corrections for the non-ideal cadmium filter were seldom used in the interpretation of the measured data, but for the nuclides relevant for dosimetry these corrections are generally smaller than the overall experimental uncertainties.
In Table 34 the thermal cross sections from the compilation by Mughabghab and in the IRDFF-II library are compared to the reference values derived from the Kayzero library. Generally, the values from IRDFF-II lie close to the reference values, except for the 186W capture cross section, which differs by nearly 10 %. However, according to the consistency criteria defined in Table 17, the thermal capture cross sections of 23Na and 59Co also show poor agreement, mainly because the uncertainties assigned to the cross sections are small. Comparison of the cross sections in the Atlas by Mughabghab shows poor agreement for 45Sc, 59Co and 115In and marginally acceptable agreement for 23Na and 63Cu for the same reason, even though the values are comparably close to the reference. It must be mentioned that the main contribution to the uncertainties of the thermal cross sections of 93Nb come from the gamma-emission probabilities.
The case of 186W is an interesting one, where we believe the gamma-emission probabilities are mainly responsible for the difference. In the recent re-evaluation of the gamma-emission probabilities the values changed by about 20 %, but the resulting derived thermal capture cross section could not be fitted in a rigorous resonance analysis performed at JRC in Geel Sch14 . The case of the thermal capture cross section of 186W remains an open issue.
Resonance integrals can be derived from the Q0 factors, which are usually measured by the cadmium ratio method. The method is convenient because it practically eliminates the dependence on the detector efficiency and other features related to gamma-spectrum analysis. Its drawback is that it requires two sample irradiations, bare and under Cd cover, where the presence of Cd may distort the local spectrum in the irradiation facility close to the Cd-covered sample. The other source of ambiguity is the definition of the resonance integral. The common definition:
| (8) |
where eV and goes to infinity is not what is measured. Mughaghab used eV and MeV. The effective Cd cutoff energy for a 1 mm thick Cd cover is around 0.55 eV and it is not sharp. Secondly, measurements are made in thermal-reactor spectra, which fall off rapidly above 2 MeV. A better approximation to compare with measured data is to use = 0.55 eV and = 2 MeV. An additional refinement is to define the Cd transmission correction factor to correct for the difference between the idealized sharp cutoff at 0.55 eV and the actual cutoff by the rising Cd cross section with decreasing neutron energy. The Cd factor is defined as
| (9) |
From the definition it follows that measured values by the Cd ratio method must be divided by for comparison with the idealized values. A compilation of cadmium factors is available in the IAEA document INDC(NDS)-0693 for all nuclides of interest for NAA.
The factors were seldom used in the determination of the factors for the Kayzero library. In the current Kayzero library an attempt was made to measure the factor of 186W by making measurements in three irradiation channels with different spectral characteristics, but no uncertainty was specified. We believe that the value 0.908 adopted by DeCorte Dec87 is unrealistic and that good agreement of the resonance integral with Atlas and with IRDFF-II in Table 35 is a coincidence, stemming from error compensation between and the gamma-emission probabilities in deriving the thermal capture cross section.
| Measured SACS | Calculated SACS | ||||||||
| Reaction | kTlab | Value | Unc. | Reference | Value | Unc. | Spec. Unc. | C/E | |
| Notation | [keV] | [keV] | [mb] | [%] | [mb] | [%] | [%] | ||
| Mn55g | 30.55 | 25.78 | 3.315E+01 | 9.6 | KADoNiS10 | 3.283E+01 | 6.05 | 0.00 | 0.990 11.3% |
| Cu63g | 30.48 | 25.84 | 6.093E+01 | 10.4 | KADoNiS10 | 7.144E+01 | 9.70 | 0.00 | 1.173 14.2% |
| Au197g | 25.00 | 26.64 | 6.450E+02 | 3.9 | Jim14 | 6.899E+02 | 0.69 | 0.00 | 1.070 4.1% |
| Co59g | 30.51 | 27.05 | 4.379E+01 | 4.6 | KADoNiS10 | 3.444E+01 | 2.57 | 0.00 | 0.787 5.3% |
| U238g | 25.30 | 29.00 | 3.910E+02 | 4.35 | Wal14 | 3.899E+02 | 1.44 | 0.00 | 0.997 4.6% |
| Nb93g | 30.32 | 29.46 | 2.807E+02 | 2.4 | KADoNiS10 | 2.638E+02 | 0.78 | 0.00 | 0.940 2.5% |
| La139g | 30.22 | 29.52 | 3.284E+01 | 9.7 | KADoNiS10 | 4.159E+01 | 10.8 | 0.00 | 1.266 14.5% |
| Au197g | 28.00 | 30.25 | 6.160E+02 | 2.8 | Fei12 | 6.451E+02 | 0.64 | 0.00 | 1.047 2.8% |
| Au197g | 28.00 | 30.25 | 6.200E+02 | 2.6 | Fei12 | 6.451E+02 | 0.64 | 0.00 | 1.040 2.7% |
| Ta181g | 30.17 | 31.71 | 7.765E+02 | 2.5 | KADoNiS10 | 7.506E+02 | 3.87 | 0.00 | 0.967 4.6% |
| Sc45g | 30.67 | 32.58 | 6.234E+01 | 3.9 | KADoNiS10 | 6.797E+01 | 6.99 | 0.00 | 1.090 8.0% |
| Au197g | 30.15 | 32.65 | 6.200E+02 | 1.8 | KADoNiS10 | 6.181E+02 | 0.61 | 0.00 | 0.997 1.9% |
| In113gm | 30.26 | 35.03 | 1.561E+02 | 29.9 | KADoNiS10 | 1.616E+02 | 4.05 | 0.00 | 1.035 30.2% |
| In115gm | 30.26 | 35.04 | 6.305E+02 | 30.1 | KADoNiS10 | 6.080E+02 | 4.05 | 0.00 | 0.964 30.4% |
| In113gg | 30.27 | 35.04 | 7.867E+02 | 10.7 | KADoNiS10 | 7.696E+02 | 0.00 | 0.00 | 0.978 10.7% |
| Na23g | 31.30 | 35.27 | 1.825E+00 | 3.1 | KADoNiS10 | 2.023E+00 | 8.49 | 0.00 | 1.109 9.1% |
| In113g | 30.27 | 35.91 | 8.201E+02 | 14.0 | KADoNiS10 | 9.539E+02 | 0.00 | 0.00 | 1.163 14.0% |
| Fe58g | 30.52 | 37.38 | 1.450E+01 | 6.5 | KADoNiS10 | 1.506E+01 | 16.3 | 0.00 | 1.039 17.5% |
| W186g | 30.16 | 37.46 | 2.291E+02 | 5.5 | KADoNiS10 | 1.920E+02 | 1.93 | 0.00 | 0.838 5.8% |
| Ag109g | 30.28 | 42.23 | 4.075E+01 | 3.8 | KADoNiS10 | 5.785E+01 | 6.76 | 0.00 | 1.420 7.7% |
| U238g | 426.0 | 632.2 | 1.080E+02 | 3.70 | Wal14 | 3.899E+02 | 1.82 | 0.00 | 1.011 4.1% |
Another possible source of discrepancy in the measured resonance integrals stems from the fast-fission spectrum contribution. This depends on the irradiation facility. It may become significant in the Cd-ratio measurements, since these have to be made in conditions, where the epithermal contribution to the reaction rate is not so small. By a minor extension to the governing equations the fast fission effect can be treated explicitly Trkov:NAA . The effect is usually small, but it has been demonstrated that in some cases it can amount to a few percent in the measured Trkov:Al . However, this methodology is not generally used by the NAA community.
The Atlas value of the resonance integrals of 45Sc and 55Mn are within two-sigma uncertainty compared to the values derived from the factors in the Kayzero library, but the resonance integrals of 50Cr, 63Cu and 113In disagree with the values derived from the Kayzero library, as seen from Table 35. The value for 113In was derived from the total capture resonance integral, assuming the same branching ratio as for the thermal cross section, which might be inappropriate. The values calculated from the IRDFF-II library generally agree to within two-sigma with Kayzero, except 50Cr. The neutron-induced resonance data of these nuclides and particularly for n+50Cr remain an open issue that requires further investigation.
VII.14 High Temperature Maxwellian ( 25–430 keV)
Most of the experimental Maxwellian spectrum-averaged cross sections, MACS, were taken from the latest version 1.0 of KADoNiS KADoNiS10 based on the gold standard 197Au(n,) = 611.66.0 mb. This database presents the so-called stellar SACS which were derived from the experimental by applying the factor 2/ and converting them in the centre-of-mass system to the temperature kTcm = 30 keV Bao00 . For comparison with these data we have computed the IRDFF-II SACS for the corresponding kTlab = kTcm * (1 + A)/A, where A is the ratio of the mass of the target nucleus to that of a neutron. Additionally, all KADoNiS cross sections and their uncertainties were renormalized to the newly introduced SACS gold standard 197Au(n,) = 62011 mb Car18 which adds a +1.4% correction.
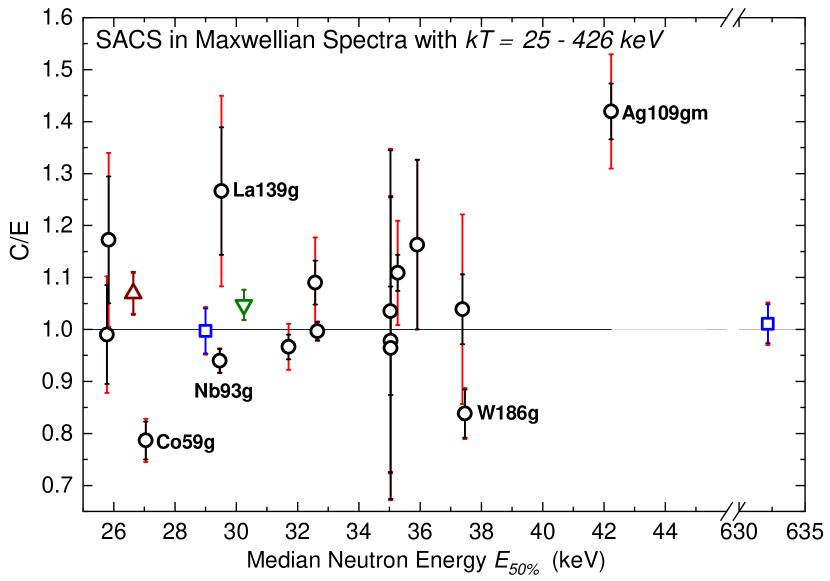
Several other measurements Fei12 ; Jim14 ; Wal14 were carried out, but were not included in KADoNiS yet. In particular, A. Wallner and co-workers Wal14 have measured SACS, not by the traditional activation technique, but by the highly-accurate Accelerator Mass Spectroscopy technique (AMS). In addition to the measurement at typical neutron spectrum average energy of 25 keV they have measured SACS at higher keV. These experiments delivered their results in the laboratory system corresponding to different values, so the IRDFF-II SACS were calculated at those temperatures.
The resulting C/E ratios with IRDFF-II for the 17 dosimetry reactions addressed within the KADoNiS database and several new experiments, along with the associated experimental and IRDFF-II cross section uncertainties, are listed in Table 36. The trends in the C/E ratios are displayed in Fig. 114. There the uncertainties of measurements and of the IRDFF-II cross sections are displayed separately allowing to observe their contributions to the total C/E uncertainty.
As one can see, most of the IRDFF-II Maxwellian averaged cross sections agree with measurements to within 1–2 sigma. However we do not observe a good agreement for (n,) reactions on 59Co, 186W and 109Ag targets. Whether this is a problem in IRDFF-II evaluations or it is an experimental problem remains an open question. The reaction 232Th(n,) is a rare case among the IRDFF-II (n,) reactions that is not validated in the Maxwellian-30 keV benchmark field yet.
VIII CONSISTENCY OF CROSS SECTIONS IN STANDARD AND REFERENCE FIELDS
Because of the uncertainty in the neutron fluence for a given reactor operation, a better metric than a spectral index for a fission reactor field is the consistency of the set of measured activities in a given reactor field. The consistency is best captured by the overall chi-squared per degree of freedom () metric as obtained from a least-squares-based spectrum adjustment in neutron benchmark fields. The relevant reaction-specific metric is then the resulting least-squares-based activity adjustment and the C/E for the adjusted activity.
The following subsections address this least-squares metric for specific neutron benchmark fields.
VIII.1 252Cf(s.f.)
Sec. VII.1 reports on the validation evidence using individual measured values for the spectrum-averaged cross section in this standard neutron benchmark field. A more exacting validation metric, based on the consistency of the set of validation data gathered within this neutron field, is depicted in Table 37.
The LSL-M2 code was used to perform the least-squares analysis. The inputs included the measurements, with uncertainties, the IRDFF-II cross sections, with covariance matrices, and the a priori spectrum, in this case as provided by time-of-flight measurements, along with the corresponding covariance matrix. This approach permitted all of the input data to be adjusted, consistent with the input uncertainties, but the major result was to adjust the spectrum and to provide a high-fidelity test of the consistency of the data for the neutron field. A chi-squared per degree of freedom, , is reported and provides a metric on the consistency of the data.
| Reaction | Act. Adj. | Spectrum Unc. | |
|---|---|---|---|
| Notation | [%] | [%] | C/E |
| Au197g | -0.33% | 0.42% | 0.991 1.79% |
| Ta181g | -0.35% | 0.75% | 0.935 5.65% |
| Th232g | 0.43% | 0.43% | 1.032 5.53% |
| Cu63g | 0.20% | 0.61% | 1.010 8.64% |
| In115g | -1.20% | 0.37% | 0.979 2.45% |
| U235f | 1.94% | 0.07% | 1.013 1.21% |
| Pu239f | -0.12% | 0.07% | 0.992 1.38% |
| Np237f | 0.66% | 0.23% | 1.000 1.69% |
| In115n | -2.28% | 0.38% | 0.964 1.57% |
| Nb93n | 1.47% | 0.36% | 1.010 3.73% |
| In113n | -1.39% | 0.40% | 0.978 2.15% |
| U238f | -1.45% | 0.40% | 0.978 1.70% |
| Th232f | -5.66% | 0.43% | 0.935 5.08% |
| Hg199n | -0.54% | 0.44% | 0.985 2.22% |
| BH3 | -1.95% | 0.51% | 0.931 11.58% |
| Ti47p | 1.31% | 0.62% | 1.015 2.16% |
| S32p | 2.68% | 0.73% | 1.023 3.65% |
| Zn64p | 1.27% | 0.78% | 1.009 3.31% |
| Ni58p | 0.35% | 0.75% | 1.000 1.66% |
| Fe54p | 1.36% | 0.78% | 1.015 1.79% |
| Pb204n | -1.58% | 0.97% | 0.971 2.74% |
| Al27p | -4.51% | 1.14% | 0.950 2.51% |
| Co59p | 1.12% | 1.15% | 1.015 3.16% |
| Ti46p | -1.44% | 1.18% | 0.974 2.63% |
| Si28p | 2.18% | 1.41% | 1.031 2.67% |
| Cu63a | 0.22% | 1.37% | 1.006 2.93% |
| Fe56p | -0.23% | 1.45% | 0.998 2.91% |
| Mg24p | 4.59% | 1.56% | 1.050 2.92% |
| U2382 | 3.92% | 1.56% | 1.045 11.23% |
| Ti48p | 0.07% | 1.55% | 1.005 3.53% |
| Co59a | -0.14% | 1.54% | 1.000 3.39% |
| Al27a | -0.11% | 1.59% | 1.003 2.07% |
| U51a | -0.98% | 1.85% | 0.989 3.23% |
| Au1972 | 0.04% | 1.95% | 1.005 2.85% |
| Nb932 | -0.44% | 2.20% | 1.000 4.95% |
| I1272 | 1.10% | 2.30% | 1.018 3.87% |
| Cu652 | -0.84% | 2.90% | 0.993 3.70% |
| Co592 | 0.36% | 3.24% | 1.006 4.27% |
| Cu632 | 3.32% | 4.10% | 1.032 5.74% |
| F192 | 1.09% | 4.39% | 1.007 5.66% |
| Zr902 | -1.39% | 4.99% | 0.981 5.77% |
| Ni582 | 0.87% | 5.90% | 0.997 7.07% |
| Ni60p | 2.41% | 1.35% | 1.027 5.03% |
| Tm1692 | -1.75% | 1.91% | 0.986 4.74% |
| Mn552 | -1.49% | 3.04% | 0.958 15.63% |
| Y892 | 1.21% | 4.19% | 0.984 5.64% |
| Na232 | -4.46% | 6.79% | 0.990 7.63% |
| Tm1693 | -0.33% | 14.75% | 0.795 16.24% |
The least-squares calculation in this standard neutron benchmark field used 48 measured reactions. As expected from the consideration of the separate spectrum-averaged cross sections addressed in Sect. VI.1, the measured data were very consistent with calculations and the overall least-squares spectrum adjustment had a very small of 0.7042. A least-squares process using data for which there was an accurate identification of the a priori uncertainties should have a metric of 1.00. This less than unity suggests that some of the input data (spectrum, cross sections, or measured activities) actually may have had smaller uncertainties than were assigned to the input quantities.
The resulting adjustment in the spectrum-averaged activity, the reduced spectrum uncertainty contributions to the C/E, and the C/E values are tabulated in Table 37. The C/E column is color-coded in a manner consistent with the discussion in Sec. VI.1. The discrepant reactions are shown in “red”, the “acceptable” reactions in “yellow”, and the “good” reactions in “green”. While a least-squares analysis can adjust all of the input data that have identified associated uncertainties, changing their contribution to the uncertainty in the resulting C/E value, this table does not provide the details of the resulting cross section and measurement uncertainty contributions since these uncertainties are not changed significantly from those presented in the spectrum-averaged cross section comparison in Table 37. While the spectrum contribution to the overall C/E uncertainty is reduced here relative to that seen in the spectrum-averaged cross section comparison, the difference is not large because of the very-well-characterized a priori 252Cf(s.f.) spectrum, which was measured using time-of-flight techniques, used in the analysis. In less-well-characterized neutron fields, the least-squares analysis will significantly reduce the spectrum contribution to the resulting uncertainty in the C/E value.
Fig. 115 shows the C/E values in this 252Cf(s.f.) neutron benchmark field plotted versus the median response energy for the 48 reactions used in the least-squares adjustment. There is no significant trend seen in the C/E ratios versus the median response energy. The C/E uncertainties are clearly much larger in the low and high energy portion of the spectrum. The adjustment produced a 1.0% adjusted scale factor. The scale factor adjustment is taken out of the C/E values in this figure.
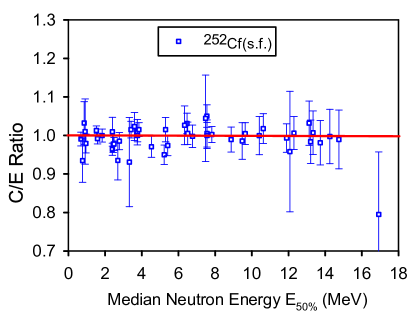
The largest contributor to the overall came from the Al27p reaction, which had an individual contribution of 4.02, but, based on the acceptance criteria presented in Table 17, the Al27p reaction, with a C/E of 0.950 2.51%, still showed a “good” validation status in this neutron field. The next largest contributor to the overall came from the In115n reaction, which had an individual contribution of 3.23, with a C/E of 0.964 1.57%. The color coding in Table 37 shows that this reaction, because of its small overall C/E uncertainty, was just outside of the required two standard deviations and has a status of “acceptable” rather than “good” as validation evidence. The only “poor” validation status seen in the data available in this benchmark field came from the Tm1693 reaction. This reaction, which had an individual contribution of 2.37, had a C/E of 0.795 16.24%, which, even though its large uncertainty gave it a C/E that was well within even the two standard deviations of unity required by Table 17 criterion #1 for a “good” status, it failed to meet the Table 17 C/E interval criterion #2 for even an “acceptable” status.
Note that the uncertainty of the TOF measured a priori spectrum is larger than 15% at the reaction threshold of 16 MeV and quickly rises up to 75% at 20 MeV, therefore the least-squares fit is not well constrained in the energy region where this particular dosimeter is sensitive. The least-squares analysis showed a very strong upward adjustment (+19.3%) in the high energy ( MeV) portion of the spectrum and a downward shift in the reaction rate (-4.5%), that is, the least-squares process made adjustments in both the reaction probability and the spectrum in order to minimize the resulting disagreement in this high energy region.
VIII.2 235U(nth,f)
Sect. VII.2 reports on the validation evidence using individual measured values for the spectrum-averaged cross sections in this reference neutron benchmark field. The more exacting validation metric, based on the consistency of the set of validation data gathered within this neutron field as assessed by the LSL-M2 least square code, is depicted in Table 38. The least square inputs included the measurements, with uncertainties, the IRDFF-II cross sections, with covariance matrices, and the a priori spectrum, in this case as provided from the GMA analysis and incorporated into the ENDF/B-VIII.0 evaluation as addressed in Sec. VII.2, along with the corresponding covariance matrix. The chi-squared per degree of freedom, , is reported from the analysis and provides a metric on the consistency of the input data.
| Reaction | Act. Adj. | Spectrum Unc. | |
|---|---|---|---|
| Notation | [%] | [%] | C/E |
| Li6He4 | 4.69% | 0.65% | 1.074 6.02% |
| Au197g | -11.27% | 0.67% | 0.889 4.58% |
| B10a | -3.82% | 0.64% | 0.848 9.72% |
| U238g | -17.62% | 0.64% | 0.825 9.66% |
| Cu63g | 1.46% | 0.61% | 1.019 24.61% |
| In115gm | 4.78% | 0.60% | 1.052 4.83% |
| U235f | 3.11% | 0.52% | 1.034 2.35% |
| Pu239f | 0.4% | 0.52% | 1.007 2.65% |
| Np237f | 1.82% | 0.56% | 1.022 2.79% |
| Rh103n | 1.24% | 0.57% | 1.017 4.22% |
| Nb93nm | -1.81% | 0.62% | 0.983 5.38% |
| In115nm | 0.28% | 0.63% | 1.006 2.52% |
| In113nm | -6.94% | 0.65% | 0.933 5.57% |
| U238f | 0.4% | 0.65% | 1.007 2.40% |
| Th232f | -8.05% | 0.65% | 0.918 3.83% |
| Hg199n | 2.34% | 0.65% | 1.027 5.84% |
| P31p | -0.49% | 0.78% | 0.997 3.62% |
| Ti47p | 1.78% | 0.73% | 1.024 3.19% |
| S32p | -0.67% | 0.82% | 0.995 3.04% |
| Ni58p | -0.19% | 0.80% | 1.000 2.62% |
| Zn64p | 0.6% | 0.85% | 1.008 7.59% |
| Fe54p | 2.84% | 0.84% | 1.034 2.78% |
| Zn67p | 1.01% | 0.80% | 1.014 6.64% |
| Pb204n | -8.62% | 0.93% | 0.909 6.87% |
| Mo92p | 0.67% | 0.97% | 1.011 4.07% |
| Al27p | -3.01% | 1.08% | 0.968 2.96% |
| Co59p | 1.25% | 1.07% | 1.017 3.72% |
| Ti46p | -0.5% | 1.13% | 0.993 3.45% |
| Ni60p | -0.6% | 1.34% | 0.994 5.43% |
| Cu63a | 1.72% | 1.36% | 1.022 4.11% |
| Si28p | -0.45% | 1.56% | 0.993 4.16% |
| Fe54a | -2.1% | 1.44% | 0.969 5.60% |
| Fe56p | 0.21% | 1.54% | 1.003 3.51% |
| Ti48p | -0.04% | 1.70% | 1.001 4.15% |
| Co59a | -0.03% | 1.68% | 1.001 4.50% |
| U2382 | -5.03% | 1.87% | 0.936 5.63% |
| Mg24p | -0.08% | 1.83% | 0.999 3.08% |
| Al27a | 0.65% | 1.86% | 1.009 3.00% |
| V51a | 1.79% | 2.28% | 1.008 4.12% |
| Tm1692 | -1.5% | 2.74% | 1.036 5.55% |
| Au1972 | 3.55% | 2.79% | 1.001 3.96% |
| Nb932m | -1.25% | 3.61% | 1.065 4.75% |
| I1272 | 0.12% | 3.79% | 1.016 5.36% |
| Mn552 | 0.55% | 4.72% | 1.057 16.61% |
| As752 | 3.25% | 4.81% | 1.040 6.88% |
| Co592 | -19.81% | 4.95% | 1.069 6.05% |
| Cu632 | 1.11% | 4.94% | 0.828 7.95% |
| Y892 | -0.29% | 5.06% | 1.039 5.98% |
| F192 | -0.31% | 4.60% | 1.023 6.12% |
| Ni582 | 3.92% | 3.42% | 1.015 5.00% |
| Na232 | -10.7% | 2.86% | 1.054 4.89% |
| Al272g | 4.69% | 2.30% | 0.902 13.72% |
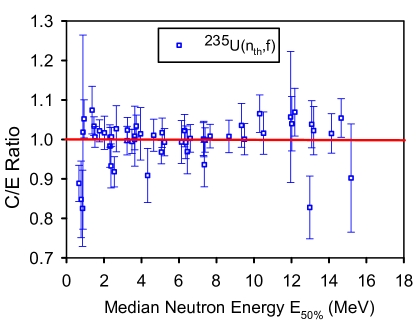
The least-squares calculation used 52 measured reactions. Two reactions that were included in the SACS analysis were not included in this least-squares analysis: the B10t reaction was not addressed in the analysis because it was correlated with the B10a reaction that was used and the LSL-M2 code implementation used here did not handle strongly correlated cross sections; the Zr902 reaction was not addressed in the analysis because it was used in support of the determination of the a priori 235U(nth,f) spectrum and this would have introduced a strong correlation that the LSL-M2 code could not address. As expected from the consideration of the separate spectrum-averaged cross sections addressed in Sect. VI.2.1, most of the reactions included in the least-squares adjustment proved to provide good or acceptable validation evidence, and the least-squares analysis yielded a very good of 0.943.
There were no “poor” or discrepant reactions. Four reactions (Au197g with an individual contribution of 6.14 and a C/E of 0.889 4.58%; Th232f with a contribution of 4.84 and a C/E of 0.918 3.83%; U238g with a contribution of 3.33 and a C/E of 0.825 9.66%; and B10a with an contribution of 2.48 and a C/E of 0.848 9.72%) were labeled as “acceptable” validation evidence, and the remaining reactions met the criteria for “good” validation evidence. The U238g reaction was seen to be labeled as “acceptable” in both the SACS analysis shown in Table 20 and in this least-squares analysis. The Cu632 and Pb204n reactions were only labeled as “acceptable” in the SACS analysis but were both “good” in this least square’s analysis. The B10a, Au197g, and Th232f reactions are only labeled as “acceptable” in this least square analysis but met the criteria for “good” validation evidence in the SACS analysis. The fact that these three reactions also corresponded to the reactions with the lowest median response energy might indicate that it is the low energy portion of the a priori 235U(nth,f) spectrum, and not the cross sections or measurements, that has an issue.
The resulting adjustment in the spectrum-averaged activities, the reduced spectrum uncertainty contributions to the C/E, and C/E values are tabulated in Table 38. The C/E column is again color-coded in a manner consistent with the discussion in Sec. VI.2.1. Overall good or acceptable validation evidence, using these least-squares validation criteria, is found for all 52 IRDFF-II reactions in the 235U(nth,f) reference neutron benchmark field. It should be noted that, while the a priori 252Cf(s.f.) neutron spectrum showed a high uncertainty and a large least-squares adjustment in the high energy (15–20 MeV) region, neither this large uncertainty nor the large least-squares adjustment were seen for the a priori 235U(nth,f) spectrum. This observation is related to the role that the Zr902 reaction played in the determination of the a priori 235U(nth,f) spectrum by significantly reducing the uncertainty of the evaluated spectra due to the low uncertainty of the employed Zr902 SACS ( 7%) . Al272 was the reaction in this 235U(nth,f) field that had the highest median response energy. While this reaction, with a median response energy of 15.18 MeV, had a significant measurement uncertainty (13.3 %), a very small individual component, 0.58, and a good C/E of 0.902 13.72 %, the least-squares analysis resulted in only a 0.3 % adjustment in the neutron spectrum above 15 MeV. This least-squares analysis is a very strong indication of the fidelity of the MeV portion of the a priori 235U(nth,f) spectrum as defined in original PFNS evaluations PFNS ; PFNS1 ; PFNS2 adopted for the ENDF/B-VIII.0 library ENDF8 ; CIELO:2018 ; Capote:2018 .
Fig. 116 shows the C/E values in this 235U(nth,f) neutron benchmark field plotted versus the median response energy for the 52 reactions used in the final least-squares adjustment. The adjustment produced a 0.3 % adjusted scale factor. The scale factor adjustment is taken out of the C/E values in this figure. There is no significant trend seen in the C/E ratios versus the median response energy. The C/E uncertainties are larger for several of the reactions in the low and high energy portion of the spectrum that reflects uncertainties of the a priori spectrum in those energy regions.
| Reaction | Act. Adj. | Spectrum Unc. | |
|---|---|---|---|
| Notation | [%] | [%] | C/E |
| Ni58p-Cd | -4.89 | 10.48 | 1.000 10.96% |
| Sc45g-Cd | 0.2 | 5.93 | 0.994 8.90% |
| Mn55g-Cd | -3.43 | 5.64 | 0.802 8.31% |
| Au197g-bare | -15.58 | 5.58 | 0.839 7.17% |
| Au197g-Cd | -6.78 | 5.72 | 0.929 7.28% |
| Sc45g-fiss | 1.71 | 6.05 | 1.051 8.57% |
| Na23g-bare | 0.53 | 6.37 | 1.129 11.26% |
| Fe58g-Cd | 0.66 | 5.86 | 1.105 12.04% |
| Na23g-Cdna | 0.21 | 6.62 | 1.075 11.78% |
| Mn55g-fiss | 1.14 | 5.69 | 1.082 8.69% |
| W186g-bare | -20.28 | 5.11 | 0.818 10.41% |
| Cu63g-Cd | 0.04 | 5.52 | 1.041 11.99% |
| Na23g-fiss | 0.59 | 6.24 | 1.178 11.94% |
| U235f-Cdtk | -1.63 | 5.43 | 1.045 6.21% |
| U235f-fiss | 2.07 | 5.51 | 1.089 6.27% |
| Pu239f-Cdtk | 3.36 | 5.6 | 1.109 6.21% |
| Pu239f-fiss | 8.33 | 5.68 | 1.165 6.29% |
| Np237f-Cdtk | -0.01 | 6.99 | 1.118 7.55% |
| Np237f-fiss | -1.46 | 7.01 | 1.103 7.57% |
| In115nm-bare | -0.84 | 9.03 | 1.068 10.20% |
| U238f-Cd | -1.54 | 9.87 | 1.046 10.37% |
| U238f-fiss | -2.6 | 9.85 | 1.036 10.36% |
| Ti47p-Cd | 4.05 | 9.77 | 1.102 10.22% |
| S32p-bare | -5.13 | 11.07 | 0.990 11.50% |
| Zn64p-Cd | 2.35 | 11.19 | 1.077 11.42% |
| Fe54p-Cd | -0.22 | 10.91 | 1.049 11.40% |
| Al27p-Cd | 6.4 | 12.06 | 1.138 12.45% |
| Co59p-bare | -7.44 | 11.83 | 0.983 13.04% |
| Ti46p-Cd | -0.9 | 12.4 | 1.054 12.96% |
| Cu63a-bare | -10.01 | 12.86 | 0.966 13.97% |
| Fe56p-Cd | -0.35 | 14.11 | 1.076 14.43% |
| Ti48p-Cd | 0.31 | 13.88 | 1.105 14.22% |
| Mg24p-Cd | 3.48 | 15.41 | 1.122 15.71% |
| Al27a-Cd | -1.46 | 14.78 | 1.075 14.90% |
| Nb932-bare | 3.25 | 16.47 | 1.113 17.14% |
| Co592-bare | 4.16 | 14.94 | 1.087 16.60% |
| Mn552-bare | -16.09 | 15.06 | 0.878 17.15% |
| Mn552-fiss | -3.18 | 15.05 | 1.009 15.90% |
| Zr902-Cd | 5.45 | 15.17 | 1.142 15.55% |
| Ni582-bare | -8.87 | 15.62 | 1.014 16.69% |
VIII.3 SPR-III Fast Burst Reactor Central Cavity
The least-squares analysis used 40 reaction/cover combinations and had a 2/dof of 2.409. Although this chi-squares is high, none of the resulting dosimeters are found to be discrepant when we use the acceptance criteria adopted in Table 17. Table 39 shows the resulting C/E along with the consistent least-squares spectrum uncertainty and adjustment in the activity measurement. Fig. 117 shows the C/E values in the SPR-III reference neutron benchmark field plotted versus the median response energy for the 40 reactions used in the final least-squares adjustment.
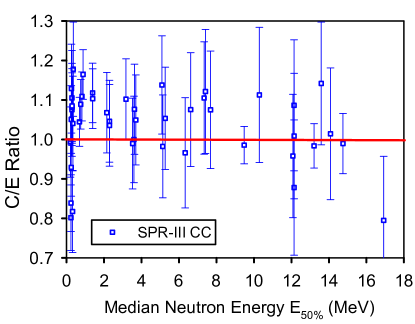
VIII.4 ACRR Pool-type Reactor Central Cavity
The least-squares analysis for this neutron field used 33 reaction/cover combinations and had a 2/dof of 0.8984. This reflects an excellent consistency of the data (and associated input uncertainties). Table 40 shows the resulting C/E along with the consistent least-squares spectrum uncertainty and adjustment in the activity measurement. Two of the 33 reactions, Ag109g-bare and Co59g-Cd, were labeled as discrepant based on the criteria in Table 17 – due to the large C/E value even if this value was within two standard deviations of unity.
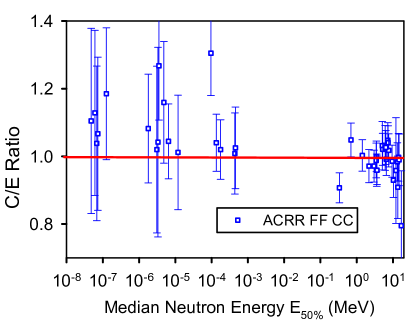
| Reaction | Act. Adj. | Spectrum Unc. | |
| Notation | [%] | [%] | C/E |
| Ni58p-bare | 1.67 | 2.75 | 1.000 4.53% |
| Sc45g-bare | 0.16 | 26.17 | 1.105 27.39% |
| Na23g-bare | 3.27 | 24.15 | 1.129 24.40% |
| Mn55g-bare | -3.83 | 22.67 | 1.038 22.85% |
| Fe58g-bare | -0.17 | 22.09 | 1.067 22.64% |
| Co59g-bare | 1.87 | 18.88 | 1.185 19.50% |
| Sc45g-Cd | 0.07 | 14.32 | 1.082 16.09% |
| Au197g-bare | -1.92 | 24.32 | 1.020 24.66% |
| Au197g-Cd | 0.94 | 27.71 | 1.042 28.04% |
| Ag109g-bare | 4.66 | 14.74 | 1.268 16.04% |
| Ag109g-Cd | -0.8 | 16.34 | 1.160 17.98% |
| Na23g-Cd | -1.05 | 10.17 | 1.045 11.08% |
| W186g-bare | -0.12 | 16.5 | 1.012 16.93% |
| Co59g-Cd | 4.26 | 11.53 | 1.305 12.53% |
| Mn55g-Cd | 0.66 | 7.73 | 1.040 8.45% |
| Fe58g-Cd | -0.18 | 7.31 | 1.020 8.80% |
| rmleu-fiss | -7.44 | 1.8 | 0.907 4.42% |
| rmlpu-fiss | 5.04 | 1.87 | 1.049 4.99% |
| Np237f-fiss | 1.86 | 2.29 | 1.003 4.67% |
| rmldu-fiss | -0.89 | 2.71 | 0.971 4.89% |
| Ti47p-bare | -0.87 | 2.59 | 0.971 4.71% |
| S32p-bare | 0.73 | 2.93 | 0.988 5.12% |
| Zn64p-bare | -2.15 | 2.95 | 0.959 4.77% |
| Fe54p-bare | -2.18 | 2.87 | 0.959 4.23% |
| Co59p-Cd | 2.95 | 3.12 | 1.032 7.16% |
| Ti46p-bare | 1.43 | 3.23 | 1.021 4.74% |
| Ni60p-bare | 1.39 | 3.28 | 1.025 6.62% |
| Fe56p-bare | -1.65 | 3.49 | 0.992 4.81% |
| Ti48p-bare | 1.35 | 3.5 | 1.048 5.20% |
| Nb932-bare | -2.17 | 4.23 | 0.930 5.10% |
| Mg24p-bare | 1.93 | 3.91 | 1.041 4.98% |
| Al27a-bare | 0.19 | 3.8 | 1.018 4.89% |
| Zr902-bare | -1.89 | 7.43 | 0.909 9.23% |
The table reflects a large spectrum contribution to the uncertainty, and there is also seen to be a correlation in the C/E between the two configurations, bare and cover, – both configurations showing a positive C/E value. It is very possible that the discrepancy reflects an issue with the a priori neutron spectrum, or the associated uncertainty, rather than with the dosimetry cross section. It should also be noted that both of these basic reactions appear in the set of sensors in both, a bare configuration, and with a cadmium cover; only one of the sensor configurations was labelled as discrepant. It is important that we also note a limitation in our current least-squares treatment. While a least-squares analysis should capture any correlation between input quantities, the LSL code used here did not include any correlation between the dosimetry responses. While this is not an issue for most dosimetry reactions, it could be an issue when for the response functions that address two different configurations for the same basic reaction. This is an area for later tool development. Fig. 118 shows the C/E values in the ACRR central cavity reference neutron benchmark field plotted versus the median response energy for the 33 reactions used in the final least-squares adjustment.
| Reaction | Measured Activity | Act. Adj. | Spectrum | ||
|---|---|---|---|---|---|
| Notation | [Bq/at or | Unc. | Unc. | Unc. | |
| Fiss/at.] | [%] | [%] | [%] | C/E Unc. [%] | |
| Co59g-bare | 6.2470E-18 | 0.8 | 0.84 | 14.15 | 1.48514.33 |
| Au197g-bare | 2.4293E-14 | 2.8 | -0.87 | 9.67 | 1.03910.59 |
| Mn55g-bare | 4.0558E-14 | 2.0 | 2.08 | 4.81 | 1.195 6.37 |
| Fe58g-bare | 1.2442E-17 | 2.3 | -0.81 | 4.54 | 1.095 8.08 |
| Mo98g-bare | 1.6478E-15 | 1.8 | 0.18 | 4.02 | 1.110 9.93 |
| Cu63g-bare | 6.6548E-15 | 5.7 | -11.28 | 4.34 | 0.859 8.91 |
| Sc45g-bare | 1.6744E-17 | 0.7 | 0.11 | 2.8 | 1.17115.18 |
| Co59g-Cdtk/B4C | 2.0990E-19 | 0.8 | 0.27 | 3.65 | 1.167 4.38 |
| Au197g- Cdtk/B4C | 2.7153E-15 | 4.2 | -1.53 | 2.15 | 1.056 6.37 |
| Fe58g-Cdtk/B4C | 2.7876E-18 | 7.2 | 3.06 | 2.9 | 1.18013.44 |
| Mo98g-Cdtk/B4C | 3.9782E-16 | 2.2 | 3.27 | 2.82 | 1.286 8.07 |
| rmleu-Cdtk/B4C | 3.8036E-09 | 2.1 | -1.51 | 4.39 | 1.046 5.27 |
| rmlpu-Cdtk/B4C | 4.5468E-09 | 2.0 | -2.73 | 5.69 | 1.007 6.76 |
| Np237f-Cdtk/B4C | 1.9753E-09 | 3.0 | 0.7 | 10.2 | 1.03210.83 |
| In115n-bare | 9.8199E-15 | 5.6 | -7.47 | 13.09 | 0.95614.39 |
| rmldu-Cdtk/B4C | 2.8865E-10 | 2.0 | 2.44 | 14.44 | 1.07214.72 |
| Ti47p-bare | 3.6124E-17 | 2.6 | 0.99 | 13.07 | 1.04613.55 |
| S32p-bare | 2.6391E-17 | 2.9 | -0.76 | 14.54 | 1.01614.98 |
| Ni58p-bare | 9.5960E-18 | 1.6 | -2.78 | 13.63 | 1.00013.89 |
| Fe54p-bare | 1.4959E-18 | 1.1 | 1.64 | 14.18 | 1.04814.39 |
| Co59p-bare | 1.6482E-19 | 2.4 | -1.49 | 16.66 | 1.01917.08 |
| Ti46p-bare | 6.7205E-19 | 0.8 | 0.93 | 17.24 | 1.05717.45 |
| Ni60p-bare | 5.4018E-21 | 6.0 | -0.2 | 17.11 | 1.05318.27 |
| Fe56p-bare | 4.7933E-17 | 0.9 | -0.22 | 17.89 | 1.05618.13 |
| Ti48p-bare | 7.7602E-19 | 0.6 | 0.01 | 18.16 | 1.06118.51 |
| Al27a-bare | 5.2690E-18 | 3.7 | 0.14 | 20.11 | 1.05920.54 |
| Nb932-bare | 2.0258E-19 | 1.0 | 0 | 16.1 | 1.09716.26 |
| Co592-bare | 1.2528E-20 | 12.0 | 8.36 | 20.27 | 1.20623.68 |
| Mn552-bare | 3.5010E-21 | 16.0 | -12.24 | 20.46 | 0.99926.07 |
| Reaction | Measured Activity | Act. Adj. | Spectrum | ||
|---|---|---|---|---|---|
| Notation | [Bq/at. or | Unc. | Unc. | Unc. | |
| Fiss/at.] | [%] | [%] | [%] | C/E Unc. [%] | |
| Sc45g-bare | 1.6579E-15 | 2.38 | 0.06 | 30.63 | 1.21631.62 |
| Na23g-bare | 3.9324E-15 | 2.38 | 1.7 | 29.74 | 1.24529.90 |
| Fe58g-bare | 1.6831E-16 | 2.90 | -0.1 | 28.23 | 1.20528.68 |
| Cu63g-bare | 5.0078E-14 | 3.69 | -2.61 | 28.17 | 1.16428.52 |
| Co59g-bare | 1.1350E-16 | 2.50 | -0.56 | 26.6 | 1.20526.72 |
| Sc45g-Cd | 1.2948E-16 | 2.38 | -0.65 | 14.74 | 1.05416.43 |
| Au197g-bare | 7.1560E-13 | 2.69 | -0.35 | 22.13 | 1.07822.33 |
| Au197g-Cd | 5.3238E-13 | 2.69 | 0.21 | 28.07 | 1.02628.26 |
| Na23g-Cd | 4.1746E-16 | 2.38 | 0.71 | 10.97 | 1.11411.60 |
| Co59g-Cd | 2.2206E-17 | 2.50 | 0.86 | 11.24 | 1.16911.54 |
| Fe58g-Cd | 2.6925E-17 | 2.90 | 0.89 | 7.34 | 1.072 8.90 |
| Mn55g-Cd | 1.1075E-13 | 2.62 | -1.39 | 7.57 | 1.022 8.32 |
| Cu63g-Cd | 7.5389E-15 | 3.69 | 2.37 | 7.1 | 1.095 8.48 |
| rmleu-Cdtk/B4C | 2.5730E-09 | 2.83 | -6.39 | 1.77 | 0.927 3.35 |
| rmlpu-Cdtk/B4C | 2.5696E-09 | 2.83 | 4.06 | 1.84 | 1.059 4.08 |
| In115n-bare | 7.0790E-15 | 5.95 | -7.32 | 2.57 | 0.921 6.51 |
| rmldu-Cdtk/B4C | 2.1936E-10 | 2.90 | 1.78 | 2.72 | 1.014 4.01 |
| Ti47p-bare | 2.1537E-17 | 4.12 | -2.23 | 2.58 | 0.974 4.71 |
| S32p-bare | 7.7936E-18 | 2.62 | 1.49 | 2.92 | 1.017 5.11 |
| Ni58p-bare | 3.7146E-16 | 3.61 | -0.1 | 2.74 | 1.000 3.87 |
| Zn64p-bare | 1.2772E-18 | 3.36 | -1.68 | 2.94 | 0.985 4.70 |
| Fe54p-bare | 1.4707E-19 | 3.36 | 1.13 | 2.87 | 1.014 4.51 |
| Co59p-Cd | 6.1277E-19 | 2.56 | -0.04 | 3.12 | 1.013 4.98 |
| Ti46p-bare | 5.2239E-21 | 3.69 | 2.57 | 3.23 | 1.051 4.44 |
| Ni60p-Cd | 1.4983E-21 | 8.15 | -3.24 | 3.28 | 0.989 5.04 |
| Cu63a-bare | 4.6190E-17 | 2.69 | -17.86 | 3.22 | 0.839 8.96 |
| Fe56p-bare | 7.1657E-19 | 2.24 | -1.64 | 3.49 | 1.009 4.81 |
| Ti48p-bare | 9.8561E-18 | 2.69 | 0.23 | 3.51 | 1.046 5.11 |
| Mg24p-bare | 4.8547E-18 | 2.97 | 4.87 | 3.92 | 1.098 4.77 |
| Al27a-bare | 1.9054E-19 | 2.33 | -0.28 | 3.8 | 1.044 4.84 |
| Nb932-bare | 3.5325E-21 | 20.3 | 0.26 | 4.23 | 1.005 4.85 |
| Mn552-bare | 1.2657E-20 | 18.2 | -18.09 | 5.4 | 0.76421.04 |
| Co592-Cd | 1.4115E-19 | 3.61 | -0.84 | 5.38 | 0.93719.04 |
| Zr902-bare | 1.1537E-20 | 6.51 | -1.98 | 7.49 | 0.882 8.32 |
| Ni582-Cd | 1.6579E-15 | 2.38 | -0.36 | 8.73 | 0.88510.91 |
| Reaction | Measured Activity | Act. Adj. | Spectrum | ||
|---|---|---|---|---|---|
| Notation | [Bq/at. or | Unc. | Unc. | Unc. | |
| Fiss/at.] | [%] | [%] | [%] | C/E Unc. [%] | |
| Sc45g-bare | 9.8273E-17 | 1.30 | -0.63 | 14.76 | 0.94016.44 |
| Au197g-bare | 3.7488E-13 | 1.70 | -0.05 | 28.43 | 1.06028.62 |
| Na23g-bare | 3.0951E-16 | 1.80 | 1.31 | 11.12 | 1.03911.78 |
| Ag109g-bare | 4.8737E-17 | 0.60 | 0.13 | 17.07 | 1.08818.33 |
| W186g-bare | 1.0211E-13 | 2.10 | -0.02 | 19.55 | 1.01420.09 |
| Co59g-bare | 1.3482E-17 | 1.40 | 1.4 | 11.22 | 1.27411.51 |
| Fe58g-bare | 2.0046E-17 | 1.90 | -0.91 | 7.39 | 0.965 8.88 |
| Mn55g-bare | 7.9671E-14 | 1.60 | -1.38 | 7.58 | 0.968 8.32 |
| Mo98g-bare | 1.4967E-15 | 1.00 | -0.01 | 7.94 | 1.01712.50 |
| Cu63g-bare | 5.3525E-15 | 2.80 | 0.56 | 7.22 | 1.033 8.45 |
| Nb93g-Cd | 6.0332E-22 | 17.50 | 11.49 | 3.17 | 1.16917.96 |
| rmleu-Cdtk/B4C | 1.5452E-09 | 2.20 | 0.8 | 1.74 | 1.047 3.46 |
| Np237f-Cdtk/B4C | 7.9845E-10 | 3.60 | 10.64 | 2.28 | 1.148 4.74 |
| In115n-bare | 5.1109E-15 | 5.60 | -7.17 | 2.56 | 0.954 6.51 |
| Ti47p-bare | 2.3439E-17 | 3.10 | -2.8 | 2.58 | 0.976 4.70 |
| S32p-bare | 1.7162E-17 | 3.60 | 0.59 | 2.93 | 1.004 5.12 |
| Ni58p-bare | 6.1122E-18 | 3.00 | 0.05 | 2.76 | 1.000 4.60 |
| Zn64p-bare | 2.9304E-16 | 2.80 | -1.02 | 2.95 | 0.986 4.58 |
| Fe54p-bare | 1.0366E-18 | 1.70 | -1.01 | 2.88 | 0.985 4.00 |
| Al27p-bare | 2.3141E-15 | 2.20 | -4.11 | 3.17 | 0.951 4.40 |
| Co59p-bare | 1.2296E-19 | 3.10 | -0.19 | 3.1 | 0.993 5.17 |
| Ti46p-bare | 4.9967E-19 | 1.50 | 3.28 | 3.21 | 1.043 4.38 |
| Cu63a-Cd | 1.1497E-21 | 4.40 | -10.22 | 3.19 | 0.894 6.08 |
| Fe56p-bare | 3.8669E-17 | 1.60 | -1.57 | 3.46 | 0.995 4.71 |
| Ti48p-bare | 6.0515E-19 | 1.00 | 0.45 | 3.47 | 1.040 5.02 |
| Mg24p-bare | 8.6405E-18 | 1.90 | 1.55 | 3.88 | 1.053 4.78 |
| Al27a-bare | 4.0228E-18 | 1.80 | 2.65 | 3.77 | 1.062 4.65 |
| Nb932-bare | 1.7793E-19 | 1.90 | -1.88 | 4.19 | 0.986 5.04 |
| Mn552-bare | 2.8166E-21 | 4.50 | -2.34 | 5.46 | 0.990 7.43 |
| Co592-bare | 1.1389E-20 | 18.30 | 3.94 | 5.44 | 1.05419.24 |
| Zr902-bare | 1.2630E-19 | 2.20 | 0.97 | 7.59 | 1.050 8.15 |
| Reaction | Measured Activity | Act. Adj. | Spectrum | ||
|---|---|---|---|---|---|
| Notation | [Bq/at. or | Unc. | Unc. | Unc. | |
| Fiss/at.] | [%] | [%] | [%] | C/E Unc. [%] | |
| Sc45g-bare | 4.6441E-16 | 2.20 | 2.67 | 3.79 | 1.148 4.66 |
| Mn55g-bare | 1.9858E-13 | 1.70 | 0.98 | 28.06 | 0.89428.37 |
| Fe58g-bare | 4.7655E-17 | 2.00 | -1.83 | 21.94 | 0.85422.29 |
| Cu63g-bare | 1.3579E-14 | 2.90 | -0.64 | 28.15 | 0.88628.26 |
| Co59g-bare | 3.1311E-17 | 2.20 | 0.72 | 11.26 | 1.11911.54 |
| Sc45g-Cd | 2.4468E-17 | 2.20 | -4.65 | 3.07 | 0.975 5.32 |
| Au197g-bare | 1.6471E-13 | 3.10 | 0.29 | 29.56 | 0.87229.87 |
| Au197g-Cd | 1.0643E-13 | 1.80 | 0.18 | 6.93 | 1.002 8.25 |
| Na23g-Cd | 7.8216E-17 | 1.80 | -1.2 | 2.88 | 0.980 4.13 |
| Co59g-Cd | 4.1486E-18 | 1.30 | -3.48 | 3.46 | 1.041 5.08 |
| Fe58g-Cd | 5.4352E-18 | 1.90 | 0.6 | 29.64 | 0.86930.07 |
| Mo98g-bare | 5.1417E-16 | 1.00 | -1.22 | 7.22 | 0.955 8.76 |
| Mo98g-Cd | 4.6865E-16 | 1.00 | -0.62 | 2.52 | 0.960 6.49 |
| Cu63g-Cd | 1.4968E-15 | 2.80 | 7.43 | 3.9 | 1.196 5.01 |
| rmle-Cdtk/B4C | 5.7944E-10 | 2.10 | -0.64 | 29.81 | 0.85829.93 |
| rmlpu-Cdtk/B4C | 5.8279E-10 | 2.10 | -4.68 | 5.4 | 0.948 9.83 |
| Np237f- Cdtk/B4C | 3.1382E-10 | 2.10 | 2.3 | 7.66 | 0.92012.31 |
| In115n-bare | 1.6796E-15 | 5.60 | -2.46 | 7.31 | 0.88312.02 |
| rmldu-Cdtk/B4C | 5.8963E-11 | 2.20 | 1.62 | 10.81 | 1.06311.54 |
| Ti47p-bare | 8.0144E-18 | 3.20 | 2.4 | 4.22 | 1.098 5.02 |
| S32p-bare | 6.3767E-18 | 3.60 | 0.87 | 2.76 | 1.000 4.47 |
| Ni58p-bare | 2.0926E-18 | 2.80 | 0.67 | 2.25 | 0.974 3.71 |
| Zn64p-bare | 9.8155E-17 | 4.80 | -3.16 | 2.65 | 0.936 4.02 |
| Fe54p-bare | 3.5797E-19 | 2.00 | -9.91 | 1.74 | 0.864 3.39 |
| Co59p-bare | 4.3896E-20 | 3.40 | 3.95 | 1.83 | 1.026 4.09 |
| Ti46p-bare | 1.7181E-19 | 1.70 | 5.27 | 2.92 | 1.044 5.11 |
| Fe56p-bare | 1.3315E-17 | 2.50 | 0.56 | 31.89 | 0.89932.97 |
| Ti48p-bare | 2.0869E-19 | 1.00 | -0.89 | 14.65 | 0.98516.44 |
| Mg24p-bare | 2.7379E-18 | 2.40 | 2.02 | 3.19 | 1.063 4.43 |
| Al27a-bare | 1.3531E-18 | 1.80 | -1.74 | 2.58 | 0.966 4.76 |
| Nb932-bare | 5.8125E-20 | 1.80 | -0.44 | 3.49 | 1.094 5.00 |
| Mn552-bare | 1.0289E-21 | 7.90 | 2.14 | 2.95 | 1.015 6.01 |
| Zr902-bare | 4.9566E-20 | 3.00 | -1.54 | 7.62 | 0.929 8.44 |
VIII.5 Other “Bucket”-Modifying Environments in Reference Reactor Fields
The least-squares analysis for the SPR-III fast burst reactor central cavity and the pool-type ACRR central cavity reactor were good validation cases for the range of activities that are easily measured in research reactors, as shown in the previous section. The consistency of activity measurements for other reactor spectra produced using spectrum modifying buckets has also been considered in our validation. Tables 41, 42, 43 and 44 present the measured activities and the C/E ratios obtained from the least-squares adjustment. The C/E ratios are color-coded to indicate the status of the consistency.
Inspection of these tables shows that, while providing a larger quantity of validation evidence, the consideration of these other Bucket-Modifying Environments did not significantly increase the scope of reactions for which we have validation evidence over what is seen in the SPR-III Central Cavity and ACRR Central Cavity least-squares analyses. Consideration of the consistency of dosimeters in the least-squares analysis for these other research reactor configurations, addressing the following neutron benchmark fields, produced the following results:
-
1.
ACRR LB44 with 29 sensors, a /dof = 1.279, and 2 discrepant dosimeter/cover configurations (Co59g-bare, Mo98g-Cdtk-B4C);
-
2.
ACRR PLG with 35 sensors, a /dof = 1.025, and 1 discrepant dosimeter/cover configurations (Mn552-bare);
-
3.
ACRR Cd-poly with 31 sensors, a /dof = 1.183, and 1 discrepant dosimeter/cover configuration (Np237f-Cdtkj-B4C);
-
4.
FREC-II with 33 sensors, a /dof = 1.711, and 0 discrepant dosimeter/cover configurations.
There are also several reaction/cover combinations that are newly addressed in these neutron fields, such as:
-
1.
Fe58g-Cdtk-B4C (configuration not used in ACRR-FF or SPR-III)
-
2.
Co59g-Cdtk-B4C (configuration not used in ACRR-FF or SPR-III)
-
3.
Co59g-Cd (which was discrepant in ACRR-FF)
-
4.
Cu63g-bare (Cd cover was good in SPR-III)
-
5.
Ag109g-bare (which was discrepant in ACRR-FF)
-
6.
W186g-Cd
VIII.6 9Be(d,n) Reaction Neutron Fields
| Elem. | Prod. | Measured | Calculated | -Range | |||
|---|---|---|---|---|---|---|---|
| at/at-s | at/at-s | Diff. | MeV | ||||
| [%] | [%] | 5% | 95% | ||||
| Ti | 46Sc | 9.74E-18 | 3 | 1.04E-17 | 6.8 | 5.0 | 13.8 |
| 47Sc | 5.77E-18 | 10 | 5.86E-18 | 1.6 | 3.1 | 17.7 | |
| 48Sc | 8.33E-18 | 10 | 7.90E-18 | -5.2 | 7.1 | 15.2 | |
| Fe | 54Mn | 1.92E-17 | 3 | 1.94E-17 | 0.8 | 3.5 | 12.4 |
| 56Mn | 2.51E-17 | 3 | 2.43E-17 | -3.2 | 6.4 | 14.4 | |
| 51Cr | 1.17E-18 | 10 | 1.12E-18 | -3.9 | 6.3 | 14.9 | |
| Ni | 58Co | 2.77E-16 | 3 | 2.81E-16 | 1.5 | 3.3 | 12.2 |
| 57Ni | 7.90E-19 | 3 | 8.28E-19 | 4.8 | 13.2 | 19.6 | |
| 60Co | 1.40E-17 | 7 | 1.08E-17 | -23. | 6.0 | 14.0 | |
| Zr | 89Zr | 1.36E-17 | 3 | 1.41E-17 | 4.1 | 12.8 | 19.3 |
The IRDFF-II library contains cross sections up to 60 MeV for neutron dosimetry at accelerator-based neutron sources which require measurements for validation in high-energy neutron fields. Above 20 MeV there are many additional reaction channels that must be included to calculate the production of an activation product from elements that contain multiple isotopes. For example, the production of 54Mn from Fe must include 56Fe(n,X)54Mn that contains reactions from other Fe isotopes that create more 54Mn than the traditional 54Fe(n,p)54Mn reaction cross section used below 20 MeV. The impact of this effect on high energy neutron dosimetry was discussed in Ref. INDC(NDS)-0731 . The IAEA Nuclear Data Section addressed this issue in the newly released IRDFF-II library.
| Elem. | Prod. | Measured | Calculated | -Range | |||
| at/at-s | at/at-s | Diff. | MeV | ||||
| [%] | [%] | 5% | 95% | ||||
| Al | 24Na | 3.14e-15 | 3 | 3.06E-15 | -2.5 | 8.9 | 22.0 |
| Ti | 46Sc | 1.42E-15 | 3 | 1.56E-15 | 9.7 | 8.3 | 37.0 |
| 47Sc | 3.02E-15 | 3 | 2.94E-15 | -2.8 | 12.9 | 33.0 | |
| 48Sc | 1.35E-15 | 3 | 1.49E-15 | 10.7 | 9.7 | 28.5 | |
| Fe | 54Mn | 1.68E-15 | 3 | 1.38E-15 | -17.9 | 5.3 | 38.0 |
| 56Mn | 2.80E-15 | 3 | 2.98E-15 | 6.4 | 8.5 | 26.0 | |
| 51Cr | 2.30E-16 | 3 | 1.83E-16 | -20.4 | 9.1 | 39.0 | |
| Ni | 58Co | 1.12E-14 | 3 | 1.09E-14 | -2.2 | 3.8 | 23.0 |
| 57Ni | 1.34E-15 | 10 | 1.46E-15 | 8.7 | 14.8 | 29.5 | |
| 60Co | 1.04E-15 | 10 | 1.07E-15 | 2.5 | 8.1 | 26.0 | |
| Zr | 89Zr | 1.70E-14 | 3 | 1.78E-14 | 4.7 | 14.2 | 28.5 |
New evaluated cross section files for natural Al, Ti, Fe, Ni,and Zr activation to various activation products were especially developed for IRDFF-II. While this file could be processed with the PREPRO codes, the format of the new file was not compatible with processing by the current version of NJOY. While interim steps have been taken to support processing this file with the NJOY code, we expect that NJOY compatibility with a legitimate ENDF-6 format in IRDFF-II will soon be addressed.
The new natural element cross sections and covariances were processed into multi-group cross section libraries used by the STAYSL-PNNL computer code Gre18 . Integral testing was then performed using activation data measured in several 9Be(d,n) neutron fields that have been characterized by neutron time-of-flight (TOF) measurements at deuteron energies of 16 and 40 MeV Gre77 ; Gre78 ; Gre79 . Measurements at MeV and MeV were presented in INDC(NDS)-0731 CRP17 , prior to the creation of the new Fe activation file. The plot of the spectra is shown in Fig. 72.
Eleven of the new natural element activation cross sections were tested in this report using previously published TOF neutron spectra to calculate the activation rates for direct comparison with the measured activation rates. These integral tests are independent of prior work since the new cross sections and covariances were not used in any spectral adjustments of the TOF neutron spectra using STAYSL-PNNL. The calculations were performed using 725-group cross section and covariance libraries. The measured activation rates were updated using the recommended gamma branching ratios listed in Table LABEL:Table_Long_XIV. Integral testing results are presented in Table 45 - Table 46 below. The neutron spectrum for 9Be(d,n) at MeV does not exceed 20 MeV so it is a good check on the lower energy range. The spectra at MeV provides a good test of the cross sections at progressively higher energies up to about 50 MeV. Tables 45 and 46 show generally good agreement between the measured activation rates and the calculated activation rates using the IRDFF-II natural element cross sections within the uncertainties of the neutron time-of-flight spectra as well as the activation rate measurements.
The new cross section and cross section libraries were also tested by performing neutron spectral adjustments with the STAYSL-PNNL computer code using the 725-group cross section and covariance libraries. At 16 MeV, we used 24 reactions for the small spectral adjustment and 25 reactions at 40 MeV. Both the TOF and adjusted spectral activation rate calculations are shown in Fig. 72. In both cases we achieved acceptable values and overall standard deviations less than 10 % attesting to the high quality of the new IRDFF-II file for neutron spectral adjustment up to 50 MeV using the new natural element cross sections.
IX OTHER VALIDATION EVIDENCE
A large volume of additional data exists that supports the validation of the IRDFF-II library, as has been reported at other venues CRP17 . This additional data includes measurements such as:
-
•
JAEA/FNS benchmark testing with Li2O assembly and a DT source;
-
•
ENEA Frascati copper block assembly with 14-MeV neutrons;
-
•
CEA reactor data measured at MINERVE, EOLE, MASURCA, and CALIBAN reactor facilities;
-
•
ASPIS-IRON88 benchmark described in the SINBAD package NEA-1517/75;
-
•
activation experiments at iThemba Laboratory for Accelerator Based Sciences using 90 and 140 MeV quasi-monoenergetic neutron beams;
-
•
Kyoto University Research Reactor 80 and 140 MeV p-Li quasi-monoenergetic neutron beams;
This evidence is not explicitly captured in this paper because the results, typically, exhibited a strong influence from other uncertainty contributors or they did not significantly expand the strength of the validation evidence for the IRDFF-II library.
X VALIDATION STATUS
Secs. VII, VIII, and IX detail the validation evidence that has been assembled to support the IRDFF-II recommended cross sections in integral neutron fields. It is not sufficient for users of the library to just ask if a reaction cross section has been validated, users must also consider if the reaction cross section has been validated within the relevant energy response region addressed by their application. Table LABEL:Table_Long_XXIV summarizes the validation data in a format where users can more readily assess the validation status for a given reaction for a given class of neutron field. Results are presented for selected integral benchmarks that cover the complete range of average spectrum energies. For a more detailed information the reader is referred to Secs. VII, VIII, and IX.
Whereas all of the IRDFF-II metrology reactions have nuclear data evaluations that are based on some experimental data and trends informed by nuclear model calculations, some of the metrology reactions within the library are seen in Table LABEL:Table_Long_XXIV to lack any “additional” validation evidence in integral benchmark neutron fields. Many of the validation deficiencies are for high threshold energy reactions where measurements are not easily acquired in fission neutron fields.
| Entry | Thermal | Resonance | Reactor | Reactor | 235U(n,f) | 252Cf(sf) | Be(d,n) |
|---|---|---|---|---|---|---|---|
| Label | x.s. | Integral | ACRR-CC | SPR-III | PFNS | neutrons | =40 MeV |
| 0.0506 eV | 132.4 keV | 0.575 MeV | 1.251 MeV | 2.000 MeV | 2.121 MeV | 15.58 MeV | |
| Unc. Dif. | Unc. Dif. | C/E | C/E | C/E | C/E | Unc. Dif. | |
| LiH3 | |||||||
| LiHe4 | 1.074 6.02% | ||||||
| Li6H3 | |||||||
| Li6t | |||||||
| Li6He4 | |||||||
| Li7H3 | |||||||
| Li7He4 | |||||||
| BH3 13 | 0.931 11.58% | ||||||
| BHe4 | |||||||
| B10H3 | |||||||
| B10a | 0.848 9.72% | ||||||
| B10He4 | |||||||
| B11H3 | |||||||
| B11He4 | |||||||
| F192 | 1.023 6.12% | 1.007 5.66% | |||||
| Na232 | 1.054 4.89% | 0.990 7.63% | |||||
| Na23g | 1.6% 4.4% | 4.5% 0.4% | 1.045 11.08% | 1.178 11.94% | |||
| MgNa24 | 1.041 4.98% | 1.122 15.71% | 0.999 3.08% | 1.050 2.92% | |||
| Mg24p | 1.041 4.98% | 1.122 15.71% | 0.999 3.08% | 1.050 2.92% | |||
| Al27p | 1.138 12.45% | 0.968 2.96% | 0.950 2.51% | ||||
| Al27a | 1.018 4.89% | 1.075 14.90% | 1.009 3.00% | 1.003 2.07% | |||
| Al27Na24 | 1.018 4.89% | 1.075 14.90% | 1.009 3.00% | 3% -2.5% | |||
| Al272g | 0.902 13.72% | ||||||
| SiAl28 | |||||||
| Si28p | 0.993 4.16% | 1.031 2.67% | |||||
| Si29p | |||||||
| P31p | 0.997 3.62% | ||||||
| SP32 | 0.988 5.12% | 0.990 11.50% | 0.995 3.04% | 1.023 3.65% | |||
| S32p | 0.988 5.12% | 0.990 11.50% | 0.995 3.04% | 1.023 3.65% | |||
| Sc45g | 6.9% 3.6% | 7.6% 0.2% | 1.082 16.09% | 1.051 8.57% | |||
| TiTi45 | |||||||
| TiSc46 | 1.054 12.96% | 0.993 3.45% | 0.974 2.63% | 3% 9.7% | |||
| TiSc47 | 1.024 3.19% | 1.015 2.16% | 3% -2.8% | ||||
| TiSc48 | 1.001 4.15% | 1.005 3.53% | 3% 10.7% | ||||
| Ti462 | |||||||
| Ti46p | 1.021 4.74% | 1.054 12.96% | 0.993 3.45% | ||||
| Ti47p | 0.971 4.71% | 1.102 10.22% | 1.024 3.19% | 1.015 2.16% | |||
| Ti48p | 1.048 5.20% | 1.105 14.22% | 1.001 4.15% | ||||
| V51a | 1.008 4.12% | 0.989 3.23% | |||||
| V51Sc48 | |||||||
| CrCr51 | |||||||
| Mn552 | 1.009 15.90% | 1.057 16.61% | 0.958 15.63% | ||||
| Mn55g | 1.1% 0.5% | 3.8% -4.7% | 1.040 8.45% | 1.082 8.69% | |||
| FeCr51 | 0.969 5.60% | 3% -20.4% | |||||
| FeMn54 | 0.959 4.23% | 3% -17.9% | |||||
| FeMn56 | 0.992 4.81% | 3% 6.4% | |||||
| FeMn53 | |||||||
| Fe542 | |||||||
| Fe54p | 0.959 4.23% | 1.049 11.40% | 1.034 2.78% | 1.015 1.79% | |||
| Fe54a | 0.969 5.60% | ||||||
| Fe56p | 0.992 4.81% | 1.076 14.43% | 0.998 2.91% | ||||
| Fe58g | 5.1% 1.5% | 4.8% 1.3% | 1.020 8.80% | 1.105 12.04% | |||
| Co592 | 1.087 16.60% | 1.069 6.05% | 1.006 4.27% | ||||
| Co593 | |||||||
| Co59g | 0.7% -2.0% | 0.8% -0.8% | 1.305 12.53% | ||||
| Co59p | 1.032 7.16% | 0.983 13.04% | 1.017 3.72% | 1.015 3.16% | |||
| Co59a | 1.001 4.50% | 1.000 3.39% | |||||
| Co59Mn56 | 1.001 4.50% | 1.000 3.39% | |||||
| NiNi57 | 1.014 16.69% | 1.015 5.00% | 0.997 7.07% | ||||
| NiCo58 | 1.000 2.62% | 1.000 1.66% | 3% -2.2% | ||||
| NiCo60 | 1.025 6.62% | 0.994 5.43% | 10% 2.5% | ||||
| Ni582 | 1.014 16.69% | 1.015 5.00% | 0.997 7.07% | 10% 8.7% | |||
| Ni58p | 1.000 4.53% | 1.000 10.96% | 1.000 2.62% | 1.000 1.66% | |||
| Ni60p | 1.025 6.62% | 0.994 5.43% | 1.027 5.03% | ||||
| CuCo60 | 0.966 13.97% | 1.022 4.11% | 1.010 8.64% | ||||
| CuCu62 | 0.828 7.95% | ||||||
| CuCu64 | 1.041 11.99% | 0.993 3.70% | |||||
| Cu632 | 0.828 7.95% | 1.032 5.74% | |||||
| Cu63g | 4.1% -3.3% | 4.2% -7.3% | 1.041 11.99% | 1.019 24.61% | 1.010 8.64% | ||
| Cu63a | 0.966 13.97% | 1.022 4.11% | 1.006 2.93% | ||||
| Cu652 | 0.993 3.70% | ||||||
| ZnCu64 | 0.959 4.77% | 1.008 7.59% | 1.009 3.31% | ||||
| ZnCu67 | 1.014 6.64% | ||||||
| Zn64p | 0.959 4.77% | 1.077 11.42% | 1.008 7.59% | ||||
| Zn67p | 1.014 6.64% | ||||||
| Zn68Cu67 | |||||||
| As752 | 1.040 6.88% | ||||||
| Y892 | 1.039 5.98% | 0.984 5.64% | |||||
| ZrZr89 | 3% 4.7% | ||||||
| Zr902 | 0.909 9.23% | 1.142 15.55% | 0.981 5.77% | ||||
| Nb932m | 0.930 5.10% | 1.065 4.75% | 1.000 4.95% | ||||
| Nb93nm | 1.113 17.14% | 0.983 5.38% | 1.010 3.73% | ||||
| Nb93g | 4.0% 1.1% | 3.4% 3.2% | |||||
| Nb93gm | 4.0% 0.9% | 3.4% 3.1% | |||||
| MoNb92m | |||||||
| Mo92pm | 1.011 4.07% | ||||||
| Rh103nm | 1.017 4.22% | ||||||
| Ag109g | 5.1% 7.7% | 7.0% 4.8% | 1.160 17.98% | ||||
| InIn114m | 4.6% -6.9% | 8.7% 6.3% | |||||
| In113gm | 4.6% -6.9% | 8.7% 6.3% | |||||
| In113nm | 0.933 5.57% | 0.978 2.15% | |||||
| In1152m | |||||||
| In115nm | 1.068 10.20% | 1.006 2.52% | 0.964 1.57% | ||||
| In115gm | 1.0% 1.5% | 3.1% -4.0% | 1.052 4.83% | 0.979 2.45% | |||
| I1272 | 1.016 5.36% | 1.018 3.87% | |||||
| La139g | 3.9% -2.7% | 5.5% 3.5% | |||||
| Pr1412 | |||||||
| Tm1692 | 1.036 5.55% | 0.986 4.74% | |||||
| Tm1593 | 0.795 16.24% | ||||||
| Ta181g | 3.0% 1.6% | 3.8% -2.7% | 0.935 5.65% | ||||
| W186g | 5.0% 9.9% | 4.5% 1.8% | 1.012 16.93% | 0.818 10.41% | |||
| Au1972 | 1.001 3.96% | 1.005 2.85% | |||||
| Au197g | 0.5% 0.0% | 2.1% -0.5% | 1.042 28.04% | 0.929 7.28% | 0.889 4.58% | 0.991 1.79% | |
| Hg199nm | 1.027 5.84% | 0.985 2.22% | |||||
| Pb204nm | 0.909 6.87% | 0.971 2.74% | |||||
| Bi2092 | |||||||
| Bi2093 | |||||||
| Bi2094 | |||||||
| Bi2095 | |||||||
| Bi2096 | |||||||
| Th232f | 0.918 3.83% | 0.935 5.08% | |||||
| Th232g | 5.4% 0.0% | 10% -0.3% | 1.032 5.53% | ||||
| U235f | 1.089 6.27% | 1.034 2.35% | 1.013 1.21% | ||||
| U2382 | 0.936 5.63% | 1.045 11.23% | |||||
| U238f | 1.036 10.36% | 1.007 2.40% | 0.978 1.70% | ||||
| U238g | 1.0% 0.5% | 1.1% -0.4% | 0.825 9.66% | ||||
| Np237f | 1.003 4.67% | 1.103 7.57% | 1.022 2.79% | 1.000 1.69% | |||
| Pu239f | 1.165 6.29% | 1.007 2.65% | 0.992 1.38% | ||||
| Am241f |
XI LIBRARY DISTRIBUTIONS
The development of the IRDFF-II library was the result of an international collaboration, organized through a series of Research Projects at the International Atomic Energy Agency Nuclear Data Section (NDS). The library can be obtained from www-nds.iaea.org/IRDFF/. It has been incorporated into the IAEA nuclear data viewers, www-nds.iaea.org/exfor/endf.htm. Using that online system, comparisons can be readily made between different nuclear data libraries, measured data available in EXFOR EXF08 , and the IRDFF-II recommended cross section with uncertainties.
XII CONCLUSIONS
This paper reports on the assembly of a new neutron metrology library - the IRDFF-II - that represents the recommendations of an international collaboration and supports neutron metrology application in fission and fusion neutron fields. The elements of the IRDFF-II library are described and the basis for the recommended nuclear data values is provided. The IRDFF-II library, which now extends up to incident neutron energies of 60 MeV, contains a comprehensive, complete and consistent set of nuclear data that can be used for the characterization of neutron radiation fields and to support the neutron metrology used with experiments conducted in these neutron fields. In addition to providing the recommended nuclear data, this document summarizes the set of validation evidence gathered from integral neutron benchmark fields that confirms the consistency of the recommended nuclear data.
Acknowledgements
Our sincere thanks to all colleagues who have contributed to and worked on this project during the last thirteen years since the release of the IRDF-2002 library. The preparation of this paper would not have been possible without the support, hard work and endless efforts of a large number of individuals and institutions.
The authors would also like to acknowledge the significant contributions by V. Chechev, V. G. Khlopin Radium Institute, St. Petersburg, Russia, in the area of the nuclear decay data that have been incorporated into the IRDFF-II library. V. Chechev, who collaborated closely with the IAEA Nuclear Data Section and the Decay Data Evaluation Project (DDEP), passed away on March 5, 2018.
The IAEA is grateful to all participating laboratories for their assistance in the work and for support of the research meetings and activities. The work described in this paper would not have been possible without IAEA Member State contributions. Work at SNL was supported by the U.S. Department of Energy’s National Nuclear Security Administration under contract DE-NA0003525.
We acknowledge many fruitful exchanges of information with our colleagues A.J. Koning, D. Rochman and J.-C. Sublet on details of TENDL libraries. Without their efforts in producing TENDL we could not achieve a successful extension of the IRDFF up to 60 MeV.
The IAEA staff acknowledges the very valuable contribution to the preparation of this paper made by our colleague V. Zerkin by customizing and improving his online plotting package, and uploading the preliminary -version of the IRDFF-II to the servers allowing for a comprehensive visual checking of the evaluated cross sections.
The IAEA appreciate the valuable contributions made by A.J. Plompen, P.F. Mastinu, I. Kodeli, R. Nchodu, M. Stefanik, F. Wissmann, P. Maleka, N.B. Ndlovu and N. Kornilov during the various project meetings.
Last but not least we are deeply indebted to W. Mannhart, who passed away on November 11, 2018. Mannhart contributions to many aspects of the field of neutron metrology over a period of several decades were very significant and are acknowledged as a source of inspiration.
References
- (1) International Reactor Dosimetry File 2002 (IRDF-2002), Technical Report Series 452, IAEA, (2006); numerical data: https://www-nds.iaea.org/irdf2002/.
- (2) R. Capote, K.I. Zolotarev, V.G. Pronyaev and A. Trkov, “Updating and Extending the IRDF-2002 Dosimetry Library”, J. ASTM Int. ,9, 1 (2012).
- (3) D. Smith, Probability, Statistics, and Data Uncertainties in Nuclear Science and Technology, American Nuclear Society, LaGrange Park, Illinois (1991).
- (4) R. Capote, D.L. Smith and A. Trkov, “Nuclear data evaluation methodology including estimates of covariances”, EPJ Web Conf. 8, 04001 (2010).
- (5) D.L. Smith and N. Otuka, Nucl. Data Sheets 113, 3006-–3053 (2012).
- (6) E. Bauge, R. Capote, U. Fisher et al., “Covariance Data in the Fast Neutron Region”. Final report of the NEA/WPEC-24, Coord. M. Herman, Report NEA/NSC/WPEC/DOC(2010)427 (Nuclear Energy Agency, OECD, Paris, 2011).
- (7) W. P. Poenitz, “Evaluation Methods for Neutron Cross Section Standards”, in Proc. Conf. Nucl. Data Evaluation Methods and Procedures, BNL report BNL-NCS-51363, Vol.1, p. 249 (1981). Codes and documentation available online at https://www-nds.iaea.org/standards/codes.html.
- (8) D.L. Smith, “A Least-Squares Computational ”Tool Kit””, Report ANL/NDM-128, Argonne National Laboratory, IL, USA (1993).
- (9) D.M. Hetrick and C.Y. Fu, “GLUCS: A generalized least-squares program for updating cross section evaluations with correlated data sets,” Oak Ridge National Laboratory, TN, USA (1980).
- (10) T. Kawano and K. Shibata, “KALMAN,” Report JAERI-Data/Code 97-037, JAERI, Tokai, Japan (1997).
- (11) D.W. Muir, “Global Assessment of Nuclear Data Requirements (GANDR project),” IAEA report (6 volumes), Vienna, Austria (2007). Available online at https://www-nds.iaea.org/gandr/docs.html.
- (12) V.N. Vinogradov, E.V. Gai and N.S. Rabotnov, “Analytical Approximation of Data in Nuclear and Neutron Physics,” Energoatomizdat, Moscow (1987); in Russian.
- (13) S.A. Badikov, E.V. Gai, M.A. Guseynov and N.S. Rabotnov, “Nuclear data processing, evaluation, transformation and storage with Padé-approximants,”Proc. Int. Conf. Nuclear Data for Science and Technology, Jülich, Germany, 1991, ed: S.M. Qaim, 182–187 (1992) Springer-Verlag, Berlin.
- (14) A. Hermanne, A.V. Ignatyuk, R. Capote et al. “Reference cross sections for charged-particle monitor reactions,” Nucl. Data Sheets 148, 338–382 (2018).
- (15) H.E. Padé, “Sur la Représentation Approchée d’ une Fonction par des Fractions Rationnelles,” Supplement to Ann. Sci. l’École Norm. Sup., Series 3, Vol. 9, 3–93 (1892).
- (16) P.R. Graves-Morris (Ed.), “Padé Approximants and their Applications,” Academic Press, New York (1973).
- (17) G.A. Baker Jr., “Essentials of Padé Approximants,” Academic Press, New York (1975).
- (18) E. Bauge and P. Dossantos-Uzarralde, “Evaluation of the covariance matrix of Pu-239 neutronic cross sections in the continuum using a Backward-Forward Monte Carlo method,” J. Kor. Phys. Soc. 59, 1218 (2011).
- (19) R. Capote, D.L. Smith, A. Trkov, M. Meghzifene, “A New Formulation of the Unified Monte Carlo Approach (UMC-B) and Cross-Section Evaluation for the Dosimetry Reaction 55Mn(,)56Mn,” J. ASTM Int. 9, 104115 (2012).
- (20) D.L. Smith, “A Unified Monte Carlo Approach to Fast Neutron Cross Section Data Evaluation,” in Proc. 8th Int. Topical Meeting on Nucl. Appl. and Utilization of Accelerators, Pocatello, ID, USA, 29 July 29–2 August, p. 736 (2007).
- (21) R. Capote and D.L. Smith, “An Investigation of the Performance of the Unified Monte Carlo Method of Neutron Cross Section Data Evaluation,”Nucl. Data Sheets 109, 2768 (2008).
- (22) A.J. Koning, “Bayesian Monte Carlo method for nuclear data evaluation,” Eur. Phys. J. A51, 184 (2015).
- (23) S. Goriely and R. Capote, “Uncertainties of mass extrapolations in Hartree-Fock-Bogoliubov mass models,” Phys. Rev. C89, 054318 (2014).
- (24) A. J. Koning, D. Rochman, J.-Ch. Sublet, N. Dzysiuk, M. Fleming, and S. van der Marck, “TENDLE722: Complete Nuclear Data Library for Innovative Nuclear Science and Technology,” Nucl. Data Sheets 155, 1-–55 (2019).
- (25) A.J. Koning, D. Rochman, J. Kopecky, J. Ch. Sublet, E. Bauge, S. Hilaire, P. Romain, B. Morillon, H. Duarte, S. van der Marck, S. Pomp, H. Sjostrand, R. Forrest, H. Henriksson, O. Cabellos, S. Goriely J. Leppanen, H. Leeb, A. Plompen and R. Mills, “TENDL-2015: TALYS-based evaluated nuclear data library,”. Available online at https://tendl.web.psi.ch/tendl_2015/tendl2015.html.
- (26) J. Knaster, F. Arbeiter, P. Cara, S. Chel, A. Facco, R. Heidinger, A. Ibarra, A. Kasugai, H. Kondo, G. Micciche, K. Ochiai, S. O’hira, Y. Okumura, K. Sakamoto, E. Wakai, ”IFMIF, the European–Japanese effort s under the Broader Approach agreement towards a Li(d,xn) neutron source: Current status and future options”, Nucl. Mat. and Energy 9, 46–-54 (2016).
- (27) L.R. Greenwood, M. Kostal, S.P. Simakov, A. Trkov, “Summary Report of the Third Research Coordination Meeting on Testing and Improving the International Reactor Dosimetry and Fusion File (IRDFF)”, March 20–24, report INDC-NDS-0731, IAEA, Vienna, Austria (2017).
- (28) J-C. Sublet, L. Packer, J. Kopecky, R.A. Forrest, “Recent Progress in Neutron-, Proton- and Deuteron Induced Reaction Nuclear Data for EAF-2010 and the European Activation System,” in Proc. Int. Conf. on Nucl. Data for Science and Technology (ND2010), Jeju Island, Korea
- (29) K. Shibata et al., “JENDL-4.0: A New Library for Nuclear Science and Engineering,” J. Nucl. Sci. Techn. 48, 1–30 (2011).
- (30) D. Brown, et al., “ENDF/B-VIII.0: The Major Release of the Nuclear Reaction Data Library with CIELO-project Cross Sections, New Standards and Thermal Scattering Data” Nucl. Data Sheets 148, 1–142 (2018).
- (31) JEFF Scientific Working Group, “Joint Evaluated Fission and Fusion File (JEFF) release 3.3,”OECD, NEA (2018).
- (32) A.D. Carlson, V.G. Pronyaev, R. Capote et al., “Evaluation of the Neutron Data Standards,” Nucl. Data Sheets 148, 143 (2018)
- (33) M.B. Chadwick, M.W. Herman, P. Obložinský et al., “ENDF/B-VII.1 nuclear data for science and technology: cross sections, covariances, fission product yields and decay data,” Nucl. Data Sheets 112, 2887–2996 (2011).
- (34) A. Trkov, R. Capote, E. Sh. Soukhovitskii, L. C. Leal, M. Sin, I. Kodeli, D. W. Muir, “Covariances of Evaluated Nuclear Cross Section Data for 232Th, 180,182,183,184,186W and 55Mn,”Nucl. Data Sheets 112, 3098–3119 (2011).
- (35) A. Koning et al., “The JEFF-3.1 Nuclear Data Library”, JEFF Report 21, OECD 2006, NEA No. 6190.
- (36) A. Trkov, R. Capote, I. Kodeli, L. Leal, “Evaluation of tungsten nuclear reaction data with covariances,”Nucl. Data Sheets 109, 2905–2909 (2008).
- (37) R. Capote, L. Leal, Liu Ping et al., “Evaluated nuclear data for nuclides within the thorium-uranium fuel cycle,” Technical report STI/PUB/1435 (Vienna, International Atomic Energy Agency, 2010), ISBN 978–92–0–101010–0.
- (38) I. Sirakov, R. Capote, F. Gunsing, P. Schillebeeckx, and A. Trkov, “An ENDF-6 compatible evaluation for neutron induced reactions of 232Th in the unresolved resonance region,” Ann. Nucl. En. 35, 1223–1231 (2008).
- (39) M. B. Chadwick, E. Dupont, E. Bauge et al., “The CIELO Collaboration: Neutron Reactions on 1H, 16O, 56Fe, 235,238U, and 239Pu,” Nucl. Data Sheets 118, 1–25 (2014).
- (40) M. B. Chadwick, R. Capote, A. Trkov, et al., “CIELO collaboration summary results: International evaluations of neutron reactions on uranium, plutonium, iron, oxygen and hydrogen,” Nucl. Data Sheets 148, 189–213 (2018).
- (41) R. Capote, A. Trkov, et al., “IAEA CIELO evaluation of neutron-induced reactions on 235U and 238U targets for incident energies up to 30 MeV,” Nucl. Data Sheets 148, 254–292 (2018).
- (42) ASTM E722-14, “Standard Practice for Characterizing Neutron Fluence Spectra in Terms of an Equivalent Monoenergetic Neutron Fluence for Radiation-Hardness Testing of Electronics,” ASTM International, West Conshohocken, PA, 2014.
- (43) ASTM E693-17, “Standard Practice for Characterizing Neutron Exposures in Iron and Low Alloy Steels in Terms of Displacement Per Atom (DPA),”ASTM International, West Conshohocken, PA, 2017.
- (44) W. N. McElroy, S. Berg, T. Crockett, and R. Hawkins, “A Computer-Automated iterative Method for Neutron Flux Spectral Determination by Foil Activation,” AFWL-TR-67-41, Vol. 1, Air Force Weapons Laboratory, Kirtland AFB, New Mexico, July 1967.
- (45) F.W. Stallmann, “LSL-M2: A Computer Program for Least-Squares Logarithmic Adjustment of Neutron Spectra,” NUREG/CR-4349, ORNL/TM-9933, March 1985.
- (46) P.J. Griffin, “A rigorous treatment of self-shielding and covers in neutron spectra determinations,” IEEE TNS 42, 1878–1885 (1999).
- (47) M.J. Norgett. M.T. Robinson, I.M. Torrens, “A Proposed Method of Calculating Displacement Dose Rates,” Nucl. Eng. Des. , Vol. 33, pp. 50–54, 1975.
- (48) ASTM E1855-15, “Standard Test Method for Use of 2N2222A Silicon Bipolar Transistors as Neutron Spectrum Sensors and Displacement Damage Monitors,” ASTM International, West Conshohocken, PA, 2015.
- (49) Decay Data Evaluation Project. Data available online at www.nucleide.org/DDEP.htm.
- (50) Evaluated Nuclear Structure Data File (ENSDF). Available online at www.nndc.bnl.gov/ensdf/. Developed and maintained by the International Network Of Nuclear Structure and Decay Data Evaluators (NSDD) (see www-nds.iaea.org/nsdd/).
- (51) LiveChart of Nuclides, IAEA decay data retrieval code available online at www-nds.iaea.org/medical/monitor_reactions.html.
- (52) NuDat, Brookhaven National Laboratory, USA. Decay data retrieval code available online at www.nndc.bnl.gov/nudat2/.
- (53) Atomic weights of the elements 2017. Available online at www.ciaaw.org.
- (54) M. Wang, G. Audi, F.G. Kondev, W.J. Huang, S. Naimi, X. Xu, “The AME2016 Atomic Mass Evaluation, (II) Tables, Graphs, and References”, Chin. Phys. C41, Number 3 (2017); https://www-nds.iaea.org/amdc/.
- (55) J. Meija, T.B. Coplen, M. Berglund, W. A. Brand, P. De Bièvre, M. Gröning, N. E. Holden, J. Irrgeher, R. D. Loss, Thomas Walczyk, T. Prohaska, “Isotopic compositions of the elements 2013 ” (IUPAC Technical Report), Pure Appl. Chem. 88, 293–306 (2016). Published Online 2016-02-20 |; https://doi.org/10.1515/pac-2015-0503.
- (56) ASTM E704-13, “Standard Test Method for Measuring Reaction Rates by Radioactivation of Uranium-238,” ASTM International, West Conshohocken, PA, 2013.
- (57) ASTM E1005-16, “Standard Test method for Application and Analysis of Radiometric Monitors for Reactor Vessel Surveillance,” ASTM International, West Conshohocken, PA, 2016.
- (58) National Research Council 2005. “Monitoring Nuclear Weapons and Nuclear-Explosive Materials: An Assessment of Methods and Capabilities ” (2005), Committee on International Security and Arms Control, National Academy of Sciences, The National Academies Press, Washington D.C., DOI 10.17226/11265. Available at: http://nap.edu/11265.
- (59) A.L. Nichols, D.L. Aldama, M. Verpelli, “Handbook of Nuclear Data for Safeguards,” , report INDC(NDS)-0502, International Atomic Energy Agency, Vienna, Austria (2007).
- (60) A. Trkov, M. Herman and D. A. Brown (Eds.), “ENDF-6 Formats Manual,” CSEWG Document ENDF-102, Report BNL-203218-2018-INRE, Brookhaven National Laboratory, Upton, NY 11973-5000 (2018).
- (61) “Nuclear Data Processing System NJOY21 and NJOY2016,” Los Alamos National Laboratory, https://github.com/njoy.
- (62) PREPRO
- (63) “MCNP–A General Monte Carlo Code for Neutron and Photon Transport, Version 3A”, J. Briesmeister (Editor), report LA-7396-M, Los Alamos National Laboratory, Los Alamos, NM (1986).
- (64) SERPENT
- (65) C. Dunford, “ENDF Utility Codes,” Brookhaven National Laboratory, Upton, NY 11973-5000.
- (66) COVEIG
- (67) A. Trkov, “Guidelines for Nuclear Data Verification and Validation,” INDC(SEC)-0107, International Atomic Energy Agency, Vienna, Austria (2005). Available online at https://www-nds.iaea.org/publications/indc/indc-sec-0107/.
- (68) M.A. Kellett, O Bersillon, RW Mills; JEFF report 20 (2009).
- (69) “The Kayzero database,” http://www.kayzero.com/k0naa/k0naaorg/Nuclear_Data_SC/Nuclear_Data_SC.html.
- (70) A. Trkov, V. Radulovič, “Nuclear reactions and physical models for neutron activation analysis,” J. Radioan. Nucl. Chem. 304, 763-–778, (2015)
- (71) S. F. Mughabghab, “Atlas of Neutron Resonances: Resonance Parameters and Thermal Cross Sections Z=1–100,” 6th Edition, Elsevier, Amsterdam The Netherlands (2016).
- (72) N. Otuka, E. Dupont, V. Semkova, B. Pritychenko et al., “Towards a More Complete and Accurate Experimental Nuclear Reaction Data Library (EXFOR): International Collaboration Between Nuclear Reaction Data Centres (NRDC),” Nucl. Data Sheets 120, 272–276 (2014). Data available online (e.g., at www-nds.iaea.org/exfor/).
- (73) W.Mannhart, “Recent Experiments on 252Cf(sf) Spectrum-Averaged Neutron Cross Sections,” Proc. 5th ASTM-EURATOM Symp. on Reactor Dosimetry, 1984, Geesthacht, Germany, Vol. 2, D. Reidel, Dordrecht, The Netherlands, 1985, p. 801–812.
- (74) O. Horibe et al., Proc. of Conf. 50 Years with Nuclear Fission, Washington D.C., 25–28 April 1989, v.2, p.923.
- (75) W. Mannhart, Prog. Report INDC(GER)-045, pp.40–43, June 1999.
- (76) W. Mannhart, “Handbook on Nuclear Activation Cross Sections”, IAEA Technical Report Ser. No.273, p.413 (1987).
- (77) W. Mannhart, “Validation of Differential Cross Sections with Integral Data”, IAEA Techn. Meet. on “International Reactor Dosimetry File: IRDF-2002”, Vienna, 27–29 Aug 2002, Report INDC(NDS)-0435, p.59 (2002).
- (78) ASTM E264, “Standard Test Method for Measuring Fast-Neutron Reaction Rates by Radioactivation of Nickel”, ASTM International , West Conshohocken, PA, 2019.
- (79) K.I. Zolotarev, “Re-evaluation of microscopic and integral cross section data for important dosimetry reactions”, Report INDC(NDS)-0526, IAEA, Vienna, Austria (2004).
- (80) ASTM E265-15, “Standard Test Method for Measuring Reaction Rates and Fast-Neutron Fluences by Radioactivation of Sulfur-32,” ASTM International, West Conshohocken, PA, 2013.
- (81) K.I. Zolotarev and P.K. Zolotarev, “Evaluation of some (n,n’), (n,), (n,p), (n,2n) and (n,3n) reaction excitation functions for fission and fusion reactor dosimetry applications,” Report INDC(NDS)-0657, IAEA, Vienna, Austria (2013).
- (82) M.C. Moxon, “Evaluation of the resonance region for 58Fe,” International Atomic Energy Agency, Vienna, INDC(UK)-089, 2004.
- (83) K.I. Zolotarev, “Evaluation of cross section data from threshold to 40-60 MeV for specific neutron reactions important for neutron dosimetry applications. Part I.,” Report INDC(NDS)-0546, IAEA, Vienna, Austria (2009).
- (84) K.I. Zolotarev, “Evaluation of 23Na(n,)24Na, 23Na(n,2n)22Na and 27Al(n,2n)26Al reaction cross sections for the IRDFF library”, Report INDC(NDS)-0705, IAEA, Vienna, Austria (2017).
- (85) E. Simeckova and M. Majerle, private communication, 2019.
- (86) K.I. Zolotarev, “Evaluation and improvement of cross section accuracy for most important dosimetry reactions for 27Al(n,p), 56Fe(n,p) and 237Np(n,f) including covariance data”, Report INDC(CCP)-0438, IAEA, Vienna, Austria (2004).
- (87) K.I. Zolotarev, “Evaluation of cross section data from threshold to 40-60 MeV for specific neutron reactions important for neutron dosimetry applications. Part II.”, Report INDC(NDS)-0584, IAEA, Vienna, Austria (2010).
- (88) P. Schillebeeckx et al., “Evaluation of Neutron Resonance Cross Section Data at GELINA,” Nucl. Data Sheets 119, 94–97 (2014), DOI: 10.1016/j.nds.2014.08.027
- (89) D.W. Kneff, B.M. Oliver, H. Farrar IV, L.R. Greenwood, “Helium production in pure elements, isotopes, and alloy steels by 14.8-MeV neutrons,” Nucl. Sc. & Eng. 92, 491 (1986).
- (90) Neutron Cross Sections for Reactor Dosimetry, International Atomic Energy Agency, Laboratory Activities, Vienna, Vol 1, 1978, p. 62 and M. Vlasov, IAEA Program on Benchmark Neutron Fields Applications for Reactor Dosimetry, Report INDC(SEC)-54/L+Dos, IAEA, Vienna, Austria (1976).
- (91) W. Mannhart, “Status of the Cf-252 Fission Neutron Spectrum Evaluation with Regard to Recent Experiments,” IAEA Consult. Meet. on “Physics of Neutron Emission in Fission”, Mito, Japan, 24–27 May 1988, Report INDC(NDS)-0220, pp. 305–336, IAEA, Vienna, Austria (1989).
- (92) ASTM E170-17, “Standard Terminology Relating to Radiation Measurements and Dosimetry,” ASTM International, West Conshohocken, PA, 2017.
- (93) W. Mannhart, “Evaluation of the Cf-252 Fission Neutron Spectrum between 0 MeV and 20 MeV,” in Properties of Neutron Sources, Report IAEA-TECDOC-410, pp. 158–171, IAEA, Vienna, Austria (1987).
- (94) N.V. Kornilov, “Verification of the 252Cf standard in the energy range 2 - 20 MeV,” , Report INDC(USA)-108, IAEA, Vienna, Austria (2015); EXFOR 14431.
- (95) E. Blain, A. Daskalakis, R. C. Block and Y. Danon, “Measurement of prompt fission neutron spectrum for spontaneous fission of 252Cf using multiplicity tagging,” Phys. Rev. C95, 064615 (2017); EXFOR 14477.
- (96) Nuclear Energy Agency, Collaborative International Evaluated Library Organization (CIELO) Pilot Project, WPEC Subgroup 40 (SG40), https://www.oecd-nea.org/science/wpec/sg40-cielo/.
- (97) R. Capote and A. Trkov (coordinators), “IAEA CIELO Data Development Project,”within the International Pilot Project of the OECD/NEA (see https://www-nds.iaea.org/CIELO/).
- (98) A. Trkov, R. Capote, “Evaluation of the Prompt Fission Neutron Spectrum of Thermal-neutron Induced Fission in U-235,” Phys. Proc. 64, 48–54 (2015).
- (99) R. Capote, A. Trkov, V.G. Pronyaev, “Current Issues in Nuclear Data Evaluation Methodology: 235U Prompt Fission Neutron Spectra and Multiplicity for Thermal Neutrons,”Nucl. Data Sheets 123, 8–15 (2015).
- (100) R. Capote, Y.-J. Chen, F.-J. Hambsch, N. V. Kornilov, J. P. Lestone, O. Litaize, B. Morillon, D. Neudecker, S. Oberstedt, T. Ohsawa, N. Otuka, V. G. Pronyaev, A. Saxena, O. Serot, O. A. Shcherbakov, N.-C. Shu, D. L. Smith, P. Talou, A. Trkov, A. C. Tudora, R. Vogt, A. C. Vorobyev, “Prompt fission neutron spectra of actinides,”Nucl. Data Sheets 131, 1–106 (2016).
- (101) L.R. Greenwood, R.R. Heinrich, R.J. Kennerley, and R. Medrzychowski, “Development and Testing of Neutron Dosimetry Techniques for Accelerator-Based Neutron Irradiation Facilities,” Nucl. Technol. 41, 109 (1978) https://doi.org/10.13182/NT78-A32137.
- (102) M.J. Saltmarsh, C.A. Ludemann, C.B. Fulmer, R.C. Styles, “Characteristics of an Intense Neutron Source Based on the d+Be reaction,” Nucl. Instr. Meth. 143, 81–90 (1977).
- (103) P.J. Griffin, K.R. DePriest, D.W. Vehar, E.J. Parma, Neutron Reference Benchmark Field Specification: SPR-III Central Cavity, Sandia National Laboratories, report SAND2015-4719O, Albuquerque, NM, 2015.
- (104) J. G. Williams, D. W. Vehar, P. J. Griffin, D. B. King, “Covariance Matrices for Calculated Neutron Spectra and Measured Dosimeter Response,” REACTOR DOSIMETRY STATE OF THE ART 2008. Proc. 13th Int. Symp. Held 25-30 May 2008 in Akersloot, The Netherlands. Edited by Wim Voorbraak (Institute for Energy, The Netherlands), Luigi Debarberis (Institute for Energy, The Netherlands), Pierre D’hondt (SCK-CEN, Belgium) & Jan Wagemans (SCK-CEN, Belgium). World Scientific Publishing Co. Pte. Ltd. (2009). ISBN 9789814271110, pp. 343–351.
- (105) K.R. DePriest, P.J. Cooper, and E.J. Parma, “MCNP/MCNPX model of the Annular Core Research Reactor,” report SAND2006-3067, Sandia National Laboratories, Albuquerque, NM (2006).
- (106) E.J. Parma et al., “Radiation Characterization Summary: ACRR Central Cavity Free-Field Environment with the 32-Inch Pedestal at the Core Centerline (ACRR-FF-CC-32-cl),” report SAND2015-6483, Sandia National Laboratories, Albuquerque, NM (2015).
- (107) A. Fabry, G. Minsart et al., “The Mol cavity fission spectrum standard neutron field and its applications,” in Proc. 4th ASTM-EURATOM Symp. on Reactor Dosimetry, NUREG/CP-0029 Vol. 2, 665–687 (1982).
- (108) D.M. Gilliam, J.A. Grundl, G.P. Lamaze et al., in Proc. 5th ASTM-EURATOM Symp. on Reactor Dosimetry, Geesthacht, 1984, published by D. Reidel, Dordrecht, The Netherlands, Vol. 2, 867 (1985), EXFOR 23096.
- (109) W. Mannhart, “Spectrum-averaged neutron cross sections measured in the U-235 fission neutron field in Mol,” in Proc. 5th ASTM-EURATOM Symp. on Reactor Dosimetry, Geesthacht, 1984, published by D. Reidel, Dordrecht, The Netherlands (1985), p. 813–825.
- (110) J. Wagemans, E. Malambu, L. Borms, L. Fiorito, “The 235U Prompt Fission Neutron Spectrum in the BR1 Reactor at SCKCEN,” EPJ Web of Conf. 106, 06003 (2016).
- (111) M. Koštál et al., “On similarity of various reactor spectra and 235U prompt fission neutron spectrum,” App. Rad. Isot. 135, 83–91 (2018).
- (112) M. Koštál et al., “Measurement of various monitors reaction rate in a special core at LR-0 reactor,” Ann. Nucl. En. 112, 759–-768 (2018).
- (113) M. Koštál et al., “Study of graphite reactivity worth on well-defined cores assembled on LR-0 reactor,” Ann. Nucl. En. 87, 601–-611 (2016).
- (114) M. Koštál et al., “Determining the axial power profile of partly flooded fuel in a compact core assembled in reactor LR-0,” Ann. Nucl. En. 90, 450-–458 (2016).
- (115) M. Koštál et al., “VVER-1000 physics experiments hexagonal lattices (1.275 cm Pitch) of Low Enriched U (3.3 wt.% 235UO2) fuel assemblies in light water: 75As(n,2n), 23Na(n,2n), 90Zr(n,2n), 89Y(n,2n) reaction rates,” LR0-RESR-004, submitted to IRPhE, 2018; EXFOR 31771.006.
- (116) R. Jeraj, M. Ravnik, “TRIGA Mark II reactor U(20) - zirconium hydride fuel rods in water with graphite reflector”. in International Handbook of Evaluated Criticality Safety Benchmarks Experiments, NEA/NSC/DOC 95 03 (1999).
- (117) Ž. Štancar, et al., “Reaction Rate Distribution Experiments at the Slovenian JSI TRIGA Mark II Research Reactor, TRIGA-FUND-RESR-002” . In: International Handbook of Evaluated Reactor Physics Benchmark Experiments [DVD], Nuclear Energy Agency, Paris OECD Nuclear Energy Agency (2017), p. 251.
- (118) V. Radulović, et al., “Use of boron nitride for neutron spectrum characterization and cross-section validation in the epithermal range through integral activation measurements,” Nucl. Instr. Meth. A840, 5–14 (2016).
- (119) V. Radulović, et al., “Nuclear reactions suitable for epithermal neutron dosimetry using boron-based filters: preparation of an experimental campaign at the JSI TRIGA reactor,” in textitProc. 27th Int. Conf. Nucl. Energy for New Europe - NENE 2018, Portorož, Slovenia, September 10-13, Nuclear Society of Slovenia (2018).
- (120) J. Grundl and D.C. Eisenhauer, “Benchmark neutron fields for reactor dosimetry,” in Neutron Cross Sections for Reactor Dosimetry, report IAEA-208, v.1, 53–104, International Atomic Energy Agency, Vienna, Austria (1978).
- (121) B.M. Oliver, H. Farrar IV, D.M. Gilliam, E.P. Lippencott, “Spectrum-integrated helium generation cross sections for 6Li and 10B in the intermediate-energy field, ” in Proc. 5th ASTM-EURATOM Symp. on Reactor Dosimetry, Geesthacht, 1984, published by D. Reidel, Dordrecht, The Netherlands, Vol. 2, 877 (1985), EXFOR 13752.
- (122) G.P. Lamaze, C.M. Eisenhauer et al., in Int. Conf. Nucl. Data Sci. & Techn., Mito, 1988, 1033 (1988).
- (123) C.B. Besant, J. Emmett, C.G. Campbell et al., “Design and construction of a fast reactor neutron spectrum generator - NISUS,” Nucl. Eng. Int. 18, 425–428 (1973).
- (124) A.H.M.A. Hannan and J.G. Williams, “Activation Foil Data for Nisus, MOL-SS and 235U Fission Spectrum,” in Neutron Cross Sections for Reactor Dosimetry, report IAEA-208, v.2, 209–225, International Atomic Energy Agency, Vienna, Austria (1978).
- (125) A. Fabry, G. De Leeuw and S. De Leeuw, “The Secondary Intermediate-Energy Standard Neutron Field at the MOL-- Facility,” Nucl. Tech. 25, 349–375 (1975).
- (126) A. Fabry, J.G. Williams et al., “Benchmark neutron fields for reactor dosimetry,” in Neutron Cross Sections for Reactor Dosimetry, report IAEA-208, v.2, 191, International Atomic Energy Agency, Vienna, Austria (1978).
- (127) I. Garlea, C. Miron, M. Lupu et al., “Measuring of a few integral data in the Sigma-Sigma neutron field,” Rev. Roum. Phys. 23, 409 (1978); EXFOR 30452.
- (128) I. Garlea and C. Miron, “Sigma Sigma-ITN Facility - Intermediate energy neutron source for reactor dosimetry,” Rev. Roum. Phys. 26, 643 (1981); EXFOR 30568.
- (129) A. Fabry, “Role of Standard Fields”, in Fast Reactor Spectrum Measurements and their Interpretation, Report IAEA-138, p. 89, International Atomic Energy Agency, Vienna, Austria (1971).
- (130) B.M. Oliver, H. Farrar IV, E.P. Lippencott and A. Fabry, “Spectrum-integrated helium generation cross sections for 6Li and 10B in the sigma-sigma and fission cavity standard neutron fields,” in 4th Symp. on Reactor Dosimetry, USA Washington D.C. 1982, Vol. 2, p. 889 (1982); EXFOR 23226.
- (131) Standard Spectra collection on the IAEA web page “International Reactor Dosimetry File: IRDF-2002”IRDF2002 . Online at https://www-nds.iaea.org/irdf2002/index.htmlx.
- (132) R.J. LaBauve, “Bare, Highly Enriched Uranium Sphere (GODIVA)”. HEU-MET-FAST-001 Revision 2 dated September 30, 2002 in the International Handbook of Evaluated Criticality Safety Benchmark Experiments, NEA/NSC/DOC(95)03/II.
- (133) J.L. Conlin et al., “Release of ENDF/B-VIII.0 Based ACE Data Files,” LA-UR-18-24034 dated May 9, 2018. The data files may be downloaded from https://nucleardata.lanl.gov.
- (134) R.W. Brewer, “Uranium-235 Sphere Reflected by Normal Uranium using Flattop”. HEU-MET-FAST-028 Revision 1 dated September 30, 1999 in the International Handbook of Evaluated Criticality Safety Benchmark Experiments, NEA/NSC/DOC(95)03/II.
- (135) A.L. Sapir, B.J. Krohn and R.D. Mosteller, “Big-Ten: A Large Mixed-Uranium Metal Cylindrical Core with 10% Average 235U Enrichment, Surrounded by a Thick 238U Reflector”. IEU-MET-FAST-007 Revision 1 dated September 30, 1999 in the International Handbook of Evaluated Criticality Safety Benchmark Experiments, NEA/NSC/DOC(95)03/II.
- (136) ICSBEP 2016: International Handbook of Evaluated Criticality Safety Benchmark Experiments, Nuclear Energy Agency, OECD, Paris 2016. See http://www.oecd-nea.org/science/wpncs/icsbep/handbook.html.
- (137) Y.Khomyakov, “Cross Section Ratios Measured in the Core Center of the BR-1 Fast Spectrum Assembly”. FUND-IPPE-FR-MULT-RRR-001 Revision-0, September 30, 2009, International Handbook of Evaluated Criticality Safety Benchmark Experiments, NEA/NSC/DOC(95)03/II.
- (138) J.W. Rogers, D.A. Millsap and Y.D. Harker, “CFRM Neutron Field Flux Spectral Characterization,” Nucl. Tech. 25, 330–348 (1975).
- (139) J.W. Rogers, Y.D. Harker and D.A. Millsap, “Fast Neutron Spectrum and Dosimetry Studies in the Coupled Fast Reactivity Measurements Facility,” Proc. of First ASTM-EUROATOM Symp. on Reactor Dosimetry, 22-26 Sep 1975 Petten, in Report EUR 5667 e/f, part II, p. 277-295, Luxembourg 1977.
- (140) J.W. Rogers, Y.D. Harker and D.A. Millsap, “The Coupled Fast Reactivity Measurement Facility (CFRMF),” in Report IAEA-208, Vienna 1976, v. II, p. 117-176; SACS will be compiled in EXFOR.
- (141) J.A. Favorite, “Bare Sphere of Plutonium-239 Metal (4.5 at.% 240Pu, 1.02wt.% Ga)”. PU-MET-FAST-001 Revision 4 dated September 30, 2016 in the International Handbook of Evaluated Criticality Safety Benchmark Experiments, NEA/NSC/DOC(95)03/II.
- (142) R.D. O’Dell, “240Pu Jezebel: Bare Sphere of Plutonium-239 Metal (20.1 at.% 240Pu, 1.01wt.% Ga)”. PU-MET-FAST-002 Revision 1 dated September 30, 1999 in the International Handbook of Evaluated Criticality Safety Benchmark Experiments, NEA/NSC/DOC(95)03/II.
- (143) R.W. Brewer, “Plutonium Sphere Reflected by Normal Uranium using Flattop”. PU-MET-FAST-006 Revision 1 dated September 30, 1999 in the International Handbook of Evaluated Criticality Safety Benchmark Experiments, NEA/NSC/DOC(95)03/II.
- (144) R.W. Brewer, “Benchmark Critical Experiment of Thorium Reflected Plutonium Sphere”. PU-MET-FAST-008 Revision 2 dated September 30, 1999 in the International Handbook of Evaluated Criticality Safety Benchmark Experiments, NEA/NSC/DOC(95)03/II.
- (145) “The International Reactor Dosimetry File (IRDF-90 Version 2),” report IAEA-NDS-141, IAEA, Vienna (1999). Online at https://www-nds.iaea.org/public/libraries/irdf/.
- (146) W. Mannhart, “Status of the evaluation of the neutron spectrum of 252Cf(s.f.),” IAEA Consult. Meet. on International Neutron Cross-Section Standards: Measurements and Evaluation Techniques, Vienna, 13–15 Oct 2008, Report INDC(NDS)-0540 ,Vienna, 2008. Available online.
- (147) M. Paul, M. Tessler, M. Friedman et al., “Reactions along the astrophysical s-process path and prospects for neutron radiotherapy with the Liquid-Lithium Target (LiLiT) at the Soreq Applied Research Accelerator Facility (SARAF),” Eur. Phys. Journ. A55, 44 (2019).
- (148) S. Manojlovic, A. Trkov, “Nuclear Cross Section Measurement Analysis in the Californium-252 Spectrum with the Monte Carlo Method”, Conf. “Nuclear Energy for New Europe 2011”, Ljubjana, contribution 307.
- (149) W. Mannhart, “Response of Activation Reactions in the Neutron Field of 252Cf(s.f.),” IAEA Technical Report Series No. 452, IAEA, Vienna, Austria, 2006, pp. 30–45.
- (150) J. Csikai, Z. Dezso, “Average cross sections for the Cf-252 neutron spectrum. II. (n,f) reactions,” in VIIth Gaussig Symp., Nov 1977, Report ZFK-376, Rossendorf, pp. 44-46 (1978); EXFOR 30415.004.
- (151) F. Cserpak, T. Biro, J. Csikai, “Measurement of cross-sections for (n,t) reactions on light nuclei,” in Int. Conf. on Neut. Phys. and Nucl. Data, Harwell 1978, p. 761 (1978); EXFOR 30474.002.
- (152) K.I. Zolotarev, “Evaluation of excitation functions for 28Si(n,p)28Al, 31P(n,p)31Si, and 113In(n,)114mIn reactions,” Report INDC(NDS)-0668, International Atomic Energy Agency, Vienna, Austria (2014).
- (153) M.V. Blinov, E.A. Gromova, Kovalenko et al. , “Cross Section of the 238U(n,2n)237U Reaction induced by Neutrons from 252Cf Spontaneous Fission,” Sov. At. En. 65, 761–764 (1988); EXFOR 40996.002.
- (154) M. Schulc et al., “Validation of IRDFF-II library by means of 252Cf Spectral Averaged Cross Sections”, App. Rad. Isot., submitted for publication 8 Aug 2019.
- (155) M. Schulc, M. Kostal, S. Simakov et al., “Validation of differential cross sections by means of 252Cf spectral averaged cross sections,” App. Rad. Isot. 132, 29–37 (2018); EXFOR 31786.002.
- (156) M. Schulc, M. Kostal, R. Capote et al., “Validation of selected (n,2n) dosimetry reactions in IRDFF-1.05 library,” App. Rad. Isot. 143, 132-140 (2019).
- (157) M. Schulc, M. Kostal, E. Novak et al., “Investigation of 127I(n,2n)126I and 23Na(n,2n)22Na reactions using 252Cf neutron source,” ASME J. Nucl. Rad. Sc. 5, 030918 (2018).
- (158) A. Trkov, “Program RRUNC - calculation of uncertainties in reaction rates and cross sections,” Jozef Stefan Institute, Ljubljana, Slovenia, https://www-nds.iaea.org/IRDFF/rr_unc.for.
- (159) M. Schulc, et al., “Application of 252Cf neutron source for precise nuclear data experiments,” App. Rad. Isot. 151, 187–195 (2019).
- (160) M.E. Wyman, E.M. Fryer and M.M. Thorpe, “(n,t) Cross Sections for B10, B11 and Be9,” Phys. Rev. 112, 1264 (1958); EXFOR 11231.005.
- (161) M. Koštál et al., “A reference neutron field for for measurement of spectrum averaged cross sections,” Ann. Nucl. Energy (2019), to be published.
- (162) M. Koštál, M. Svadlenkova, P. Baron et al., “Measurement of 23Na(n,2n) cross section in well-defined reactor spectra,” App. Rad. Isot. 111, 1–7 (2016).
- (163) M. Kostal, “VVER-1000 physics experiments hexagonal lattices (1.275 cm Pitch) of Low Enriched U (3.3 wt.% 235UO2) fuel assemblies in light water: 75As(n, 2n), 23Na(n,2n), 90Zr(n,2n), 89Y(n,2n) reaction rates,” LR0-RESR-004, submitted to IRPhE (2018); EXFOR 31771.006.
- (164) D.J. Hughes, R.C. Garth, J.S. Levin, “Fast Neutron Cross Sections and Nuclear Level Densities,” Phys. Rev. 91, 1423–1429 (1953); EXFOR 13860.014.
- (165) M. Koštál et al., “Validation of 14N(n,p) cross section in LR-0 reference field,” App. Rad. Isot. , 2019, to be published.
- (166) N. Burianova, M. Kostal, M. Schulc et al., “Measurement of selected differential cross sections in 235U spectrum,” ASME J. Nucl. Rad. Sc. 5, 030906 (2019).
- (167) P.M. Suarez, M.A. Arribere et al., “Fission Neutron Spectrum Averaged Cross-Section of the 54Fe(n,f)51Cr Reaction,” Rad. Acta 78, 11–13 (1997); EXFOR 31508.002.
- (168) A.V. Bushuev, A.V. Zvonarev et al., “Determination of the cross-sections for some neutron reactions with structural materials in the BN-350 reactor core”, Sov. J. of Atom Energy, V. 63, p. 721 (1987); EXFOR 40956.012.
- (169) K. Kobayashi and I. Kimura, “The average cross section for the (n,2n) reactions of Mn-55,Ni-58,Co-59 and I-127 to the fission neutrons of U-235t’, Report INDC(JAP)-54, p. 42 (1980), IAEA; EXFOR 21693.003.
- (170) O. Horibe and H. Chantani, “Cross sections of the reactions 55Mn(n,2n) 54Mn, 58Ni(n,2n) 57Ni and 58Ni(n,np) 57Co averaged over the U-235 fission neutron spectrum,” Conf. on Nucl. Data for Sci. and Technol., Julich 1991, p.68 (1991); EXFOR23223.004.
- (171) T. Sekine and H. Baba, “Cross sections of the (n,2n) reaction of 59Co, 58Ni, 70Ge, 90Zr and 203Tl with fission neutrons”, J. Inorg. Nucl. Chem. 43, 1427 (1981); EXFOR 21613.003.
- (172) J.A. Grundl, “A study of fission neutron spectra with high-energy activation detectors. Part II – Fission Spectra,” Nucl. Sci. Tech. 31, 191 (1968); EXFOR 12193.008.
- (173) A. Fabry, M. DE Coster, “Integral test of capture cross-sections in the energy range 0.1 to 2 MeV,” Proc. Int. Conf. on Nuclear Cross-Sections and Techn., Washington 1968, Vol. 2, pp. 1263–1267 (1968); EXFOR 20264.
- (174) K.I. Zolotarev, A.V. Ignatyuk, V.N. Manokhin, and A.B. Pashchenko, “RRDF-98 Russian Reactor Dosimetry File,” Report IAEA(NDS)-193, IAEA, Vienna, Austria (1999).
- (175) M. Koštál, M. Schulc, J. Simon et al., “Measurement of various monitors reaction rate in a special core at LR-0 reactor,” Ann. Nucl. En. 112, 759–768 (2018).
- (176) G. Rau, Averaged Cross Section of the Reaction Y-89(n,2n)Y-88, in: Progress Report EANDC(E)-89, February 1968, p. 41.
- (177) E. Steinnes, “Cross-Sections of Some (n,2n) Reactions Induced by Reactor Fast Neutrons,” Rad. Acta 13, 169 (1970).
- (178) A. A. Bojtcov, E.I. Grigoriev, V.S. Troshin, V.P. Yaryna, “Measurements and Evaluations of the Averaged Cross-Section for 89Y(n,2n)88Y Reaction for the Fission 235U Neutrons”, Voprocy Atomnoj Nauki i Techniki, Ser.Yadernye Konstanty, 1 (1992) 55-56 (in Russian).
- (179) K. Kobayashi and T. Kobayashi, “Measurements of U-235 fission spectrum-averaged cross sections and neutron spectrum adjusted with the activation data,” Report KURRI-AR-26, p. 21 (1992), Kyoto University; EXFOR 22216.
- (180) E.I. Grigoriev, G.B. Tarnovskij, V.P. Jaryna, “Measurement of the neutron threshold reactions cross sections for U-235 fission spectrum,” Proc. 6th All-Union Conf. on Neutron Physics, Kiev 2-6 Oct 1983, Vol. 3, p. 187 (1983); EXFOR 40848.002.
- (181) K.I. Zolotarev, “Evaluation and improvement of cross section accuracy for most important dosimetry reactions including covariance data”, Report INDC(NDS)-0431, IAEA, Vienna, Austria (2002).
- (182) I. Kimura, K. Kobayashi and T. Shibata, “Measurements of Activation Cross Sections for Some Threshold Reactions for Neutrons with Fission-Type Reactor Spectrum,” J. Nucl. Sc. Tech. 8, 59–69 (1971); EXFOR http://www-nds.iaea.org/EXFOR/20317.018.
- (183) A.K. Brodskaya et al., “Fission neutron spectra averaged cross-sections of (n,a), (n,p), (n,2n), (n,n’) reactions for some elements,” Yad.-Fiz. Issled. 24, 15 (1977) (in Russian).
- (184) K. Kobayashi, I. Kimura et al., J. Nucl. Sc. Tech. 13, 531 (1976); EXFOR 20693.
- (185) T. Hashimoto, T. Sotobayashi and K. Kobayashi, “Measurement of Average Cross Section for 238U(n, 2n)237U Reaction,” J. Nucl. Sc. Tech. 15, 626–628 (1978); EXFOR 20810.002.
- (186) G. Shani, “(n,2n) cross-section measurement of Nb-93, Au-197 and U-238 with fission-neutron spectrum”, Ann. Nucl. En. 10, 473 (1983); EXFOR 30658.004.
- (187) R. Capote, A. Trkov, “Predicting Spectrum Averaged Cross Sections in Prompt Fission Neutron Fields,” 16th International Symposium on Reactor Dosimetry, ASTM STP1608, M. H. Sparks, K. R. DePriest, and D. W. Vehar, Eds., ASTM International, West Conshohocken, PA, 2018, pp.117–123, http://dx.doi.org/10.1520/STP160820170114.
- (188) P.J. Griffin, D.W. Vehar, E.J. Parma, K.D. Hahn, “Rigorous Uncertainty Propagation Using a Dosimeter Transfer Calibration,” 16th International Symposium on Reactor Dosimetry, ASTM STP1608, M. H. Sparks, K. R. DePriest, and D. W. Vehar, Eds., ASTM International, West Conshohocken, PA, 2018, pp. 124–134, 2018, https://doi.org/10.1520/STP1608-EB.
- (189) M. Koštál, M. Schulc, V. Rypar, et al., “Validation of zirconium isotopes (n,) and (n,2n) cross sections in a comprehensive LR-0 reactor operative parameters set,” Appl. Rad. Isot. 128, 92–100 (2017).
- (190) P. Dryak, P. Kovar, “Experimental and MC determination of HPGe detector efficiency in the 40–-2754 keV energy range for measuring point source geometry with the source-to-detector distance of 25 cm,” Appl. Rad. Isot. 64, 1346–1349 (2006).
- (191) Trkov, A., Radulovic ć, V., Snoj, L., “The GRUPINT neutron spectrum adjustment code - general features and characterization of the spectra in three irradiation channels of the JSI TRIGA reactor,” 16th International Symposium on Reactor Dosimetry, May 7–12 (2017).
- (192) P.G.Young et al., “Evaluation of Neutron Reactions for ENDF/B-VII: 232-241U and 239Pu,” Nucl. Data Sheets 108, 2589–2654 (2007).
- (193) S.C.Frankle and J.F.Briesmeister, “Spectral Measurements in Critical Assemblies: MCNP Specifications and Calculated Results,” Report LA-13675, December 1999.
- (194) Cross Section Evaluation Working Group Benchmark Specifications, BNL 19302 (ENDF-202). Originally published November 1974 with updates to selected benchmarks or new additions in May 1975, October 1976, February 1978, October 1978, May 1981, November 1981, September 1982, December 1983, September 1986 and September 1991.
- (195) J.A. Grundl, C.M. Eisenhauer, “Compendium of Benchmark Neutron Fields for Reactor Dosimetry,” Report NSIR 85-03151, National Bureau of Standards, 1986.
- (196) K. Kobayashi, I. Kimura, Report EUR-6813, 1004, 1980; EXFOR 21589;
- (197) I. Garlea, C. Miron, Rev. Roum. Phys. 23, 409 (1978)
- (198) A.H.M.A. Hannan, J.G. Williams, Report NEANDC(E)-172, p. 8, France, 1976.
- (199) E.P. Lippencott, A.L. Pitner and L.S. Kellogg, “Measurement of 10B(n,t) cross section in a fast-neutron spectrum”, Trans. Amer. Nucl. Soc. 17, p. 494 (1973); EXFOR 13756.
- (200) H. Farrar IV, W.N. McElroy and E.P. Lippencott, “Helium production cross sections of Boron for fast reactor neutron Spectra”, Nucl. Techn. 25, 305 (1975); EXFOR - to be compiled.
- (201) Y.D. Harker, E.H. Turk, Conf. on Develop. in Reactor Phys., Kiamesha Lake 1972, v. 2, p. 614
- (202) J.A. Grundl, D.M. Gilliam et al., Nucl. Techn. 25, 237 (1975).
- (203) R.A. Anderl and Y.D. Harker, “Measurement of the Integral capture and fission cross sections for 232Th in the CFRMF,” Proc. Int. Conf. on Nucl. Cross Sections For Techn., Oct 1979, Knoxville, p. 475; EXFOR 14354.
- (204) F. De Corte, “The KO-standardization method,” Rijksuniversiteit, Gent, Thesis (1987).
- (205) V. Radulović, A. Trkov, R Jaćimović, R. Jeraj, “Measurement of the neutron activation constants and for the 27Al(n,)28Al reaction at the JSI TRIGA Mark II reactor,” J. Radioan. Nucl. Chem. 298, 1791–1800(2013).
- (206) Karlsruhe Astrophysical Database of Nucleosynthesis in Stars KADoNiS version 1.0; https://exp-astro.de/kadonis1.0/.
- (207) Z.Y. Bao, H. Beer, F. Kappeler et al., “Neutron cross section for nucleosynthesis studies,” At. Data Nucl. Data Tables 76, 70-–154 (2000).
- (208) G. Feinberg, M. Friedman, A. Krasa et al., “Quasi-stellar neutrons from the 7Li(p,n)7Be reaction with an energy-broadened proton beam,” Phys. Rev. C85, 055810 (2012); EXFOR 23284.
- (209) P. Jiménez-Bonilla and J. Praena, “Measurement of the 197Au(n,) stellar cross section at kT=30 keV by activation”, 13th Symp. on Nuclei in the Cosmos, Debrecen, 2014, p. 102 (2014); EXFOR 23282.
- (210) A. Wallner, T. Belgya, M. Bichler et al., “Novel Method to Study Neutron Capture of 235U and 238U Simultaneously at keV Energies”, Phys. Rev Lett. 112, 192501 (2014); EXFOR 23170.
- (211) L.R. Greenwood et al., Testing and Improving of the International Reactor Dosimetry and Fusion File (IRDFF), International Atomic Energy Agency, Vienna, Austria, Report INDC(NDS)-0731, Vienna, Austria (2017).
- (212) L.R. Greenwood, B.P. Pierson, and C.D. Johnson, “Enhancement of STAYSL-PNNL with IRDFF to 60 MeV,” Reactor Dosimetry: 16th International Symposium, ASTM STP1608, M. H. Sparks, K. R. DePriest, and D. W. Vehar, Eds., ASTM International, West Conshohocken, PA, 2018, pp. 265–275, http://dx.doi.org/10.1520/STP1608201700542.
- (213) D.R. Nethaway, R.A. Van Konynenberg, M. W. Guinan, and L. R. Greenwood, “Neutron Spectra from 30-MeV Deuterons on a Thick Beryllium Target,” Proc. Symp. on Neutron Cross Sections from 10–40 MeV,” Report BNL-NCS-50681, p.135 (1977).
- (214) L.R. Greenwood, R. R. Heinrich, M. J. Saltmarsh, and C. B. Fulmer, “Integral Tests of Neutron Activation Cross Sections in a 9Be(d,n) Field at Ed = 40 MeV,” Nucl. Sci. Eng. 72, 175 (1979) https://doi.org/10.13182/NSE79-A19462.