Predicting Complex Relaxation Processes in Metallic Glass
Abstract
Relaxation processes significantly influence the properties of glass materials. However, understanding their specific origins is difficult, even more challenging is to forecast them theoretically. In this study, using microseconds molecular dynamics simulations together with an accurate many-body interaction potential, we predict that an AlSm metallic glass would have complex relaxation behaviors: In addition to the main () relaxation, the glass (i) shows a pronounced secondary () relaxation at cryogenic temperatures and (ii) exhibits an anomalous relaxation process () accompanying relaxation. Both of the predictions are verified by experiments. Computational simulations reveal the microscopic origins of relaxation processes: while the pronounced relaxation is attributed to the abundance of string-like cooperative atomic rearrangements, the anomalous process is found to correlate with the decoupling of the faster motions of Al with slower Sm atoms. The combination of simulations and experiments represents a first glimpse of what may become a predictive routine and integral step for glass physics.
Compared with crystals, glasses inherently feature diverse relaxation dynamics over a wide range of temperature and timescales. These relaxation processes significantly influence properties of glass materials and are related to a number of crucial unresolved issues in glassy physics Berthier2011 ; Angell2000 ; Micoulaut2016 ; Lunkenheimer2000 ; Sokolov2015 . Understanding how the atomic rearrangements govern these processes represents an outstanding issue in glass physics Berthier2011 ; Micoulaut2016 ; Pazmi2015 ; Lunkenheimer2000 ; Lahini2017 .
Usually, the most prominent relaxation process is the primary () relaxation which is responsible for the vitrification of glass-forming liquid. Its falling out of equilibrium indicates the glass transition phenomenon. Processes occurring in addition to the relaxation at shorter timescales or lower temperature are referred as secondary () relaxations. The studies over the last a few decades have established that the relaxation could have important consequences on the mechanical properties for metallic and polymeric glasses, as well as thermal stability of glassy pharmaceuticals and biomaterials, and thus attract considerable attentions Yu2014 ; Yu2013 ; Ngai2004 ; Capaccioli2012 ; Geirhos2018 ; Sondhaub2015 . Moreover, recent studies have discovered there might be more relaxation processes in addition to the and relaxations in glasses Lahini2017 ; Welch2013 ; Kuchemann2017 ; Luo2017 ; Wang2015 ; Yu2017 ; Cangialosi2013 ; Ruta2012 ; Bi2018 . Even the structurally simplest metallic glasses (MGs, compared to molecular and polymeric glasses) could exhibit multiple relaxations, indicating that a far richer-than-expected scenario for glass relaxation. For example, Wang et al. Wang2015 and Küchemann et al. Kuchemann2017 identified a new relaxation process that is faster than the relaxation in MGs which was named and relaxations. Wang et al. Wang2017 also illustrate the relaxation might be correlated with the initiation of plastic deformation in MGs. Luo and coworkers Luo2017 reported the non-equilibrium relaxation would split into two processes in deep glassy state which causes early decay in the stress-relaxation experiments Ruta2017 . While these results illustrate that MGs possess complex relaxation phenomena and have consequences on properties, it is difficult to understand their specific origins because of the lack of microscopic data of these processes.
In principle, molecular dynamics (MD) simulation is a powerful tool to investigate detailed atomic rearrangements in the glass relaxations at the microscopic level. However, the relaxations in the glassy states are extremely complicated, as they are sensitive to chemical compositions Yu2013a and thermal histories Giordano2016 ; Wang2016 . The related relaxation timescales (e.g., milliseconds to seconds) are usually several decades longer than the current available computational timescales (picoseconds to nanoseconds). It is therefore challenging to model the relaxation dynamics of realistic glass materials under experimental conditions. Moreover, for large-scale MD simulations of MGs, the force field which describes the many-body interactions (i.e., empirical potentials) is of vital importance Cheng2009 ; Cheng2011 ; Falk2019 . Although there are a few potentials that can reproduce some static structural features and thermodynamics of MGs, their capability of describing dynamical processes is mostly unknown.
Recently, a realistic interaction potential for the study of AlSm MG was developed Mendelev2015 . It correctly describes the glass structure Sun2016 , complex devitrification behaviors Ye2017 ; Yang2018 and crystal growth Wang2017a in the Al-Sm systems. It also brings insights to the competition of crystallization and glass formation Sun2019 ; Zhao2018 . Therefore, it provides a model system to investigate the relaxation mechanism in the realistic MG.
In this work, relying on this accurate interaction potential, we simulate the dynamical mechanical spectroscopy (DMS) of AlSm MG in the timescale up to 10 microseconds which almost reaches the limit of state-of-the-art computational power. With such a slow frequency, we find an anomalous relaxation process (noted as ) decouples from relaxation. The MG also exhibit a strongly pronounced relaxation even on the MD timescale. The behaviors predicted from the MD simulations are verified with DMS experiments at cryogenic temperatures. The detailed atomic motions that lead to the relaxation processes are revealed from the MD trajectories. The feasibility that atomic simulations could discover new relaxation processes in MGs and elucidate their underlying mechanisms would be useful for understanding the dynamics and properties as well as the design of glass materials.
Simulation - MD simulations were carried out based on a Finnis-Sinclair potential Mendelev2015 , using the GPU-version of LAMMPS code Brown11 ; Brown12 ; Brown13 . The AlSm glass model, containing 32,000 atoms, were obtained by the continuous cooling with a cooling rate of K/s. The MD simulations of DMS (MD-DMS) Yu2014a were performed during the cooling process, covering a wide temperature range from deeply undercooled liquid to low-temperature glass. In MD-DMS, a sinusoidal strain was applied with an oscillation period (related to frequency ) and a strain amplitude . The resulted stress and phase difference between stress and strain were measured and fitted by . The storage and loss moduli were calculated by and , respectively. A strain amplitude was applied in all MD-DMS, which ensured deformations in the linear response regime.
Experiments - The AlSm MG was prepared by spinning-quenching techniques (see Supplemental Material Supp for details). The relaxation dynamics of the MG was studied by a dynamical mechanical analyzer using liquid Nitrogen for temperature control, which allows us to reach the cryogenic temperature (down to 150K). The measurements were conducted during a temperature ramping of 3 K/min together with a film tension oscillation using the discrete testing frequencies of 0.5, 2, 4, 8 and 16 Hz. The storage () and loss () moduli were recorded for subsequent analysis and comparing with MD-DMS results.
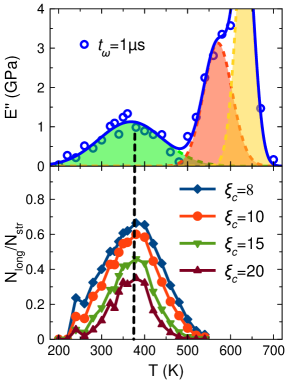
Predictions by simulations - Figure 1 shows MD-DMS results by plotting the storage () and loss moduli () as a function of temperature under different oscillation periods. The temperature-dependent loss modulus curves are fitted with a serial of Gaussian peaks which correspond to different relaxation processes. With the longest oscillation period in Fig. 1, the loss modulus exhibits a broad peak in the temperature range from 200 K to 500 K, which corresponds to the typical relaxation. We note that there exists no such pronounced peak of relaxation in any previous MD simulations where only shoulder-like or excess wings were observed. At higher temperature, the dominant primary () relaxation peak shows a strong shoulder in the temperature range 500-600 K, which needs an extra peak function for the fitting. Considering this process decreases in amplitude as frequency increases (or decrease), which is consistent with behaviors of relaxation in general, this new peak is named as process.
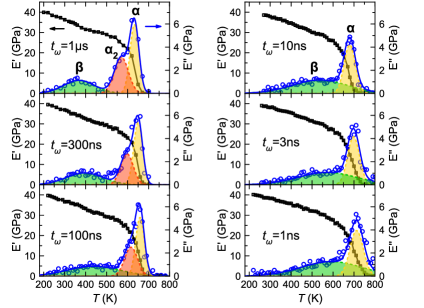
As shown in Fig. 1, with the decrease of oscillation period, all three peaks, , and , shift towards higher temperature. The peak gradually collapses in the peak so that one can hardly differentiate them when is smaller than . With very short oscillation period (e.g. ), the peak also largely overlaps with the peak. Thus, the simulations predict a complex relaxation scenario in the AlSm MG: at suitably long time scales (e.g., ) it has a pronounced peak and an anomalous process in addition to the relaxation.
Experimental verification - We next validate these computational predictions by DMS experiments for the as-quenched AlSm samples. Even though our longest simulation period reaches 1 , it is still about 5-6 orders of magnitude faster than the typical DMS experiments in which probing timescales are . Extrapolating the temperature-time relation for the relaxation from simulations to the experimental timescale leads to a characteristic temperature about 200 K (inset of Fig. 2(a)).
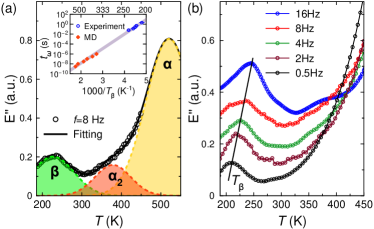
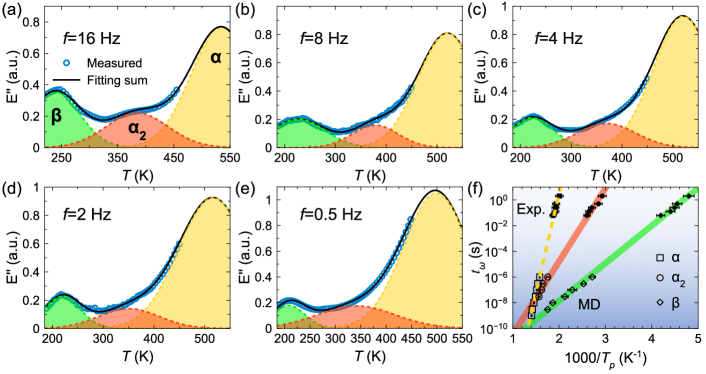
Figure 2(a) shows the experimental for the MG from a cryogenic DMS measurement at the testing frequency of 8 Hz. Remarkably, it clearly shows a pronounced relaxation peak at about 220 K, consistent with the extrapolation of MD simulations. Figure 2(b) shows for more different testing frequencies. The peak temperature of the relaxation increases with higher frequency (or shorter time period), which is also quantitatively agree with the MD simulations as shown in the inset of Fig. 2(a).
Besides, a close examination of curve in Fig. 2(a) indicates that there is notable excess contribution to the relaxation around , which is corresponding well with the relaxation found from MD-DMS (Fig. 1). This process can also be discerned from different testing frequencies in Fig. 2(b). For example, it is more evident on the curve with the frequency of 16 Hz. Due to close coupling with relaxation, process is more difficult to be resolved than the pronounced relaxation. Nevertheless, its time-temperature relation can still be determined and compared favorably with MD simulations (see Supplemental Material Supp ). Therefore, the presence of process in the MG could be ascertained with the guidance of MD simulation. Unfortunately, because of the occurrence of strong devitrification process in the current MG system Ye2017 , one cannot fully access the relaxation peak at experimental timescales, resulting in the termination of experimental data at 450K.
Mechanism for peak - The above experiments validate the predictions from MD simulations. Now we are in position to investigate the mechanisms of these complex relaxation processes. Recently, the structural rearrangements governing the relaxations have been investigated in a model NiP MG Yu2017a and a YCu MG Yu2018 , which suggests string-like motions might be the origin of relaxation. However, these MGs do not show such clear relaxation peak as the AlSm at MD accessible timescales. One feature about string-like motions is that a particle jumps to a position that was occupied previously by another particle Yu2017a . Structurally, this would result in a multi-peak curve for the distribution of atomic displacements during the deformation period, which is clearly observed in the present MG as shown in Fig. 3(a) (the mathematical definitions of displacement and string-like motion are provided in Supplemental Material S3 Supp ). The fact that the second and third peaks of match exactly the first and second peaks of pair distribution function at various relaxation peaks in Fig. 3(a) indicates that atoms prefer to jumping to the position that is previously taken by another atom in its nearest or secondary neighbors, which further evidences string-like motions. Figure 3(b) shows that the strings can propagate in a rather large spatial range and form different types of geometries such as aggregations, loops and long-range chains. The string size is defined by the number of atoms involved in the string. Figure 3(c) shows that the probability of the atom forming string follows an exponential function with the string size that can span up-to 70 atoms. While similar string-like motions were also observed in Lennard-Jones liquid model Donati1998 and other systems starr2013 ; Zhang2015 , the string size in the current AlSm is much longer than other systems. For example, the longest reported string in NiP contains 12 atoms Yu2018 which is smaller by a factor 6 than current MG. Such long-range and large-scale string-like motion is a unique feature of the present MG which could be the reason for the uniquely pronounced peak.
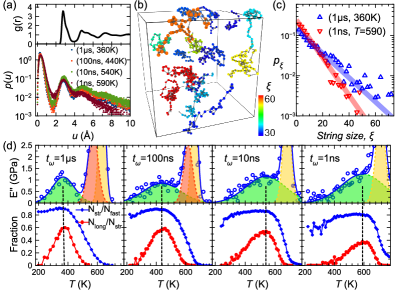
Figure 3(d) quantifies the fraction of string-like-moving atoms to the total number of fast-moving atoms (), as well as the fraction of atoms involved in the long-string motions to the total number of string-like-moving atom () as a function of temperature. The long-string motion is defined by here. The -dependent loss moduli are also plotted for comparison. One can see the peak of well matches the peak of relaxation over all the studied oscillation periods . While the curve of reaches a maximum plateau at the peak temperature of relaxation , manifests as a pronounced peak, whose position and width quantitatively agree with those of relaxation peaks. Note this correlation does not change with the choice of long-string motion threshold (see Supplemental Material Supp ). These results suggest long-string motions contribute more to the relaxation than shorter ones, which emphasis the cooperative nature of relaxation.
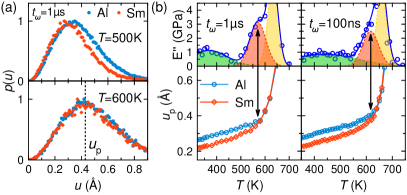
Mechanism for process - To gasp the microscopic origin of process, we analysis the probabilities of atomic displacements for Al and Sm atoms, respectively. As shown in Fig. 4(a), at a temperature lower than the peak of relaxations (about ), the peaks of for Al and Sm separate with each other. While at the temperature higher than the process, the peaks of Al and Sm well overlaps with each other. This comparison implies that decoupling of the motions of Al and Sm atoms occurs when the temperature crosses the peak.
To further quantify this behavior, Fig. 4(b) plots the most probable displacement, i.e. the peak position of as a function of temperature. When the temperature increases from the lower regime, of Al and Sm atoms first increase separately until reaching a transition point where two curves merge to one. When comparing with loss moduli in Fig. 4(b), we find that the transition point coincides with the peak position of relaxation over all the studied oscillation periods. Therefore, the relaxation well correlates with the dynamical transition from coupling to decoupling motions of Al and Sm atoms. It indicates the asynchronous freezing of fast and slow motions could be the key factor leading to this process.
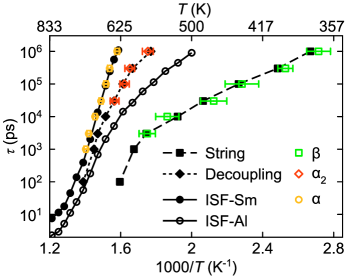
In Fig. 5, we summarized all the studied processes in a relaxation map over a wide range of temperature and timescales. One can see that the relaxation and the decoupling between Sm and Al atoms follow the same temperature-time relation, suggesting an intrinsic correlation between them. Meanwhile, the relaxation and the long string-like motions () agree with each other. Hence, the atomistic simulations not only predicted the complex relaxations in the MGs, but also elucidate the underlying mechanisms for them.
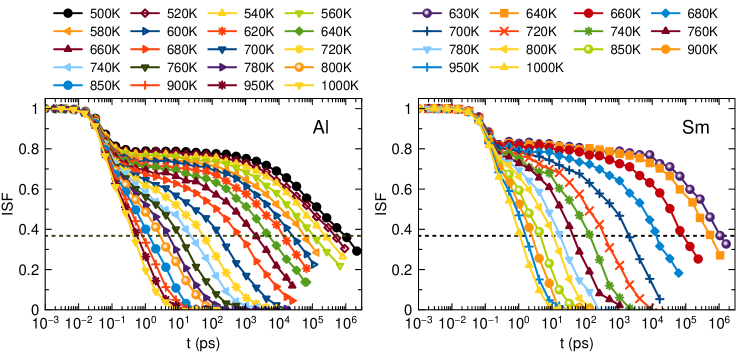
Figure 5 also reveals that the AlSm MG is a typical glass system in which the solute and solvent elements show dramatically different dynamical behaviors: the relaxation time calculated based on the intermediate scattering function (ISF) of Sm atoms are orders of magnitudes longer than the Al atoms (see details in Supplemental Material Supp ). Moreover, the global relaxation determined from MD-DMS correlates only with the relaxation time from the ISF of Sm atoms, implying that it is controlled predominately by the slowest process. Previous simulations Voigtmann2009 ; Cho2012 ; Bosse1995 suggested that the large atomic size ratio disparity might cause more than one glass transitions in model systems. In a recent theoretical work, Cui et al. Cui2018 pointed out that the dynamical decoupling between constituents with wide mass disparity might lead to a separated relaxation process and suggested it to be a relaxation. The identified process here might be an experimental evidence for these scenarios in real glasses. Moreover, it indicates that the related process can be an additional primary process in stead of relaxation. Finally, we note that the process might not be unique to the AlSm MGs: in a recent work Xue et al. Xue2015 reported the relaxation processes in a serials of LaGa-based MGs. Although not discussed explicitly, their data indeed exhibit a discernable -like process, which may also be related to the mobility decoupling between fast Ga and slow La atoms.
We have shown that with atomic simulations, one could predict complex relaxation processes in MGs at the laboratory timescales and clarify their microscopic origins. A MG system with previously unidentified relaxation process due to the mobility decoupling and strong relaxations caused by long-string motions has thus been predicted by simulations and verified by experiments. The combined experiments (validations) and simulations (predictions and clarification of mechanisms) represent a first glimpse of what may become a routine and integrated step in the study of glass relaxation. With above interpretations, one would expect an abundant relaxations, or even more relaxation processes in glass states. It then suggestions that efforts aimed at a quantitative theory to predict glass relaxation would be desirable. The results presented above thus open new challenges and opportunities for furthering our understanding of glass relaxations.
Acknowledgements.
Acknowledgements We thank Ms. Xiao-Hui Qin for experimental help. The work at HUST are supported by National Science Foundation of China (NSFC 51601064) and the Fundamental Research Funds for the Central Universities (2018KFYXKJC009). Work at Ames Laboratory was supported by the U.S. Department of Energy (DOE), Office of Science, Basic Energy Sciences, Materials Science and Engineering Division, under Contract No. DE-AC02-07CH11358, including a grant of computer time at the National Energy Research Supercomputing Center (NERSC) in Berkeley, CA.References
- (1) L. Berthier and G. Biroli, Rev. Mod. Phys. 83, 587 (2011).
- (2) C. A. Angell, K. L. Ngai, G. B. McKenna, P. F. McMillan, and S. W. Martin, J. Appl. Phys. 88, 3113 (2000).
- (3) M. Micoulaut, Rep. Prog. Phys. 79, 066504 (2016).
- (4) P. Lunkenheimer, U. Schneider, R. Brand, and A. Loid, Contemp. Phys. 41, 15 (2000).
- (5) S. Khodadadi and A. P. Sokolov, Soft Matter 11, 4984 (2015).
- (6) B. A. Pazmiño Betancourt, P. Z. Hanakata, F. W. Starr, and J. F. Douglas, Proc. Natl. Acad. Sci. U.S.A. 112, 2966 (2015).
- (7) Y. Lahini, O. Gottesman, A. Amir, and S. M. Rubinstein, Phys. Rev. Lett. 118, 085501 (2017).
- (8) H. B. Yu, W. H. Wang, H. Y. Bai, and K. Samwer, Natl. Sci. Rev. 1, 429 (2014).
- (9) H.-B. Yu, W.-H. Wang, and K. Samwer, Mater. Today 16, 183 (2013).
- (10) K. L. Ngai and M. Paluch, J. Chem. Phys. 120, 857 (2004).
- (11) S. Capaccioli, M. Paluch, D. Prevosto, L.-M. Wang, and K. L. Ngai, J. Phys. Chem. Lett. 3, 735 (2012).
- (12) K. Geirhos, P. Lunkenheimer, and A. Loidl, Phys. Rev. Lett. 120, 085705 (2018).
- (13) J. Sondhauß, M. Lantz, B. Gotsmann, and A. Schirmeisen, Langmuir 31, 5398 (2015).
- (14) R. C. Welch, J. R. Smith, M. Potuzak, X. Guo, B. F. Bowden, T. J. Kiczenski, D. C. Allan, E. A. King, A. J. Ellison, and J. C. Mauro, Phys. Rev. Lett. 110, 265901 (2013).
- (15) S. Kuchemann and R. Maass, Scr. Mater. 137, 5 (2017).
- (16) P. Luo, P. Wen, H. Y. Bai, B. Ruta, and W. H. Wang, Phys. Rev. Lett. 118, 225901 (2017).
- (17) Q. Wang, S. T. Zhang, Y. Yang, Y. D. Dong, C. T. Liu, and J. Lu, Nat. Commun. 6, 7876 (2015).
- (18) Y. Yu, M. Wang, M. M. Smedskjaer, J. C. Mauro, G. Sant, and M. Bauchy, Phys. Rev. Lett. 119, 095501 (2017).
- (19) D. Cangialosi, V. M. Boucher, A. Alegria, and J. Colmenero, Phys. Rev. Lett. 111, 095701 (2013).
- (20) B. Ruta, Y. Chushkin, G. Monaco, L. Cipelletti, E. Pineda, P. Bruna, V. M. Giordano, and M. Gonzalez-Silveira, Phys. Rev. Lett. 109, 165701 (2012).
- (21) Q. Wang, J. J. Liu, Y. F. Ye, T. T. Liu, S. Wang, C. T. Liu, J. Lu, and Y. Yang, Mater. Today 20, 293 (2017).
- (22) B. Ruta, E. Pineda, and Z. Evenson, J. Phys. Condens. Matter 29, 503002 (2017).
- (23) Q. L. Bi, Y. J. Lu, and W. H. Wang, Phys. Rev. Lett. 120, 155501 (2018).
- (24) H. B. Yu, K. Samwer, W. H. Wang, and H. Y. Bai, Nat. Commun. 4, 2204 (2013).
- (25) V. M. Giordano and B. Ruta, Nat. Commun. 7, 10344 (2016).
- (26) B. Wang, B. S. Shang, X. Q. Gao, W. H. Wang, H. Y. Bai, M. X. Pan, and P. F. Guan, J. Phys. Chem. Lett. 7, 4945 (2016).
- (27) Y. Q. Cheng, E. Ma, and H. W. Sheng, Phys. Rev. Lett. 102, 245501 (2009).
- (28) Y. Q. Cheng and E. Ma, Prog. Mater. Sci. 56, 379 (2011).
- (29) Y. He, P. Yi, and M. L. Falk, Phys. Rev. Lett. 122, 035501 (2019).
- (30) M. I. Mendelev, F. Zhang, Z. Ye, Y. Sun, M. C. Nguyen, S. R. Wilson, C. Z. Wang, and K. M. Ho, Model. Simul. Mater. Sci. Eng. 23, 045013 (2015).
- (31) Y. Sun, Y. Zhang, F. Zhang, Z. Ye, Z. Ding, C.-Z. Wang, and K.-M. Ho, J. Appl. Phys. 120, 015901 (2016).
- (32) Z. Ye, F. Zhang, Y. Sun, M. C. Nguyen, S. H. Zhou, L. Zhou, F. Meng, R. T. Ott, E. Park, M. F. Besser, M. J. Kramer, Z. J. Ding, M. I. Mendelev, C. Z. Wang, R. E. Napolitano, and K. M. Ho, Phys. Rev. Materials 1, 055601 (2017).
- (33) L. Yang, F. Zhang, F.-Q. Meng, L. Zhou, Y. Sun, X. Zhao, Z. Ye, M. J. Kramer, C.-Z. Wang, and K.-M. Ho, Acta Mater. 156, 97 (2018).
- (34) L. Wang, J. Hoyt, N. Wang, and N. Provatas, arXiv 1810.05298 (2018).
- (35) Y. Sun, F. Zhang, L. Yang, H. Song, M. I. Mendelev, C.-Z. Wang, and K.-M. Ho, Phys. Rev. Materials 3, 023404 (2019).
- (36) L. Zhao, G. B. Bokas, J. H. Perepezko, and I. Szlufarska, Acta Mater. 142, 1 (2018).
- (37) H.-B. Yu and K. Samwer, Phys. Rev. B 90, 144201 (2014).
- (38) W. M. Brown, P. Wang, S. J. Plimpton, and A. N. Tharrington, Comp. Phys. Comm. 182, 898 (2011).
- (39) W. M. Brown, A. Kohlmeyer, S. J. Plimpton, and A. N. Tharrington, Comp. Phys. Comm. 183, 449 (2012).
- (40) W. M. Brown and Y. Masako, Comp. Phys. Comm. 184, 2785 (2013).
- (41) See Supplemental Material [url] for technical details of simulations and experiments, the calculation details of string-like motions and the detailed intermediate scatter functions, which includes Refs. [42-44].
- (42) Z. Ye, F. Zhang, Y. Sun, M. C. Nguyen, S. H. Zhou, L. Zhou, F. Meng, R. T. Ott, E. Park, M. F. Besser, M. J. Kramer, Z. J. Ding, M. I. Mendelev, C. Z. Wang, R. E. Napolitano, and K. M. Ho, Phys. Rev. Materials 1, 055601 (2017).
- (43) J. Horbach and W. Kob, Phys. Rev. E 64, 041503 (2001).
- (44) J.-P. Hansen and I. R. McDonald, Theory of Simple Liquids, 3rd ed. (Academic Press, London, 2006).
- (45) H.-B. Yu, R. Richert, and K. Samwer, Sci. Adv. 3, e1701577 (2017).
- (46) H.-B. Yu, M.-H. Yang, Y. Sun, F. Zhang, J.-B. Liu, C. Z. Wang, K. M. Ho, R. Richert, and K. Samwer, J. Phys. Chem. Lett. 9, 5877 (2018).
- (47) C. Donati, J. F. Douglas, W. Kob, S. J. Plimpton, P. H. Poole, and S. C. Glotzer, Phys. Rev. Lett. 80, 2338 (1998).
- (48) F. W. Starr, J. F. Douglas, and S. Sastry, J. Chem. Phys. 138, 12A541 (2013).
- (49) H. Zhang, C. Zhong, J. F. Douglas, X. Wang, Q. Cao, D. Zhang, and J.-Z. Jiang, J. Chem. Phys. 142, 164506 (2015).
- (50) Th. Voigtmann and J. Horbach, Phys. Rev. Lett. 103, 205901 (2009).
- (51) H. W. Cho, G. Kwon, B.J. Sung, and A.Yethiraj, Phys. Rev. Lett. 109, 155901 (2012).
- (52) J. Bosse and Y. Kaneko, Phys. Rev. Lett. 74, 4023 (1995).
- (53) B. Cui, Z. Evenson, B. Fan, M.-Z. Li, W.-H. Wang, and A. Zaccone, Phys. Rev. B 98, 144201 (2018).
- (54) R. J. Xue, L. Z. Zhao, B. Zhang, H. Y. Bai, W. H. Wang, and M. X. Pan, Appl. Phys. Lett. 107, 241902 (2015).
Supplemental Material for “Predicting Complex Relaxation Processes in Metallic Glass”
In this Supplemental Material we provide technical details of simulations and experiments in Sec. S1 and S2. In Sec. S3 we provide the calculation details of string-like motions and show the correlation between the peaks of -relaxation and long string-like motions is independent to the threshold. In Sec. S4, we show the detailed intermediate scatter functions (ISF) for Al and Sm.
S1 Details of molecular dynamics simulation
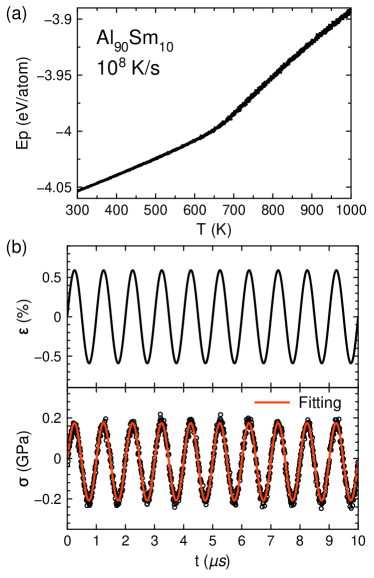
The molecular dynamics (MD) simulations were carried out using the Finnis-Sinclair potential mys1 with a 32,000-atom model of AlSm. The AlSm melt were first well equilibrated at 1300K for 10 , followed by a continuous cooling to 200 K with a cooling rate K/s, using NPT ensemble (that is, constant atom number, pressure, and temperature) and Nose-Hoover thermostat. The MD time step is 2 . The energy change during the cooling process is shown in Fig. S1(a), which indicates a clear glass transition.
The MD simulation of DMS (MD-DMS) mys5 was performed during the cooling process, covering a wide temperature range from the deeply undercooled liquid to low-temperature glass. Specifically, at a temperature , we applied a sinusoidal strain , with a oscillation period (related to frequency ) and a strain amplitude , along the direction of the metallic glass (MG) model. The resulting stress were measured and fitted to . is the phase difference between stress and strain. is a linear term and usually small. One example is shown in Fig. S1(b). The strain was applied by a smooth change of the box length along the direction, whereas stresses were directly measured from each component of the pressure. From these values, storage () and loss () moduli are calculated as and , respectively. A strain amplitude was applied in all the MD-DMS, which ensured the deformations do not change the structure of the MG. The ensemble (constant number of atoms, volume, and temperature) were used during the MD-DMS simulations. 10 cycles were applied for each MD-DMS to measure the storage and loss moduli. All MD simulations were performed using the GPU-accelerated LAMMPS code mys2 ; mys3 ; mys4 .
S2 Details of Experiments
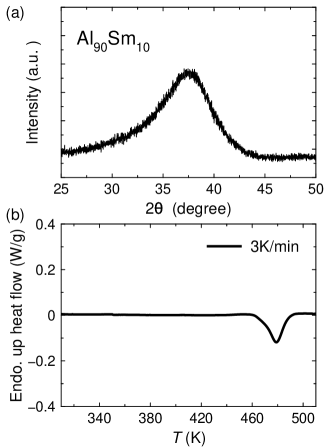
Sample preparations - The alloy ingot was prepared from a mixture of pure elements Al and Sm (purity wt ) by arc melting under the protection of high purity Argon atmosphere. In order to ensure the chemical homogeneity, the alloy was re-melted at least five times with magnetic stirring. The glassy ribbons were obtained via the melt-spinning. The amorphous nature of the ribbons was confirmed by X-ray diffraction (XRD, Bruke D2 phaser) which is shown in Fig. S2(a).
Dynamical mechanical analysis - The relaxation dynamics of the MG was experimentally studied by a dynamical mechanical analyzer (DMA, TA Q800) using liquid Nitrogen for temperature control, which allows us to reach the cryogenic temperature (down to ). The measurements were conducted during a temperature ramping of 3 K/min together with a film tension oscillation using the discrete testing frequencies of 0.5, 2, 4, 8 and 16 Hz. The measured loss moduli are fitted with three Gaussian functions as shown in Fig. S3. The peak temperatures of and relaxation processes are compared with simulation results in Fig. S3(f), which shows a clear Arrehenius relation with the oscillation periods. Note the experimental relaxation peaks cannot be directly fit to Gaussian functions because of the lack of data. To obtain a curve to guide eyes, we extrapolate simulation data to experimental frequencies to obtain initial guesses of peak positions. The peak shape is adjusted by fixing the fitting of and peaks via the Levenberg-Marquardt nonlinear fitting algorithm implemented in the MagicPlot software (see Nonlinear Curve Fitting in MagicPlot software manual, http://magicplot.com/wiki/fitting).
Calorimetry measurements - To ensure the glassy state of samples during the DMA, we performed differential scanning calorimetry (DSC, Mettler -Toledo ADSC2) measurement with same heating rate in DMA. The measurements were performed under high purity nitrogen atmosphere at a flow rate of mL/min. To ensure the reliability of the data, the temperature and enthalpy scales were calibrated using the melting transitions of pure Indium and Zinc. In order to get a better accuracy, all the samples have a similar mass, about 12 mg. Each run was followed by a second run (on a fully crystallized sample) to obtain a baseline. As shown in Fig. S2(b), there is no heat flow in the temperature range of DMA experiments. However, the glass sample indeed devitrified at as observed previously in Ref.ye2017 , which makes an upper limit temperature for DMA measurements.
S3 String-like motions
The string-like motions are recognized by analyzing the atomic rearrangement within the time interval of strain oscillation . The displacement of atom is computed by , where is the atom position at the beginning of -th deformation iteration and is at the end of the deformation. This definition avoids any atomic displacement caused by the overall deformation of simulation box during MD-DMS. The atoms with , i.e. the first minima of as shown in Fig. 3(a) of the maintext, are defined as fast-moving atoms. If a fast-moving atom jumps to the initial position of another fast-moving atom after a deformation period, the atoms is defined as a string-like-moving atom. This can be express as , where corresponds to the most probable displacement, i.e. the first peak position of .
In Fig. S4, we compute the ratio of atoms involved in the long-string motions with different long-string threshold . While the height of changes with the threshold, the peak position keeps constant. It clearlt indicates the correlation between -relaxation and long string-like motions is independent to the threshold .
S4 intermediate scattering function
The self intermediate scattering functions (ISF) are computed for both Al and Sm atoms in the AlSm model by
| (S1) |
To measure the -relaxation time, the magnitude of wave vector is chosen as the first peak position of the structure factor , which is (with minor temperature dependence). The ISF results are shown in Fig. S5. The -relaxation time is obtained when the ISF decayed to simpleliquid ; kob2001 .
References
- (1) M. I. Mendelev, F. Zhang, Z. Ye, Y. Sun, M. C. Nguyen, S. R. Wilson, C. Z. Wang, and K. M. Ho, Model. Simul. Mater. Sci. Eng. 23, 045013 (2015).
- (2) H.-B. Yu and K. Samwer, Phys. Rev. B 90, 144201 (2014).
- (3) W. M. Brown, P. Wang, S. J. Plimpton, and A. N. Tharrington, Comput. Phys. Commun. 182, 898 (2011).
- (4) W. M. Brown, A. Kohlmeyer, S. J. Plimpton, and A. N. Tharrington, Comput. Phys. Commun. 183, 449 (2012).
- (5) W. M. Brown and M. Yamada, Comput. Phys. Commun. 184, 2785 (2013).
- (6) Z. Ye, F. Zhang, Y. Sun, M. C. Nguyen, S. H. Zhou, L. Zhou, F. Meng, R. T. Ott, E. Park, M. F. Besser, M. J. Kramer, Z. J. Ding, M. I. Mendelev, C. Z. Wang, R. E. Napolitano, and K. M. Ho, Phys. Rev. Materials 1, 055601 (2017).
- (7) J. Horbach and W. Kob, Phys. Rev. E 64, 041503 (2001).
- (8) J.-P. Hansen and I. R. McDonald, Theory of Simple Liquids, 3rd ed. (Academic Press, London, 2006).