Dissecting the hot bubbles in LMC-N57 with XMM-Newton
Abstract
We present a study of the diffuse X-ray emission from the star forming region LMC-N 57 in the Large Magellanic Cloud (LMC). We use archival XMM-Newton observations to unveil in detail the distribution of hot bubbles in this complex. X-ray emission is detected from the central superbubble (SB) DEM L 229, the supernova remnant (SNR) 0532675 and the Wolf-Rayet (WR) bubble DEM L 231 around the WR star Br 48. Comparison with infrared images unveils the powerful effect of massive stars in destroying their nurseries. The distribution of the hot gas in the SNR and the SB display their maxima in regions in contact with the filamentary cold material detected by IR images. Our observations do not reveal extended X-ray emission filling DEM L 231, although several point-like sources are detected in the field of view of this WR nebula. The X-ray properties of Br 48 are consistent with a binary WN4O as proposed by other authors. We modelled the X-ray emission from the SB and found that its X-ray emission can be simply explained by pressure-driven wind model, that is, there is no need to invoke the presence of a SN explosion as previously suggested. The pressure calculations of the hot gas confirms that the dynamical evolution of the SB DEM L 229 is dominated by the stellar winds from the star cluster LH 76.
1 Introduction
During their lives, massive stars (10 M⊙) drive the evolution of the interstellar medium (ISM) via energy and momentum. This feedback is mainly due to their stellar winds, radiation pressure and supernova (SN) explosions (Krumholz et al., 2014). At large scales (1 kpc), stellar UV radiation from young hot stars play a crucial role in the evolution galaxies by regulating star formation (Ostriker et al., 2010). Stellar feedback is a necessary effect for formation and evolution of galaxies in numerical simulations. This has been found to prevent the ”cooling catastrophe” (Kereš et al., 2009), the cause of low stellar density and stellar population gradients observed in dwarf galaxies (Mashchenko et al., 2008).
At smaller scales (100 pc), stellar feedback of star clusters influence their surrounding giant molecular clouds. This stellar feedback is an important parameter in explaining why only a small fraction of the giant molecular cloud mass is converted into stars, whilst driving the dynamic of the region. Massive stars dissipate the surrounding molecular cloud by the combination of their powerful stellar winds and the extra contribution from SN explosions, creating the so-called bubbles and superbubbles (SB; Chu & Mac Low, 1990; Chu et al., 1995; Cooper et al., 2004; Oey, 1996a, b; Rosado, 1986; Georgelin et al., 1983; Dunne et al., 2001; Reyes-Iturbide et al., 2014; Zhang et al., 2014; Reyes-Iturbide et al., 2009; Velázquez et al., 2013; Rodríguez-González et al., 2011).
Numerical simulations have shown that both effects, ionization photon flux and winds, have to be taken into account to produce a more accurate study of the dynamics of bubbles around massive stars (e.g., Toalá & Arthur, 2011; Dwarkadas & Rosenberg, 2013; Freyer et al., 2006). In those cases, the hot bubble inside the H ii region still dominates the dynamics of the nebulae around massive stars. However, there are some observational works that suggest otherwise. For example, Lopez et al. (2014) analyzed multi-wavelength data to test the driving mechanisms of SBs in the Magellanic Clouds (MCs). These authors estimate different pressure contributions from stellar radiation (), the dust-processed radiation (), the warm ionized gas () and that coming from the adiabatically-shocked hot bubbles (). These authors found that the warm ionized medium dominates over the rest of the feedback processes. So that the warm ionized gas plays a major role in the dynamics of star forming regions. Lopez et al. (2014) found a characteristic radius where the given source transitions from radiation pressure drive the gas pressure driven by setting the total radiation pressure equal to the warm gas pressure. This suggests that the radiation pressure is important in the range pc. The presented sample of analyzed SBs have radii between for which they are too large to the radiation pressure dominates in the dynamic of the shells from HII regions. We note that Lopez et al. (2014) studied the properties of the hot gas in the star forming regions in the MCs by analyzing ROSAT X-ray observations. Although this satellite had a good spectral sensitivity in the soft X-ray range (where hot bubbles emit their bulk of X-ray emission) current X-ray missions have a superior effective area and angular and spectral resolution, which allows a better rejection of contaminant point sources.
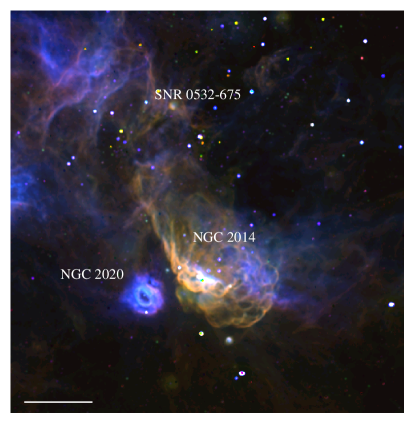
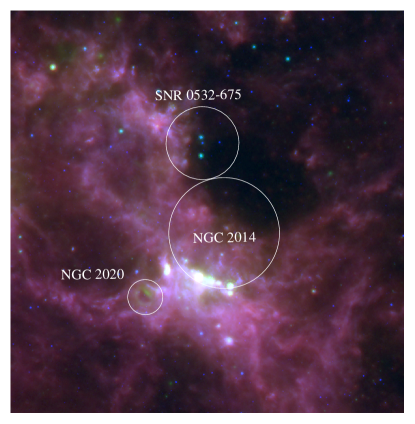
We have started a project to study the X-ray properties of star forming regions in the MCs using XMM-Newton observations to peer into this discrepancy. In this work we study the dynamical role of stellar feedback mechanisms in the LMC-N 57 complex (see Fig. 1). In particular, SBs in the Large Magellanic Cloud (LMC) represent excellent cases of study due to its nearly face-on disk (inclined by to the line of sight), and because the interstellar reddening toward this galaxy is small. Furthermore, the LMC provides a sample of more than 200 SBs (see, e.g., the original work of Henize, 1956) at a common distance (Feast, 1999) that are resolvable by observations of current X-ray satellites.
LMC-N57 is composed by three main regions: a central superbubble (DEM L 229 or NGC 2014), a Wolf-Rayet (WR) nebula (DEM L 231 or NGC 2020) and the SNR 0532675 located north from the SB (see Fig. 1). The SB seems to have formed as the result of the feedback from the OB association (OBA) LH 76 (Lucke & Hodge, 1970). Degioia-Eastwood et al. (1993) used optical photometry to determine that LH 76 appears to be coeval with an estimated age of yr ago. Although this is a sufficient time for the first supernova explosion to occur, radio observations reported a spectral index (McGee et al., 1978), more in agreement with H ii region radio emission than the typical values for a SNR. On the other hand, the WR nebula DEM L 231 has a ”double-rim” morphology with a physical size of 24 pc17 pc that seems to have been produced by the stellar wind of only one star, the WR star Br 48 (Chu et al., 1999).
Early analysis of X-ray observations of LMC-N 57 obtained with the Einstein observatory suggested at a relatively low X-ray luminosity compared to other star forming complexes (Wang & Helfand, 1991). For example, Chu & Mac Low (1990) reported a luminosity of erg s-1 for LMC-N 57 while other complexes reached X-ray luminosities at least two orders of magnitude higher. The analysis of ROSAT PSPC observations presented by Dunne et al. (2001) showed that the SB is filled with hot gas, that the SNR 0532675 is an X-ray bright source and that no extended emission is detected from the WR bubble Br 48 (see also figure 7 in Points et al., 2001). The best-fit model to the PSPC spectrum resulted in a plasma temperature of keV ( K) and an X-ray luminosity in the 0.5–2.4 keV energy range of erg s-1. Dunne et al. (2001) compared their results with those of pressure-driven models and concluded that the X-ray emission detected from the 13 sources analyzed in that work was the result of other physical processes such as SN explosions in addition to stellar winds. We note, however, that their X-ray luminosity estimates for LMC-N 57 were very close to the observable ones.
In this paper we present the analysis of archival XMM-Newton observations in comparison with optical and IR observations. The XMM-Newton view of LMC-N 57 largely improves the previous X-ray studies of this complex. This study unveils the detailed distribution of the X-ray-emitting gas in LMC-N 57. We compare our results with the theoretical predictions from wind-blown bubble formation and X-ray emission. This paper is organized as follows. In Section 2 we present a description of the analytical model of SBs. Section 3 describes our XMM-Newton observations. The distribution of the X-ray-emitting gas is described in Section 4 and the analysis of its spectral properties is presented in Section 5. Finally, the discussion and conclusions are presented in Sections 6 and 7, respectively.
2 Theoretical predictions of the X-ray emission from superbubbles
The standard model of bubble formation by stellar winds was proposed by Weaver et al. (1977). Although the model considers a single wind source, it has been extended to describe the structure and evolution of the SB formed by several stars in a cluster (Chu et al., 1995).
The stars in the OBA deposit mechanical energy into the ISM through their stellar winds. This is given by
| (1) |
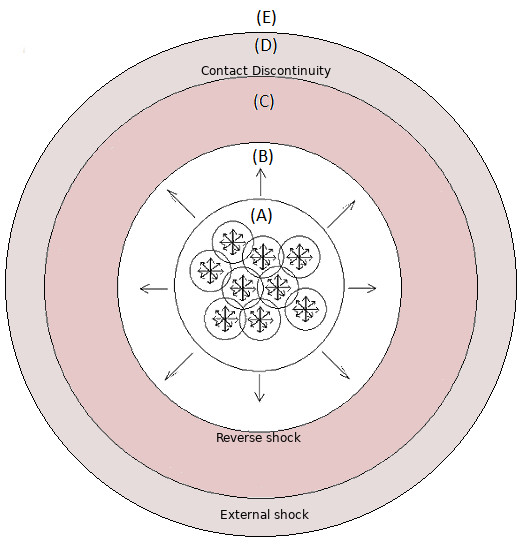
where and are the mass-loss rate and the wind velocity of -th star, respectively, and is the total number of stars. The interaction of these winds with ISM creates a SB structure with the following four zones (see Figure 2):
(A) a central zone where the stars are located and inject their free-flowing winds. This region is delimited by the stellar cluster radius. Outside this region a common cluster wind is established;
(B) a free wind zone is the region between the OBA radius and reverse shock. This region is filled by the unperturbed stellar OBA wind;
(C) a zone of shocked cluster wind, located between the reverse shock (or inner shock) and the contact discontinuity. This material has been shock-heated and reaches temperature in excess to K that emits primarily in X-rays;
(D) an external zone, between the contact discontinuity and the leading shock. This zone contains the shocked ISM material that has been swept by the leading shock with an important optical line emission;
(E) the unperturbed ISM.
In zone (A), stellar winds of the massive stars collide with each other, thermalizing all the gas injected inside the cluster volume forming a common OBA wind, which produces an over-pressure inside the cluster volume with respect to its environment. The OBA wind expands freely inside zone (B). Zone (C) is formed by gas of the stellar cluster wind that has been shocked by the inner or reverse shock. This zone is adiabatically-shocked and its post-shock temperature can be estimated to exceed 107–108 K (Dyson, & Williams, 1997). Finally, zone (D) is formed by the shocked ISM gas that emits mainly in optical, is the densest zone according to the standard model.
Weaver et al. (1977) showed that the equations that describe the dynamics of the shell or zone (D) can be expressed as:
| (2) |
| (3) |
where is the radius of the SB in pc, is the expansion velocity of the SB, is the mechanical luminosity of the OBA in units of erg s-1, and and are the number density of the ambient medium in units of cm-3 and the age of the bubble in yr, respectively.
For the case that the radius of the shell and its expansion velocity are known, it is possible to determine the ambient density in terms of wind luminosity (Eq. 1), radius, and bubble age by the relation
| (4) |
According to Weaver et al. (1977), thermal conductivity regulates the temperature of the hot bubble toward its outer edge. The region in contact with the swept ISM reduces its temperature to values K while raising its density, producing soft X-ray emission. The X-ray luminosity that arises from the internal conduction front can be estimated following Chu & Mac Low (1990) as
| (5) |
where is the gas metallicity, and can be expressed as
| (6) |
with
| (7) |
3 XMM-Newton observations and data reduction
The star forming complex LMC-N 57 was observed by XMM-Newton with the European Photon Imaging Camera (EPIC). The observations were performed on 2006-08-28 and correspond to the Obs. ID 0400320101 (PI: R. Williams). The EPIC-MOS cameras were operated in the Full Frame Mode whilst the EPIC-pn camera was operated in the Extended Full Frame Mode. The three EPIC observations were obtained with the thin optical filter with a total observation time of 46.71 ks. The EPIC-pn, MOS1, and MOS2 cameras have exposure times of 42.57, 46.41, and 46.57 ks, respectively. The XMM-Newton pipeline products were processed using the XMM-Newton Science Analysis Software (sas version 16.1) and the calibration files obtained on 2019-01-15.
The Observation Data Files were processed using the sas tasks epproc and emproc to produce the corresponding event files. In order to excise periods of high-background levels, we created light curves binning data by 100 s for each of the EPIC cameras in the 10–12 keV energy range. Background was considered high for count rate values higher than 0.8, 0.4, and 0.4 counts s-1 for the pn, MOS1 and MOS2 cameras, respectively. The final useful time for each camera was 12.67 ks (pn), 26.56 ks (MOS1), and 27.65 ks (MOS2).
In order to produce high-quality maps of the distribution of the X-ray emission, we used the Extended Source Analysis Software package (esas; Kuntz & Snowden, 2008; Snowden et al., 2004, 2008). The esas tasks are tailored to successfully remove the contribution from the astrophysical background, the soft proton background, and solar wind charge-exchange reactions. A major difference between the esas task and those from the sas task is that they apply very restrictive selection criteria of events and their final net exposure times are 7.20 ks, 10.65 ks, and 12.07 ks for the pn, MOS1, and MOS2 cameras, respectively.
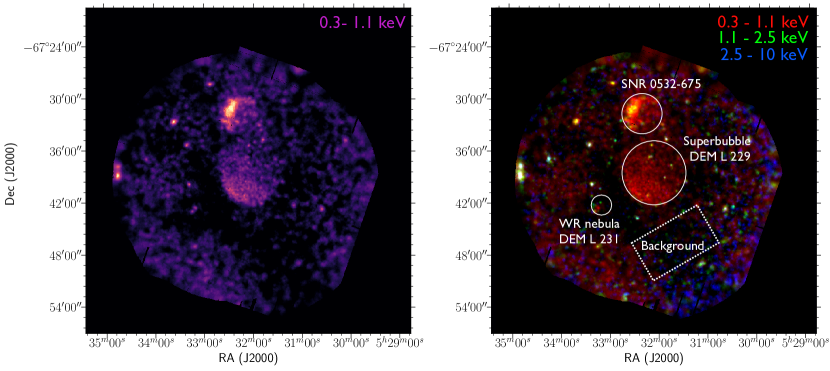
We created three EPIC images in the 0.3–1.1 keV, 1.1–2.5 keV, and 2.5–10 keV energy ranges that are labeled as soft, medium and hard bands. Following the esas cookbook, individual pn, MOS1, and MOS2 images were created, merged together and, finally, corrected by their exposure maps. The resultant exposure-map-corrected, background-subtracted EPIC (pnMOS1MOS2) image of the soft X-ray emission as well as a colour-composite image combining the three bands are shown in Figure 3. Each band image has been adaptively smoothed using the esas task adapt requesting 20 counts under the smoothing kernel for the soft and medium bands and 10 counts for the hard band.
4 Distribution of the X-ray-emitting gas in LMC-N 57
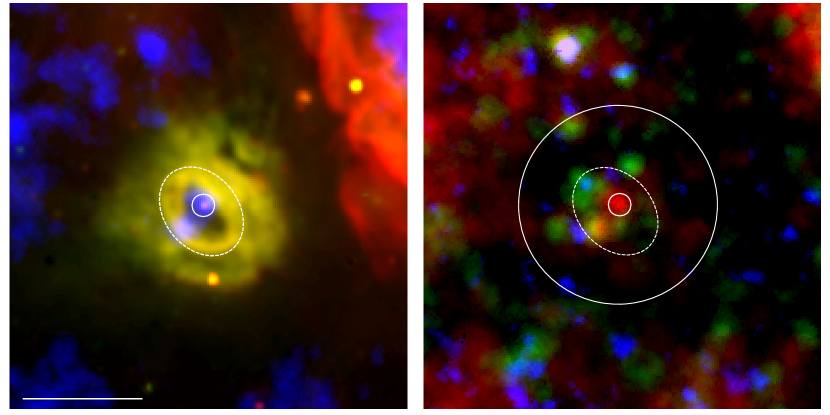
Figure 3 shows that the X-ray emission comes from the three regions in LMC-N 57. A large number of point-like sources are also detected in the vicinity of LMC-N 57. The SB DEM L 229 emits mainly in the soft X-ray band and exhibits a relatively round shape with its maximum located towards the south-east close to the position of the OBA LH 76. Its angular size is 3.93′ in radius and corresponds to a physical size of 60 pc. On the other hand, the SNR 0532675 emits considerably in the medium X-ray band suggesting noticeable spectral differences with respect of the X-ray-emitting gas in DEM L 229, but a similar distribution of the hot gas is appreciated. Its maximum towards the north-east and its angular size is 2.5′ with a physical size of 36 pc. No extended X-ray emission is detected in the hard X-ray band.
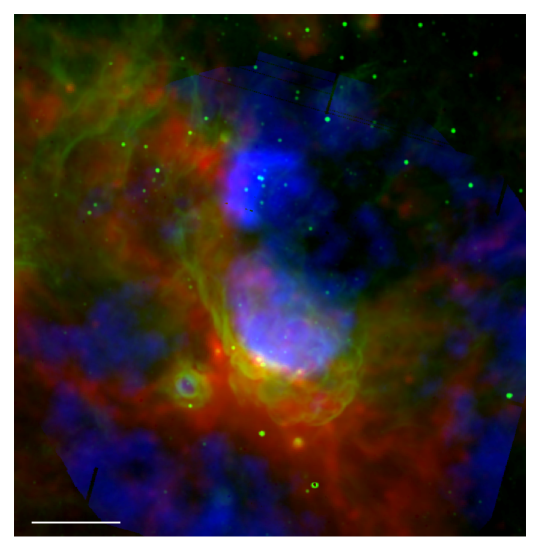
Figure 3 also suggests that the X-ray emission from the WR nebula around Br 48 is due to the presence of point sources. This is further illustrated in Figure 4. This figure shows that the X-ray emission comes from (at least) 10 point sources located inside the inner shell in DEM L 231. We note that the presence of these sources hinders the search and analysis of diffuse X-ray emission from DEM L 231 as in galactic WR nebulae (see Toalá et al., 2016, 2017, and references therein).
Finally, to produce a clean view of the distribution of the diffuse X-ray emission, we used the ciao (version 4.9; Fruscione et al., 2006) dmfilth task. All point sources were excised from the soft X-ray band and the resultant image is compared with the nebular H and that from the Spitzer MIPS 24 m images. Figure 5 shows that some faint X-ray diffuse emission is leaking towards the north-east region, an apparent low-density region in LMC-N 57 (see also Fig. 1). It seems that the hot gas from the SB and from the SNR are merging together in this low-density region. There is also a spatial coincident between the presence of dust unveiled by the IR observations and the lack of X-ray emission. IR emission delineates that coming from the X-ray emission.
5 Spectral analysis
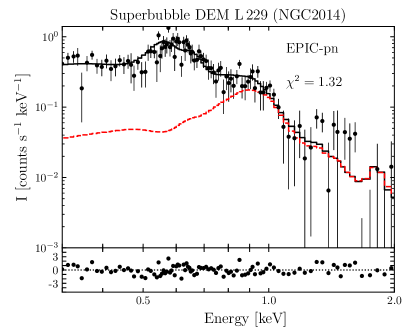
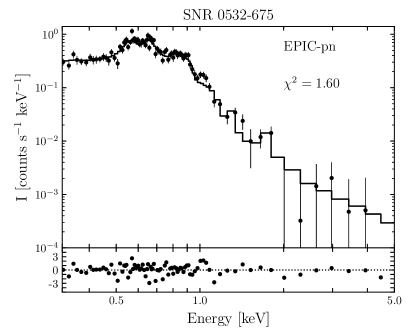
To study the physical properties of the X-ray-emitting gas we have extracted spectra from different regions in LMC-N 57. Circular apertures with angular radii of 2.3′ and 3.7′ (which correspond to 33 pc and 54 pc) have been used to extract spectra from the SNR 0532675 and DEM L 229, respectively. The background spectrum was extracted from a region near to DEM L 229 with no contribution from extended X-ray emission (see Figure 3). In all cases, contaminant point-like sources have been excised. As shown in the previous section, the presence of several point-like sources in the vicinity of Br 48 do not allow us to extract the spectrum of a possible extended emission from the WR nebula DEM L 231. Nevertheless, we extracted the X-ray spectrum of its progenitor WR star Br 48. The X-ray spectra have been obtained by using the sas task evselect and produced the associated calibration matrices using the arfgen, and rmfgen tasks. The background-subtracted spectra from the SB DEM L 229 and the SNR 0532675 are shown in Figure 6. Unfortunately, the quality of the background-subtracted spectra of Br 48 was low and only fits by eye were performed (see below).
The spectral analysis was performed using xspec (version 12.9; Arnaud, 1996). In accordance with previous studies of the extended X-ray emission from SBs in the LMC we have modelled the X-ray spectra using the absorbed vapec optically-thin plasma emission model with tabs absorption model (Wilms et al., 2000). Initially, all abundances were set to ISM values of the LMC, but in order to improve the statistics of the fit, we left some elements as free parameters. Table 1 lists the abundance values initially adopted.
The resultant model spectra were compared with the observed X-ray spectra in the 0.3–5 keV energy range where statistics was used to evaluate the goodness of the fits. A minimum of 50 counts per bin was requested for the spectral fits.
| Element | (log) | Reference | |
|---|---|---|---|
| C | 0.20 | 7.90 | Korn et al. (2000) |
| N | 0.47 | 7.72 | Korn et al. (2000) |
| O | 0.21 | 8.25 | Maggi et al. (2016) |
| Ne | 0.28 | 7.53 | Maggi et al. (2016) |
| Mg | 0.33 | 7.10 | Maggi et al. (2016) |
| Si | 0.69 | 7.39 | Maggi et al. (2016) |
| S | 0.36 | 6.76 | Schenck et al. (2016) |
| Fe | 0.35 | 7.21 | Maggi et al. (2016) |
5.1 The superbubble DEM L 229
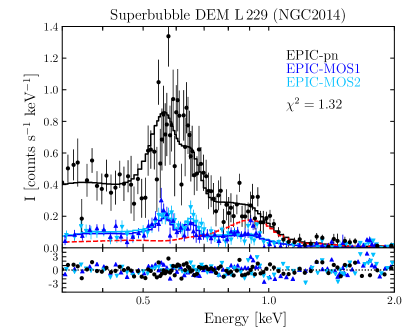
The EPIC spectra of DEM L 229 are shown in Fig 6 left panel. The SB was registered by the three EPIC cameras. The most important spectral features are a dominant X-ray peak between 0.5–0.6 keV which might be attributed to the O vii at 0.58 keV and a secondary peak more clearly seen in the MOS spectra appears between 0.6–0.7 keV and can be attributed to the O viii at 0.65 keV. The total count rate of the pn, MOS1, and MOS2 spectra are 330 counts ks-1, 77.5 counts ks-1, and 96 counts ks-1 and correspond to a total photon counts of 4180 counts, 2060 counts, and 2660 counts, respectively.
According to Hainich et al. (2014) the WR star BAT99 56 is located at the edge of the SB DEM L 229. Its estimated is 0.12 and translates into a column density of =6.96 cm-2. Thus, for this region we fixed this value for the following spectral analysis.
We first fitted the EPIC-pn spectrum with a two-temperature plasma emission model. The best-fit model () resulted in plasma temperatures of keV and keV with normalization parameters and of cm-4 and cm-4, respectively. Most of the element abundances converged to their ISM parameters except for the oxygen abundance. The best model suggest an overabundance of oxygen of 0.48 times solar, twice the initial ISM oxygen abundance (see Table 1). The absorbed flux in the 0.3–5.0 keV was erg cm-2 s-1, which corresponds to an intrinsic flux of erg cm-2 s-1. Thus, we estimated an X-ray luminosity of erg s-1.
Subsequently, we fitted simultaneously the three EPIC spectra. The best-fit model (=1.32) resulted in a two-temperature plasma emission model with temperatures keV and keV. The resultant normalization parameters for each component are cm-5 and cm-5, respectively. This model was achieved by leaving the oxygen abundance as a free parameter. This converged to 0.52 times its solar value (Anders & Grevesse, 1989). The absorbed and intrinsic fluxes in the 0.3–5.0 keV energy range are very similar to the fit performed to the EPIC-pn spectrum (see above): erg cm-2 s-1 and erg cm-2 s-1. The estimated X-ray luminosity is erg s-1. This model is plotted along side the background-subtracted EPIC spectra in Fig. 6 left panel. The contribution from the second temperature component to the EPIC-pn spectrum is also shown with a dashed (red) line.
Finally, we note that more complicated models, adding a power law component were also attempt in order to fit the marginal emission at energies above 2.0 keV, but we note that the best fit was not statistically better. For example, in the simultaneous fit to the three EPIC, the model was not as good () as the one described above. We further discuss this in Appendix A. Another model adopting a non-equilibrium ionisation model (see next subsection) was also attempted but resulted in unrealistic column density values and extremely high plasma temperatures.
5.2 SNR 0532675
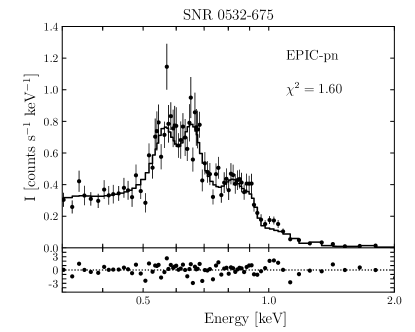
The SNR 0532672 was registered by the EPIC-pn and MOS2 detectors. Unfortunately, CCD 6 was no longer functional in the MOS1 camera by the time the observations were performed and corresponds to the area where the SNR should have been registered (see appendix F in Maggi et al., 2016). Thus, we only show the EPIC spectra extracted from the pn and MOS2 cameras in Fig.6 right panel. Similarly to the SB DEM L 231, the most prominent lines are those of the O vii at 0.58 and O viii at 0.65 keV, although the later is brighter in these spectra. The resultant count rate for the pn and MOS2 spectra are 330 counts ks-1 and 95 counts ks-1 which correspond to a total of 4180 and 2630 counts, respectively.
Similarly to the SB DEM L 299, we first modelled the EPIC-pn spectrum. The best-fit model () with plasma temperatures components of and with normalization parameters of cm-5 and cm-5. The oxygen abundance turned out be 0.82 times its solar value. The absorbed and intrinsic fluxes in the 0.3–5.0 keV are erg cm-2 s-1 and erg cm-2 s-1. The corresponding X-ray luminosity is erg s-1.
However, we note that a simpler model can be achieved by adopting a non-equilibrium ionisation (NEI) model as that described by Maggi et al. (2016). We modelled the EPIC-pn spectrum of SNR 0532675 with a vpshock, adopting those abundaces found by Maggi et al. (2016) and found very similar results as those listed in their table E.1. We fixed the plasma temperature to that obtained by those authors (=0.53 keV) and the best-fit model () resulted in a column density cm-2 and ionisation time-scale s cm-3. This model yielded an absorbed X-ray flux of erg cm-2 s-1 with an intrinsic flux of erg cm-2 s-1, which corresponds to an X-ray luminosity of erg s-1. This model is presented in Figure 6 in comparison with the EPIC-pn spectrum.
We remark that no further discussion on the X-ray properties of SNR 0532675 will be pursuit in this work as it has been previously done by Maggi et al. (2016).
5.3 The WR star Br 48
As mentioned before, there are several point-like sources projected inside DEM L 231 hampering a proper search and analysis of extended emission in this WR nebula. Thus, we only concentrate in the analysis of the X-ray emission from its progenitor WR star, Br 48.
DEM L 231 was registered by the three EPIC cameras. Unfortunately, its resultant count rates are low and a detailed spectral analysis is not possible. The EPIC-pn, MOS1, and MOS2 count rates are 0.63 counts ks-1, 0.37 counts ks-1, and 0.18 counts ks-1 with total photon counting of 8, 10, and 5 counts, respectively.
The column density was fixed to =9.3 cm-2 estimated from the value of 0.16 reported by Hainich et al. (2014). The observed spectrum can be reasonably well described by a plasma emission model with temperature =0.40 keV. We estimated the absorbed and intrinsic fluxes as =1.5 erg cm-2 s-1 and =2.5 erg cm-2 s-1, respectively. The estimated X-ray luminosity is =7.3 erg s-1 which is consistent to what is found for other WR stars in the LMC (Guerrero, & Chu, 2008) and in our Galaxy (Oskinova, 2015).
6 Discussion
| Star | Spectral type | (km s-1) | log |
|---|---|---|---|
| L1 | O4If | 2500 | -4.92 |
| L21 | O4If | 2500 | -4.92 |
| L51 | B0Ia | 1800 | -5.15 |
| L59 | B2Iab | 1500 | -5.37 |
| L70 | B0III | 1600 | -6.90 |
| S4 | O8V | 1900 | -6.89 |
| S6 | O8I | 2000 | -5.04 |
Dunne et al. (2001) presented the first analysis of X-ray observations of LMC-N 57 along with another 12 star forming regions in the LMC. Their ROSAT X-ray observations were able to unambiguously detect X-rays from the SNR 0532675 (previously discovered by Mathewson et al., 1985, using radio and X-ray observations from MOST and Einstein telescopes). Although LMC-N 57 was detected near the edge of the ROSAT PSPC detectors, where the point-spread function is bad, the authors found that the X-ray-emitting gas from the DEM L 229 was confined by the nebular material (see also Points et al., 2001). No X-ray emission was detected from the WR nebula DEM L 231.
The analysis of the XMM-Newton observations of LMC-N 57 presented here have unveiled, in unprecedented detail, the distribution of its X-ray emission. The X-ray-emitting gas within DEM L 229 is nicely delineated by its nebular emission detected in H and the dust emission detected with the Spitzer MIPS 24 m toward the south, but it seems to be leaking out to a low density region toward the north and, very likely, combining with the extended emission from the SNR 0532675 (see Fig. 3). It is clear that the SB extends further toward the south but not diffuse X-ray emission is detected in this region. It might be due to the higher column density. Inspection of archival Herschel PACS and SPIRE observations (not shown here) suggest at the presence of very cold dust toward the southern region of DEM L 229.
We can theoretically estimate the X-ray luminosity from the SB DEM L 229 by using the equations described in Section 2. First, we searched for the massive stellar content in DEM L 229 presented in Wilcots et al. (1996). Table 2 lists the spectral types and terminal wind velocities of the most massive stars in LH 76. We have included the characteristic values for the mass-loss rates associated with stars of such spectral types from de Jager et al. (1988). In order to use Eq. 5 we need to estimate the ISM density, which was obtained from Eq. 4 and a dynamical age of 0.8 Myr was also considered (Eq. 2). The estimated X-ray luminosity is =3.11035 erg s-1. If we now use Eq. 8 to estimate the X-ray luminosity, adopting a physical radius of 60 pc and an expansion velocity for DEM L 229 of 45 km s-1 (Chu et al., 1999) we obtain =1.61035 erg s-1. Both estimates of the X-ray emission from DEM L 229 are very similar to the estimated value from the observations (see Section 5.1), also very similar to that estimated by analytical calculations presented in Dunne et al. (2001) (see column 5 in table 5 of that paper). We can only conclude that the X-ray emission from the SB DEM L 229 is the product of the combination of the stellar winds from the massive stars in LH 74. In accordance to McGee et al. (1978) (see Section 1), we found that there is no need to suggest that a SN has exploded inside DEM L 229 to enhance the X-ray emission.
We note, that the X-ray luminosity presented in Dunne et al. (2001) and obtained from spectral fitting, that is 8.11035 erg s-1, is twice the luminosity obtained in Secion 5.1. This discrepancy can be amended by considering the limited spatial resolution of ROSAT satellite which made it difficult to identify and excise unrelated point-like sources in the field of view of DEM L 229. The present analysis of XMM-Newton observations of LMC-N 57 call for a detailed analysis of the distribution of the X-ray-emitting gas and spectral properties from star forming complexes in the MCs.
It is interesting to notice that most star forming regions in the LMC that have been studied in X-rays have relatively high X-ray luminosities compared to LMC-N 57 (see, e.g., Dunne et al., 2001; Jaskot et al., 2011; Reyes-Iturbide et al., 2014; Zhang et al., 2014). The fact that these high X-ray luminosities can not be explained purely by the pressure-driven bubble model (see Section 2) has led to the suggestion that the contribution from SN explosions power the X-ray emission to such high observed luminosities ( erg s-1). In particular, the SN explosions that occur very close to the edges of the complex hitting the nebular material (Chu & Mac Low, 1990). The latter also corroborated by numerical simulations (e.g., Rodríguez-González et al., 2011).
Unfortunately, the search of extended X-ray emission from the WR nebula DEM L 231 is hampered by the presence of other point-like sources projected inside the nebula. We note that DEM L 231 is also surrounded by a dust-rich medium which might easily extinguish the soft X-ray emission. Nevertheless, we were able to extract the X-ray spectrum of Br 48, the so-called progenitor star of DEM L 231. Hainich et al. (2014) presented the analysis of Br 48 by means of the stellar atmospheres code PoWR111http://www.astro.physik.uni-potsdam.de/~wrh/PoWR/powrgrid1.php and concluded that this WR stars is a binary of the WN4O9 type. We note, however, that the same group have produced a more recent analysis of WR binaries in the LMC. Their most recent analysis of Br 48 (a.k.a., BAT99 59) suggests that this WR star is composed by a WN3O6 III system (see Shenar et al., 2019). The bolometric luminosity of their best-fit model is log=6.45. This means that Br 48 fulfills the relation exhibit in O-star binaries and WN binary stars (see figure 1 in Oskinova, 2015).
The three component regions of LMC-N 57 seem to have been formed from the same giant filamentary structure unveiled by IR observations (see Fig. 1). If one assumes that the progenitor stars of these three component regions were formed at the same time, we can argue that the most massive stars were located towards the north of LMC-N 57, where the SNR 0532-675 was formed. The next massive star would be the WR star Br 48, which is about to explode as a SN inside DEM L 231. We have demonstrated that no SN explosion has occurred inside DEM L 229, that is, the less massive hot stars are those from the LH 74 star cluster. LMC-N 57 is a clear example of the effect of massive stars in their environment. In a radius of 150 pc massive stars in different stages of evolution destroying their natal cloud.
The fact that the X-ray luminosity of the SB can be explained by only accounting for the contribution from the stellar winds of the hot stars in DEM L 229 led us to suggest that the oxygen enhancement might be due to mixing with the X-ray-emitting gas from the SNR as hinted by Figure 5. Nevertheless, we note that the oxygen abundance of the SB DEM L 229 is only twice the averaged value reported by Maggi et al. (2016). These authors list oxygen abundances within 0.1 and 0.5 times the solar value in their figure 5, that is, the oxygen abundance is still somewhat consistent with ISM measurements in the LMC.
Finally, we note that the estimated X-ray luminosity of the SNR 0532675 obtained here is consistent with theoretical calculations. Leahy (2017) estimated an age of kyr, which is a typical value of the Sedov-Taylor phase in SNRs. Using equation 1 from Chu & Mac Low (1990), adopting a radius of pc, an abundance of 0.3 times solar and an ISM density of cm-3 (Leahy, 2017), we can estimate an X-ray luminosity of erg s-1. In close agreement of what was reported in Section 5.2.
6.1 On the pressure components of DEM L 229
We have calculated the direct radiation pressure assuming a spherical H II region and eq. 3 in Pellegrini et al. (2007) used in the following form
| (9) |
Here, photon s-1 is the ionizing photon flux emitted by the star cluster, pc is the radius of the SB, eV is the mean photon energy by an O-type star, and is the speed of light. This gives dyn cm-2
The electron density of the optical shell can be obtained through the rms electron density determined from the H surface brightness, by using the equations 8-10 from Chu et al. (1995). In the case of DEM L 229, an emission measure of =1500 cm-6 pc (Dunne et al., 2001) and an electron density of =8.7 cm-3 were obtained. Thus, the pressure of the nebular material is estimated to be dyn cm-2 (adopting a temperature of 104 K).
To estimate the pressure of the X-ray-emitting gas, we need to compute its electron density. For this, we can use the definition of the normalization parameter obtained from our spectral fitting in Section 5. This parameter can be written in a simplified form as
| (10) |
where is the volume of the X-ray-emitting region and is the distance to the source.
We first assume a spherical morphology and, using the normalization parameter of the best-fit model to the diffuse X-ray emission of DEM L 229, we obtain an electron density of =0.04 cm-3. Thus, the pressure of the X-ray-emitting gas in =1.2210-11 dyn cm-2. Although this value is of the order of that estimated for the ionized material, it only represents a lower limit value. According to the wind-blown bubble model described by Weaver et al. (1977), which describes fairly well the X-ray emission from DEM L 229, the soft X-ray emission comes only from a conduction layer at the outer edge of the hot bubble. We note that even in 2D and 3D numerical simulations of the formation of hot bubbles around single and groups of massive stars, this conductive layer can become unstable and form clumps and filaments close to the outer edge of the hot bubble. Still, the idea remains and the soft X-ray material has a relatively small volume compared to the total volume of the hot (unmixed) bubble (e.g., Dwarkadas & Rosenberg, 2013).
If we take a conservative value for the thickness of this mixing region, for example, 10 per cent of the total radius of the hot bubble the electron density is =0.065 cm-3 and the X-ray-emitting gas pressure is =210-11 dyn cm-2. Here we neglect the contribution of direct radiation pressure , because this one is two orders of magnitude less than or . Thus, the dynamics and evolution of the SB DEM L 229 is dominated by the pressure of its hot gas powered by the combination of stellar winds from the cluster of stars LH 76.
Assuming that the diffuse X-ray emission uniformingly fills the observed bubbles, is not an accurate way to estimate the density of the X-ray-emitting material nor its pressure. We note that both regions in the hot bubble, the unmixed material and that suffering from the thermal conductivity effect, have the same pressure (see for example figure 5 in Toalá & Arthur, 2011). Thus, the unmixed region of the hot bubble has a larger temperature, but a lower electron density. So that pressure remains constant through the hot bubble. We argue that the procedure used by Lopez et al. (2014) is not correct and underestimated the pressure values of their sample. Furthermore, we have also demonstrated here the effective area and angular resolution of the XMM-Newton compared to ROSAT. An improved analysis of the diffuse X-ray emission from the superbubbles in the MCs should be performed with higher-quality X-ray observations in order to shed light into the discussion about the pressure role of hot gas in star forming regions.
7 Conclusions
We have analyzed the XMM-Newton X-ray observations of the star forming region LMC-N 57. This complex is composed by a central SB DEM L 229, the SNR 0532675, and the WR nebula DEM L 231 around the WR star Br 48. Our observations allowed us to unveil the distribution of the X-ray-emitting gas with unprecedented detail. The comparison with optical and IR observations suggest that the combination of the feedback from the massive stars in these three regions are destroying their natal molecular cloud. Our findings can be summarized as:
-
•
The analysis of the distribution of the X-ray-emitting gas in LMC-N 57 confirms that DEM L 229 is filled with hot gas. The hot bubble is delimited by the southern molecular material but seems to be leaking out towards the northern region. The hot gas seems to be leaking out toward a low-density region in the northern region and, very likely, mixing with the hot gas produced by the SNR 0532675.
-
•
We found that the X-ray emission from the SB DEM L 229 is consistent with pressure-driven model. The X-ray luminosity estimated taking into account the stellar winds from the hot stars within this SB ( erg s-1) is very similar to that obtained from the spectral analysis of the XMM-Newton EPIC observations, erg s-1. There is no need to invoke the idea that a SN has exploded within DEM L 229. We argue that this finding is supported by an improved analysis of the X-ray observations compared to previous ROSAT observations. The current EPIC observations allow a better identification of contaminant point-like sources within DEM L 229.
-
•
The pressure-driven model used here suggests that the X-ray-emitting gas is produced at a conduction layer relatively thin compared to the size of the hot bubble. Adopting a conservative thickness for this conduction layer we estimate that the pressure of the hot gas is larger than the pressure of the ionized material. We argue that such geometric consideration should be taken into account when computing pressure values of for the X-ray-emitting gas from star forming regions. Finally we note that means that the radiation pressure does not contribute to the expansion of DEM L 229.
-
•
No diffuse X-ray emission is detected from the WR nebula DEM L 231. IR observations show the presence of cold dust surrounding DEM L 231, suggesting that the presence of soft extended X-ray emission might be easily extinguished by the high column density.
-
•
X-ray emission is detected from the WR star Br 48. Its luminosity is found to be =7.31032 erg s-1 which is consistent with the empiric ratio. This is in line with the suggestion that Br 48 is a WN3O found by previous works.
We remark that XMM-Newton EPIC is currently the best instrument to produce high-quality studies of star forming regions in the MCs. Its large field of view and the unrivaled effective area in the soft X-ray band makes it a perfect instrument to produce clean view of the distribution and spectral properties of hot bubbles as well as producing pressure estimates. The present work is the first of a series of papers in which we revise the role feedback from massive stellar clusters from the MCs using XMM-Newton.
Acknowledgements
IR-B and JAT are funded by UNAM DGAPA PAPIIT project IA100318. JR-I acknowledges finantial support from PRODEP-SEP, TNM-SEP, DGAPA-PAPIIT (UNAM) grant IG100516. MR thanks finantial support from DGAPA-PAPIIT (UNAM) IN109919 and CONACYT CY-253085 grants.
Appendix A Searching for non-thermal X-ray emission
SBs are the result of the contribution of stellar winds and SN explosions. SN activity is thought to contribute to the X-ray properties of the SB with thermal and non-thermal emission. The latter could be unveiled by the spectral signature of a power-law contribution to the spectral fit (e.g., Bamba et al., 2004), but this has been proven to be a difficult task. For example, Cooper et al. (2004) argued that the SB DEM L 192 (LMC-N51) required a power-law with a photon index of to fit its EPIC X-ray spectrum for energies above 1 keV whilst the emission line hot plasma dominates the X-ray emission below this energy. Similarly, Maddox et al. (2009) found that the best-fit to the X-ray spectrum of LMC-N 11 could be achieved by a power-law up to energies above 5 keV. Nevertheless, Yamaguchi et al. (2010) presented a detailed study of N 11 and N 51 combining Suzaku and XMM-Newton data and found that the claims of presence of a non-thermal component are associated to inaccurate background subtraction.
We have shown in Section 5 that a second plasma temperature is required to achieve a good fit to the X-ray spectra of the SB DEM L 229. This second plasma component is used to fit the emission 1 keV. Furthermore, we show in Fig. 7 the EPIC-pn spectra of the SB presented in Fig. 6 (left panel) but in logarithmic scale. The best-fit two-temperature plasma emission models to the X-ray emission of the SB fairly fits the emission in the high energy range (shown in solid black line in Fig. 7). The contribution from the second component (shown in red dashed-line in Fig. 7) mainly fits the high energy part of the spectrum. In order to assess the presence of possible non-thermal emission from the SB DEM L 229, we have further included a power-law component to the spectral analysis presented in Section 5. Such complex model did not improved the model described in Section 5, thus, it was discarded. On the other hand, the a one temperature NEI plasma model that best fits the EPIC spectrum of the SNR 0532675 can model the background subtracted spectrum in the complete range (see Fig. 7 right panel). A more complicated model, adding a power-law component to the fit did not improved the model described in Section 5. Hence, within the quality of the present EPIC spectra we can discard the idea of non-thermal X-ray emission from these regions. Although we note that the spectra quality in the high energy range is not good (see Fig. 7).
References
- Anders & Grevesse (1989) Anders, E., & Grevesse, N. 1989, Geochim. Cosmochim. Acta, 53, 197
- Arnaud (1996) Arnaud, K. A. 1996, Astronomical Data Analysis Software and Systems V, 101, 17
- Bamba et al. (2004) Bamba, A., Ueno, M., Nakajima, H., & Koyama, K. 2004, ApJ, 602, 257
- Chu et al. (1995) Chu, Y.-H., Chang, H.-W., Su, Y.-L., & Mac Low, M.-M. 1995, ApJ, 450, 157
- Chu & Mac Low (1990) Chu, Y.-H., & Mac Low, M.-M. 1990, ApJ, 365, 510
- Chu et al. (1999) Chu, Y.-H., Weis, K., & Garnett D. 1999, AJ, 117, 1433
- Cooper et al. (2004) Cooper, R. L., Guerrero, M. A., Chu, Y.-H., Chen, C.-H. R., & Dunne, B. C. 2004, ApJ, 605, 751
- de Jager et al. (1988) de Jager, C., Nieuwenhuijzen, H. & van der Hucht, K. A. 1988, A&AS, 72, 259
- Degioia-Eastwood et al. (1993) Degioia-Eastwood, K., Meyers, R. P., & Jones, D. P. 1993, AJ, 106, 1005
- Dunne et al. (2001) Dunne, B. C., Points, S. D., & Chu, Y.-H. 2001, ApJS, 136, 119
- Dyson, & Williams (1997) Dyson, J. E., & Williams, D. A. 1997, The physics of the interstellar medium. Edition: 2nd ed. Publisher: Bristol: Institute of Physics Publishing.
- Dwarkadas & Rosenberg (2013) Dwarkadas, V. V., & Rosenberg, D. L. 2013, High Energy Density Physics, 9, 226
- Feast (1999) Feast, M. 1999, PASP, 111, 775
- Freyer et al. (2006) Freyer, T., Hensler, G., & Yorke, H. W. 2006, ApJ, 638, 262
- Fruscione et al. (2006) Fruscione, A., McDowell, J. C., Allen, G. E., et al. 2006, Proc. SPIE, 6270, 62701V
- Georgelin et al. (1983) Georgelin, Y. M., Georgelin, Y. P., Laval, A., Monnet, G., & Rosado, M. 1983, A&AS, 54, 459
- Guerrero, & Chu (2008) Guerrero, M. A., & Chu, Y.-H. 2008, ApJS, 177, 216.
- Hainich et al. (2014) Hainich, R., Rühling, U., Todt, H., et al. 2014, A&A, 565, A27
- Henize (1956) Henize, K. G. 1956, ApJS, 2, 315.
- Jaskot et al. (2011) Jaskot, A. E., Strickland, D. K., Oey, M. S., et al. 2011, ApJ, 729, 28
- Kereš et al. (2009) Kereš, D., Katz, N., Davé, R., Fardal, M., & Weinberg, D. H. 2009, MNRAS, 396, 2332
- Korn et al. (2000) Korn, A. J., Becker, S. R., Gummersbach, C. A., & Wolf, B. 2000, A&A, 353, 655
- Koyama et al. (1995) Koyama, K., Petre, R., Gotthelf, E. V., et al. 1995, Nature, 378, 255
- Krumholz et al. (2014) Krumholz, M. R., Bate, M. R., Arce, H. G., et al. 2014, Protostars and Planets VI, 243
- Kuntz & Snowden (2008) Kuntz, K. D., & Snowden, S. L. 2008, A&A, 478, 575
- Leahy (2017) 2017ApJ…837…36L Leahy, D. A. 2017, ApJ, 837, 36
- Lopez et al. (2014) Lopez, L. A., Krumholz, M. R., Bolatto, A. D., et al. 2014, ApJ, 795, 121
- Lucke & Hodge (1970) Lucke, P. B., & Hodge, P. W. 1970, AJ, 75, 171
- Maddox et al. (2009) Maddox, L. A., Williams, R. M., Dunne, B. C., & Chu, Y.-H. 2009, ApJ, 699, 911
- Maggi et al. (2016) Maggi, P., Haberl, F., Kavanagh, P. J., et al. 2016, A&A, 585, A162
- McGee et al. (1978) McGee, R. X., Newton, L. M., & Butler, P. W. 1978, MNRAS, 183, 799
- Mashchenko et al. (2008) Mashchenko, S., Wadsley, J., & Couchman, H. M. P. 2008, Science, 319, 174
- Mathewson et al. (1985) Mathewson, D. S., Ford, V. L., Tuohy, I. R., et al. 1985, ApJS, 58, 197
- Oey (1996a) Oey, M. S. 1996a, ApJ, 467, 666
- Oey (1996b) Oey, M. S. 1996b, ApJ, 465, 231
- Oskinova (2015) Oskinova, L. M. 2015, Wolf-rayet Stars: Proceedings of an International Workshop Held in Potsdam, 295.
- Ostriker et al. (2010) Ostriker, E. C., McKee, C. F., & Leroy, A. K. 2010, ApJ, 721, 975
- Pellegrini et al. (2007) Pellegrini, E. W., Baldwin, J. A., Hanson, M. M., Abel, N. P., Ferland, G. J., Nemala, H. B., Shaw, G. & Troland, T. H. 2007, ApJ, 658, 1119
- Points et al. (2001) Points, S. D., Chu, Y.-H., Snowden, S. L., et al. 2001, ApJS, 136, 99
- Reyes-Iturbide et al. (2014) Reyes-Iturbide, J., Rosado, M., Rodríguez-González, A., et al. 2014, AJ, 148, 102
- Reyes-Iturbide et al. (2009) Reyes-Iturbide, J., Velázquez, P. F., Rosado, M., Rodríguez-González, A., González, R. F., & Esquivel, A. 2009, MNRAS, 394, 1009
- Rodríguez-González et al. (2011) Rodríguez-González, A., Velázquez, P. F., Rosado, M., et al. 2011, ApJ, 733, 34
- Rosado (1986) Rosado, M. 1986, A&A, 160, 211
- Schenck et al. (2016) Schenck, A., Park, S., & Post, S. 2016, AJ, 151, 161
- Shenar et al. (2019) Shenar, T., Sablowski, D. P., Hainich, R., et al. 2019, arXiv e-prints , arXiv:1905.09296.
- Smith et al. (2005) Smith, R. C., Points, S. D., Chu, Y.-H., et al. 2005, Bulletin of the American Astronomical Society, 37, 25.07
- Snowden et al. (2004) Snowden, S. L., Collier, M. R., & Kuntz, K. D. 2004, ApJ, 610, 1182
- Snowden et al. (2008) Snowden, S. L., Mushotzky, R. F., Kuntz, K. D., & Davis, D. S. 2008, A&A, 478, 615
- Toalá & Arthur (2011) Toalá, J. A., & Arthur, S. J. 2011, ApJ, 737, 100
- Toalá et al. (2016) Toalá, J. A., Guerrero, M. A., Chu, Y.-H., et al. 2016, MNRAS, 456, 4305
- Toalá et al. (2017) Toalá, J. A., Marston, A. P., Guerrero, M. A., Chu, Y.-H., & Gruendl, R. A. 2017, ApJ, 846, 76
- Velázquez et al. (2013) Velázquez, P. F., Rodríguez-González, A., Esquivel, A., Rosado, M., & Reyes-Iturbide, J. 2013, ApJ, 767, 69
- Vink et al. (2016) Vink J. (2016) X-Ray Emission Properties of Supernova Remnants. In: Alsabti A., Murdin P. (eds) Handbook of Supernovae. Springer, Cham
- Wang & Helfand (1991) Wang, Q., & Helfand, D. J. 1991, ApJ, 373, 497
- Watson et al. (2009) Watson, M. G., Schröder, A. C., Fyfe, D., et al. 2009, A&A, 493, 339
- Weaver et al. (1977) Weaver, R., McCray, R., Castor, J., Shapiro, P., & Moore, R. 1977, ApJ, 218, 377
- Wilcots et al. (1996) Wilcots, E., Hodge, P., & King, N. 1996, ApJ, 458, 580
- Wilms et al. (2000) Wilms, J., Allen, A., & McCray, R. 2000, ApJ, 542, 914
- Yamaguchi et al. (2010) Yamaguchi, H., Sawada, M., & Bamba, A. 2010, ApJ, 715, 412
- Zhang et al. (2014) Zhang, N.-X., Chu, Y.-H., Williams, R. M., et al. 2014, ApJ, 792, 58