User Evaluation of a Multi-dimensional Statistical Dialogue System
Abstract
We present the first complete spoken dialogue system driven by a multi-dimensional statistical dialogue manager. This framework has been shown to substantially reduce data needs by leveraging domain-independent dimensions, such as social obligations or feedback, which (as we show) can be transferred between domains. In this paper, we conduct a user study and show that the performance of a multi-dimensional system, which can be adapted from a source domain, is equivalent to that of a one-dimensional baseline, which can only be trained from scratch.
1 Introduction
Data-driven approaches to spoken dialogue systems (SDS) are limited by their reliance on substantial amounts of annotated data in the target domain. This can be addressed by considering transfer learning techniques, e.g. Taylor and Stone (2009), in which data from a source domain is leveraged to improve learning in a target domain. In particular, domain adaptation has been used in the context of dialogue systems Gašić et al. (2017); Wang et al. (2015); Wen et al. (2016), focusing on identifying and exploiting similarities between domain ontologies in slot-filling tasks.
In contrast to this previous work, we take a multi-dimensional approach, which combines machine learning with linguistic theory. Following Bunt (2011), we exploit the linguistic phenomenon that utterances serve more than one function in a conversation, i.e. they have more than one dimension (see Section 2).111See also https://dit.uvt.nl/. For example, the utterance “On what date would you like to fly to London?” both asks a task-oriented question, and provides feedback about understanding the requested destination. We take advantage of this phenomenon by training separate, fully-statistical dialogue models for each dimension and generating system responses along multiple dimensions simultaneously. Such an SDS thus has the potential to adapt more efficiently to new domains by exploiting previously trained policies of the domain-independent dimensions, such as feedback and social conventions.
Previous implementations of multi-dimensional SDSs were mostly handcrafted Akker et al. (2005); Petukhova et al. (2016). Keizer and Rieser (2017) were the first to present a statistical multi-dimensional dialogue manager (DM). Their results suggest an up to 80% reduction in data: a task success rate of over 90% can be achieved after only 2,000 dialogues when using pre-trained policies, whereas at least 10,000 dialogues are required without pre-training. In comparison, Gašić et al. (2017) achieve similar success rates for in-domain systems trained on 5,000 dialogues. However, Keizer and Rieser’s findings are only tested in simulation.
In this paper, we present the first complete statistical SDS with multi-dimensional DM, and the first crowdsourced human user evaluation of this type of system, comparing a one-dimensional baseline and three multi-dimensional variants, using a novel web-based setup. A novel aspect of our statistical analysis is testing for equivalence. The four system variants were designed in such a way that we would expect their performance levels to be indistinguishable when using fully trained policies. Should the data provide statistical evidence for this, the multi-dimensional variants can be preferred due to their inherent potential for domain transfer.
2 A Multi-dimensional Dialogue Manager
Our DM is a partially-observable Markov decision process (POMDP; Young et al., 2013) which takes as input an n-best list of dialogue act hypotheses, updates the dialogue state and then selects a response in the form of one or more dialogue acts. Rather than selecting a single action from one set of possible actions, our DM consists of multiple dialogue act agents, each of which selects an action from a separate action set, associated with one dimension. These action sets are based on three of the ten dimensions defined in the ISO standard for dialogue act annotation ISO (2012): Task (e.g. recommending a restaurant), AutoFeedback (e.g. asking the user to repeat/rephrase after a processing problem), and Social Obligations Management (SOM; e.g. responding to the user saying goodbye). These dimensions were considered to be the most important for supporting the kind of task-oriented dialogues targeted (see Fig. 1 for an example). While the Task dimension is domain-specific, AutoFeedback and SOM are applicable across domains.
| Usr: | Hi, I need a Thai restaurant in the city centre |
|---|---|
| Social: Greet; Task: Inform; Turn: Release | |
| Sys: | Okay, let me see, … |
| Turn: Take; AutoFeedback: autoPositive | |
| Time: Pausing; Task: InformSearch | |
| Sys: | Bangkok City is a Thai restaurant; |
| it is in the city centre | |
| AutoFeedback: Inform; Task: Inform | |
Training the statistical DM on these three dimensions involves optimising three policies in parallel. A set of priority rules is used to combine the output of these policies into a single system response. The key advantage of such a design is that the domain-independent policies (AutoFeedback and SOM) can be transferred and adapted to a new domain, leaving only the Task policy to be trained from scratch. In our previous work Keizer and Rieser (2017), we have shown that a multi-dimensional DM with pre-trained policies reaches higher performance levels during the early stages of training. Here, we take an important step in confirming this advantage in a real user study.
Our framework currently supports information-seeking domains, such as recommending restaurants or hotels based on the user’s preferences. The domains are specified in terms of an ontology (describing slots such as price range and cuisine) and a database. Our domains are presented in Table 1. We use restaurant information as target domain, but two of the system variants were trained for the hotels domain (source) and then adapted to the restaurant domain.
| Restaurants | Hotels | |
| #venues | 149 | 39 |
| #slots | 4 | 5 |
| shared slots | pricerange, area, near | |
| other slots | cuisine | type, rating |
2.1 Model Variants
For the evaluation, we follow Keizer and Rieser (2017)’s four DM variants and training regime: The one-dimensional one-dim baseline system contains a single dialogue act agent (All) and the corresponding policy was trained from scratch in the target domain. The multi-dimensional systems use three dialogue act agents, one of which is domain-specific (Task) and the other two domain-general (AutoFeedback and SOM). For the base multi-dim system, the three policies are trained from scratch in the target domain, whereas the trans-fixed and trans-adapt variants employ transfer learning Pan and Yang (2010); Torrey and Shavlik (2010): only the task-specific policy is trained from scratch and the two domain-general policies are previously trained in the source domain. For trans-fixed, the pre-trained policies are kept fixed during training in the target domain, whilst for trans-adapt, these are further trained in the target domain. The four fully trained DM versions are outlined in Table 2.
2.2 Training Details
All policies are optimised in simulation using multi-agent reinforcement learning with linear value function approximation, based on a single reward signal shared between the agents. 222The reward function, shared among the agents/dimensions, was the following: (i) a reward of +80 upon task completion, (ii) a penalty of -1 for each turn, (iii) a reward of +3 when responding appropriately to a social act, and (iv) a penalty of -5 when not signalling a perception or interpretation level processing problem to the user when it occurred. For each of the four DM versions, 5 training runs over 60k dialogues were carried out, resulting in a pool of 5 fully trained policies. To train all systems, we use the agenda-based user simulator of Keizer and Rieser (2017), which is based on Schatzmann et al. (2007), along with the following error model: In addition to creating an n-best list of user dialogue act hypotheses from the ‘true’ user act, we also occasionally insert so-called ‘processing problems’, at the levels of perception (no ASR results received) or interpretation (ASR successful, but no NLU results received). We simulate a perception problem with 10% probability, and in case of no perception problem (90%), we simulate an interpretation problem with 10% probability; only in case no processing problems are generated (81%), an n-best list of dialogue act hypotheses is generated. Following Thomson et al. (2012), the n-best lists are populated by taking the true user act and distorting it at a given semantic error rate for each of the positions, after which semantically equivalent hypotheses are merged. Based on the error rate, a Dirichlet distribution is used to generate confidence scores for the n-best list (resulting in a semantic top accuracy equal to the error rate), interpreted as probabilities by the DM when updating its user goal belief state.333The n-best size was set to 3 and the error rate was set to 30% for the target domain (restaurants) and 20% for the source domain (hotels).
In order to correctly interpret the evaluation results, note that in the current setup, the one-dim system serves as an upper bound baseline system, as it needs no coordination between different agents during training whilst generating (by construction) the same range of actions as the multi-dimensional systems. This is ensured by a set of priority heuristics which map action combinations to single acts.444E.g. if the Task agent generates a recommendation action and the AutoFeedback agent generates a negative feedback action, the latter gets priority and the former is cancelled.
| Dialogue Act Agent | one-dim | multi-dim | trans-fixed | trans-adapt |
|---|---|---|---|---|
| All | source: – | – | – | – |
| target: trained | – | – | – | |
| Task | – | source: – | source: – | source: – |
| – | target: trained | target: trained | target: trained | |
| AutoFeedback | – | source: – | source: trained | source: trained |
| – | target: trained | target: fixed | target: adapted | |
| SOM | – | source: – | source: trained | source: trained |
| – | target: trained | target: fixed | target: adapted |
| system | SuccRate | AvgLen | AvgRew |
|---|---|---|---|
| one-dim | 97.8% | 14.69 | 66.36 |
| multi-dim | 97.6% | 15.68 | 64.97 |
| trans-fixed | 96.8% | 15.08 | 65.23 |
| trans-adapt | 97.4% | 16.41 | 64.20 |
2.3 DM Evaluation in Simulation
To get a better picture of what we might expect during the human evaluation, we first ran evaluations with simulated data. The results obtained with the same settings as those during training are shown in Table 3. As we hypothesised, the scores are very similar, the one-dim system only slightly outperforming the multi-dimensional systems.
We then extended the setup with different semantic error rates Thomson et al. (2012); the results are shown in Fig. 2. The performance levels of the four systems are very similar at error rates between 10% and 40%, showing that the construction of the multi-dimensional versions in relation to the one-dim baseline is sound, and showing there is no negative transfer, i.e., the adapted systems are not performing worse.555The discrepancy at zero error rate for the trans-fixed system might have occurred because certain state feature combinations occurring specifically at zero error rate were not seen during training, and might be too distinct to be dealt with by the generalisation capability of the value approximation model used in our reinforcement learning algorithm.


3 Evaluation Setup
We use crowdsourcing to evaluate our system, following Jurčíček et al. (2011) and Crook et al. (2014). In both of these works a phone-based system was deployed, using a bespoke ASR and Voice over IP (VoIP) to connect speech input/output with the dialogue system. Here, we follow a similar evaluation methodology, but with a novel, simpler web-based interface using Google Chrome’s built-in web speech API, embedded into the crowdsourcing task webpages. A detailed description of the technical setup can be found in Appendix A.
3.1 Crowdsourcing Setup
The users are recruited on the FigureEight crowdsourcing platform and asked to have a conversation with the system to find a venue meeting certain criteria (e.g. cheap Chinese food) and get certain information about that venue (e.g. phone number and address). This scenario is specified in natural language, generated automatically from a set of task specifications randomly generated from the domain ontology. After each conversation, the user is given a questionnaire to rate the system.
3.2 Evaluation Metrics
The subjective evaluation metrics are derived from the following questionnaire, with one yes/no question (Q1) and four 6-point Likert Scale ratings.
- Q1 [SubjSucc]:
-
Did you find all the information you were looking for?
Please state your attitude towards the following statements:
- Q2 [VoiceInt]:
-
The system was easy to understand (the voice was intelligible).
- Q3 [Understand]:
-
In this conversation, the system understood what you said.
- Q4 [AsExpect]:
-
The system worked the way you expected it to during the conversation.
- Q5 [WdUseAgain]:
-
From your experience with the system, you think you would use it in the future to find a place to eat.
The following objective success metrics are derived from the logs:
-
EntProv: the system recommended an entity matching the task constraints,
-
ConstrConf: the system confirmed all task constraints in its recommendation,
-
InfoProv: the system provided all information requested by the user.
4 Human User Evaluation
| DM version | NumDials | NumTurns (StDev) |
|---|---|---|
| one-dim | 245 | 6.67 (2.55) |
| multi-dim | 228 | 6.30 (1.97) |
| trans-fixed | 261 | 6.57 (2.33) |
| trans-adapt | 248 | 6.64 (2.33) |
| Total | 982 | 6.55 (2.31) |
| DM | SubjSucc | VoiceInt | Underst | AsExpect | WdUseAgain | EntProv | ConstrConf | InfoProv |
|---|---|---|---|---|---|---|---|---|
| [Q1] | [Q2] | [Q3] | [Q4] | [Q5] | ||||
| one-dim | 87.3% | 5.49 | 4.80 | 4.81 | 4.67 | 72.2% | 57.7% | 45.7% |
| multi-dim | 83.3% | 5.37 | 4.68 | 4.68 | 4.59 | 68.4% | 52.7% | 44.7% |
| trans-fixed | 81.6% | 5.47 | 4.66 | 4.64 | 4.63 | 70.1% | 53.1% | 41.0% |
| trans-adapt | 85.9% | 5.38 | 4.67 | 4.64 | 4.57 | 72.2% | 53.1% | 46.6% |
| DM version | NumDials | WER |
|---|---|---|
| one-dim | 120 | 17.2% |
| multi-dim | 124 | 15.6% |
| trans-fixed | 137 | 15.4% |
| trans-adapt | 115 | 19.1% |
In total, 982 dialogues were collected (see Table 4), i.e. 246 dialogues per system variant on average. We carried out a number of statistical tests to analyse the observed effect sizes in comparing the systems, including chi-squared (for success rates) and Mann-Whitney tests (for the Likert scale ratings), but also the ‘two one-sided test’, or TOST Schuirmann (1987), for equivalence, as argued in Section 2.1. In a TOST scenario, the null hypothesis is that the difference in performance between two systems, , is greater than a given threshold (a hyperparameter). This translates into two one-sided null hypotheses:
| (1) | |||
| (2) |
If both and are rejected, we can conclude that , i.e. the difference lies below the threshold. This test is much more conservative than failing to reject the null hypothesis in a conventional statistical test of significant difference. The underlying one-sided tests can differ according to the nature of data at hand. The default proposed by Schuirmann (1987) is t-tests. However, our data fails the normal distribution assumption of a t-test. Therefore, we use the robust t-test of Yuen and Dixon (1973) for testing equivalence on Likert scale data, which does not assume normality, and a pooled z-test with continuity correction (Fleiss et al., 2003, p. 53ff.) for success rates.666The z statistic is the square root of the statistic, which is more suited for determining standard deviation (i.e. size of difference) as opposed to variance. We used a threshold of for the equivalence tests.
4.1 Evaluation Results
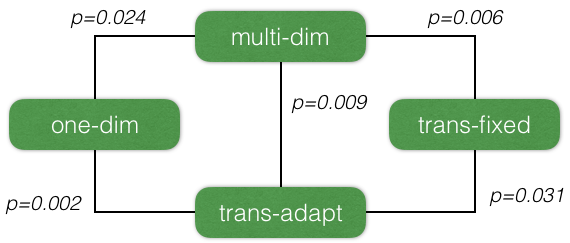
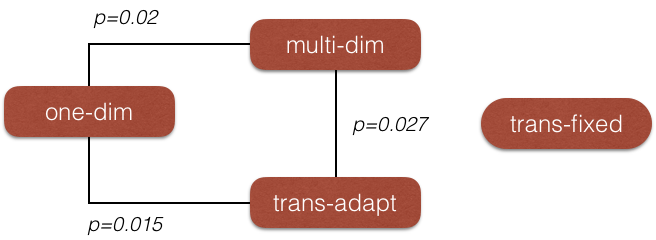
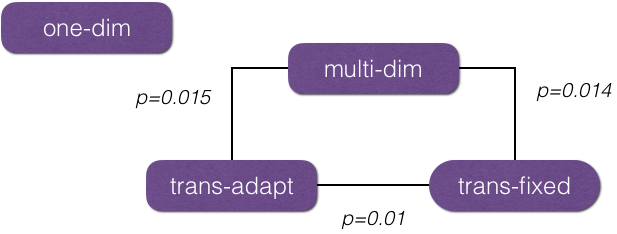
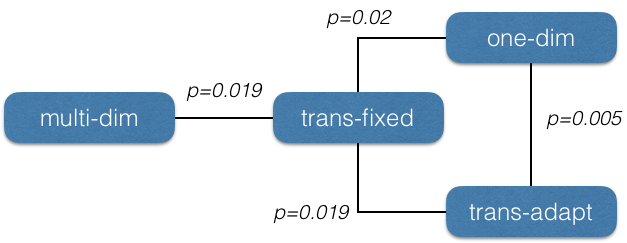
Table 5 shows the results for both objective and subjective metrics. When considering the metrics for task success (SubjSucc, EntProv, ConstrConf, InfoProv), the one-dim system is the highest scoring, although the trans-adapt system is often a close second and in some cases the top scorer. However, no statistically significant differences were detected, and the one-dim system was moreover found to be equivalent to the multi-dim () and trans-adapt () systems in perceived success (SubjSucc), and all three multi-dimensional systems were found to be equivalent to each other (, , and ). Similarly, several equivalences were detected for the three objective success metrics, as illustrated in Appendix B.777Following Armstrong (2014), we do not apply a correction for multiple comparisons Lauzon and Caffo (2009) since we only performed a limited number of pre-planned comparisons and did not require testing against the universal null hypothesis “nothing is significant”. All systems are equivalent on the other subjective ratings Q2–Q5.
To get a sense of the noise levels encountered by the different system variants, we collected crowdsourced transcriptions of 2,931 utterances from 496 dialogues (45.6% of the total number of turns in the evaluation corpus and 50.5% of collected dialogues), spread approximately evenly across all system variants. We then computed word error rate (WER). 888The reference transcriptions were obtained by majority voting over the three transcriptions collected for each utterance, with manual fixes in case of a tie (20% of the utterances).
5 Conclusion and Future Work
In this paper, we have shown that a multi-dimensional, data efficient dialogue manager performs equally to a one-dimensional, more data-hungry (upper) baseline. In doing so, we have developed a web-based platform for spoken dialogue system evaluation, carried out a crowdsourced user evaluation, and introduced statistical testing for equivalence in our analysis of the results. All code and data used in our experiments are available at:
The results show that none of the systems outperformed the other systems consistently across various metrics, and more importantly, that several statistical equivalences between the systems could be detected. We believe that these results are encouraging, especially since we suspect that the use of a web-based speech interface (with inherently varying quality of the microphone used) and the crowdsourcing setup (with inherently varying conditions in which workers do their tasks) resulted in a relatively high level of variance in the data, making it harder to draw strong conclusions.
In the next stage of our research, we aim to further demonstrate the cross-domain transfer capability of the dialogue manager, for example by evaluating partially trained policies, and showing that policies that use transfer learning reach higher performance levels in the early stages of training, or that they achieve a given performance threshold with much less data.
Acknowledgements
This research was supported by the EPSRC project MaDrIgAL (EP/N017536/1) and Charles University project PRIMUS/19/SCI/10.
References
- Akker et al. (2005) Rieks op den Akker, Harry Bunt, Simon Keizer, and Boris van Schooten. 2005. From Question Answering to Spoken Dialogue: Towards an Information Search Assistant for Interactive Multimodal Information Extraction. In Proceedings of the \nth9 European Conference on Speech Communication and Technology (Interspeech), Lisbon, Portugal.
- Armstrong (2014) Richard A. Armstrong. 2014. When to use the Bonferroni correction. Ophthalmic and Physiological Optics, 34(5):502–508.
- Bunt (2011) Harry Bunt. 2011. Multifunctionality in dialogue. Computer Speech & Language, 25(2):222–245.
- Crook et al. (2014) Paul A Crook, Simon Keizer, Zhuoran Wang, and Wenshuo Tang. 2014. Real user evaluation of a POMDP spoken dialogue system using automatic belief compression. Computer Speech & Language, 28(4):873–887.
- Fleiss et al. (2003) Joseph L. Fleiss, Bruce Levin, and Myunghee Cho Paik. 2003. Statistical methods for rates and proportions, 3rd edition. Wiley series in probability and statistics. J. Wiley, Hoboken, NJ, USA.
- Gašić et al. (2017) Milica Gašić, Nikola Mrkšić, Lina M. Rojas-Barahona, Pei-hao Su, Stefan Ultes, David Vandyke, Tsung-Hsien Wen, and Steve Young. 2017. Dialogue manager domain adaptation using Gaussian process reinforcement learning. Computer Speech & Language, 45:552–569.
- ISO (2012) ISO. 2012. ISO 24617-2 Language resource management – Semantic annotation framework – Part 2: Dialogue acts. International Organization for Standardization, Geneva, Switzerland.
- Jurčíček et al. (2011) Filip Jurčíček, Simon Keizer, Milica Gašić, François Mairesse, Blaise Thomson, Kai Yu, and Steve Young. 2011. Real user evaluation of spoken dialogue systems using Amazon Mechanical Turk. In Proceedings of Interspeech, Florence, Italy.
- Keizer and Rieser (2017) Simon Keizer and Verena Rieser. 2017. Towards Learning Transferable Conversational Skills using Multi-dimensional Dialogue Modelling. In Proceedings \nth21 Workshop on the Semantics and Pragmatics of Dialogue (SemDial/SaarDial), Saarbruecken, Germany. Extended version: arXiv:1804.00146.
- Lauzon and Caffo (2009) Carolyn Lauzon and Brian Caffo. 2009. Easy Multiplicity Control in Equivalence Testing Using Two One-Sided Tests. The American Statistician, 63(2):147–154.
- Pan and Yang (2010) Sinno Jialin Pan and Qiang Yang. 2010. A Survey on Transfer Learning. IEEE Transactions on Knowledge and Data Engineering, 22(10):1345–1359.
- Petukhova et al. (2016) Volha Petukhova, Christopher Stevens, Harmen de Weerd, Niels Taatgen, Fokie Cnossen, and Andrei Malchanau. 2016. Modelling multi-issue bargaining dialogues: Data collection, annotation design and corpus. In Proceedings of the \nth10 International Conference on Language Resources and Evaluation (LREC), Paris, France.
- Schatzmann et al. (2007) Jost Schatzmann, Blaise Thomson, Karl Weilhammer, Hui Ye, and Steve Young. 2007. Agenda-based user simulation for bootstrapping a POMDP dialogue system. In Human Language Technologies: The Annual Conference of the North American Chapter of the Association for Computational Linguistics (NAACL-HLT), Rochester, NY, USA.
- Schuirmann (1987) Donald J Schuirmann. 1987. A comparison of the two one-sided tests procedure and the power approach for assessing the equivalence of average bioavailability. Journal of Pharmacokinetics and Biopharmaceutics, 15:657–680.
- Taylor and Stone (2009) Matthew E Taylor and Peter Stone. 2009. Transfer Learning for Reinforcement Learning Domains: A Survey. The Journal of Machine Learning Research, 10(Jul):1633–1685.
- Thomson et al. (2012) Blaise Thomson, Milica Gašić, Matthew Henderson, Pirros Tsiakoulis, and Steve Young. 2012. N-best error simulation for training spoken dialogue systems. In Spoken Language Technology Workshop (SLT), Miami, FL, USA.
- Torrey and Shavlik (2010) Lisa Torrey and Jude Shavlik. 2010. Transfer learning. In Handbook of research on machine learning applications and trends: algorithms, methods, and techniques, pages 242–264. IGI Global.
- Wang et al. (2015) Zhuoran Wang, Tsung-Hsien Wen, Pei-hao Su, and Yannis Stylianou. 2015. Learning domain-independent dialogue policies via ontology parameterisation. In Proceedings of the \nth16 Annual Meeting of the Special Interest Group on Discourse and Dialogue (SIGdial), Prague, Czechia.
- Wen et al. (2016) Tsung-Hsien Wen, Milica Gašić, Nikola Mrkšić, Lina M. Rojas-Barahona, Pei-Hao Su, David Vandyke, and Steve Young. 2016. Multi-domain neural network language generation for spoken dialogue systems. In Proceedings of the 2016 Conference of the North American Chapter of the Association for Computational Linguistics: Human Language Technologies, pages 120–129, San Diego, CA, USA.
- Williams et al. (2015) Jason D Williams, Eslam Kamal, Hani Amr Mokhtar Ashour, Jessica Miller, and Geoff Zweig. 2015. Fast and easy language understanding for dialog systems with Microsoft language understanding intelligent service (LUIS). In Proceedings of the \nth16 Annual Meeting of the Special Interest Group on Discourse and Dialogue (SIGDIAL), Prague, Czechia.
- Young et al. (2013) Steve Young, Milica Gašić, Blaise Thomson, and Jason D. Williams. 2013. POMDP-Based Statistical Spoken Dialog Systems: A Review. Proceedings of the IEEE, 101(5):1160–1179.
- Yuen and Dixon (1973) Karen K. Yuen and W. J. Dixon. 1973. The approximate behaviour and performance of the two-sample trimmed . Biometrika, 60(2):369–374.
Appendix A Dialogue System Setup
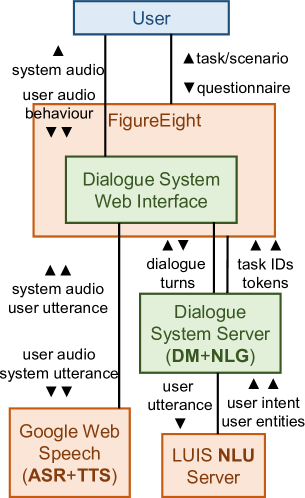
An overview of our crowdsourced dialogue system evaluation setup is shown in Fig. 3. The core component of the spoken dialogue system is the Dialogue System Server, which contains the DM (see Section 2), extended with a template-based NLG component and code for processing NLU results from Microsoft’s LUIS Williams et al. (2015). Our LUIS model was trained with 299 manually constructed and annotated example utterances.
The system is completed by a web-based user interface, which connects with both the Dialogue System Server and the Google Web Speech API.999https://w3c.github.io/speech-api/speechapi.html User audio input is first sent to Google ASR to get user utterance hypotheses with confidence scores. These are sent to the Dialogue System Server, which returns a system response utterance. Finally, this utterance is sent to Google TTS, which returns the synthesised system response audio to be played back to the user. The web interface is integrated into the FigureEight crowdsourcing platform for managing the evaluation (Section 3.1).
Appendix B Equivalence test results
See Figure 4 for a diagram of all statistically significant equivalences that we detected with respect to the individual evaluation criteria (see Sections 3.2 and 4).