Non-thermal emission in radio galaxy lobes:
II. Centaurus A, Centaurus B, and NGC 6251
Abstract
Radio and -ray measurements of large lobes of several radio galaxies provide adequate basis for determining whether emission in these widely separated spectral regions is largely by energetic electrons. This is very much of interest as there is of yet no unequivocal evidence for a significant energetic proton component to account for -ray emission by neutral pion decay. A quantitative assessment of the proton spectral distribution necessitates full accounting of the local and background radiation fields in the lobes; indeed, doing so in our recent analysis of the spectral energy distribution of the Fornax A lobes considerably weakened previous conclusions on the hadronic origin of the emission measured by the Fermi satellite. We present the results of similar analyses of the measured radio, X-ray and -ray emission from the lobes of Centaurus A, Centaurus B, and NGC 6251. The results indicate that the measured -ray emission from these lobes can be accounted for by Compton scattering of the radio-emitting electrons off the superposed radiation fields in the lobes; consequently, we set upper bounds on the energetic proton contents of the lobes.
keywords:
galaxies: cosmic rays – galaxies: active – galaxies: individual: Centaurus A – galaxies: individual: Centaurus B – galaxies: individual: NGC 6251 – gamma rays: galaxies – radiation mechanisms: non-thermal1 Introduction
Measurements of non-thermal (NT) emission from the extended lobes of several nearby radio galaxies provide a basis for detailed modeling of the spectral distributions of energetic particles in these environments. Sampling the spectral energy distributions (SED), even with only limited spatial information, yields valuable insight on the emitting electrons and possibly also on energetic protons whose p–p interactions in the ambient lobe plasma and ensuing -decay could yield detectable GeV emission. In addition to the intrinsic interest in physical conditions in radio lobes, modeling energetic particles and their emission processes can yield important insight also for the origin of these particles in galaxy clusters.
Currently available spectral radio, X-ray, and -ray measurements of the lobes of the nearby galaxy Fornax A provide an adequate basis for determining the emission processes, the spectral energy distribution of the emitting particles, and the mean value the magnetic field, as has been done by McKinley et al. (2015), Ackermann et al. (2016), and more recently by us (Persic & Rephaeli 2019; hereafter PR19). Here we carry out similar data analyses of three other radio galaxies whose multi-spectral lobe emission was detected (also) by Fermi-LAT: Centaurus A (Cen A), Centaurus B (Cen B), and NGC 6251. Our improved spectral modeling of the measured SEDs of these sources is based on an updated EBL model (Franceschini & Rodighiero 2017, 2018), and on a more complete accounting for the local (ambient) galactic radiation fields than done in previous works.
In light of the fact that the results presented here are based on essentially identical treatment to that in PR19 (other than the spatially sectionalized modeling of Cen A), our discussion will be brief and limited only to the most relevant observational data and to the results of our new spectral modeling. In Sections 2 and 3 we summarize, respectively, the observational data and estimates of the radiation field densities in the lobes of the three galaxies. Results of the fitted SED models are detailed in Section 4 and discussed in Section 5. Our main conclusions are summarized in Section 6.
2 Lobe SED measurements
Here we summarize the measurements and main properties of the broad-band emission from the lobes of the radio galaxies studied in this paper.
2.1 Cen A
At a luminosity distance Mpc (Harris et al. 2010), Cen A has two giant elongated radio lobes, each with projected linear size kpc by kpc, centered nearly symmetrically to the north and south of the elliptical galaxy NGC 5128. These were the first lobes detected by Fermi-LAT (Abdo et al. 2010). The improved spectral (0.06-30 GeV) and spatial resolution attained in more recent radio, Planck, and Fermi-LAT measurements (Sun et al. 2016, hereafter SYMA16) allow a spatially resolved spectral analysis. On sufficiently large scale the radio and -ray emissions appear reasonably uniform across the lobes, but with a somewhat different N and S lobe morphology. X-ray observations and spectral analyses of Cen A were carried out by several groups (Abdalla et al. 2018 and references therein); however, due to the complex morphology of the source (e.g., Schreier et al. 1979; Hardcastle et al. 2009 and references therein), there is no unambiguous detection of NT emission at 1 keV (e.g., Kraft et al. 2002). Detailed lobe SED modeling (Abdo et al. 2010; Yang et al. 2012; SYMA16) suggested that the -ray emission from the lobes is Compton-upscattered radiation from the Cosmic Microwave Background (CMB) with additional contribution at higher energies from the Extragalactic Background Light (EBL).
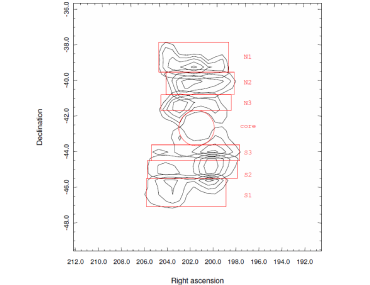
We use the most updated data in the radio and -ray bands, as reported by SYMA16: they are specified in Table 1 where the listed flux densities are the emissions from the sub-regions in the north (N) and south (S) lobes identified by SYMA16 (see Fig. 1) as N1, S1 (outer), N2, S2 (middle), and N3, S3 (inner). Radio data comprise 118 MHz Murchison Widefield Array (McKinley et al. 2013), 408 MHz Haslem (Haslam et al. 1982), and 1.4 GHz Parkes fluxes (O’Sullivan et al. 2013), whereas microwave data comprise 40, 44, 70, 100, 143 GHz Planck fluxes. These flux densities were measured using aperture photometry over the same sub-regions as specified in the analysis of the extended -ray image (SYMA16). As noted by SYMA16, for N2, S2, N3, and S3 the Planck data above 70 GHz may be affected by poor understanding of the high frequency background in this band hence may not be reliable. Based on 7 yr of Fermi/LAT data and updated Fermi-LAT collaboration software tools, SYMA16 extended the detected -ray emission down to MeV and up to GeV; using an extended-lobe model for the lobe emission consistent with the radio lobes’ morphology and point-like emission from the radio core, they confirmed Yang et al.’s (2012) previous finding that the North lobe’s -ray emission extends beyond the radio image.
| Frequency | N1 | N2 | N3 | S1 | S2 | S3 | ||
| Log(/Hz) | Radio Flux Density [Jy]† | |||||||
| – | ||||||||
| – | ||||||||
| – | – | – | – | |||||
| – | – | – | – | – | ||||
| -ray Flux Density [pJy]‡ | ||||||||
| – | – | – | – | – | ||||
| – | ||||||||
| – | – | |||||||
| – | – | – | ||||||
†From Table 3 of SYMA16. ‡From Fig. 4 of SYMA16.
2.2 Cen B
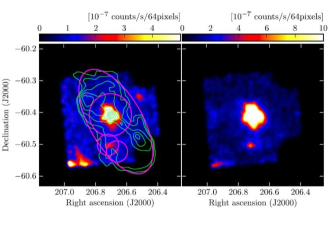
At Mpc, Cen B is the fifth-brightest radio galaxy in the sky. Its projected position close to the Galactic plane results in strong foreground absorption in the optical and X-ray bands (Schroeder et al. 2007; Tashiro et al. 1998). Fermi-LAT detecting emission from the lobes during yr observations (Katsuta et al. 2013, hereafter K13; see Fig. 2). The level of diffuse X-ray emission from the lobes, originally claimed based on ASCA data (Tashiro et al. 1998), is marginally consistent with Suzaku upper limits (K13). If the flux is close to the Suzaku limit (which would be consistent with the ASCA estimate), then -ray emission could be interpreted as Compton scattering of the radio-emitting off the CMB; otherwise, a jet origin of the measured -ray emission would be favored (K13).
The dataset used in our analysis is specified in Table 2, where the listed fluxes refer to the combined lobes. We take 0.03-5 GHz radio fluxes from Jones et al. (2012; and references therein), 30 GHz Planck and 0.2-20 GeV Fermi-LAT data from K13, and the keV ASCA flux from Tashiro et al. (1998). Concerning X-ray emission, we assume the 2-10 keV Suzaku upper limit to be consistent with the ASCA flux (see K13), so use the latter 1 keV flux.
| Frequency | Flux density⋆ | Reference | Frequency | Flux density⋆ | Reference | |
|---|---|---|---|---|---|---|
| log(/Hz) | log(/Hz) | |||||
| Jy | Finlay & Jones (1973) | Jy | Milne & Hill (1969) | |||
| Jy | Mills, Slee & Hill (1971) | Jy | Day, Thomas & Goss (1969) | |||
| Jy | Mills (1952) | Jy | Goss & Shaver (1970) | |||
| Jy | Komessaroff (1966) | Jy | Katsuta et al. 2013 | |||
| Jy | Kesteven (1968) | Jy | Tashiro et al. 1998 | |||
| Jy | Shaver & Goss (1970) | pJy | Katsuta et al. 2013 | |||
| Jy | McAdam (1991) | pJy | Katsuta et al. 2013 | |||
| Jy | Milne & Hill (1969) | pJy | Katsuta et al. 2013 | |||
| Jy | Mathewson, Healey & Rome (1962) | pJy | Katsuta et al. 2013 |
⋆Where not explicitly indicated, flux density uncertainties are assumed to be .
2.3 NGC 6251
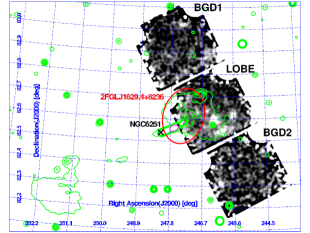
Located at at Mpc, NGC 6251 has the largest angular extent among northern radio sources, . The NW radio lobe was detected by Suzaku to be very extended, likely associated with Fermi-LAT source 2FGL J1629.4+8326 (Takeuchi et al. 2012, hereafter T12; see Fig. 3). The observed -ray emission was interpreted as Compton scattering of the radio-emitting electrons off the CMB (T12).
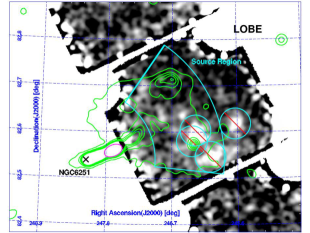
The dataset used in our analysis (Table 3) comes from T12: the 0.327-1.56 GHz Westerbork Synthesis Radio Telescope (WSRT) and Very Large Array fluxes are measured using the same source extraction regions as in the 0.5-8 keV Suzaku analysis.
| Frequency⋆ | Flux density | Reference | Frequency⋆ | Flux density | Reference | |
|---|---|---|---|---|---|---|
| log(/Hz) | log(/Hz) | |||||
| Jy | Takeuchi et al. (2012) | nJy | Takeuchi et al. (2012) | |||
| Jy | Takeuchi et al. (2012) | nJy | Takeuchi et al. (2012) | |||
| Jy | Takeuchi et al. (2012) | pJy | Takeuchi et al. (2012) | |||
| Jy | Mack, Klein, O’Dea & Willis (1997) | pJy | Takeuchi et al. (2012) | |||
| nJy | Takeuchi et al. (2012) | pJy | Takeuchi et al. (2012) | |||
| nJy | Takeuchi et al. (2012) | pJy | Takeuchi et al. (2012) |
⋆The X-ray flux densities refer to the photon energy intervals 0.5-1 keV, 1-2 keV, 2-4 keV, 4-8 keV.
3 Radiation fields in the lobes
A reasonably precise determination of the ambient photon fields in the lobes is needed for predicting the level of -ray emission from Compton scattering of the radio-emitting electrons (and positrons). Due to the proximity of the central active galaxy, radiation fields in the lobes include local, in addition to cosmic (background) components.
Relevant cosmic radiation fields include the CMB and the EBL. The CMB is a pure Planckian with K and energy density eV cm-3 (e.g. Dermer & Menon 2009). The EBL originates from direct and dust-reprocessed starlight integrated over the star formation history of the universe. A recent updated model, based on accurate galaxy counts in several spectral bands, is presented by Franceschini & Rodighiero (2017, 2018); its main components are the cosmic IR background (CIB) and the cosmic optical background (COB), described as diluted Planckians (PR19). We approximate the EBL as a combination of diluted Planckians,
| (1) | |||||
with , K, , K, , K, , K, , K, , K, , K, that incorporates galaxy-counts based results (Franceschini et al. 2008; Franceschini & Rodighiero 2017, 2018) and -ray derived results (that suggest a slight enhancement of the optical hump; Acciari et al. 2019).
Local radiation fields, that constitute the Galactic Foregound Light (GFL), arise from the central elliptical galaxies located between the lobes. Galaxy SEDs usually show two thermal humps, IR and optical.
Cen A: The central galaxy, NGC 5128, has a bolometric IR luminosity of erg s-1, as implied by IRAS flux densities at 12, 25, 60 and 100m (Gil de Paz et al. 2007) 111 The total IR (m) flux is erg cm-2s-1 (Sanders & Mirabel 1996). . The optical bolometric luminosity, erg s-1, is derived from the total -band magnitude (Gil de Paz et al. 2007), converted to bolometric magnitude using (Dufour et al. 1979) following the procedure outlined in PR19. The surface brightness distribution extends out to following a profile with (=11.5 kpc; Dufour et al. 1979). This effective radius is modest as compared with the distance ( kpc) to the nearest boundaries of the innermost lobe regions N3 and S3.
Cen B: The host galaxy PKS 1343-601, which is projected close to the Galactic plane, is extremely absorbed ( mag, Schröder et al. 2007). We estimate erg s-1 from mag (total, extinction corrected; Schröder et al. 2007) converted to bolometric magnitude assuming (a typical value for ellipticals) and following the procedure outlined in PR19. Also, erg s-1 from the B-luminosity through a FIR–B scaling relation (Bregman et al. 1998) and setting (e.g. Persic & Rephaeli 2007). The surface brightness distribution is unknown; however, if it has a typical profile, its effective radius can be estimated from the B-luminosity (Romanishin 1986): kpc. Lobe radii and nearest lobe boundaries are kpc (Jones et al. 2001, K13).
NGC 6251: We estimate erg s-1 from (RC3 catalogue), and following the steps outlined in the previous case, erg s-1 from IRAS flux densities (Golombek et al. 1988). The relevant surface brightness distribution is a modified Hubble profile () with ( kpc; Crane et al. 1993). The lobe radius and nearest boundary distance are kpc and kpc (see T12).
The above IR and optical parameters allow modeling the GFL. In our calculations we take K and K (see PR19). The -ray data for the lobe regions of Cen A, and the lobes of Cen B and NGC 6251 are spatial averages. Similarly, we compute the corresponding volume-averaged Compton/GFL yield. As the characteristic radii of NGC 5128, PKS 1343-601, NGC 6251 are small compared with those of the corresponding lobes (radius, distance from central galaxy), we treat central galaxies as point sources 222 Assuming the lobe is a sphere with radius , centered at , with the -coordinate of the nearest lobe boundary. A vertical line (being the -axis running variable inside the lobe, ) intersects the lobe at . The photon energy density at the lobe boundary is . Since the lobe is symmetric w.r.t. the -axis, the volume-averaged energy density is , where with . This formula applies also to a cylindrical lobe (radius , height , and base located at a distance from the central galaxy on the -axis), but with and . (in contrast with our procedure for Fornax A in PR19).
4 Modeling NT emission
4.1 Synchrotron and Compton yields
Radio emission in the lobes is by electron synchrotron in a disordered magnetic field whose mean value is taken to be spatially uniform. X- emission is modeled to originate in Compton scattering of the electrons off the CMB and optical radiation fields. The standard emissivity calculations are briefly described in PR19.
Assuming no appreciable temporal flux variation, the electron energy distribution (EED) is taken to be time-independent, spatially isotropic and truncated-PL distribution in the electron Lorentz factor, in the interval ], with a finite . The electrons traverse magnetized lobe plasma, with field strength , and scatter off the ambient radiation fields emitting radio synchrotron and Compton X-and--ray radiation (see Eqs. 9 and 11 of PR19). The results of our lobe SED modeling are summarized below and shown in Figs. 1 and 2.
Cen A. Measured NT emission at keV, pivotal to our previous analysis of Fornax A (PR19), is unavailable; diffuse emission from a lobe region of Cen A measured by XMM-Newton was determined to be of thermal origin (Kraft et al. 2003). Thus, to calibrate the EED in each lobe region we either maximized the Compton/CMB contribution to the lowest-frequency Fermi-LAT point, or normalized it to the Fermi-LAT data, if the spectral shape of the the data matched that of the predicted Compton/EBL spectrum. Fitting the predicted synchrotron flux to radio data yielded the EED spectral index, . The upper energy cutoff, , was determined by requiring the predicted synchrotron flux to fit the radio SED turnover (e.g., region N1) or, if the latter is not clearly suggested by the data, by requiring the predicted Compton/EBL flux not to overproduce the lowest-energy Fermi-LAT data point. The minimum electron energy, , cannot be derived directly from the present data set owing to the lack of low-energy (1 keV) Compton/CMB data. We can only estimate by assuming it marks the transition from the Coulomb-loss regime to the synchrotron/Compton-loss regime, (e.g. Rephaeli & Persic 2015) – where the magnetic and radiation energy densities, and , are scaled to G and the CMB radiation field, respectively. Doing so yielded . The mean magnetic field strength, , was deduced by adjusting the predicted synchrotron yield to the radio measurements.
The results are shown in Fig. 4 together with the radio and -ray measurements. In all lobe regions the predicted Compton emission is consistent with the 0.1-10 GeV Fermi-LAT data. The dominant radiation field is the EBL, as has been previously suggested, using different EEDs and EBL models (Abdo et al. 2010, SYMA16). The maximum electron energy, , is lower by a factor in the outer as compared to the inner regions (see Fig. 4). The less energetic EEDs necessarily sample more energetic photons from the target radiation fields to produce Compton emission in the Fermi-LAT band. Indeed, a virtually pure EBL shape is revealed by the Fermi-LAT data in the outer regions, whereas a significant contribution from the CMB profile is recognizable in the inner regions.


Cen B. We use the photoelectrically absorbed ( cm2; K13) 1 keV flux density to determine assuming the emission is Compton/CMB. Spectral fitting the predicted spectrum to the radio data yields , whereas is deduced by requiring the predicted Compton/CMB flux not to exceed the lowest-energy Fermi-LAT data point; we set . With the electron spectrum fully specified, normalization of the predicted synchrotron spectral flux to the radio measurements yields . The SED is shown in Fig. 5-left. Fermi-LAT data are modeled as Compton scattering off the CMB at lower energies and as Compton scattering off the EBL (and subdominant GFL) at higher energies. The -ray spectrum clearly reflects the shape of the Compton/EBL(+GFL).
NGC 6251. The spectral index is deduced as described above. Modeling the -ray spectrum and the photoelectrically absorbed ( cm2, Dickey & Lockman 1990) X-ray flux as Compton/CMB yields , and and . Adjusting the predicted synchrotron yield to the radio data determines . The SED is shown in Fig. 5-middle; the X-ray and -ray data are interpreted as Compton/CMB emission, with the predicted Compton/EBL flux amounting to just few percent of the Fermi-LAT flux (and negligible contribution from Compton/GFL).


As is apparent from Figs. 4,5, the radiative yields of energetic electrons in the lobes of Cen A, Cen B, and NGC 6251 can adequately account for all currently available radio, X-ray, and -ray measurements. This basic result of our spectral analyses constitutes further substantiation of what has been suggested in previous works (SYMA16, Yang et al. 2012; K13; T12). Note also that GFL contributes insignificantly to the measured levels of -ray emission, 333 We use projected galaxy-to-lobe distances (inclinations are unknown), so inferred GFL densities are strict upper limits. in clear contrast with our finding in the case of Fornax A, in whose lobes the main component of -ray emission is by Compton scattering off GFL (PR19). The double-humped profile in the predicted -ray spectra of Cen A and Cen B (Figs. 1 and 2) mimics the spectral distribution of the EBL (and GFL); this underlines its origin. Also, the sharp -ray cutoff in the spectrum of NGC 6251 reflects the truncation of the electron energy distribution.Thus, these features by themselves indicate that the -ray spectral profiles of these sources are unlikely to be of hadronic origin that has the characteristic hump-shaped pion-decay profile. It seems that this a priori rules out any significant pionic component to these SEDs. (In contrast, the -ray profile of Fornax A is amenable to a pionic interpretation; McKinley et al. 2015, Ackermann et al. 2016.)
4.2 Upper limits on proton contents in lobes:
the case of Cen A
Energetic particles in the lobes are thought to be injected by jets emanating from the central galaxy. There is mounting evidence (e.g. Krawczynski et al. 2012) that AGN jets are energetically and dynamically dominated by protons, albeit with an uncertain proton-to-electron number density ratio. This is deduced from limits on the electron (and positron) contents of jets deduced from the lack of soft-X-ray excesses, and based on insight gained from leptonic models of knots and blazars. Furthermore, X-ray cavities in galaxy clusters (interpreted as expanding bubbles from radio sources) require a significant pressure component, in addition to that of energetic electrons and magnetic fields, in order to overcome thermal intracluster gas pressure (e.g. Wilson et al. 2006). Jet protons can undergo photopion production through p– interactions, and most of the proton energy is eventually channeled into pair production. Due to their less efficient radiative losses, protons can be accelerated to much higher final energies than electrons. Acceleration is likely distributed along the jet because adiabatic and radiative cooling would cause the jet surface brightness to decrease much faster with galactocentric radius than observed (Blandford et al. 2018). If so, the electrically neutral NT plasma injected by the jet into the lobes would have a similar spectral index for protons and electrons, so their energy densities may be related, (e.g. Persic & Rephaeli 2014).
The pionic yield in the lobes can be estimated following the formalism in PR19. Assuming the proton energy distribution (PED) to be (with in GeV) in the interval 1-500 GeV and the thermal plasma to have a nominal density cm-3 (Stawarz et al. 2013 for Cen A), an upper limit (UL) to the proton content can be deduced from spectral considerations.
The SEDs of the S1 and S3 regions of Cen A are sufficiently detailed so that the dominance of the Compton components provides a meaningful basis for spectral analysis to set bounds on the proton contents. We consider the two extreme cases, (flat hump) and (spiky hump) for each region (as shown in Fig. 6). The Fermi-LAT data for S1 are interpreted as largely due to Compton scattering off the EBL, as is clearly reflected in the double-humped EBL profile. In a lepto-hadronic framework a substantial pionic hump tends to smooth out the Compton/EBL double hump feature if , and to enhance it unacceptably at low Fermi-LAT energies if : in both cases, eV cm-3. In a lepto-hadronic model for S3 a pion component contributes at the highest-energy () and lowest-energy () Fermi-LAT data points: we infer, respectively, eV cm-3 and eV cm-3. In all cases lepto-hadronic models are inconsistent with the measurements for relatively high PED normalizations.
By comparison, the Fermi-LAT spectrum of Fornax A has a humpy shape similar to pionic emission from a PED with and GeV. The spectrum peaks at the third point, which has the smallest error bars; the above specified pionic emission peaks at similar energies. This coincidence leads to eV cm-3, or possibly eV cm-3 (see Section 5). Steeper PED slopes make the pionic hump spikier and shift the pionic peak to lower energies; the larger uncertainty on the first Fermi-LAT point implies a weaker limit, eV cm-3 for (see Fig. 7).
For a given SED, limits are lower if is higher than the assumed nominal value. The number density of the thermal X-ray emitting gas in southern lobe of Cen A is cm-3 (Stawarz et al. 2013); for cm-3 the values would be a factor 2.5 lower than deduced above, e.g. eV cm-3 in S3 ().


5 Discussion
The electron energy density arises from SED-emitting electrons (index: ) and from electrons affected by non-radiative Coulomb losses (index: ; e.g. Rephaeli & Persic 2015). Table 1 reports the electron and magnetic energy density values for the current lobes and for Fornax A (PR19). The electron and magnetic contributions are comparable in Fornax A and Cen A; in the latter system increases with increasing galactocentric radius. On the other hand, the magnetic contributions are relatively small in Cen B and NGC 6251, as a consequence of the Compton humps in their SEDs being much more powerful than the synchrotron humps.
Although radiatively inconspicuous, energetic protons in the lobes may dominate the NT energy density. In Section 3 we deduced upper limits on the proton content based on current Fermi-LAT data, -40 eV cm-3 depending on the lobe (region) and PED spectral index. These limits were obtained without accounting for uncertainties in the EBL and GFL photon densities. Uncertainties in the EBL density arise also from the fact that it is based on large datasets with inhomogeneous error estimates (in addition to other systematic uncertainties, such as redshift-dependent galaxy luminosity functions; Franceschini & Rodighiero 2017). The main EBL components, the CIB and the COB, have 30% uncertainties (Cooray 2016). A higher/lower COB power implies a lower/higher if the latter is determined via Compton/EBL modelling of Fermi-LAT data (e.g., the S1 region of Cen A); this in turn implies a higher/lower in the synchrotron fit to the radio spectrum 444 For example if is taken 9% lower (to mimick a slightly lower COB), then in the Cen A S1 region and become, respectively, 25% higher and 10% lower. . The GFL suffers from observational uncertainties in the galaxy light distribution (Cen A: Dufour et al. 1979; Fornax A: Iodice et al. 2017), and from modeling uncertainties in the monochromatic to bolometric flux correction (e.g., Buzzoni et al. 2006) required to compute the dilution factor of the GFL blackbody model. A case in point is Fornax A, for which our estimate of the GFL photon field density (PR19) was based on nominal magnitude, color, and band-to-band magnitude conversion values adopted from the literature. The resulting nominal Compton/(EBL+GFL) flux slightly exceeds (by 10%, yet within error bars) the nominal Fermi-LAT fluxes. As a result, the deduced UL is biased low; correcting for this leads to a weaker bound, eV cm-3 for .
A lower limit to the proton content may be estimated assuming the lobe internal pressure to exceed the external (ambient) pressure. (Lobes are inflating bubbles in intergalactic space.) Since magnetic fields and relativistic electrons fall short of providing the required internal pressure, protons (NT and thermal) may provide the required pressure. For Cen A (see Table 1 for and ) this hypothesis leads to eV cm-3 (Wykes et al. 2013). The thermal pressure inside the lobes is much smaller: in the S lobe cm-3 and keV (Stawarz et al. 2013) imply a thermal energy density, , in the range 0.068-0.188 eV cm-3. So the above lower limit mainly applies to NT protons and is compatible with our ULs (see Fig. 6). 555 No information on thermal gas is available for the lobes of Cen B and NGC 6251. As to the latter, the lack of internal depolarization in the NW lobe implies, for a field strength of G and no field reversals in the lobe, cm-3 (see Willis et al. 1978). For Fornax A, cm-3 and keV (W lobe; Seta et al. 2013) hence eV cm-3.
In spite of these uncertainties we may compare the estimated limits on with nominal values deduced from the proton to electron energy density ratio, , in an electrically neutral NT plasma where both particle species have energy distributions as specified in Section 3. For , in Cen A’s S1, S3 regions, , whereas for , in Fornax A, (Persic & Rephaeli 2014). The corresponding values of (Table 1) imply nominal values of that are compatible with our estimated ULs.
The result is likely to be a more general feature in the energetics of radio lobes. After all, lobes originate in the highly non-equilibrium phenomenon of AGN jets, and their evolution is very different from that of older galactic systems that have attained a state of hydrostatic or virial equilibrium.
6 Conclusion
The SED analyses of Cen A, Cen B, and NGC 6251 are quite similar to those of SYMA16, K13 and T12, respectively, who reported and modeled original data for these sources; for Cen A we adopted the separation of each lobe to three rectangular spatial regions defined by SYMA16. However, our treatment is appreciably different from those in previous works in the following respects: (i) we use a single EED, i.e. a truncated PL, throughout – whereas SYMA16 used a generalized exponentially-cutoff PL that did produce analytically different EEDs in different lobe regions, whereas K13 and T12 used broken PLs. Doing so allowed us to make a more direct mutual comparison of the radiative properties of the different lobe regions; (ii) we use a more recent EBL model (Franceschini & Rodighiero 2017, 2018; Acciari et al. 2019); and (iii) we fully account for the contribution of the host galaxy to the enhanced radiation field in the lobes. Our results confirm the main conclusions of the earlier analyses and favour a leptonic origin of the NT emission in the three lobe systems; for Cen A, whose SED is spatially resolved, a spectral evolution from the inner to the outer regions is clearly seen. The SEDs of the S1 and S3 regions of Cen A are sufficiently detailed for a spectral analysis to constrain the proton content to within few tens of eV cm-3.
Acknowledgements
This research has used the NASA/IPAC Extragalactic Database (NED), which is operated by the Jet Propulsion Laboratory, Caltech, under contract with NASA.
| Energy density | Cen A-N1 | Cen A-N2 | Cen A-N3 | Cen A-S3 | Cen A-S2 | Cen A-S1 | Cen B | NGC 6251 | Fornax A | |
|---|---|---|---|---|---|---|---|---|---|---|
| 0.043 | 0.041 | 0.028 | 0.026 | 0.058 | 0.061 | 4.623 | 0.121 | 0.404 | ||
| 0.022 | 0.036 | 0.060 | 0.099 | 0.039 | 0.022 | 0.021 | 0.004 | 0.209 | ||
| 2.02 | 1.15 | 0.48 | 0.26 | 1.49 | 2.79 | 224.5 | 30.5 | 1.93 |
References
- [1] Abdallah H. et al. (H.E.S.S. Collab.), 2018, A&A, 619, A71
- [2] Abdo A.A. et al. (Fermi-LAT Collab.), 2010, Science, 328, 725
- [3] Acciari V., et al. (MAGIC Collab.), 2019, MNRAS, 486, 4233
- [4] Ackermann M. et al. (Fermi-LAT Collab.), 2016, ApJ, 826:1
- [5] Blandford R., Meier D., Readhead A., 2018, arXiv, 1812.06025
- [6] Bregman J.N., Snider B.A., Grego L., Cox C.V., 1998, ApJ, 499, 670
- [7] Buzzoni A., Arnaboldi M., Corradi R.L.M., 2006, MNRAS, 368, 877
- [8] Cooray A., 2016, Royal Society Open Science, 3, 150555
- [9] Crane P., Stiavelli M., King I.R., et al., 1993, AJ, 106, 1371
- [10] Day G.A., Thomas B.M., Goss W.M., 1969, Aust. J. Phys. Astrophys. Suppl., 11, 11
- [11] Dermer C.D., Menon G, 2009, High Energy Radiation from Black Holes (Princeton, NJ: Princeton University Press)
- [12] Dickey J.M., Lockman F.J., 1990, ARA&A, 28, 215
- [13] Dufour R.J., van den Bergh S., Harvel C.A., et al., 1979, AJ, 84, 284
- [14] Finlay F.A., Jones B.B., 1973, Aust. J. Phys., 26, 389
- [15] Franceschini A., Rodighiero G., 2017, A&A, 603, A 34
- [16] Franceschini A., Rodighiero G., 2018, A&A, 614, C 1
- [17] Franceschini A., Rodighiero G., Vaccari M., 2008, A&A, 487, 837
- [18] Gil de Paz A., Boissier S., Madore B., et al., 2007, ApJS, 173, 185
- [19] Golombek D., Miley G.K., Neugebauer G., 1988, AJ, 95, 26
- [20] Goss W.M., Shaver P.A., 1970, Aust. J. Phys. Astrophys. Suppl. 14, 1
- [21] Hardcastle M.J., Cheung C.C., Feain I.J., Stawarz Ł, 2009, MNRAS, 393, 1041
- [22] Harris G.L.H., Rejkuba M., Harris W.E., 2010, PASA, 27, 457
- [23] Haslam C.G.T., Salter C.J., Stoffel H., Wilson W.E., 1982, A&AS, 47, 1
- [24] Israel F.P., 1998, A&A Rev, 8, 237
- [25] Jones P.A., Lloyd B.D., McAdam W.B., 2001, MNRAS, 325, 817
- [26] Katsuta J., Tanaka Y.T., Stawarz Ł., et al., 2013, A&A, 550, A66 (K13)
- [27] Kesteven M.J.L., 1968, Aust. J. Phys., 21, 369
- [28] Komessaroff M.M., 1966, Aust. J. Phys., 19, 75
- [29] Kraft R.P., Vazquez S.E., Forman W.R., et al., 2003, ApJ, 592, 129
- [30] Krawczynski H., Böttcher M., Reimer A., 2012, in Relativistic Jets from Active Galactic Nuclei (eds. M. Böttcher, D.E. Harris, H. Krawczynski; Berlin: Wiley), p.215
- [31] Mack K.-H., Klein U., O’Dea C.P., Willis A.G., 1997, A&AS, 123, 423
- [32] Mathewson D.S., Healey J.R., Rome J.M., 1962, Aust. J. Phys., 15, 354
- [33] McAdam W.B., 1991, Proc. Astron. Soc. Aust., 9, 255
- [34] McKinley B., Briggs F., Gaensler B.M., et al., 2013, MNRAS, 436, 1286
- [35] McKinley B., Yang R., López-Caniego M., et al., 2015, MNRAS, 446, 3478
- [36] Mills B.Y., 1952, Aust. J. Sci. Res. 5, 266
- [37] Mills B.Y., Slee O.B., Hill E.R., 1961, Aust. J. Phys., 14, 497
- [38] Milne D.K., Hill E.R., 1969, Aust. J. Phys., 22, 211
- [39] O’Sullivan S.P., Feain I.J., McClure-Griffiths N.M., et al., 2013, ApJ, 764:162
- [40] Persic M., Rephaeli Y., 2007, A&A, 463, 481
- [41] Persic M., Rephaeli Y., 2014, A&A, 567, A 101
- [42] Persic M., Rephaeli Y., 2019, MNRAS, 485, 2001 (PR19)
- [43] Rephaeli Y., Persic M, 2015, ApJ, 805:111
- [44] Romanishin W., 1986, AJ, 91, 76
- [45] Sanders D.B., Mirabel I.F. 1996, ARAA, 34, 749
- [46] Schreier E.J., Feigelson E., Delvaille J., et al., 1979, ApJ 234, L39
- [47] Schröder A.C., Mamon G.A., Kraan-Korteweg R.C., Woudt P.A., 2007, A&A, 466, 481
- [48] Seta H., Tashiro M.S., Inoue S., 2013, PASJ, 65, 106
- [49] Shaver P.A., Goss W.M., 1970, Aust. J. Phys. Astrophys. Suppl., 14, 133
- [50] Stawarz Ł., Tanaka Y.T., Madejski G., et al., 2013, ApJ, 766:48
- [51] Sun X.-N., Yang R.-Z., McKinley B., Aharonian F., 2016, A&A, 595, A 29 (SYMA16)
- [52] Takeuchi Y., Kataoka J., Stawarz Ł., et al., 2012, ApJ, 749:66 (T12)
- [53] Tashiro M., Kaneda H., Makishima K., et al., 1998, ApJ, 499, 713
- [54] Willis A.G., Wilson A.S., Strom R.G. 1978, A&A, 66, L1
- [55] Yang R.-Z., Sahakyan N., de Ona Wilhelmi E., Aharonian F., Rieger F., 2012, A&A, 542, A 19
- [56] Wilson A.S., Smith D.A., Young A.J., 2006, ApJ, 644, L9
- [57] Wykes S., Croston J.H., Hardcastle M.J., et al., 2013, A&A, 558, A19