Long term multi-wavelength view of the blazar 1ES 1218+304
Abstract
In this work, we present a multi-wavelength study of the blazar 1ES 1218+304 using near simultaneous observations over 10 years during the period September 1, 2008 to August 31, 2018 (MJD 54710-58361). We have analyzed data from Swift-UVOT, Swift-XRT and Fermi-LAT to study the long term behaviour of 1ES 1218+304 in different energy bands over the last decade. We have also used the archival data from OVRO, MAXI and Swift-BAT available during the above period. The near simultaneous data on 1ES 1218+304 suggest that the long term multi-wavelength emission from the source is steady and does not show any significant change in the source activity. The optical/UV fluxes are found to be dominated by the host galaxy emission and can be modelled using the code. However, the time averaged X-ray and -ray emisions from the source are reproduced using a single zone leptonic model with log-parabolic distribution for the radiating particles. The intrinsic very high energy -ray emission during a low activity state of the source is broadly consistent with the predictions of the leptonic model for blazars. We have investigated the physical properties of the jet and the mass of the super massive black hole at the center of the host galaxy using long term X-ray observations from the Swift-XRT which is in agreement with the value derived using blackbody approximation of the host galaxy. We also discuss the extreme nature of the source on the basis of X-ray and -ray observations.
keywords:
active: galaxies – BL Lacertae objects: individual: 1ES 1218+304 –general: gamma-rays, X-rays – radiation mechanisms: non-thermal1 Introduction
Blazars are observed to be a dominant class of extragalactic - ray source in the Universe. These objects are characterized as radio-loud active galactic nuclei (AGN) having elliptical morphology and powerful relativitic plasma jets originating from its center. The relativistic jets in blazars are oriented along the line of sight of the observer within a few degrees of viewing angle (Urry & Padovani, 1995; Padovani et al., 2017). The blazar jets are believed to be powered by the accretion of matter onto a rotating supermassive black hole (SMBH) at the center of the host galaxy (Blandford & Znajek, 1977). The non-thermal emission from the jet dominates over the entire electromagnetic spectrum from radio to very high energy (VHE; E 100 GeV) -rays. The small viewing angle geometry of the blazar jets leads to the Doppler boosting and beaming of the non-thermal radiation emitted from the outflowing plasma. The distinctive observational properties of the multi-wavelength (MWL) emission from blazars such as superluminal motion, strong anisotropy, rapid variability and a high degree of polarization are attributed to the relativistic beaming effects. Blazars are generally classified in two groups namely Flat Spectrum Radio Quasars (FSRQs) and BL Lacertae objects (BL Lacs) on the basis of their optical emission/absorption line features (Urry & Padovani, 1995). FSRQs are observed to exhibit typical quasar-like optical spectra with strong and broad spectral lines whereas BL Lacs have mainly featureless optical spectra with weak/narrow or no spectral lines. The difference in the features of the optical spectra of the two types of blazars is attributed to the different accretion processes onto the central SMBH in the host galaxy (Ghisellini et al., 2009).
The broadband emission from blazars is generally described by a unique spectral energy distribution (SED) with two characteristic humps peaking at low and high energies (HE; E 100 MeV) respectively. The low energy component of the SED peaks at optical/X-ray energies and its origin is associated with the synchrotron emission of the relativistic electrons in the magnetic field of the jet (Romero et al., 2017). The origin of second hump in the blazar SED peaking at -ray energies is not clearly understood and different models have been proposed depending on the specific blazar (Romero et al., 2017). For most of the blazars, the observed -ray emission is ascribed to the leptonic models in which inverse Compton (IC) scattering of the low energy photons by the relativistic electrons in the jet results in the production of the highest energy -ray photons. The so called synchrotron self-Compton (SSC) model is the simplest scenario to explain the -ray emission mostly from the BL Lac type of blazars through the IC scattering of low energy synchrotron photons by the same population of relativistic electrons that produce synchrotron photons in the jet (Maraschi et al., 1992; Bloom & Marscher, 1996; Böttcher, 2007). If the soft target photons for the IC scattering originate from regions outside the jet, the process is referred to as external Compton (EC) and this model is generally invoked to explain the -ray emission from the FSRQ type of blazars (Dermer & Schlickeiser, 1993; Sikora et al., 1994; Yan et al., 2012). Time dependent one zone SSC models have also been proposed to explain the flaring activity of a few selected blazars (Mastichiadis et al., 2013; Singh et al., 2017). Alternatively, hadronic models are invoked to describe the HE -ray emission from a few blazars through the synchrotron radiation of ultra-relativistic protons in the jet magnetic field or through the photo-pion production followed by pion decay (Mannheim, 1993; Aharonian, 2000; Murase et al., 2012). However, a complete understanding of the –ray emission from blazars remains to be ascertained in high energy astrophysics.
In this paper, we use long term multi-wavelength (MWL) data available for the blazar 1ES 1218+304 to explore the properties of the broadband emission from the source. The important observational features of the source are briefly described in Section 2. In Section 3, we discuss the MWL observations and data analysis procedures followed for different instruments in the present study. Results derived from the long term MWL data are discussed in Section 4. Finally, the important findings of this work are summarized in Section 5. We have used the CDM model which provides the simplest description of the present cosmological observations with the model parameters H0 = 70 km s-1 Mpc-1, = 0.27 and = 0.73.
2 1ES 1218+304
The blazar 1ES 1218+304 first appeared in the catalogue of 3235 radio sources observed at 408 MHz with the Bologna Northern Cross telescope (B2 survey) in 1970 (Colla et al., 1970). In 1978, the Ariel V catalogue of 105 high galactic latitude sources reported this object as a new X-ray source 2A 1219+305 with irregular variability using the complete sky monitoring (2A survey) in the energy range 2-18 keV (Cooke et al., 1978). After its discovery as an unidentified X-ray source in the 2A catalogue, this source was identified as a BL Lac object using radio and optical observations in 1979 (Wilson et al., 1979). Photometry revealed a break in the optical-infrared spectral flux distribution of the source (Ledden et al., 1981). The broadband X-ray spectra of 1ES 1218+304 observed with the Einstein Observatory in the energy range 0.5-20 keV confirmed the presence of an absorption feature at an energy of 0.65 keV and the spectrum was found to be well described by a power law with Galactic gas absortion having a column density of 1.781020 cm-2 (Madejski et al., 1991). The faint radio images of the blazar 1ES 1218+304 at 20 cm were produced by the FIRST survey using the observations during April-May 1993 (Becker et al., 1995). The redshift = 0.182 for 1ES 1218+304 (PG 1218+304) was determined in 1997 using the spectroscopic measurements of the host galaxy (Bade et al., 1998). In 2001, observations with the XMM-Newton suggested that no broad absorption features are present in the X-ray spectra of 1ES 1218+304 and the earlier feature observed at 0.65 keV is transient (Blustin et al., 2004). On the basis of the previous observations in radio, optical and X-ray energy bands, 1ES 1218+304 was predicted to be a TeV BL Lac candidate with an estimated integral flux of 6.710-12 ph cm-2 s-1 above 0.3 TeV energy in 2002 (Costamante & Ghisellini, 2002). The MAGIC telescope discovered the first VHE -ray signal from 1ES 1218+304 with a 6.4 significance above an energy threshold of 0.12 TeV in 2005 (Albert et al., 2006). The integral flux above 0.35 TeV was found to be a factor two below the upper limit (8.310-12 ph cm-2 s-1) estimated from Whipple observations during 1995-2000 (Horan et al., 2004). The HEGRA telescopes also reported an upper limit on the integral flux as 2.6710-12 ph cm-2 s-1 above 0.84 TeV using the VHE observations during 1996-2002 (Aharonian et al., 2004). After the discovery of VHE -ray emission from 1ES 1218+304 by the MAGIC telescope, the source was the target of a HESS observation campaign in 2006 and the upper limit on the integral flux above 1.0 TeV was estimated to be 3.910-12 ph cm-2 s-1 (Aharonian et al., 2008). This upper limit was a factor six above the integral flux estimated from the extrapolation of the MAGIC spectrum. An upper limit of 7.210-11 ph cm-2 s-1 on the integral flux above 0.155 TeV was also estimated from the STACEE observations between 2006 and 2007 (Mueller et al., 2011). However, the VERITAS telescopes detected VHE -ray emission from 1ES 1218+304 with a statistical significance of 10.4 in 2007 confirming the discovery by the MAGIC collaboration and the integral flux above 0.2 TeV was estimated to be (12.22.6)10-12 ph cm-2 s-1 (Acciari et al., 2009). The first evidence for the variability in VHE -ray emission from the blazar 1ES 1218+304 was detected by the VERITAS telescope during the high activity of the source in 2009 (Acciari et al., 2010). The average integral flux above 0.2 TeV was found to be (18.40.9) 10-12 ph cm-2 s-1 during this period. The highest VHE -ray flux was observed to be 6010-12 ph cm-2 s-1 above 0.2 TeV during the flaring activity of the source in 2009. The TACTIC telescope monitored this source in 2013 and reported an upper limit of 3.4110-12 ph cm-2 s-1 above 1.1 TeV threshold energy (Singh et al., 2015). The Fermi-LAT (Large Area Telescoope) is continuously monitoring the HE -ray emission from 1ES 1218+304 and has reported this source as one of hardest spectrum blazar above 0.1 GeV in its successive catalogs (Nolan et al., 2012; Acero et al., 2015; Ajello et al., 2017).
3 MWL Observations and data analysis
3.1 High energy - ray
The Large Area Telescope (LAT) on board the Fermi Gamma-ray Space Telescope satellite (Fermi-LAT) provides HE observations of the blazars in the energy range from 30 MeV to more than 500 GeV (Atwood et al., 2009). We have used 10 years of Pass 8 data from the Fermi-LAT observations of the blazar 1ES 1218+304 between September 1, 2008 and August 31, 2018 (MJD 54710-58361) in the energy range of 0.1-300 GeV. The reprocessed Pass 8 data sets with P8R2SOURCEV6 instrument response functions have been downloaded from the publicly available Fermi-LAT data server111https://fermi.gsfc.nasa.gov/cgi-bin/ssc/LAT/LATDataQuery. We have analyzed data following the standard procedures implemented in the Fermi ScienceTools software package version v11r5p3. Only class events ( and ) within a circular region of interest (ROI) of 10∘ radius centered at the position of 1ES 1218+304 with good time intervals and maximum zenith angle 90∘ were selected for the analysis. We have included all 3FGL (Third Fermi-LAT source catalogue) point sources (Acero et al., 2015) within 20∘ from the ROI center as well as Galactic diffuse (glliemvo6.fit) and extragalactic isotropic (isoP8R2SOURCEV6v06.txt) emission templates in the source model file for the background subtraction. The spectral shape of all the sources in the model file are the same as reported in the 3FGL catalogue and the associated spectral parameters have been kept free to vary during the unbinned likelihood analysis using gtlike. The target source 1ES 1218+304 is modelled using a power law distribution with normalization and spectral index allowed to vary during the fitting. The statistical significance of the HE -ray signal in the energy range 0.1-300 GeV is determined from the maximum likelihood ratio test statistic (the statistical significance is estimated from the square root of the value of test statistic) defined in (Mattox et al., 1996). We have derived the integral flux in the energy range 0.1-300 GeV averaged over 60 days for 1ES 1218+304 so that the individual flux points in the light curve have TS 15 ( 4 significance).
3.2 Hard X-ray
We have used the archival data from hard X-ray observations of the blazar 1ES 1218+304 in two enegry bands 15-50 keV and 10-20 keV available during the period considered in this study. The Burst Alert Telescope (BAT) on board the Neil Gehrels Swift Observatory (Swift-BAT) provides daily light curves of blazars in the energy range 15-50 keV using transient observations (Krimm et al., 2013) and the data are available to the public online222https://swift.gsfc.nasa.gov/results/transients. The MAXI (Monitor of All sky X-ray Image) (MAXI) telescope on board the JEM satellite has started regular observations since August 2009 (Matsuoka et al., 2009). We have used the MAXI on-demand process333http://maxi.riken.jp/mxondem/ to obtain the daily light curve of the blazar 1ES 1218+304 in the energy range 10-20 keV. We have considered only 2 photon flux measurements to convert into the corresponding energy flux values using the appropriate mean energies for both the data sets from Swift-BAT and MAXI observations.
3.3 Soft X-ray
The X-Ray Telescope (XRT) on board the Neil Gehrels Swift Observatory (Swift-XRT) provides observations of blazars at soft X-rays in the energy range 0.2-10 keV (Burrows et al., 2005). We have used the XRT data collected in photon counting (PC) and window timing (WT) modes for the blazar 1ES 1218+304 during the period September 1, 2008 to August 31, 2018 from the Swift multi-wavelength observation program444https://www.swift.psu.edu/monitoring. The XRT observations with exposure time more than 1 ks have been used for analysis using the standard XRTDAS tools distributed within the HEAsoft package (v6.24)555https://heasarc.gsfc.nasa.gov/lheasoft/download.html. We have used the xrtpipeline script with recent calibration files (CALDB) to analyse the data in the energy range 0.3-10 keV. The source and background spectra are produced using xselect tool. The ancillary response files (ARFs) have been generated using xrtmkarf task after applying the corrections due to the point spread function and CCD defects. All the observations are binned to have a minimum of 20 counts per spectral bin using grppha utility. The spectral fitting is performed using a power law model with Galactic absorption using xspec model for source redshift = 0.182. The equivalent line-of-sight neutral hydrogen column density is fixed to the value obtained from the LAB (Leiden/Argentine/Bonn) Survey of Galactic HI (Kalberla et al., 2005).
3.4 Ultra-violet/Optical
The UV/Optical Telescope (UVOT) on board the Neil Gehrels Swift Observatory (Swift-UVOT) provides observations of blazars in the wavelength range 160-600 nm (Roming et al., 2005). The data for individual sources are made available in three ultraviolet (W1,M2,W2) and three optical (V,B,U) filters. We have analyzed the Swift-UVOT data available from the daily observations of the blazar 1ES 1218+304 during September 1, 2008 to August 31, 2018 using the online UVOT Interactive Analysis tools666https://www.ssdc.asi.it/mmia/index.php?mission=swiftmastr, which are based on the standard software tasks included in the HEAsoft package (v6.23). The data were analyzed using uvotdetect task and 20170922 version of CALDB . We have extracted the source counts from a circular region of 5′′ radius centered at the source position, while background counts are derived from an annulus region with an inner radius of 27′′ and an outer radius of 35′′, centered at the source location. The magnitude at the source position is dereddened using the value of E(B-V) equal to 0.0172 according to (Schlegel et al., 1998; Schlafly & Finkbeiner, 2011) and mean galactic extinction curve reported in (Fitzpatrick, 1999). The dereddened magnitudes of the source from different filters are then converted into corresponding energy flux points.
3.5 Radio
We have obtained the radio data on 1ES 1218+304 (J1217+3007) available between September 1, 2008 and August 31, 2018 from the OVRO (Owens Valley Radio Observatory) 40 M blazar monitoring program (Richards et al., 2011). The OVRO 40 M telescope has been regularly monitoring large number of blazars since 2008 and provides daily light curves for individual sources. The long term radio data at 15 GHz is available online to the public from the monitoring of selected Fermi blazars777http://www.astro.caltech.edu/ovroblazars/data.php?page=data. The details of OVRO observation program and data anlayis procedure are described in (Richards et al., 2011).
4 Results and Discussion
4.1 Long term behaviour of 1ES 1218+304
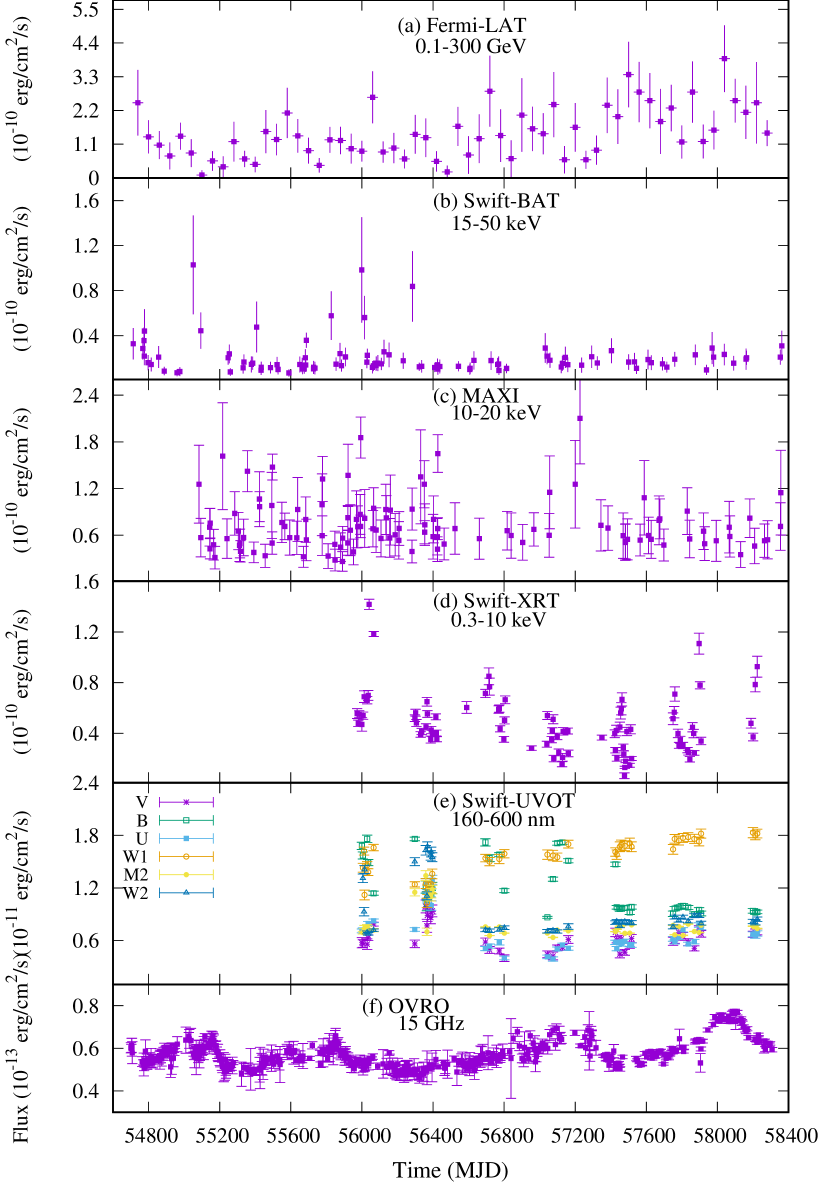
The MWL light curves of the blazar 1ES 1218+304 over a decade from September 1, 2008 to August 31, 2018 (MJD 54710-58361) shown in Fig. 1(a-f), characterize the long term emission behaviour of the source in different energy bands. In Figure 1(a), we have reported 60 days binned flux points in the energy range 0.1-300 GeV from the Fermi-LAT observations. All the flux points in the Fermi-LAT light curve of the source have statistical significance more than 4. The two months averaged light curve from the long term Fermi-LAT observations suggests moderate HE -ray emission from the blazar and indicates a low activity state of the source. The average flux level in the energy range 0.1-300 GeV is found to be (8.030.81)10-11 erg cm-2 s-1 which is approximately eight times higher than the upper limit derived from the EGRET observations of the source above 0.1 GeV during 1991-1995 (Hartman et al., 1999). The hard X-ray emissions from the blazar 1ES 1218+304 during the above period observed with Swift-BAT and MAXI in the energy bands 15-50 keV and 10-20 keV are shown Figure 1(b) & (c) respectively. The daily light curves from the Swift-BAT and MAXI observations in 1(b) & (c) respectively include only 2 flux points. The average X-ray flux levels in the energy bands 15-50 keV and 10-20 keV from the source are observed to be (1.370.16)10-11 erg cm-2 s-1 and (6.080.26)10-11 erg cm-2 s-1 respectively. It is observed from the Swift-BAT light curve that most of the flux measurements are consistent with the average emission level of the source in a low activity state. Near simultaneous soft X-ray emissions observed with the Swift-XRT in the energy range 0.3-10 keV are shown in Figure 1(d). The daily averaged flux points in the Swift-XRT light curve suggest an average flux level of (3.650.23)10-11 erg cm-2 s-1 which is found to be in agreement with the XMM-Newton measurements of 1ES 1218+304 in the energy range 2-10 keV in 2001 (Blustin et al., 2004). It is important here to mention that one day NuSTAR observation of 1ES 1218+304 in 2015 found a hint of intraday variability in the X-ray emission of the source in the energy range 3-79 keV and the average flux level in this energy band was estimated to be (1.190.03)10-11 erg cm-2 s-1 (Pandey et al., 2018). The daily light curves from the Swift-UVOT observations in three optical (V,B,U) and three UV (W1,M2,W2) bands are reported in Figure 1(e). The long term UV/optical emissions in the wavelength range 160-600 nm have an average flux level 10-11 erg cm-2 s-1. In 2010, optical observations of the blazar 1ES 1218+304 in the R band on three nights suggested a hint of variability on one night (Gopal-Krishna et al., 2011). A clear fading by 0.1 magnitude in the R band was also detected between the first two nights separated by 10 days. The daily radio light curve at 15 GHz from the OVRO telescope depicted in Figure 1(f) gives an average flux level of (5.730.03)10-14 erg cm-2 s-1 during the 10 years of observations of the source. The long term MWL light curves of the blazar 1ES 1218+304 suggest that the activity of the source in different energy bands over 10 years can be characterized as the low emission state with some fluctuations in X-ray energy bands. However, no significant change in the broadband emission activity of the source is observed in this study.
4.2 Variability
The flux variability in a given light curve is a convolution of the intrinsic physical processes in the source and statistical uncertainty of the measurement. In order to characterize the presence of intrinsic variability in the MWL light curves of the source, we have estimated the fractional variability amplitude () parameter in different energy bands because it is corrected for the measurement noise. The variability amplitude characterized by is calculated from the intrinsic excess variance of a light curve after subtracting out the contribution of additional variance due to the uncertainty in the individual flux measurements. The is defined as (Vaughan et al., 2003)
| (1) |
and the formal error in is given by (Vaughan et al., 2003)
| (2) |
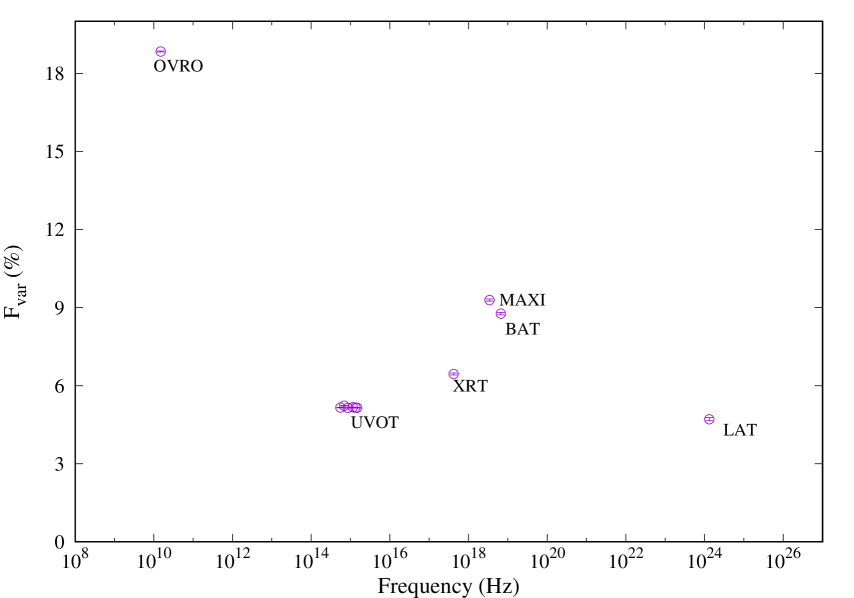
where is the variance of the light curve, is the average flux, is the mean of the squared error in the flux measurements and is the number of flux points in a light curve. The intrinsic variability characterization using the parameter is important due to the fact that it takes into account the errors in the flux measurements. The contribution of measurement errors (Poisson noise) is subtracted from the variance of a light curve for the calculation of . The estimated values of using Equation (1) as a function of the mean energy for different instruments are shown in Figure 2. It is clear from Figure 2 that the radio emission at 15 GHz exhibits more variability than higher energy light curves of the source. The optical/UV and HE -ray emissions show very small intrinsic variations whereas the hard X-ray light curves from MAXI and Swift-BAT have relatively more intrinsic variability. The values of strongly depend on the time-binning of the light curves. A light curve with longer time bins can give give smaller values of because large time bins smooth out the variability. Therefore, the lowest value of for the Fermi-LAT light curve can be attributed to the 60 days time binning. The sampling of the daily radio light curves is better than other daily light curves and hence the higher value of for radio. The values of in the different energy bands suggest that the long term broadband emission from the blazar 1ES 1218+304 is nearly steady with small amplitude fluctuations and does not show any signature of short term variability. Whereas the VERITAS telescope detected a flaring activity with variability on days timescale in the VHE band during Januray 2009 monitoring of the blazar 1ES 1218+304 (Acciari et al., 2010).
4.3 X-ray Photon Index-Flux Correlation
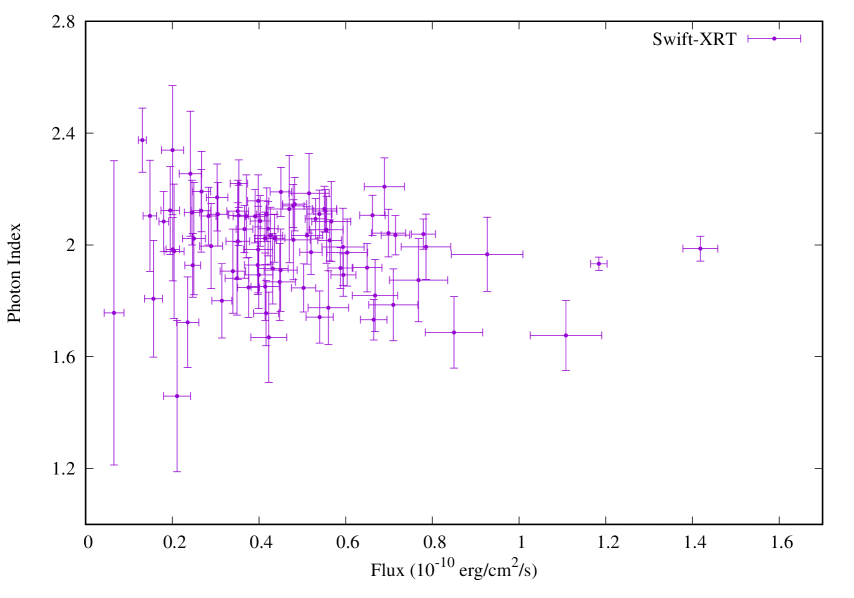
The correlation between the X-ray integral flux in the energy range 0.3-10 keV and photon index from the long term observations of the blazar 1ES 1218+304 using the Swift-XRT is shown in Figure 3. We observe a hint for spectral hardening in the scatter plot with decreasing photon index as a function of integral flux. We have performed a Pearson correlation analysis to quantify the degree of linear correlation between the integral flux and photon index. The value of the Pearson correlation coefficient is obtained is -0.20 with a probability of null hypothesis as 0.067. This suggests that the value of Pearson correlation coefficient for the X-ray photon index and integral flux is not very significant at the 99 confidence level. The power law photon index in the energy range 0.3-10 keV is found to be consistent with an average value of 1.990.16 and the average integral flux above 0.3 keV is (3.650.23)10-11 erg cm-2 s-1 from the long term observations of the blazar 1ES 1218+304 with the Swift-XRT. The long term X-ray spectral study of 1ES 1218+304 reported by Wierzcholska & Wagner (2016) suggests that the X-ray spectrum of the source can also be described by a log-parabola model with the values of the spectral index and curvature parameter being 2.0 and 0.1 respectively for fixed values of Galactic absorption taken from different surveys. Whereas if the Galactic absoprtion is kept free, the X-ray spectrum is described by a spectral index of 1.960.06 and curvature parameter of 0.220.08. The integral flux in the energy range 0.3-10 keV is estimated to be 3.3310-11 erg cm-2 s-1 which is consistent with the value of integral flux obtained in the present study of the source. Therefore, the long term spectral behaviour in the energy range 0.3-10 keV suggests that 1ES 1218+304 is a hard X-ray spectra blazar with a power law photon index 2.0.
| Epoch | Energy Range | Reference | ||
|---|---|---|---|---|
| (TeV) | (TeV) | |||
| 2005 | 0.087-0.630 | 0.25 | 3.00.4 | MAGIC (Albert et al., 2006) |
| 2007 | 0.16- 1.8 | 0.50 | 3.080.34 | VERITAS (Acciari et al., 2009) |
| 2009 | 0.16-1.8 | 0.50 | 3.070.09 | VERITAS (Acciari et al., 2010) |
4.4 -ray Spectra
The time averaged HE -ray spectrum of the blazar 1ES 1218+304 is well described by a simple power law with a photon spectral index of 1.670.05 in the energy range 0.1-300 GeV from the Fermi-LAT observations during during September 1, 2008 - August 31, 2018 (MJD 54710-58361). This is consistent with the value reported in the 3FGL catalogue based on first four years of the Fermi observations (Acero et al., 2015). In the VHE band, statistically significant detections of -ray photons from 1ES 1218+304 at three occasions have been reported by ground based Cherenkov telescopes like MAGIC and VERITAS. The observed differential VHE -ray spectra are described by a power law of the form
| (3) |
where is the flux normalization at energy and is the observed photon spectral index. The values of photon spectral indices derived from the VHE -ray observations of 1ES 1218+304 at different epochs are summarized in Table 1 from the literature. It is evident from the values of 3.0 that the observed VHE -ray spectra of the blazar 1ES 1218+304 at three epochs is softer than the HE spectrum measured from the Fermi-LAT.
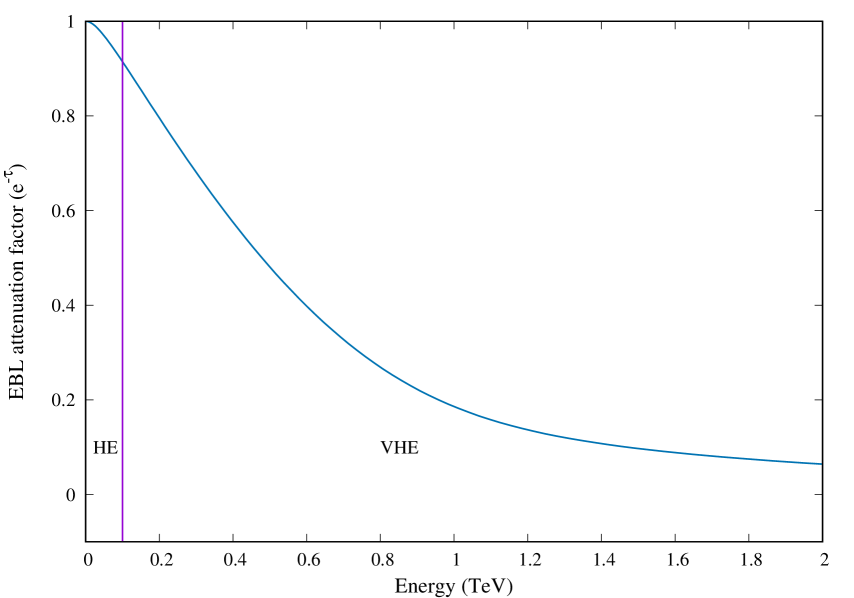
The softening of the observed VHE spectra can be attributed to the absorption of TeV photons by the low energy extragalactic background light (EBL) due to the high redshift () of the source. The -ray photons are attenuated by interacting with the IR/optical photons of the EBL via pair production while propagating from source to the observer (Gould & Schréder, 1966). The attenuation of photons is characterized by the optical-depth () which strongly depends on the density of EBL photons, observed -ray photon energy () and redshift () of the source. For a given source, the observed -ray flux () is related to the emitted flux () by the relation
| (4) |
where is referred to as the EBL attenuation factor. In order to characterize the attenuation of -ray photons emitted from the blazar 1ES 1218+304, we have estimated the optical depth () in the energy range 0.1 GeV-2 TeV following the methodology described in (Singh et al., 2014) for the density of EBL photons predicted by Finke et al. (2010). The corresponding EBL attenuation factor as a function of -ray photon energy for redshift is shown in Figure 4. It is evident from Figure 4 that the EBL attenuation is negligible for HE photons whereas VHE photons are significantly attenuated. Therefore, observed VHE flux points from the blazar 1ES 1218+304 must be corrected for EBL absorption using Equation (4) to predict the intrinsic VHE spectra emitted from the source. The intrinsic VHE spectra of 1ES 1218+304 during three epochs (Table 1) are found to be described by a power law with photon spectral indices 2. Acciari et al. (2009) have constrained the intrinsic VHE spectrum of the source to be harder than = 1.860.37. The Fermi-LAT observations in the energy 10 GeV - 2 TeV have also estimated hard power law spectrum for the blazar 1ES 1218+304 with = 1.4720.156 in the Third Catalog of Hard Fermi-LAT Sources (3FHL) using the first 7 years of data (Ajello et al., 2017). These results suggest that the -ray spectra of 1ES 1218+304 is a hard power law with photon spectral index 2. During the 2009 campaign of the source, a significant increase in the flux level above 0.12 TeV was detected by the VERITAS telescope with the highest flux level on the nights of January 30 and 31 (Acciari et al., 2010). However, no evidence for change in the VHE spectral index was found during the high activity state of the source. This suggests that the harder-when-brighter feature of blazars was not observed in the VHE -ray emission from the blazar 1ES 1218+304.
4.5 Spectral Energy Distribution
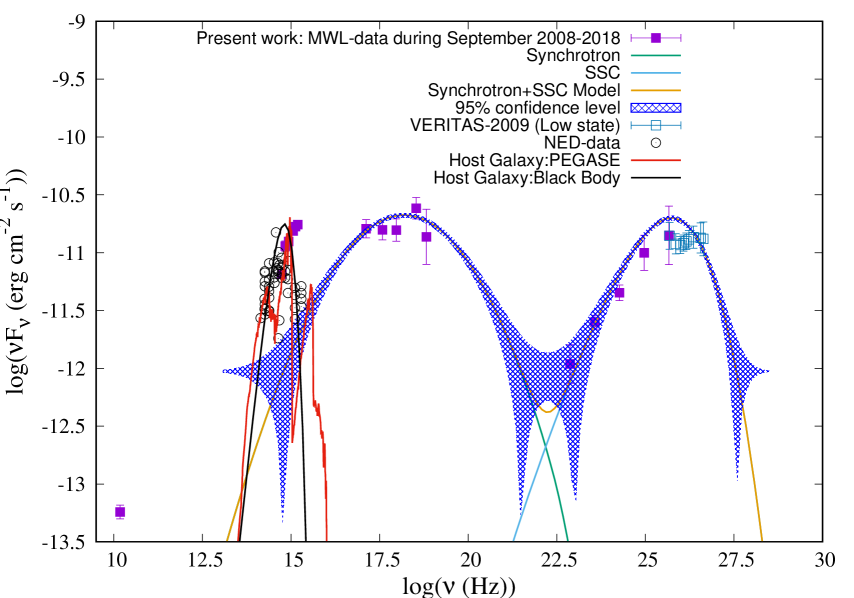
The time averaged broadband emission from the blazar 1ES 1218+304 in radio, optical/UV, X-ray and -ray bands measured from different instruments during September 1, 2008 - August 31, 2018 is depicted in Figure 5. In the VHE -ray band, we have used flux points from the VERITAS observations of the source in a low activity state during January - May 2009 (Acciari et al., 2010). The VHE flux points from the VERITAS observations have been corrected for EBL absorption using the model for density of low energy background photons proposed in (Finke et al., 2010). We use a simple one zone leptonic model to reproduce the broadband emissions from the blazar 1ES 1218+304. The model is fully described in (Tramacere et al., 2011, 2009; Massaro et al., 2006). In brief, the non-thermal emission region in the jet is assumed to be a spherical blob of radius filled with plasma of relativistic leptons (e±) and cold hadrons (protons at rest). The emission region is entangled with a constant and uniform magnetic field . The distribution of relativistic electrons in the emission region is described by a function. The differential electron distribution per unit volume is given by
| (5) |
where is the normalization constant, is the Lorentz factor of electrons (and positrons) in the blob rest frame, is the turn-over Lorentz factor, and are spectral index and curvature parameter respectively. and are the Lorentz factors corresponding to the minimum and maximum energies of the electron distribution. The relativistic electrons described by Equation (5) emit electromagnetic radiation through synchrotron and SSC processes in the emission region. The emission region is considered to be relativistically moving and therefore the emitted radiation is boosted by the Doppler factor given by
| (6) |
where is bulk speed of the jet in the units of speed of light in vacuum , is the bulk Lorentz factor and is viewing angle. The observed synchrotron and SSC fluxes are estimated using the AGN-SED simulator tool888http://www.isdc.unige.ch/sedtool/PROD/SED.html. The theoretical braodband SED calculated for the blazar 1ES 1218+304 from the model described above is shown in Figure 5. It is observed that the simple one zone SSC model with parameters reported in Table 2 satisfactorily reproduces the broadband emission from 1ES 1218+304 except the optical/UV flux points. The optical/UV measurements are higher than the non-thermal emission from the jet predicted by the SSC model. Also, the long term observations of 1ES 1218+304 reported in the NASA/IPAC Extragalactic Database (NED)999https://ned.ipac.caltech.edu indicate that the UV/optical/IR flux points are higher than the jet emission. These observations suggest that the stellar emission from the host galaxy of the source is dominant at optical/UV frequencies. In order to accurately account for the stellar emission due to the host galaxy, we have used the PEGASE.3 (Program for the study of galaxies by evolutionary synthesis) code101010http://www2.iap.fr/pegase to model the optical/UV fluxes (Fioc & Rocca-Volmerange, 2019). The PEGASE.3 code takes into account the evolution of stars, gas and dust, and their radiative energy output to reliably model the evolution of the host galaxy. We have used the default values provided in the PEGASE.3 code to initiate the simulation. The evolution of host galaxy is modelled using three gas infall periods lasting 3 years each representing the historic mergers during the evolution and last infall ending 109 years before the present epoch. Each infall initiates an intense star and dust formation epoch as well as reddenning of the host galaxy spectrum. The resulting spectrum at 14.4 years is normalized to the mass of galaxy hosting the blazar 1ES 1218+304 and has been converted to flux at the redshift . The associated mass of the host galaxy is found to be 5.12. The final spectral energy distribution of the host galaxy is shown in Figure 5 along with the NED data points. We observe that stellar emission from the host galaxy predicted by the PEGASE.3 code dominates over the non-thermal jet emission and is broadly consistent with the optical/UV flux measurements from the source. We have also used a black-body approximation with a radius of 9.71015 cm and a temperature of 9000K to reproduce the stellar emission due to the host galaxy of the blazar 1ES 1218+304.
The log-parabola distribution of electrons in the emission region can be an outcome of statistical and stochastic acceleration processes with acceleration efficiency inversely proportional to the energy of electrons in the jet (Massaro et al., 2006). The fluctuations in the energy gain by the accelerating particles introduce a curvature () in the power law spectrum () and hence the broadening in the spectral shape. The curvature in the log-parabolic distribution is also related to the diffusion in the momentum space with curvature parameter () being inversely proportional to the diffusion coefficient (Tramacere et al., 2011). This leads to an inverse correlation between the curvature parameter and peak frequencies in the low (synchrotron) and high (IC) energy components of the broadband SED. Therefore, the curvature in the spectrum can be attributed to the acceleration process and radiative cooling of relativistic electrons. The radiative cooling due to synchrotron and IC processes moves high energy radiating particles (electrons) to lower energies. This results in the increased curvature at low energies and soft spectrum at high energies. Rüger et al. (2010) have fitted the contemporaneous data in X-ray and VHE -ray bands on 1ES 1218+304 using a SSC model involving an electron distribution as a power law with exponential cut-off. The model parameters inferred from this fitting suggest that the power spectral index can be due to the Fermi acceleration process. However, this was found to be inconsistent with the hard electron distribution with derived from the X-ray observations during flaring activity of the source in the energy range 5-10 keV in 2006 (Sato et al., 2008). Archambault et al. (2014) used simultaneous X-ray and VHE observations as well as contemporaneous optical and HE data to model the broadband SED of 1ES 1218+304 with a single zone SSC model assuming the electron energy spectrum described by a broken power law. A spectral break in the electron spectrum larger than that expected from the radiative cooling involving synchrotron and IC processes was obtained from the SED modelling. This indicated the contribution of particle acceleration to the observed spectral break in the electron energy spectrum. Ding et al. (2017) have modelled the quasi-simultaneous broadband SED of 1ES 1218+304 using a single zone SSC model with the electron energy distribution as log-parabolic spectrum. Recently, the electron distribution with smooth broken power law and very small magnetic field (G) has also been used to fit the broadband SED of 1218+304 under one zone SSC model (Costamante et al., 2018). A hadronic model with proton synchrotron and lepto-hadronic scenarios has also been invoked to explore the properties of broadband emissions from the blazar 1ES 1218+304 (Cerruti et al., 2015). Therefore, the model parameter space for broadband emission from 1ES 1218+304 is degenerate like many other blazars and the parameters derived in the present study (Table 2) represent one of the probable set of model parameters for this source. The set of model parameters obtained in this study corresponds to the lowest jet Doppler factor ( 26) as compared to the values derived from different SED modelling by various authors discussed above. As discussed in Section 4.2, the estimated values of in different energy bands suggest nearly steady broadband emission from the source during the last decade. However, higher values of the for a given light curve indicate flux variability, which can be associated with the spectral change in that energy band. This spectral change can cause variation in the SED which strongly depends on the spectrum of emitting particles. Therefore, the physical parameters of the model may vary significantly from the values reported in Table 2. Hence, we have constructed a 95 confidence level for the model SED in Figure 5 to include the effect of observed small variability in the X-ray and HE -ray bands.
| Parameter | Symbol | Value |
|---|---|---|
| Redshift | 0.182 | |
| Size of the emission region | 2.21015 cm | |
| Jet viewing angle | 1.4∘ | |
| Bulk Lorentz factor of jet | 15 | |
| Doppler factor | 26 | |
| Electron spectral index | 1.8 | |
| Curvature parameter | 0.5 | |
| Turnover Lorentz factor | 2.5104 | |
| Maximum Lorentz factor | 5.5107 | |
| Minimum Lorent factor | 6 | |
| Magnetic field | B | 0.22 G |
| Electron energy density | Ue | 0.16 erg cm-3 |
| Proton energy density | 1.810-3 erg cm-3 |
4.6 Physical Properties of Jet
The modelling of the broadband emission using the radiative processes can be used to probe some of the physical properties of the emission region in the relativistic jet of the blazar. From the SED modelling of 1ES 1218+304, the jet is found to be closely aligned along the line of sight of the observer with viewing angle of 1.4∘. The emission region composing of electron-proton plasma moves relativistically along the jet axis with bulk Lorentz factor 15. In the leptonic emission scenario, the radiative output is dominated by the relativsitic electrons and the protons are at rest due to their larger mass in the comoving frame. Therefore the contribution of protons to the radiative output is not significant, but they can carry a significant fraction of jet kinetic power. The total kinetic power of the jet in the rest frame of the host galaxy of 1ES 1218+304 is given by (Celotti et al., 1997)
| (7) |
where , are are comoving energy densities assocaited with electrons, magnetic field and cold protons respectively. From the best fit SED parameters reported in Table 2, the kinetic power of jet is found to be 1.241044 erg s-1 and the total radiative power is 3.21042 erg s-1. This indicates that only small fraction of the total jet power is converted into the radiative output. Assuming that the blazar jets are driven by the rotation and accretion of the SMBH at the center of the host galaxy, the jet power strongly depends on the mass of black hole (Davis & Laor, 2011). The correlation between the intrinsic X-ray luminosity in the energy range 2-10 keV () and mass of SMBHs () is described by the empirical relation (Mayers et al., 2018)
| (8) |
where is the solar mass. Using the value of 1.121045 erg s-1 from the Swift-XRT observations in Equation (8), we get an estimate for the mass of SMBH as 6.0108 for the blazar 1ES 1218+304. This is in agreement with the central black hole mass 5.6108 estimated for 1ES 1218+304 using black body approximation for the host galaxy (Rüger et al., 2010). The Eddington luminosity for the SMBH is given by
| (9) |
For 6.0108 derived in this study, we obtain the Eddington luminosity to be 7.51046 erg s-1 which is much larger than the jet power estimated above. This suggests that the jet of 1ES 1218+304 emits at sub-Eddington limit which is consistent with the broadband emission from the BL Lac type of blazars.
4.7 1ES 1218+304: An Extreme Blazar
According to the classification scheme based on synchrotron peak frequency in the broadband SED, blazars with synchrotron peak frequency above 1015 Hz are referred to as High Synchrotron-Peaked (HSP) sources (Abdo et al., 2010). Recent hard X-ray observations of HSP blazars indicate the presence of a small group of sources with synchrotron peak frequency above 1017 Hz (Costamante et al., 2018; Costamante & Ghisellini, 2002). Other observational features of these sources include hard X-ray and TeV -ray spectra, large X-ray to radio flux ratio and lack of short term variability (Bonnoli et al., 2015). Sources with these peculiar characteristics are termed as Extremely High Synchrotron-Peaked or simply Extreme Blazars (Singh et al., 2019). Due to the hard X-ray spectrum ( 2), the synchrotron peak in the low energy component of the SED is located at energies above few keV. Similarly, the intrinsic TeV spectrum of extreme blazars is exceptionally hard resulting which the IC peak in the broadband SED is located at energies above 1 TeV. Due to the hard intrinsic -ray spectrum, exterme blazars are relatively faint in the Fermi-LAT energy range. In the present study, the time averaged X-ray spectrum of 1ES 1218+304 obtained from the long term Swift-XRT observations is hard with photon spectral index of 1.990.01 (Section 4.3). Also, the intrinisic TeV spectra of the source derived from the MAGIC and VERITAS observations are described by a power law with photon spectral index 2 (Section 4.4). Therefore, the X-ray and TeV -ray spectral characteristics of 1ES 1218+304 indicate extreme nature of the source. However, detection of the near simultaneous strong X-ray and TeV -ray flare from 1ES 1218+304 on February 26, 2009 (MJD 54888) with variability at day timescale (Archambault et al., 2014) contradicts the extreme behaviour of the source. Therefore, 1ES 1218+304 is a normal HSP blazar and its extreme nature can be investigated in future from the dedicated long term simultaneous X-ray and -ray observations.
5 Conclusions
In the present work, we have reported the long term study of the blazar 1ES 1218+304 using 10 years of contemporaneous MWL data from space and ground based observations between September 1, 2008 and August 31, 2018. This study provides first detailed investigation of the behaviour of broadband emissions from the source. The important findings about the nature of emissions from the blazar 1ES 1218+304 are :
-
•
Near simultaneous multi-wavelength light curves from radio to HE -ray indicate a low emission state of the source. No significant change in the long term emission activity in different energy bands is observed.
-
•
The emissions in various wavebands exhibit intrinsic variability with small fractional variability amplitude ( = 4.5-10) except in radio where variability is found to be relatively higher ( 18). However, no sginature of any short term variability is obtained in the MWL light curves.
-
•
The X-ray emission in the energy range 0.3-10 keV is described by a hard power law with time averaged photon spectral index of 1.99. A hint for spectral hardening is observed in the scatter plot of daily integral flux above 0.3 keV vs photon spectral index.
-
•
The HE -ray emission in the energy range is also described by a power law with spectral index of 1.67 suggesting that the blazar 1ES 1218+304 is a hard -ray source. The VHE -ray emissions in the low activity state of this source detected by the MAGIC and VERITAS telescopes are observed to suffer a large attenuation due to EBL absorption and the intrinsic VHE emission is consistent with the hard photon spectral index of 2.
-
•
The broadband SED of the source can be broadly reproduced by a leptonic simple one zone SSC model with the electron energy distribution described by a log-parabolic function. The optical and UV emissions from the source are found to be dominated by the stellar thermal emissions from the host galaxy and can be modelled using the PEGASE.3 code for the evolution of galaxies and also by a simple black-body approximation. However, dedicated optical/UV observations of the blazar 1ES 1218+304 are required to estimate the exact host galaxy contribution to the jet emission.
-
•
The X-ray observations from the Swift-XRT suggest that the mass of SMBH at the center of host galaxy is 6.0108 and the broadband emissions from the source are consistent with the sub-Eddington jet activity.
-
•
Due to its hard X-ray and TeV -ray spectra, the blazar 1ES 1218+304 is an important source for probing (i) the particle acceleration mechanisms that can produce hard power law distribution in the jet and (ii) the intergalactic magnetic field using the cascade emission and (iii) cosmic infrared component of EBL. The source is also important for observations with the upcoming CTA (Cherenkov Telescope Array) observatory to establish the link between the TeV -ray emission and MeV-GeV emission measured from the Fermi-LAT and its extreme blazar behaviour.
Acknowledgements
Authors thank the anonymous reviewer for the critical and valuable comments to improve the manuscript. We acknowledge the use of public data obtained through Fermi Science Support Center (FSSC) provided by NASA and Swift-BAT transient monitor results provided by the Swift/BAT team. This research has made use of MAXI data provided by RIKEN, JAXA and the MAXI team. We also acknowledge the use of X-ray data supplied by the UK Swift Science Data Centre at the University of Leicester. This research has made use of data from the OVRO 40-m monitoring program (Richards, J. L. et al. 2011, ApJS, 194, 29) which is supported in part by NASA grants NNX08AW31G, NNX11A043G, and NNX14AQ89G and NSF grants AST-0808050 and AST-1109911.
References
- Abdo et al. (2010) Abdo A. A., et al., 2010, ApJ, 716, 30
- Acciari et al. (2009) Acciari V. A., et al., 2009, ApJ, 695, 1370
- Acciari et al. (2010) Acciari V. A., et al., 2010, ApJ, 709, L163
- Acero et al. (2015) Acero F., et al., 2015, ApJS, 218, 23
- Aharonian (2000) Aharonian F. A., 2000, New Astron., 5, 377
- Aharonian et al. (2004) Aharonian F., et al., 2004, A&A, 421, 529
- Aharonian et al. (2008) Aharonian F., et al., 2008, A&A, 478, 387
- Ajello et al. (2017) Ajello M., et al., 2017, ApJS, 232, 18
- Albert et al. (2006) Albert J., et al., 2006, ApJ, 642, L119
- Archambault et al. (2014) Archambault S., et al., 2014, ApJ, 788, 158
- Atwood et al. (2009) Atwood W. B., et al., 2009, ApJ, 697, 1071
- Bade et al. (1998) Bade N., Beckmann V., Douglas N. G., Barthel P. D., Engels D., Cordis L., Nass P., Voges W., 1998, A&A, 334, 459
- Becker et al. (1995) Becker R. H., White R. L., Helfand D. J., 1995, ApJ, 450, 559
- Blandford & Znajek (1977) Blandford R. D., Znajek R. L., 1977, MNRAS, 179, 433
- Bloom & Marscher (1996) Bloom S. D., Marscher A. P., 1996, ApJ, 461, 657
- Blustin et al. (2004) Blustin A. J., Page M. J., Branduardi-Raymont G., 2004, A&A, 417, 61
- Bonnoli et al. (2015) Bonnoli G., Tavecchio F., Ghisellini G., Sbarrato T., 2015, MNRAS, 451, 611
- Böttcher (2007) Böttcher M., 2007, Ap&SS, 309, 95
- Burrows et al. (2005) Burrows D. N., et al., 2005, Space Sci. Rev., 120, 165
- Celotti et al. (1997) Celotti A., Padovani P., Ghisellini G., 1997, MNRAS, 286, 415
- Cerruti et al. (2015) Cerruti M., Zech A., Boisson C., Inoue S., 2015, MNRAS, 448, 910
- Colla et al. (1970) Colla G., et al., 1970, A&AS, 1, 281
- Cooke et al. (1978) Cooke B. A., et al., 1978, MNRAS, 182, 489
- Costamante & Ghisellini (2002) Costamante L., Ghisellini G., 2002, A&A, 384, 56
- Costamante et al. (2018) Costamante L., Bonnoli G., Tavecchio F., Ghisellini G., Tagliaferri G., Khangulyan D., 2018, MNRAS, 477, 4257
- Davis & Laor (2011) Davis S. W., Laor A., 2011, ApJ, 728, 98
- Dermer & Schlickeiser (1993) Dermer C. D., Schlickeiser R., 1993, ApJ, 416, 458
- Ding et al. (2017) Ding N., Zhang X., Xiong D. R., Zhang H. J., 2017, MNRAS, 464, 599
- Finke et al. (2010) Finke J. D., Razzaque S., Dermer C. D., 2010, ApJ, 712, 238
- Fioc & Rocca-Volmerange (2019) Fioc M., Rocca-Volmerange B., 2019, A&A, 623, A143
- Fitzpatrick (1999) Fitzpatrick E. L., 1999, PASP, 111, 63
- Ghisellini et al. (2009) Ghisellini G., Maraschi L., Tavecchio F., 2009, MNRAS, 396, L105
- Gopal-Krishna et al. (2011) Gopal-Krishna Goyal A., Joshi S., Karthick C., Sagar R., Wiita P. J., Anupama G. C., Sahu D. K., 2011, MNRAS, 416, 101
- Gould & Schréder (1966) Gould R. J., Schréder G., 1966, Physical Review Letters, 16, 252
- Hartman et al. (1999) Hartman R. C., et al., 1999, ApJS, 123, 79
- Horan et al. (2004) Horan D., et al., 2004, ApJ, 603, 51
- Kalberla et al. (2005) Kalberla P. M. W., Burton W. B., Hartmann D., Arnal E. M., Bajaja E., Morras R., Pöppel W. G. L., 2005, A&A, 440, 775
- Krimm et al. (2013) Krimm H. A., et al., 2013, ApJS, 209, 14
- Ledden et al. (1981) Ledden J. E., Odell S. L., Stein W. A., Wisniewski W. Z., 1981, ApJ, 243, 47
- Madejski et al. (1991) Madejski G. M., Mushotzky R. F., Weaver K. A., Arnaud K. A., Urry C. M., 1991, ApJ, 370, 198
- Mannheim (1993) Mannheim K., 1993, A&A, 269, 67
- Maraschi et al. (1992) Maraschi L., Ghisellini G., Celotti A., 1992, ApJ, 397, L5
- Massaro et al. (2006) Massaro E., Tramacere A., Perri M., Giommi P., Tosti G., 2006, A&A, 448, 861
- Mastichiadis et al. (2013) Mastichiadis A., Petropoulou M., Dimitrakoudis S., 2013, MNRAS, 434, 2684
- Matsuoka et al. (2009) Matsuoka M., et al., 2009, PASJ, 61, 999
- Mattox et al. (1996) Mattox J. R., et al., 1996, ApJ, 461, 396
- Mayers et al. (2018) Mayers J. A., et al., 2018, arXiv e-prints,
- Mueller et al. (2011) Mueller C., et al., 2011, Astroparticle Physics, 34, 674
- Murase et al. (2012) Murase K., Dermer C. D., Takami H., Migliori G., 2012, ApJ, 749, 63
- Nolan et al. (2012) Nolan P. L., et al., 2012, ApJS, 199, 31
- Padovani et al. (2017) Padovani P., et al., 2017, A&ARv, 25, 2
- Pandey et al. (2018) Pandey A., Gupta A. C., Wiita P. J., 2018, ApJ, 859, 49
- Richards et al. (2011) Richards J. L., et al., 2011, ApJS, 194, 29
- Romero et al. (2017) Romero G. E., Boettcher M., Markoff S., Tavecchio F., 2017, Space Sci. Rev., 207, 5
- Roming et al. (2005) Roming P. W. A., et al., 2005, Space Sci. Rev., 120, 95
- Rüger et al. (2010) Rüger M., Spanier F., Mannheim K., 2010, MNRAS, 401, 973
- Sato et al. (2008) Sato R., Kataoka J., Takahashi T., Madejski G. M., Rügamer S., Wagner S. J., 2008, ApJ, 680, L9
- Schlafly & Finkbeiner (2011) Schlafly E. F., Finkbeiner D. P., 2011, ApJ, 737, 103
- Schlegel et al. (1998) Schlegel D. J., Finkbeiner D. P., Davis M., 1998, ApJ, 500, 525
- Sikora et al. (1994) Sikora M., Begelman M. C., Rees M. J., 1994, ApJ, 421, 153
- Singh et al. (2014) Singh K. K., Sahayanathan S., Tickoo A. K., Bhatt N., 2014, New Astron., 27, 34
- Singh et al. (2015) Singh K. K., et al., 2015, New Astron., 36, 1
- Singh et al. (2017) Singh K. K., et al., 2017, New Astron., 54, 24
- Singh et al. (2019) Singh K. K., Meintjes P. J., Ramamonjisoa F. A., Tolamatti A., 2019, New Astron., 73, 101278
- Tramacere et al. (2009) Tramacere A., Giommi P., Perri M., Verrecchia F., Tosti G., 2009, A&A, 501, 879
- Tramacere et al. (2011) Tramacere A., Massaro E., Taylor A. M., 2011, ApJ, 739, 66
- Urry & Padovani (1995) Urry C. M., Padovani P., 1995, PASP, 107, 803
- Vaughan et al. (2003) Vaughan S., Edelson R., Warwick R. S., Uttley P., 2003, MNRAS, 345, 1271
- Wierzcholska & Wagner (2016) Wierzcholska A., Wagner S. J., 2016, MNRAS, 458, 56
- Wilson et al. (1979) Wilson A. S., Ward M. J., Axon D. J., Elvis M., Meurs E. J. A., 1979, MNRAS, 187, 109
- Yan et al. (2012) Yan D., Zeng H., Zhang L., 2012, PASJ, 64, 80