Packing polydisperse colloids into crystals: when charge-dispersity matters
Abstract
Monte-Carlo simulations, fully constrained by experimental parameters, are found to agree well with a measured phase diagram of aqueous dispersions of nanoparticles with a moderate size polydispersity over a broad range of salt concentrations, , and volume fractions, . Upon increasing , the colloids freeze first into coexisting compact solids then into a body centered cubic phase (bcc) before they melt into a glass forming liquid. The surprising stability of the bcc solid at high and is explained by the interaction (charge) polydispersity and vibrational entropy.
How do polydisperse particles pack and order? This basic question concerns diverse systems, including granular beads, micro-emulsions, micro-gels, macromolecules and solid nanoparticles and is, thus, largely debated. For a fluid of hard-sphere (HS) particles, Pusey et al. Pusey (1987, 1991) proposed a critical value of polydispersity (), above which particles would not crystallize. This concept of a terminal polydispersity was first based on experimental observations, and later supported also by numerical simulations Auer and Frenkel (2001); Pusey et al. (2009). However, using simulations of HS systems, Kofke et al. Kofke and Bolhuis (1999) found that the concept of a terminal polydispersity should only apply to a solid phase, rather than the entire system of particles. More precisely, that a stable crystalline phase whose constituent components exceeded a polydispersity of 5.7 could not be formed from a fluid phase. Questioning the ultimate fate of an amorphous solid of high , they proposed that fractionation should enable an HS fluid of arbitrary polydispersity to precipitate in a fcc solid phase in coexistence with a fluid phase. Sollich et al. Fasolo and Sollich (2003); Sollich and Wilding (2010) further theorized that, when compressed, a relatively polydisperse HS system should crystallize into a myriad of coexisting fcc crystalline phases each having a distinct size distribution and a narrower than the mother distribution, as in Fig. 1(a).
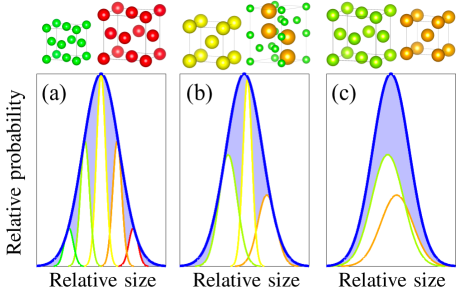
Our recent experiments Cabane et al. (2016) on dispersions of charged hard spheres (CS) with a broad and continuous size polydispersity () empirically demonstrated the case of the fractionation of a colloidal fluid into multiple coexisting phases. Interestingly, this crystallization turns out to be more complex than that theorized by Sollich et al. for HS. Indeed, as in Fig. 1(b), the CS were observed to coexist in a fluid phase, a bcc lattice and a Laves MgZn2 superlattice. The latter had been previously known only from binary distributions of particles Shevchenko et al. (2006); Hynninen et al. (2007); Schaertl et al. (2018). Matching lattice simulations can also reproduce the experimental findings, including the Laves phase Botet et al. (2016); Cabane et al. (2016). Very recent simulations Coslovich et al. (2018); Lindquist et al. (2018); Bommineni et al. (2019) with polydisperse HS of show a similar, or even greater, level of complexity and thus indicate that our findings with CS are representative of a more general rule: polydispersity enables complex crystal formation. In particular, Frank-Kasper phases, as well as various Laves AB2 and AB13 phases were found in simulations of HS of from 6% to 24% and at high packing fractions (). These results are also in line with the earlier simulations of Fernandez el al. Fernández et al. (2007), of neutral soft spheres, even though the exact natures of the crystal phases obtained there were not identified. On the other hand, the coexistence of multiple crystal phases of the same symmetry, but different lattice constants, has only been observed in systems of plate-like particles Byelov et al. (2010).
Here, we demonstrate that even with a moderate size polydispersity CS systems can show a complex phase behavior. This is achieved on a similar CS system to that in Cabane et al. (2016) but with a moderate size dispersity (9%). The magnitude and polydispersity of the charge, and thus of the interaction polydispersity, are tuned with the salt concentration, and pH of the bulk solution (see Supplemental Material Not ). Using x-ray scattering methods the – phase diagram is constructed. We observe that on gradually increasing the osmotic compression the CS fluid crystallises and fractionates into coexisting phases of different structures, i.e. bcc, fcc and hcp, as in Fig. 1(c). Unexpectedly, the stability region of the bcc crystals covers a large area of the phase diagram, considerably more than in the monodisperse case. The first appearance of the bcc phase is always at a higher than that of fcc crystals, at the same (i.e. opposite to their order of occurrence in monodisperse CS Hynninen and Dijkstra (2003)). Upon further compression, the system becomes a glass forming liquid. To help explain these results, we use Monte Carlo (MC) simulations of our multi-component model (MCM) for charge regulating polydisperse colloids parametrized with independent experimental data Bareigts and Labbez (2018). Allowing for only a slight adjustment of , the simulations almost perfectly reproduce the experimental phase diagram.
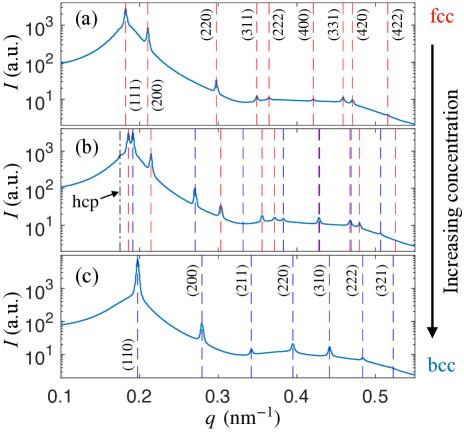
For the experiments, we used industrially produced, nanometric and highly charged silica particles, dispersed in water (Ludox TM50, Sigma-Aldrich). These were cleaned and concentrated as detailed elsewhere Jönsson et al. (2011); Li et al. (2015); Cabane et al. (2016); Goehring et al. (2017). Briefly, dispersions were filtered and dialysed against aqueous NaCl solutions of various concentrations (from 0.5 to 50 mM) at pH (by addition of NaOH). Next, they were slowly concentrated via the osmotic stress method, by the addition of polyethylene glycol (mw 35000, Sigma-Aldrich) outside the dialysis sack. Samples were then taken and sealed in quartz capillary tubes, on which small-angle x-ray scattering (SAXS) experiments were performed at the ESRF, beamline ID02 Narayanan et al. (2018). The particle size distribution was measured in the dilute limit (see the Supplemental Material Not ) to have a mean size of 1 nm and a polydispersity of 1%, consistent with prior observations Goertz et al. (2009). Over a range of concentrations the scattering spectra showed sharp peaks characteristic of fcc and bcc crystal phases, as shown in Fig. 2. A weak peak representing a minority hcp phase (or evidence of stacking faults Shabalin et al. (2016)) was frequently seen alongside either crystal phase. Additional characterisation of the liquid and glass phases is given in the Supplemental Material Not .
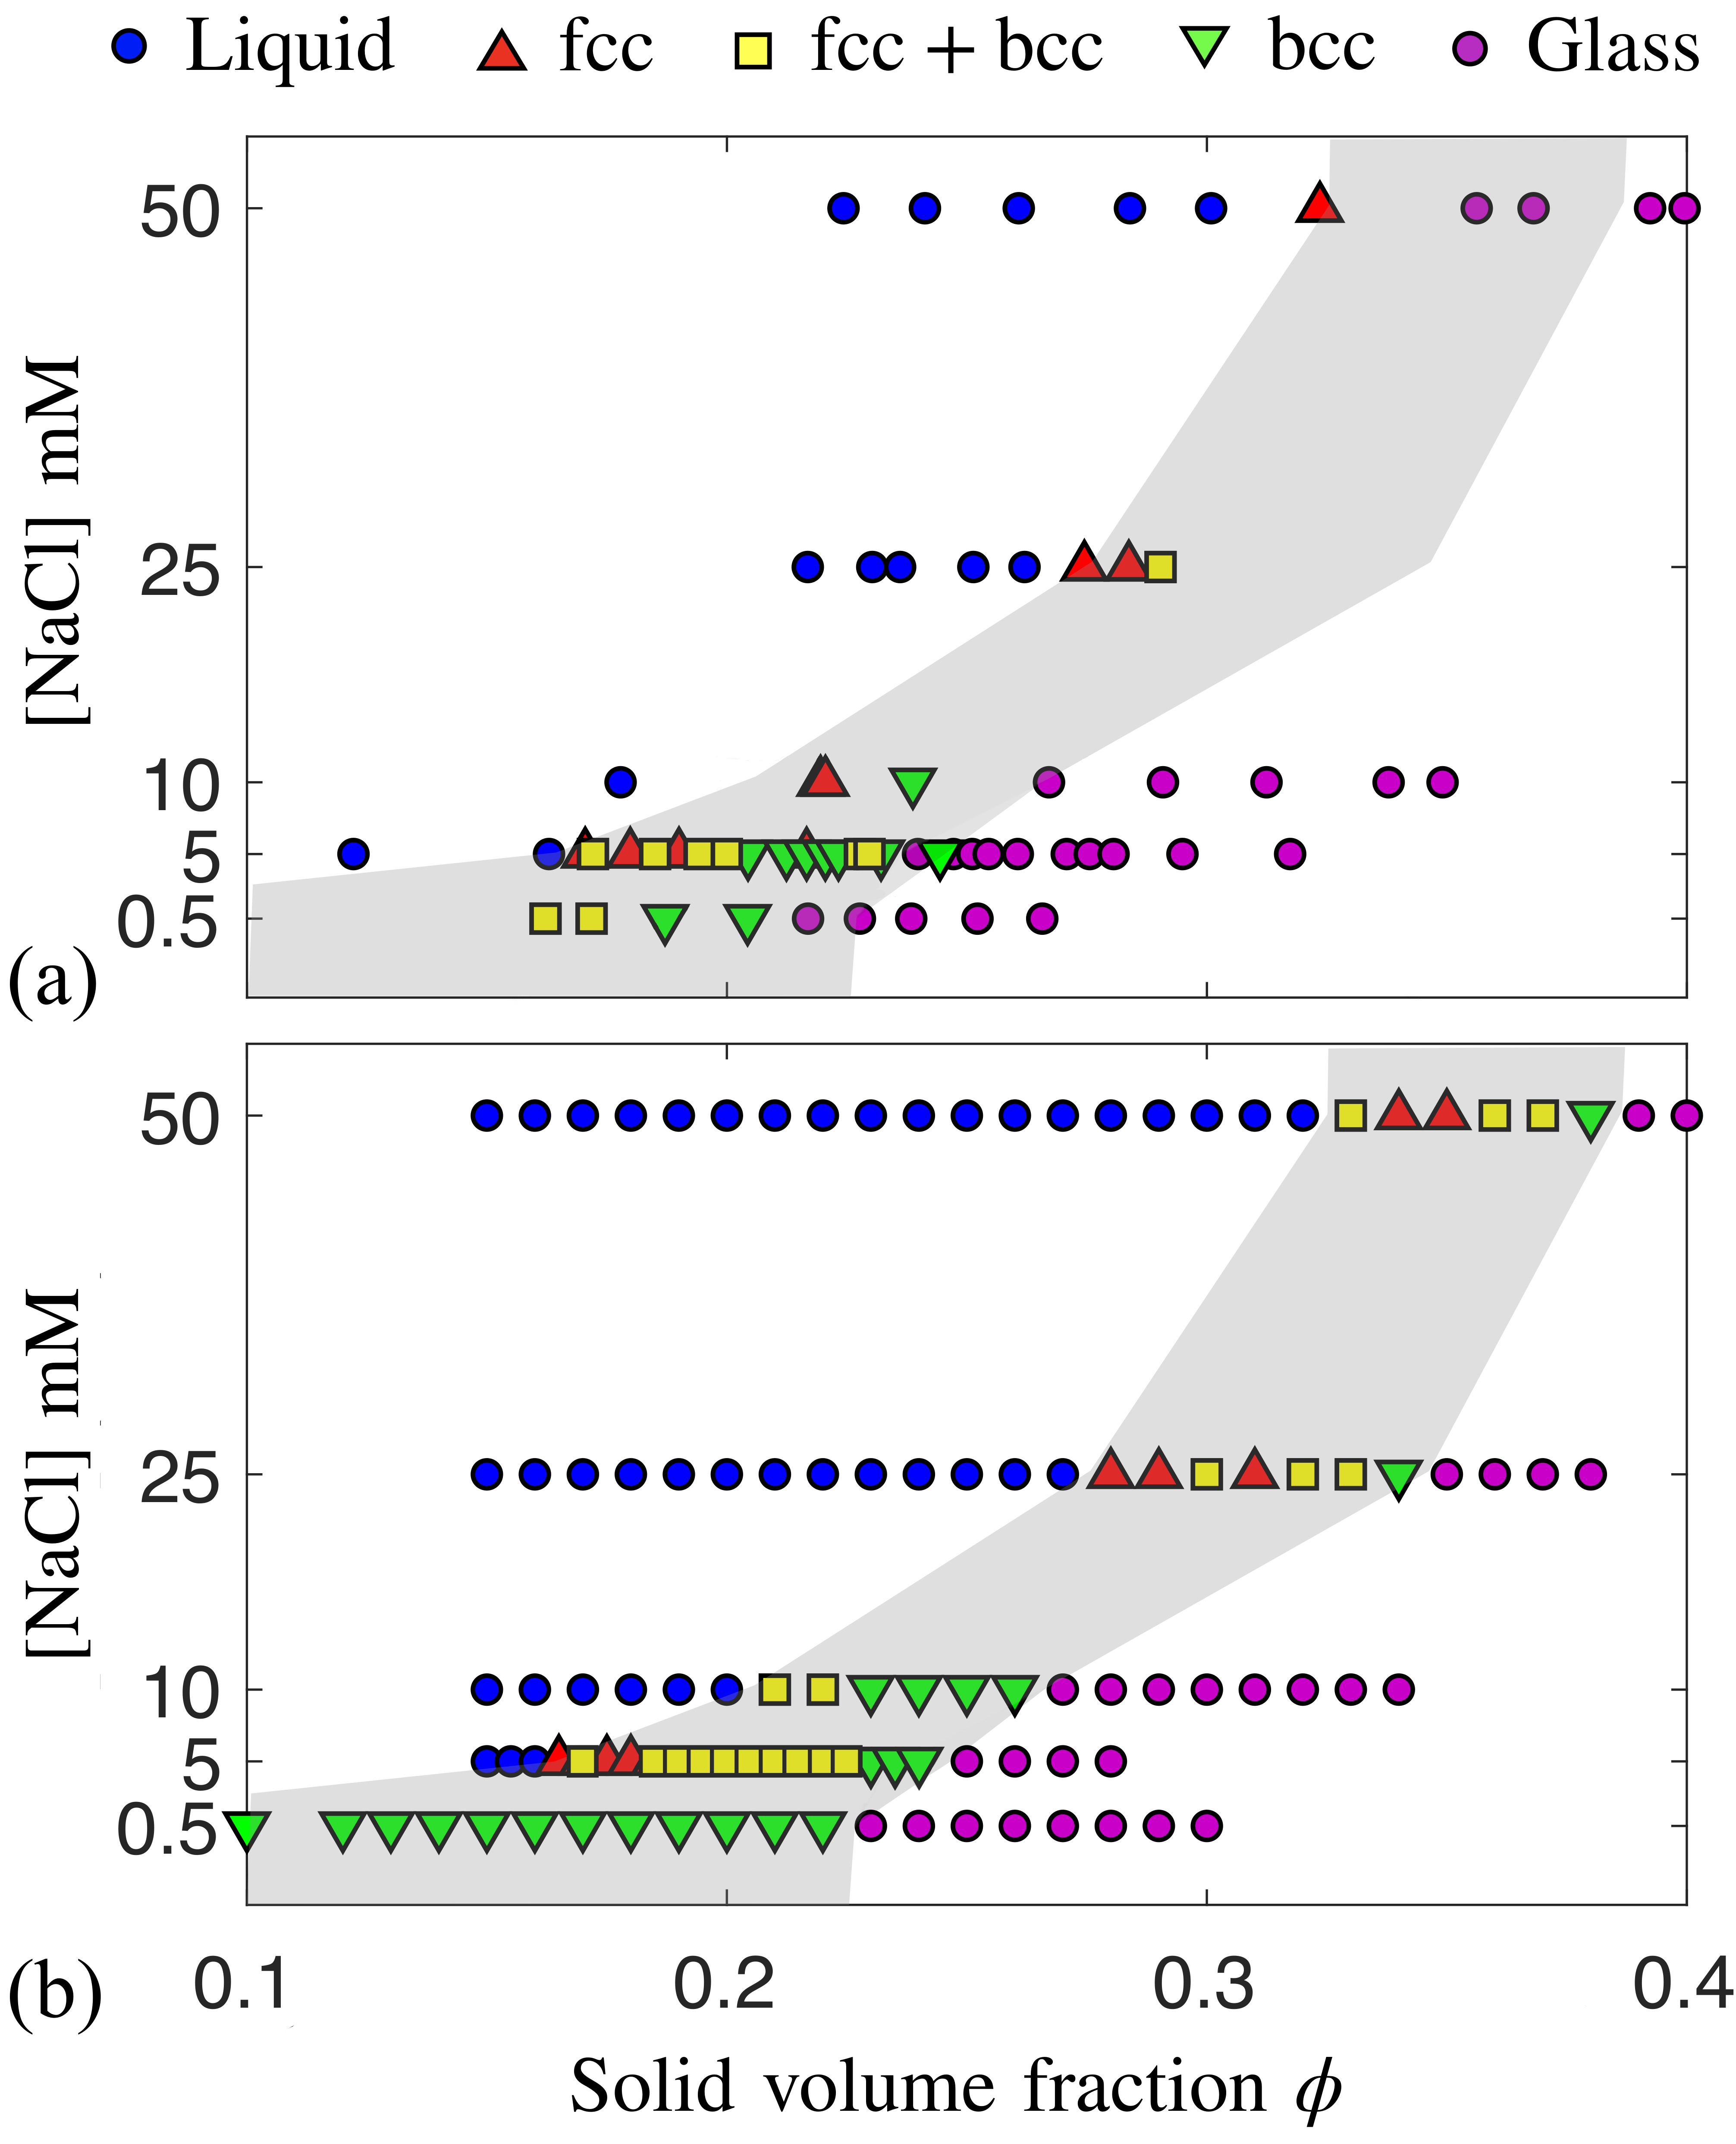
The experimental phase diagram in the – plane is given in Fig. 3(a), and represents the phases that have nucleated and are experimentally stable over days-to-weeks. Whatever the background salinity, a fluid region is observed for low followed by a region with crystal formation at intermediate , which ends in a re-entrant amorphous phase at high . The latter behaves macroscopically as a solid (i.e. retains its shape as a soft gel or paste). As is increased, the first appearance of crystals shifts to higher , in response to the screening of the electrostatic interactions. The same is true for the re-entrant melting transition. Both observations are consistent with phase diagrams of other experimental CS systems although at much lower , (e.g. Monovoukas and Gast (1989); Sirota et al. (1989)). The predominant ordered phases appearing are bcc and fcc crystals, also known from monodisperse CS systems (although the hcp phase is not typically seen there, other than in shear-ordered samples Versmold (1995)). However, the stability region of the bcc phase is observed at higher than the fcc phase, for all screening lengths studied (i.e. all ). This was also the case where we made a more continuous probe across as assessed by interdiffusion experiments (see the Supplemental Material Not for details). This phase behavior contrasts strongly with that of monodisperse particles, where a bcc-fcc transition with increasing (rather than the fcc-bcc transition seen here) is invariably observed Monovoukas and Gast (1989); Sirota et al. (1989). Essentially, this demonstrates that even a moderate polydispersity can have a complex influence on crystal stability, and modify the relative stability of various phases.
Although predicted to occur for soft colloids Gottwald et al. (2004); Pàmies et al. (2009) an inversion of the stability regions of the bcc and fcc phases has rarely been observed. To our knowledge, it has only been reported for soft spheres Mohanty and Richtering (2008). The possibility that polydispersity could help stabilise the bcc phase in CS systems was conjectured by some of us, based on an energetic argument which shows that the bcc structure is more tolerant to interaction polydispersity than the fcc one Botet et al. (2016). This argument was made via lattice MC simulations in the Gibbs ensemble on a system with a presupposed bcc/fcc coexistence of CS with = 15%. The particles were found to be divided up between a narrow monomodal distribution (fcc) and a bimodal one (bcc), similar to the situation given in Fig 1(b). However, our reanalysis of this model shows that it also predicts the formation of a CsCl structure on the sites of the bcc phase (i.e. alternating larger and smaller particles), which is not compatible with our experimental findings (as additional scattering peaks would be present in this case).
Here we employed, instead, MC simulations for continuous systems at set density (NVT) or pressure (NPT) which do not require any prior information on the phases at equilibrium. They were performed at the experimental and pH conditions in the framework of the MCM detailed in Ref. Bareigts and Labbez (2018), which includes the charge regulation of the silica particles through the pH dependent ionization of their surface active groups, . A truncated and discretized Gaussian size distribution with the same as measured was used, but with a somewhat lower polydispersity of (rather than 9%). Simple particle translations combined with swap moves Grigera and Parisi (2001) allow for efficiently sampling the phase space up to high Brito et al. (2018). Simulations were run with = 19 991 particles in a cubic box with periodic boundary conditions. Up to several tens of million of MC cycles (each consisting of MC moves) for equilibration were used; production runs lasted for 105 MC cycles. The local bond order parameters were used to analyze the obtained structures Lechner and Dellago (2008), and further details of the analysis and simulation are given in the Supplemental Material Not .
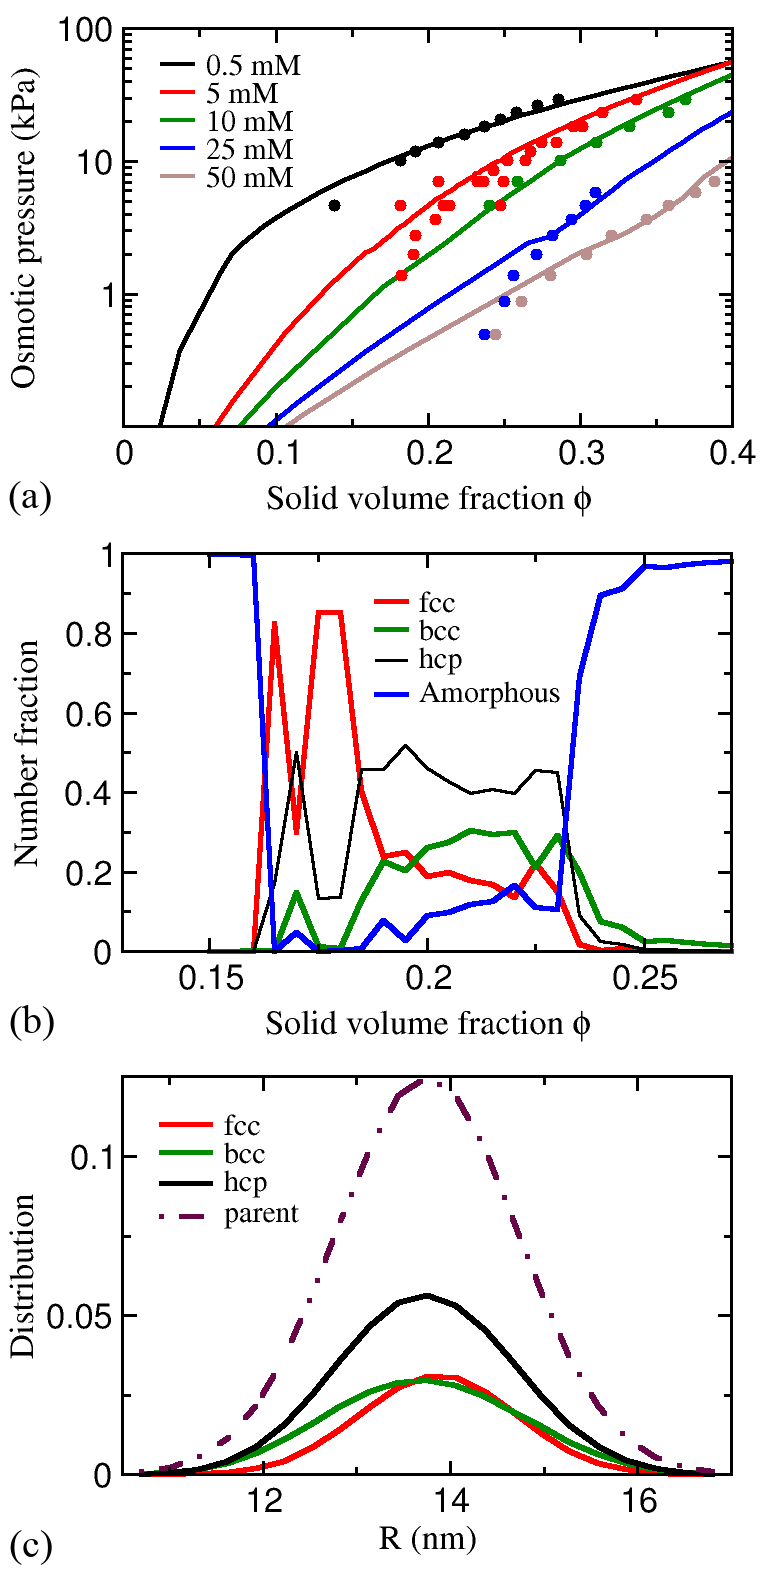
As shown in Fig. 3(b), a very good agreement is achieved between the experimental and simulated (MCM) phase diagrams. The same is true for the equation of state (EoS) of the TM50 silica dispersion in the all range of and studied as seen in Fig 4(a) (experimental data from Refs. Goehring et al. (2017); Kiatkirakajorn (2018)). Not only is the inversion of the stability regions of the bcc and fcc phases well predicted, but also the position of the freezing transition matches with the experiments, although an exact phase diagram would require a free energy calculation not developed here (see the Supplemental Material for discussion). In line with the experimental observations Goehring et al. (2017), a re-entrant amorphous phase at high is found, in which colloids present very weak diffusion.
The phase composition of the system upon compression at 5 mM and an example of the size distributions at the coexistence of the hcp/bcc/fcc phases are shown in Fig 4(b,c). The freezing transition is found to be first-order, and is characterized by both a discontinuity in the EoS and an abrupt change in the liquid/fcc phase composition at , as in Fig 4(a). The fcc-bcc phase transition is, on the other hand, found to be much more progressive. Simulation snapshots at the bcc/fcc/hcp phase coexistence show, instead, textures characteristic of a micro-phase separation (for further detail, see the Supplemental Material Not ).
The fcc-bcc phase transition is also characterized by a small size fractionation, as in Fig 4(c), which tends to increase with (see the Supplemental Material Not ). The bcc phase is found to be more tolerant to polydispersity, while incorporating a larger number of small particles than the fcc structure. The particle distribution of the bcc phase thus presents a larger and smaller than of the fcc phase. One consequence of this is that there will be only a small difference in the calculated particle number densities between both crystalline phases and the bulk, less than 4%, with a slight tendency of the fcc phase to be the densest. This is consistent with our experimental observations, although the difference in phase densities falls within the uncertainty of the measurements (see the Supplemental Material Not ).
These results are in line with our energetic argument mentioned earlier Botet et al. (2016). In other words, the interaction polydispersity favors the formation of bcc crystals with a larger particle distribution (or charge distribution), thus being more tolerant to polydispersity, as compared to fcc crystals. As is progressively increased, the fcc phase, compared to the bcc phase, becomes less and less tolerant to the charge polydispersity. Note that the latter is not constant but increases with , see Bareigts and Labbez (2018). Consequently, the fcc ordered phase progressively disappears in favor of the bcc and fluid phases. Conversely, in the absence of interaction polydispersity the system can, to a good approximation, be reduced to that of point Yukawa particles Hynninen and Dijkstra (2003). In such a case, the charge of colloid satisfies the equality , where is a constant (see the Supplemental Material Not ). The inversion of the stability regions of the bcc and fcc phases is then lost Hamaguchi et al. (1997). In this case also, the stability region of the bcc phase is restricted to the very diluted domain only. In absence of charge (i.e. ), the bcc phase simply disappears, see e.g. the recent work of Bommineni on polydisperse HS systems Bommineni et al. (2019). All this further illustrates the importance of charge dispersity in the inversion of the stability regions of the bcc and fcc phases.
Obviously, the phase behavior observed in our experiments and simulations is not only a consequence of the system’s internal energy, but the result of the balance between energy and entropy. In an attempt to elucidate the entropic contributions in the stabilization of the bcc phase we further performed lattice simulations in the Gibbs ensemble, as in Ref. Botet et al. (2016), with the MCM of the TM50 silica dispersion. As in the continuous simulations, a small size fractionation is obtained. However, a CsCl superlattice structure, instead of a bcc phase, is found (see the Supplemental Material Not ). Recognizing that lattice simulations only account for the mixing contribution to the entropy, one can deduce from this qualitative difference that the bcc phase observed in our experiments (and continuous simulations) is most probably stabilized by vibrational entropy (the missing thermodynamic ingredient in lattice simulations). A large size fractionation in distinct phases is, on the other hand, prevented by the mixing entropy at this relatively small and range of . When the size polydispersity is increased (see the Supplemental Material Not ), the mixing entropy takes over, and a MgZn2 Laves phase in coexistence with a bcc phase is predicted to occur in good agreement with our previous experimental findings Cabane et al. (2016).
Not discussed so far is the striking agreement obtained between the simulations and experiments on the position of the re-entrant melting line. At a first sight, this would suggest that the amorphous phase is stable. Preliminary results obtained well inside the amorphous region with more advanced simulation techniques show, however, that it can crystallize. A close look at the EoS also shows a sudden increase in the osmotic pressure. These results, which will be developed elsewhere, strongly suggest that it is a glass forming liquid. Still, we were unable to come with a reasonable explanation for the troubling coincidence between our simulation and experimental results on the (non-thermodynamic) re-entrant melting transition.
To conclude, using a combined and detailed theoretical and experimental study of charged nano-colloids with a moderate polydispersity, we provide evidence that the packing of polydisperse particles into crystals is much more diverse than initially thought, even for relatively small polydispersities. In particular, the system is found to separate into coexisting solid phases with a limited size fractionation. Under compression, the system first solidifies in compact lattice structures, fcc/hcp. Upon further compression, the fcc phase dissolves progressively into a less compact bcc structure, which proves to be more tolerant to the interaction (charge) polydispersity. Our simulations strongly suggest that the limited size fractionation and the stabilization of the bcc phase are due to the mixing and vibrational entropies, respectively. Compressed even further, the colloidal crystals melt into an amorphous phase, most probably a glass forming liquid. The astonishingly good agreement obtained between our experimental results and simulated predictions further gives a strong support to the simulation methods employed and the parameter-free force field developed. We anticipate that these tools should help in the finding of new colloidal crystal phases and in providing a better understanding of colloidal glasses in CS systems. Still, the exact phase boundaries and equilibrium phase behavior of polydisperse CS, in particular at high densities, remain open questions which will require the development of advanced simulation techniques to be tackled.
Acknowledgements.
We acknowledge the European Synchrotron Radiation Facility for provision of synchrotron radiation facilities and assistance in using beamline ID02. G.B. and C.L. thanks financial support from the Region Bourgogne Franche-Comté and CNRS, as well as computational support from CRI, Université de Bourgogne. P.-C.K. thanks the Thai DPST and the Royal Government of Thailand for funding. G.B. and P.-C.K. contributed equally to this work.References
- Pusey (1987) P. N. Pusey, “The effect of polydispersity on the crystallization of hard spherical colloids,” J. Phys. France 48, 709–712 (1987).
- Pusey (1991) P. N. Pusey, “Colloidal suspensions,” in Les Houches Session L1: Liquids, Freezing, and the Glass Transition (edited by J. P. Hansen, D. Levesque, and J. Zinn-Justin (North-Holland, 1991), 1991) pp. 765–942.
- Auer and Frenkel (2001) Stefan Auer and Daan Frenkel, “Suppression of crystal nucleation in polydisperse colloids due to increase of the surface free energy,” Nature 413, 711–713 (2001).
- Pusey et al. (2009) P. N. Pusey, E. Zaccarelli, C. Valeriani, E. Sanz, Wilson C. K. Poon, and Michael E. Cates, “Hard spheres: Crystallization and glass formation,” Philos. Trans. R. Soc. Lond. Math. Phys. Eng. Sci. 367, 4993–5011 (2009).
- Kofke and Bolhuis (1999) David A. Kofke and Peter G. Bolhuis, “Freezing of polydisperse hard spheres,” Phys Rev E 59, 618–622 (1999).
- Fasolo and Sollich (2003) Moreno Fasolo and Peter Sollich, “Equilibrium Phase Behavior of Polydisperse Hard Spheres,” Phys Rev Lett 91, 068301 (2003).
- Sollich and Wilding (2010) Peter Sollich and Nigel B. Wilding, “Crystalline Phases of Polydisperse Spheres,” Phys. Rev. Lett. 104, 118302 (2010).
- Cabane et al. (2016) Bernard Cabane, Joaquim Li, Franck Artzner, Robert Botet, Christophe Labbez, Guillaume Bareigts, Michael Sztucki, and Lucas Goehring, “Hiding in Plain View: Colloidal Self-Assembly from Polydisperse Populations,” Phys. Rev. Lett. 116, 208001 (2016).
- Bommineni et al. (2019) Praveen K. Bommineni, Nydia Roxana Varela-Rosales, Marco Klement, and Michael Engel, “Complex Crystals from Size-Disperse Spheres,” Phys. Rev. Lett. 122, 128005 (2019).
- Shevchenko et al. (2006) Elena V. Shevchenko, Dmitri V. Talapin, Nicholas A. Kotov, Stephen O’Brien, and Christopher B. Murray, “Structural diversity in binary nanoparticle superlattices,” Nature 439, 55–59 (2006).
- Hynninen et al. (2007) Antti-Pekka Hynninen, Job H. J. Thijssen, Esther C. M. Vermolen, Marjolein Dijkstra, and Alfons van Blaaderen, “Self-assembly route for photonic crystals with a bandgap in the visible region,” Nat. Mater. 6, 202–205 (2007).
- Schaertl et al. (2018) N. Schaertl, D. Botin, T. Palberg, and E. Bartsch, “Formation of Laves phases in buoyancy matched hard sphere suspensions,” Soft Matter 14, 5130–5139 (2018).
- Botet et al. (2016) Robert Botet, Bernard Cabane, Lucas Goehring, Joaquim Li, and Franck Artzner, “How do polydisperse repulsive colloids crystallize?” Faraday Discuss. 186, 229–240 (2016).
- Coslovich et al. (2018) Daniele Coslovich, Misaki Ozawa, and Ludovic Berthier, “Local order and crystallization of dense polydisperse hard spheres,” J. Phys.: Condens. Matter 30, 144004 (2018).
- Lindquist et al. (2018) Beth A. Lindquist, Ryan B. Jadrich, and Thomas M. Truskett, “Communication: From close-packed to topologically close-packed: Formation of Laves phases in moderately polydisperse hard-sphere mixtures,” J. Chem. Phys. 148, 191101 (2018).
- Fernández et al. (2007) L. A. Fernández, V. Martín-Mayor, and P. Verrocchio, “Phase Diagram of a Polydisperse Soft-Spheres Model for Liquids and Colloids,” Phys Rev Lett 98, 085702 (2007).
- Byelov et al. (2010) D. V. Byelov, M. C. D. Mourad, I. Snigireva, A. Snigirev, A. V. Petukhov, and H. N. W. Lekkerkerker, “Experimental Observation of Fractionated Crystallization in Polydisperse Platelike Colloids,” Langmuir 26, 6898–6901 (2010).
- (18) See Supplemental Material at http://XX, which includes Refs. [8,13,14,20,25,33–35,38–48], for an extended materials and methods section, as well as for details of the suspension size distribution, interdiffusion experiments, phase composition, glassy state, simulation convergence and lattice simulations.
- Hynninen and Dijkstra (2003) Antti-Pekka Hynninen and Marjolein Dijkstra, “Phase diagrams of hard-core repulsive Yukawa particles,” Phys. Rev. E 68, 021407 (2003).
- Bareigts and Labbez (2018) Guillaume Bareigts and Christophe Labbez, “Jellium and cell model for titratable colloids with continuous size distribution,” J. Chem. Phys. 149, 244903 (2018).
- Jönsson et al. (2011) Bo Jönsson, J. Persello, J. Li, and B. Cabane, “Equation of State of Colloidal Dispersions,” Langmuir 27, 6606–6614 (2011).
- Li et al. (2015) Joaquim Li, Martin Turesson, Caroline Anderberg Haglund, Bernard Cabane, and Marie Skepö, “Equation of state of PEG/PEO in good solvent. Comparison between a one-parameter EOS and experiments,” Polymer 80, 205–213 (2015).
- Goehring et al. (2017) Lucas Goehring, Joaquim Li, and Pree-Cha Kiatkirakajorn, “Drying paint: From micro-scale dynamics to mechanical instabilities,” Phil. Trans. R. Soc. A 375, 20160161 (2017).
- Narayanan et al. (2018) T. Narayanan, M. Sztucki, P. Van Vaerenbergh, J. Léonardon, J. Gorini, L. Claustre, F. Sever, J. Morse, and P. Boesecke, “A multipurpose instrument for time-resolved ultra-small-angle and coherent X-ray scattering,” J. Appl. Crystallogr. 51, 1511–1524 (2018).
- Goertz et al. (2009) Verena Goertz, Nico Dingenouts, and Hermann Nirschl, “Comparison of Nanometric Particle Size Distributions as Determined by SAXS, TEM and Analytical Ultracentrifuge,” Part. Part. Syst. Charact. 26, 17–24 (2009).
- Shabalin et al. (2016) A. G. Shabalin, J.-M. Meijer, R. Dronyak, O. M. Yefanov, A. Singer, R. P. Kurta, U. Lorenz, O. Y. Gorobtsov, D. Dzhigaev, S. Kalbfleisch, J. Gulden, A. V. Zozulya, M. Sprung, A. V. Petukhov, and I. A. Vartanyants, “Revealing Three-Dimensional Structure of an Individual Colloidal Crystal Grain by Coherent X-Ray Diffractive Imaging,” Phys. Rev. Lett. 117, 138002 (2016).
- Monovoukas and Gast (1989) Yiannis Monovoukas and Alice P Gast, “The experimental phase diagram of charged colloidal suspensions,” Journal of Colloid and Interface Science 128, 533–548 (1989).
- Sirota et al. (1989) E. B. Sirota, H. D. Ou-Yang, S. K. Sinha, P. M. Chaikin, J. D. Axe, and Y. Fujii, “Complete phase diagram of a charged colloidal system: A synchrotron x-ray scattering study,” Phys. Rev. Lett. 62, 1524–1527 (1989).
- Versmold (1995) Heiner Versmold, “Neutron Diffraction from Shear Ordered Colloidal Dispersions,” Phys. Rev. Lett. 75, 763–766 (1995).
- Gottwald et al. (2004) D. Gottwald, C. N. Likos, G. Kahl, and H. Löwen, “Phase Behavior of Ionic Microgels,” Phys. Rev. Lett. 92, 068301 (2004).
- Pàmies et al. (2009) Josep C. Pàmies, Angelo Cacciuto, and Daan Frenkel, “Phase diagram of Hertzian spheres,” J. Chem. Phys. 131, 044514 (2009).
- Mohanty and Richtering (2008) P. S. Mohanty and W. Richtering, “Structural Ordering and Phase Behavior of Charged Microgels,” J. Phys. Chem. B 112, 14692–14697 (2008).
- Grigera and Parisi (2001) Tomás S. Grigera and Giorgio Parisi, “Fast Monte Carlo algorithm for supercooled soft spheres,” Phys Rev E 63, 045102(R) (2001).
- Brito et al. (2018) Carolina Brito, Edan Lerner, and Matthieu Wyart, “Theory for Swap Acceleration near the Glass and Jamming Transitions for Continuously Polydisperse Particles,” Phys. Rev. X 8, 031050 (2018).
- Lechner and Dellago (2008) Wolfgang Lechner and Christoph Dellago, “Accurate determination of crystal structures based on averaged local bond order parameters,” The Journal of Chemical Physics 129, 114707 (2008).
- Kiatkirakajorn (2018) Pree-Cha Kiatkirakajorn, Morphological Instabilities in Drying Colloids, PhD Thesis, Georg-August University, Göttingen (2018).
- Hamaguchi et al. (1997) S. Hamaguchi, R. T. Farouki, and D. H. E. Dubin, “Triple point of Yukawa systems,” Phys. Rev. E 56, 4671–4682 (1997).
- Botet and Cabane (2012) Robert Botet and Bernard Cabane, “Simple inversion formula for the small-angle X-ray scattering intensity from polydisperse systems of spheres,” J. Appl. Crystallogr. 45, 406–416 (2012).
- Li et al. (2012) Joaquim Li, Bernard Cabane, Michael Sztucki, Jérémie Gummel, and Lucas Goehring, “Drying Dip-Coated Colloidal Films,” Langmuir 28, 200–208 (2012).
- Boon et al. (2015) Niels Boon, Guillermo Ivan Guerrero-García, René van Roij, and Monica Olvera de la Cruz, “Effective charges and virial pressure of concentrated macroion solutions,” PNAS 112, 9242–9246 (2015).
- Bolt (1957) G. H. Bolt, “Determination of the Charge Density of Silica Sols,” J. Phys. Chem. 61, 1166–1169 (1957).
- Labbez et al. (2009) Christophe Labbez, Bo Jonsson, Michal Skarba, and Michal Borkovec, “Ion- ion correlation and charge reversal at titrating solid interfaces,” Langmuir 25, 7209–7213 (2009).
- Dove and Craven (2005) P. M. Dove and C. M. Craven, “Surface charge density on silica in alkali and alkaline earth chloride electrolyte solutions,” Geochim Cosmochim Acta 69, 4963–4970 (2005).
- Frenkel and Smit (2002) D. Frenkel and B. Smit, Understanding Molecular Simulation (Academic Press, San Diego, 2002).
- Wilding and Sollich (2010) Nigel B. Wilding and Peter Sollich, “Phase behavior of polydisperse spheres: Simulation strategies and an application to the freezing transition,” The Journal of Chemical Physics 133, 224102 (2010).
- Verlet (1968) Loup Verlet, “Computer "Experiments" on Classical Fluids. II. Equilibrium Correlation Functions,” Phys. Rev. 165, 201–214 (1968).
- Hansen and Verlet (1969) Jean-Pierre Hansen and Loup Verlet, “Phase Transitions of the Lennard-Jones System,” Phys. Rev. 184, 151–161 (1969).
- Leocmach et al. (2013) Mathieu Leocmach, John Russo, and Hajime Tanaka, “Importance of many-body correlations in glass transition: An example from polydisperse hard spheres,” The Journal of Chemical Physics 138, 12A536 (2013).