The globular cluster system of the Auriga simulations
Abstract
We investigate whether the galaxy and star formation model used for the Auriga simulations can produce a realistic globular cluster (GC) population. We compare statistics of GC candidate star particles in the Auriga haloes with catalogues of the Milky Way (MW) and Andromeda (M31) GC populations. We find that the Auriga simulations do produce sufficient stellar mass for GC candidates at radii and metallicities that are typical for the MW GC system (GCS). We also find varying mass-ratios of the simulated GC candidates relative to the observed mass in the MW and M31 GC systems for different bins of galactocentric radius-metallicity (-[Fe/H]). Overall, the Auriga simulations produce GC candidates with higher metallicities than the MW and M31 GCS and they are found at larger radii than observed. The Auriga simulations would require bound cluster formation efficiencies higher than ten percent for the metal-poor GC candidates, and those within the Solar radius should experience negligible destruction rates to be consistent with observations. GC candidates in the outer halo, on the other hand, should either have low formation efficiencies, or experience high mass loss for the Auriga simulations to produce a GCS that is consistent with that of the MW or M31. Finally, the scatter in the metallicity as well as in the radial distribution between different Auriga runs is considerably smaller than the differences between that of the MW and M31 GCSs. The Auriga model is unlikely to give rise to a GCS that can be consistent with both galaxies.
keywords:
galaxies: formation – galaxies: star clusters: general.1 Introduction
Globular star clusters (GC)s are old, bright, and ubiquitous. Various properties of GC systems (GCS) show correlations with their host galaxies. GCSs are believed to retain information about the galactic (gas) conditions at their times of formation. Thus they could offer a unique insight into the (chemodynamical) evolution of their parent galaxies, if the formation and evolution of GCs- and GC systems themselves is adequately understood. However, despite decades of research (e.g. Harris 1991, 2001; West et al. 2004; Brodie & Strader 2006; Gratton et al. 2012; Kruijssen 2014; Forbes et al. 2018), consensus on an exhaustive picture of the formation of GCs is yet to be reached. Most galaxies host a GCS with a bimodal colour distribution that may reflect a bimodal metallicity distribution which is argued to arise from two distinct formation channels (Brodie & Strader, 2006). GCs are typically referred to as ‘blue’ or ‘red’ (e.g. Zinn, 1985; Gebhardt & Kissler-Patig, 1999; Larsen et al., 2001) where the former class is more metal-poor, more radially extended, and showing little to no rotation whereas the latter is more metal-rich, radially concentrated, and rotating with the galaxy.
The literature offers a wealth of formation scenarios, many of which focus on the distinct characteristics of the blue or red subpopulation. Peebles & Dicke (1968) and Peebles (1984) argue that GCs form as the earliest bound structures in the Universe (i.e. prior to formation of the main galaxy), noting that the Jeans length and mass shortly after recombination is consistent with typical GC masses and sizes. Diemand et al. (2005) and Boley et al. (2009) argue that the blue, metal-poor GCs ([Fe/H]) form in radially biased dark matter (DM) halos at high redshift. Other recent hypotheses of GC formation prior to collapse of the proto-galaxy include formation in colliding supershells (Recchi et al., 2017), in supersonically induced gaseous objects (Chiou et al., 2019), or in high-speed collisions of dark matter subhaloes (Madau et al., 2019). Boylan-Kolchin (2017) suggests that (the blue subpopulation of) GCs could form in high density regions along the cosmic filament before or during collapse.
Other models also date GCs formation during formation of the proto-galaxy itself, for example as a result of thermal instabilities in hot gas-rich haloes (Fall & Rees 1985, also see the discussions in Kang et al. 1990). Alternative formation triggers are also explored, such as (other causes of) shock compression, or cloud-cloud colissions (e.g. Gunn, 1980; Murray & Lin, 1992; Harris & Pudritz, 1994; Vietri & Pesce, 1995; Larson, 1996; Cen, 2001).
Yet another hypothesis is that star cluster formation traces periods of high-intensity star formation, which can be triggered by major gas-rich (spiral) galaxy mergers (Schweizer, 1987; Ashman & Zepf, 1992). Such a scenario is naturally expected within the framework of hierarchical assembly and predicts formation of young clusters in interacting and merging galaxies, which has been observed and are found to show remarkable similarities with GCs in the Milky Way (MW) (e.g. Whitmore & Schweizer, 1995; Holtzman et al., 1996; Zepf et al., 1999; Whitmore et al., 1999). Moreover, modelling efforts of this framework yield GC (sub)populations consistent with various observables (e.g. Muratov & Gnedin, 2010; Choksi et al., 2018), and the recent numerical simulation of an isolated dwarf-dwarf merger executed at very high resolution (baryonic mass 4M⊙; softening pc) produces star clusters that could be GC progenitors (Lahén et al., 2019).
As for the formation timeline, the scenarios (and flavours thereof) of Fall & Rees (1985) and Ashman & Zepf (1992) are intertwined because accretion and mergers continually occur during the hierarchical build-up of galaxies. Various (other) hierarchical formation channels thus combine different aspects of the aforementioned paradigms, such as GC formation in (small) galactic disks before they are accreted onto an assembling galaxy (e.g. Côté et al., 2000, 2002; Beasley et al., 2002; Gnedin, 2003). We refer to Gnedin et al. (2001) for a scoreboard of GC formation models compared to observations of the MW GCSs.
An idea that has recently been studied extensively is the hypothesis that the formation mechanisms of young massive clusters (YMCs, see Portegies Zwart et al., 2010, for a review) and GCs are the same. The proximity of YMCs in the local Universe allows to study these processes with a level of detail that cannot be achieved for GCs at high redshifts. In this framework, differences between the two classes of objects are caused by nearly a Hubble time of (dynamical) evolution (e.g. Spitzer, 1987). This picture is based on observed similarities between YMCs and GCs (e.g. Holtzman et al., 1992; Whitmore et al., 1999) and strengthened by observations of gravitationally lensed objects at high redshifts (. These sources have properties reminiscent of (local) YMCs and may be GC progenitors at times of formation (Vanzella et al., 2017; Johnson et al., 2017). The modelling work by Kruijssen et al. (2011, 2012); Kruijssen (2015) is now incorporated into cosmological zoom simulations and shows promising results (Pfeffer et al., 2018; Kruijssen et al., 2019).
The (mass) resolution of cosmological zoom simulations has reached the mass range populated by GCs, and the gravitational force softening can be as low as several parsec. A number of groups can thus incorporate formation of (globular) star clusters into their high-resolution hydrodynamical simulations. Ricotti et al. (2016) ran parsec scale simulations of the high-redshift universe prior to reionization (the simulations stop at ), Li et al. (2017) implement a new subgrid model for star (cluster) formation and run simulations that reach , and the run of Renaud et al. (2017) reaches . Kim et al. (2018) find that mergers can push gas to high density that quickly forms clustered stars that end up tightly bound by the end of the simulation. A somewhat different approach couples semi-analytical models to DM-only simulations (Muratov & Gnedin, 2010; Li & Gnedin, 2014; Choksi et al., 2018; Choksi & Gnedin, 2019b, a), also done in the work by El-Badry et al. (2019).
In this work we use state of the art simulations that produce realistic spiral galaxies (MW analogues) at redshift zero for which several global properties are consistent with the observations. The question thus naturally arises whether the star formation histories of the simulations could give rise to a GCS similar to the MW and/or Andromeda (M31) GCSs. In particular, we use the Auriga simulations (Grand et al., 2017, hereafter G17), further described in Section 2. We investigate whether the star formation model implemented produces metallicity, radial, and metallicity-radial distributions that are consistent with the MW and/or M31 GCSs, and whether the model produces enough stellar mass with the right properties. Moreover, the simulations provide us with the history of the star particles, which allows us to investigate the differences between these properties for sub-populations that have formed in situ versus those that have been accreted. We focus on the metallicity and radial distributions because observations of the red and blue GCs show distinct differences between these properties.
The plan of the paper is as follows. We summarise the relevant characteristics of the Auriga simulations in Section 2, followed by a summary of the observations of the MW and M31 GCSs in Section 3 that we compare our simulations to in Section 4. We discuss our findings in Section 5 to come to our conclusions in Section 6.
2 The Auriga simulations
We use the Auriga simulations (G17), a suite of high-resolution cosmological zoom simulations of MW analogues. The MW-mass selected initial conditions in the range M⊙ were selected from the eagle DM-only box, see G17 for details. The simulations are performed with the arepo code (Springel, 2010; Pakmor et al., 2016) that solves the magnetohydrodynamical equations on a moving mesh.
The galaxy formation model includes primordial and metal-line cooling with self-shielding corrections. Reionization is completed at redshift by a time-varying spatially uniform UV background (Faucher-Giguère et al., 2009; Vogelsberger et al., 2013). The interstellar medium (ISM) is described by an equation of state for a two-phase medium in pressure equilibrium (Springel & Hernquist, 2003): cold clouds embedded in a hot ambient medium, whose mass and energy densities are described by processes important for star formation, such as the condensation of cold clouds and the photoevaporation of clouds. Stars form stochastically in thermally unstable gas with a density threshold of , and consecutive stellar evolution is accounted for. The channel for energetic stellar feedback is from non-local type II supernovae (SN), which is modelled with wind particles (Marinacci et al. 2014; G17). Galactic winds enrich the ISM with metals from SNIa, SNII, and asymptotic giant branch stars (Vogelsberger et al., 2013). Supermassive black holes grow via Bondi–Hoyle–Lyttleton accretion (Bondi & Hoyle, 1944; Bondi, 1952), and feedback from the active galactic nuclei has a low-accretion and high-accretion mode (radio and quasar) (Springel et al. 2005; Marinacci et al. 2014; G17). Finally, the simulations follow the evolution of a magnetic field of (comoving) G seeded at (Pakmor & Springel, 2013; Pakmor et al., 2014).
This model was tailored to the arepo code and calibrated to reproduce key observables of galaxies, such as the history of the cosmic star formation rate density, the stellar mass to halo mass relation, and galaxy luminosity functions. The galaxy formation model produces realistic spiral galaxies at redshift zero that match observations such as sizes, morphologies (G17), HI disc properties (Marinacci et al., 2017), and the diversity of accreted stellar halo properties (Monachesi et al., 2019). Furthermore, the simulations are able to reproduce major Galactic components, such as the chemical thin/thick disc dichotomy (Grand et al., 2018) and the recently discovered Gaia Sausage (Fattahi et al., 2019). They are thus a large set of detailed simulations similar enough to the Galaxy to make predictions for the GC population properties of the MW and M31.
The Auriga suite has a fiducial baryonic mass resolution = M⊙, with gravitational softening of collisionless particles = 369 pc. Simulations at this resolution are referred to as level 4 (L4). Selected initial condition runs are acompanied by the lower (higher) resolution level L5 (L3). The resolution for these levels is = M⊙ with = 738 pc, and = M⊙ with = 184 pc, respectively. The mass resolution of the Auriga simulations is thus close M⊙, to the characteristic peak mass of the lognormal GC mass distribution (Harris, 1991), although the gravitational softening is two orders of magnitudes larger than typical GC radii of several parsec. High-density gaseous regions are thus not expected to produce surviving stellar clumps with masses and radii consistent with GCs because such objects would numerically disperse, even in the highest-resolution runs. On the other hand, we can investigate (statistical) properties of age-selected GC candidates because each star particle represents a single stellar population with a total mass that could be consistent with one GC. This means that their formation sites could be consistent with those of real-world GCs.
3 Observational data
We describe observations of the MW GCS in Section 3.1 for these clusters, and of the M31 GCS in Section 3.2. We discuss age-estimates in Section 3.3, their distribution of galactocentric radius in Section 3.4, and their total mass in 2D bins of metallicity-galactocentric radius in Section 3.5. We focus on both metallicity and galactocentric radius because these data are available in the observations and in the Auriga simulations.
3.1 Milky Way
Harris (1996, 2010 edition; hereafter H96e10) provides a catalogue111See https://www.physics.mcmaster.ca/Fac_Harris/mwgc.dat of the MW GCS that contains properties of 157 GCs. The authors initially estimated the number of GCs in the MW GCS to be 180 10, thus, their catalogue to be 85% complete. However, an additional 59 GC candidates have been discovered more recently by various authors. The total number of GCs in the MW might thus be 216 with recent estimates now anticipating an additional GCs yet to be discovered (e.g. Ryu & Lee, 2018, and references therein). We still use data from the Harris catalogue, but caution that it may (only) be 50-70% complete. Specifically, the relevant data fields that we use from H96e10 are the metallicity [Fe/H], the Galactic distance components , , and (in kpc)222In a Sun-centered coordinate system: points toward Galactic center, in direction of Galactic rotation, and toward the North Galactic Pole. We calculate the galactocentric radius , assuming the solar radius kpc., and absolute magnitude in the V band, . We use the V band magnitude to calculate mass-estimates by assuming and a mass to light ratio M⊙/L⊙, the mean for MW clusters (McLaughlin & van der Marel, 2005). We supplement the catalogue with age-estimates from isochrone fits to stars near the main-sequence turnoff in 55 GCs (VandenBerg et al., 2013, hereafter V13).
3.2 Andromeda
Caldwell et al. (2011, hereafter C11) and Caldwell & Romanowsky (2016, hereafter CR16) present a uniform set of spectroscopic observations of the inner kpc of M31 that is believed to be 94% complete. In addition, the outer stellar halo of M31 up to kpc is observed in the Pan-Andromeda Archaeological Survey (PAndAS, Huxor et al., 2014; Veljanoski et al., 2014; Mackey et al., 2019, hereafter H14). In fact, the work of H14 is incorporated in the latest public release333Last revised 23 Sep 2015, see https://www.cfa.harvard.edu/oir/eg/m31clusters/M31_Hectospec.html of the C11 and CR16 data sets. Therefore we use the latest data set of CR16 because it is the most recent aggregated dataset of M31’s GCS that contains GCs in the inner region and in the outer halo. The relevant fields in the CR16 dataset that we use are the age, metallicity, and the mass-estimate444The authors assumed independent of [Fe/H]. We calculate the galactocentric radii from the observed positions RA and DEC, as further discussed in Section 3.4.
3.3 Age-estimates
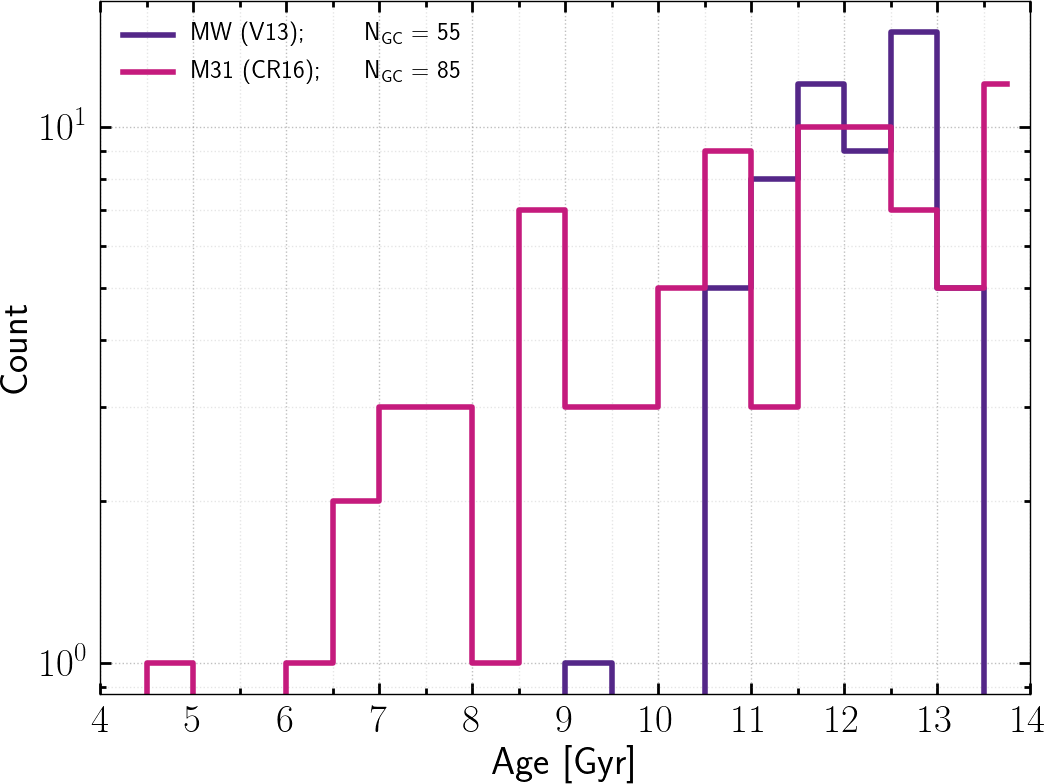
The top panel of Figure 1 shows a histogram of the age-estimates of the MW GCs in V13 and GCs in M31 for which age-estimates are available in CR16. The mean age of the MW GCs in this data set is Gyr and the standard deviation is Gyr. Furthermore, only 1 of the 55 GC age-estimates is below Gyr. The M31 GCS has a mean age of Gyr with a standard deviation of Gyr, and GCs have age-estimates below Gyr with a minimum age of Gyr. Based on these data, we find that the age distributions of the MW and M31 GCSs are not statistically consistent. The MW appears to host a GCS that is somewhat older than that of M31. This is somewhat surprising given that M31 is generally considered to be earlier type than the MW so that an older stellar population would naively be expected. On the other hand, the MW could be an outlier as it may have formed and assembled most of its mass earlier than galaxies with a similar mass (e.g. Snaith et al., 2014, 2015; Mackereth et al., 2018). In addition, we caution that both data sets are incomplete and the age measurements have large uncertainties (of Gyr). On the other hand, the magnitude of the uncertainty is insufficient to explain the low-age tail in M31.
3.4 Radial distribution
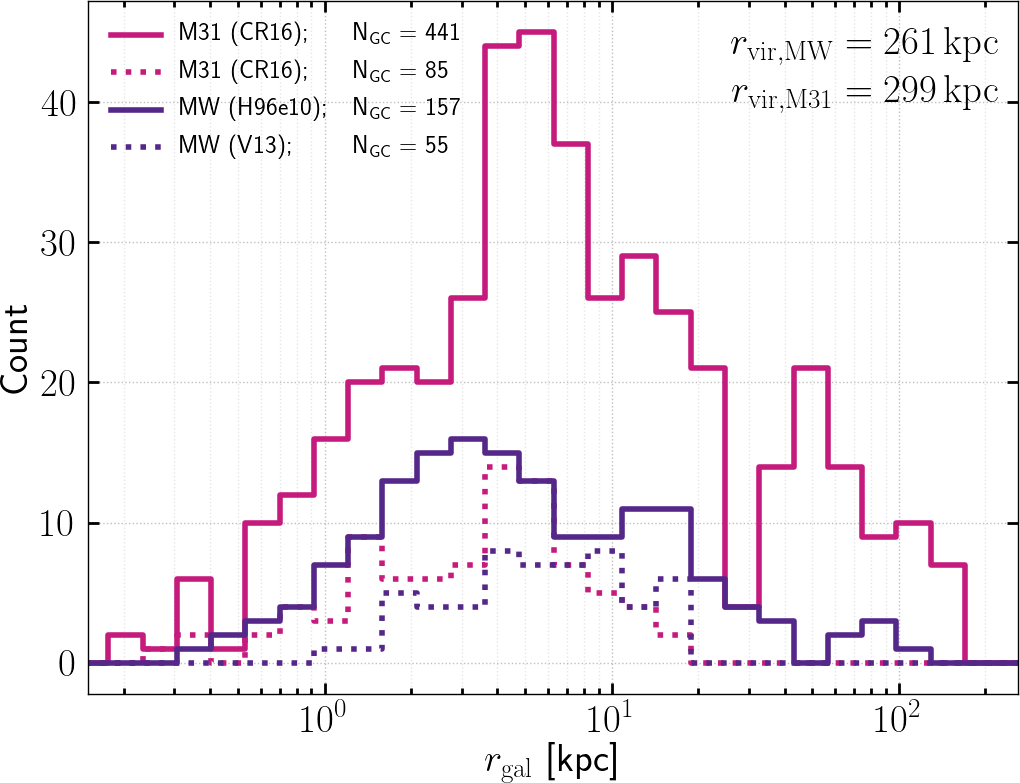
The bottom panel of Figure 1 shows the radial distribution of the MW and M31 GCS. We divide the radii of M31 by its virial radius555 is the radius in a spherical ‘top-hat’ perturbation model at which the average density reaches an overdensity of times the background density kpc and multiply by kpc to account for the different intrinsic sizes of the two galaxies, adopting the values and cosmology from Patel et al. (2017). Values for are readily available in H96e10 (assuming kpc), but the galactocentric radius of GCs in M31 is not available in CR16. Therefore, we follow Wang et al. (2019, section 4.1) to calculate the projected radius from the observed positions, adopting M31’s central position from the NASA Extragalactic Database666https://ned.ipac.caltech.edu/ and the distance kpc (McConnachie et al., 2005; Conn et al., 2012). We estimate as ‘average deprojected distance‘ .
The solid lines show the distributions using all available data (because the sky coordinates are known for each GC), while the subset for which age-estimates are available is indicated using dotted lines. The latter shows a narrower range of radii than the full data set: it appears that few age-estimates are available for the innermost ( kpc) GCs, and none for those beyond roughly kpc (the halo GCs). We compare the two distributions of the full data set (solid lines) and find that the MW has more GCs in the range kpc than M31 when accounting for the larger number of total GCs in M31. Interestingly, the two distributions show a similar trend for kpc and host a subpopulation of halo GCs. Our naive expectation would be that the spiral galaxies in the Local Group host similar GC systems. However, based on a two-sample KS test we find that the radial distributions of the GCS of the MW and M31 are not statistically consistent with being drawn from the same underlying distribution due to substantial differences at intermediate radii.
3.5 Total GC mass in metallicity-radial space
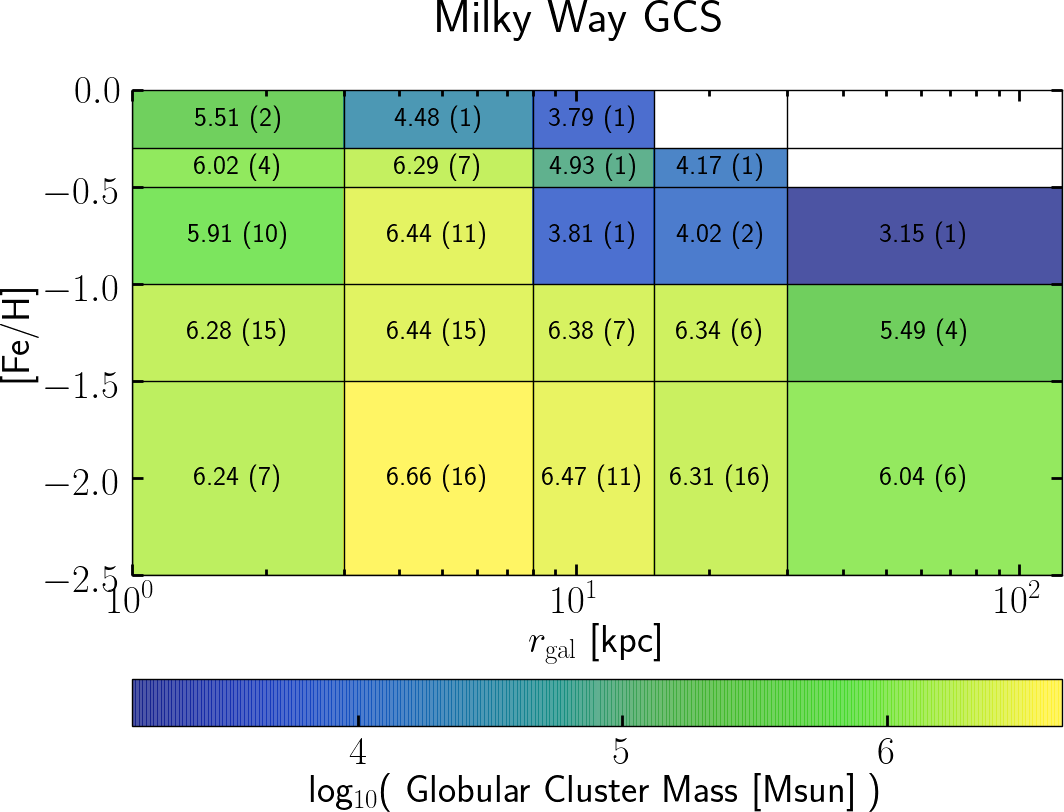
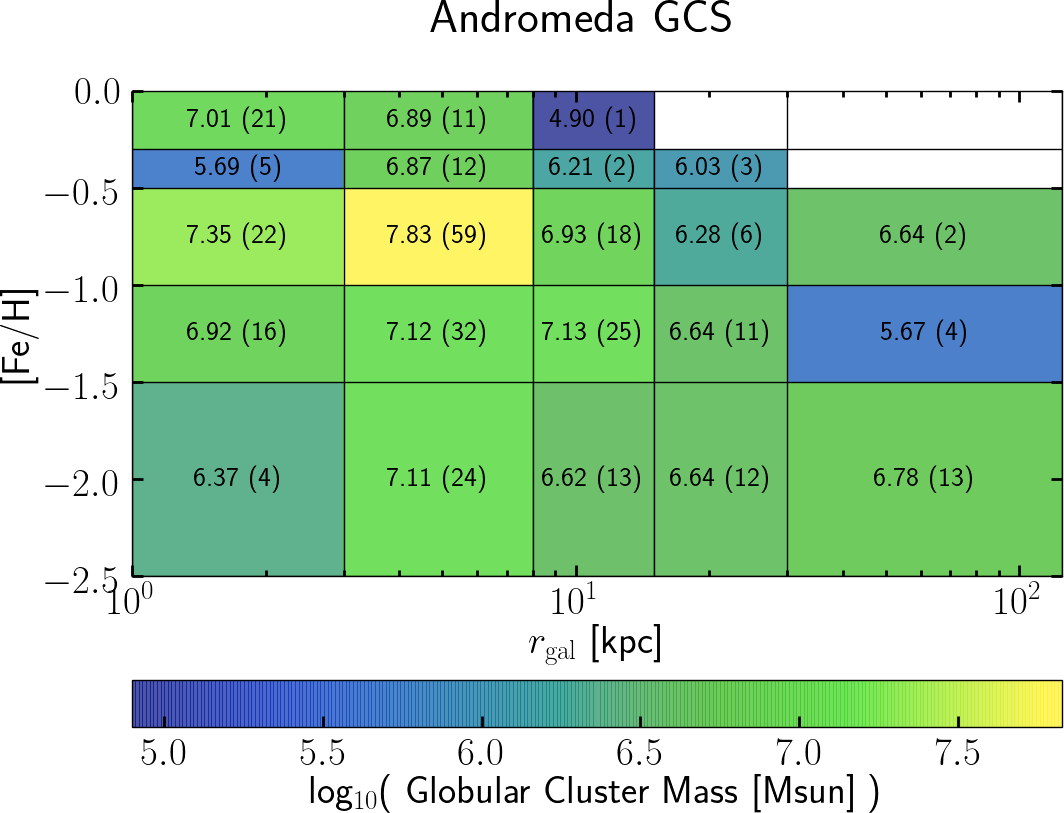
We show the two-dimensional mass-weighted metallicity-radius distribution of the MW and the M31 GCS in the top and bottom panel of Figure 2, respectively. Note that the number of GCs is different than in Figure 1 because here we plot [Fe/H] between -2.5 and 0 and between 1 and 250 kpc whereas Figure 1 shows the full range of metallicities and radii.
The observations indicate very few GCs with high metallicities at large radii (the three bins in the upper right corner, both for MW and for M31), and relatively few GCs at large radii in general ( kpc; right column: GCs or 7.3% in the MW and or 4.6% in M31). Moreover, M31 hosts more metal-rich ([Fe/H]) GCs in each radial bin in comparison to the MW after accounting for the fact that M31 hosts a larger GCS. Finally, given that the marginalized (i.e. the metallicity and radial) distributions are not statistically consistent between the two galaxies, we find that the two-dimensional distributions are also not consistent. More generally, the GCS of the MW differs significantly from that of M31, not only in the number of clusters but also in their distribution over radius and metallicity. We compare these observations to the Auriga simulations in Section 4.3.
4 Results
We define GC candidates in the Auriga simulations as all star particles older than Gyr based on the age distribution of the MW GCS (top panel of Figure 1), adopting the definition of a GC from Portegies Zwart et al. (2010) and following the method of Renaud et al. (2017). However, we caution that this definition, although statistically consistent with the estimated ages of all GCs in the MW, is not consistent with the tail of younger clusters as stated in Section 3.3, and further discussed in Section 5.3.
Throughout our analysis we compare distributions of age-selected GC candidates (age Gyr) with those of all star particles (i.e. with no age cut). The mean number of star particles in the Auriga L4 simulations that we select as GC candidates is (with a mean total mass of M⊙), and the mean number of all star particles is ( M⊙). The subset of GC candidates is thus around 15% of all the stars in the galaxy when averaged over all Auriga L4 haloes. We further split the GC candidates into an in situ subset (defined as GC candidates that are bound to the most-massive halo/subhalo in the first snapshot that the particle was recorded), and an accreted subpopulation (those that have formed ex situ but are bound to the most-massive halo/subhalo at ). A GC candidate either formed in situ or it was accreted. We consider the metallicity distribution in Section 4.1, the distribution of galactocentric radii in Section 4.2, and the combination of the two in Section 4.3.
4.1 Metallicity distribution
We investigate whether the star formation model implemented in Auriga produces metallicity distributions consistent with the MW and M31 GCSs, and whether the simulations generate sufficient total mass at metallicities typical for the MW and M31 GCSs. To visually inspect the former we show the normalized metallicity distribution of three specific Auriga galaxies in Figure 3 in comparison to the MW and M31 [Fe/H] distributions.
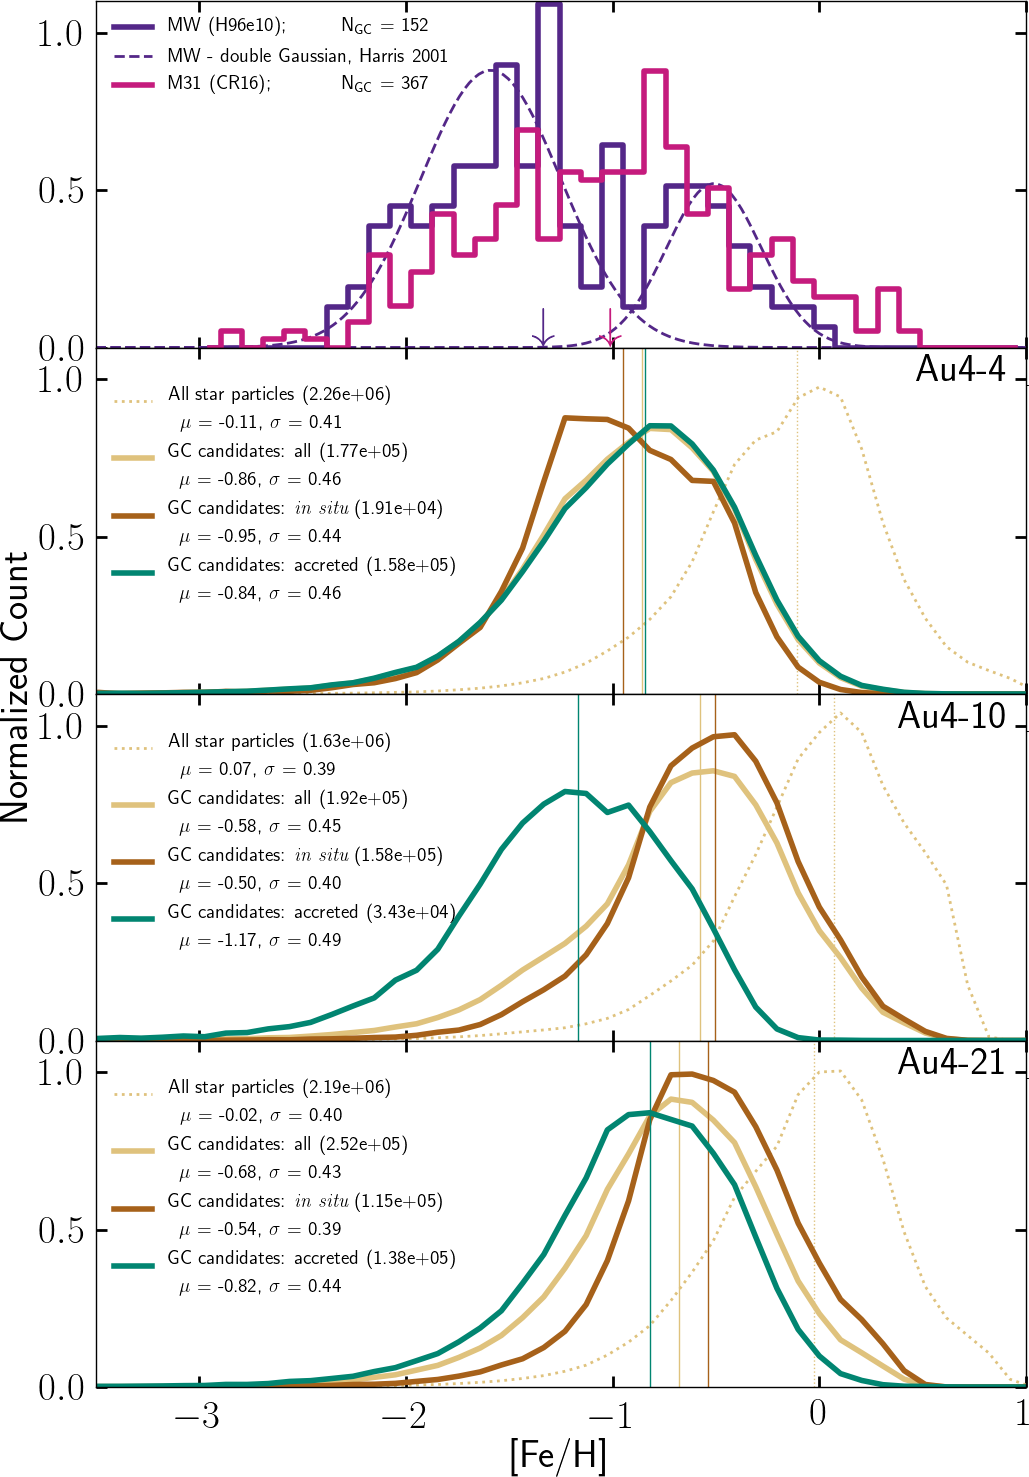
We select Au4-10777The nomenclature is ‘Au’ for Auriga, followed by the resolution level 4 and halo number 10, indicating which set of initial conditions was used., Au4-21, and Au4-4 to show the distributions of three individual simulation runs that we consider representative for specific behaviour, and to highlight that different runs give rise to different distributions. We show the age-selected GC candidates as well as the accreted and in situ subsets. The top panel of Figure 3 shows the MW and M31 GCSs, where we overplot a double Gaussian for the MW GCS by adopting literature values of the mean and standard deviation of the metal-rich and metal-poor subpopulations (Harris, 2001).
We find that the age cut, on average, lowers the mean metallicity [Fe/H] from to . This reflects the enrichment history of the galaxy because the age cut removes the more metal-rich stellar population which shifts the mean metallicity towards lower values. Furthermore, accreted GC candidates generally have lower mean metallicities than the in situ subset with differences of roughly dex for the majority of the simulation runs. This behaviour can be seen in Au4-21, while a slightly larger difference of dex is seen for Au4-10 (as plotted), Au4-16, Au4-17, Au4-18 and Au4-22. However, this trend is reversed for Au4-1 and Au4-4 for which the in situ subset has a lower mean metallicity instead. Au4-1 is undergoing a major merger at redshift zero and we find a mean metallicity in this simulation for the in situ (accreted) GC candidates, although the former consists of only particles (% of all GC candidates, and with a total mass of M⊙). For Au4-4, only % of the GC candidates is classified as in situ (compared to in situ fractions of % for other haloes). We note that Au4-4 has undergone a major merger around 2 Gyr lookback time, which is probably why the accreted population is more metal-rich. After inspection of the same figure for every one of the Auriga L4 haloes we find that the simulations produce (sub)populations of GC candidates that are more metal-rich than the MW and M31 GCSs. Moreover, none of the simulations produces GC candidates with a bimodal metallicity distribution.
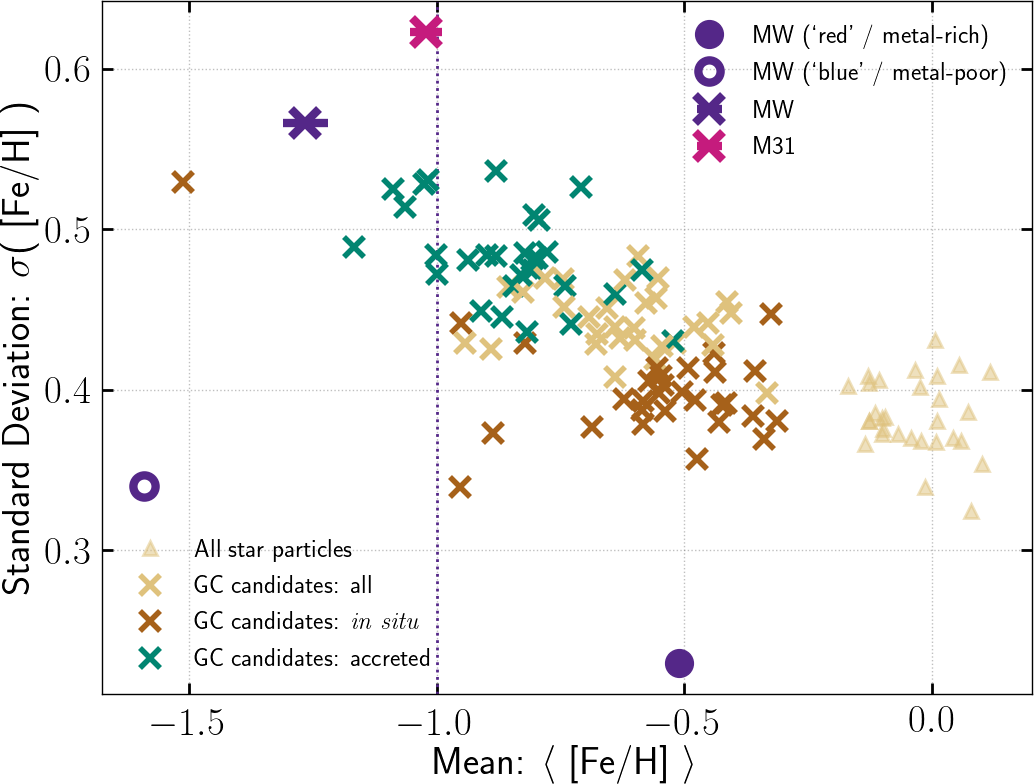
We show the mean metallicity and standard deviation of all Auriga L4 haloes in Figure 4 to illustrate the individual behaviour for the full set of Auriga galaxies. The beige crosses are to be compared to the purple and magenta crosses, which show the mean value of all MW and M31 GCs, respectively. In addition, we show the metal-rich population of the MW GCS using a solid dot, and the metal-poor population with an open dot. We caution that these literature values result from individual Gaussian fits to subsets of the observational data cut at [Fe/H] . We do not include corresponding data points calculated using such an artificial cut for the simulated star particles. It is interesting that the mean metallicities of the in situ GC candidates appear roughly consistent with that of the metal-rich population of the MW despite the lack of such a metallicity cut, although the simulations show larger dispersions. The latter could simply be caused by the hard separation of the MW data into two groups, which means the range is smaller and the resulting dispersion lower. With regard to the M31 GCS, so far no definitive consensus has been reached in the literature concerning uni- bi- or trimodality in the [Fe/H] distribution, but CR16 argues that the data, after removal of younger objects due to improved age classification, hints at three populations separated at [Fe/H] and [Fe/H] . None of the Auriga subsets has a mean value that offers much hope of reconciling the simulated distribution with the lowest metallicity group in the M31 GCS. This is also true for the metal-poor population of the MW with a mean value of . The main result of this figure is that all Auriga L4 galaxies have metallicity distributions with (much) larger mean values than observed for the MW and M31 GCS, and that we systematically find lower mean metallicities for the accreted GC candidates than for those that have formed in situ.
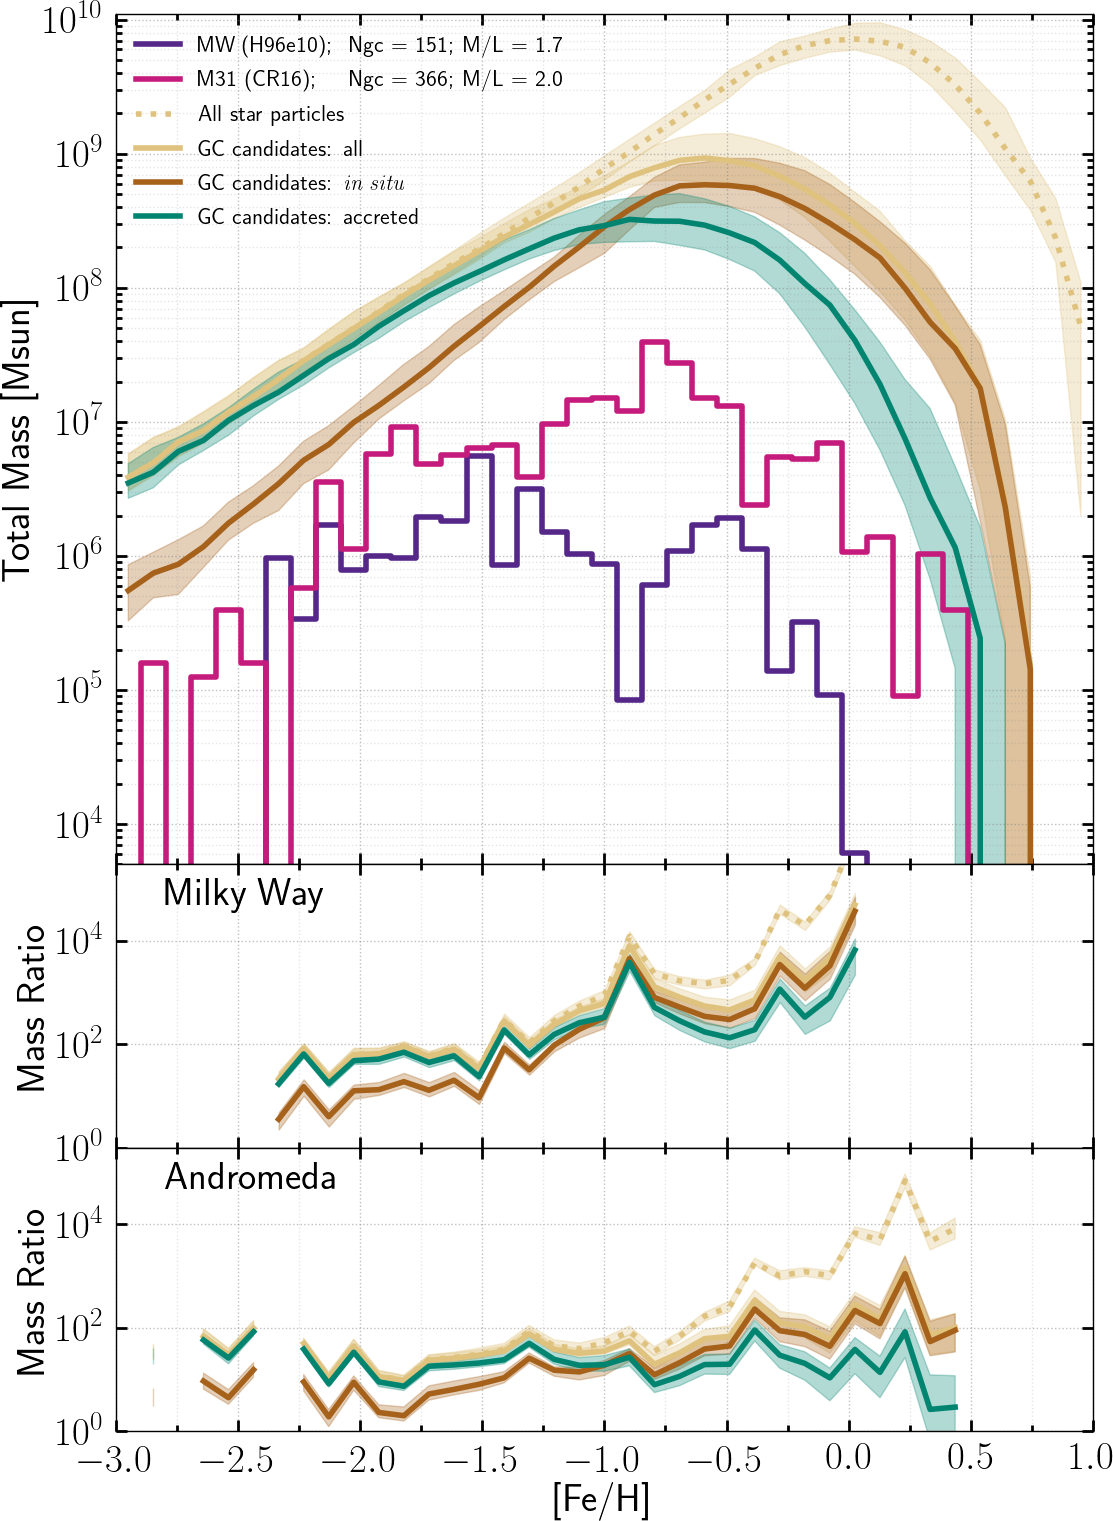
We now turn to our second goal, which is to see whether sufficient total mass in GC candidates is produced by the Auriga simulations. To answer this question we plot a mass-weighted metallicity distribution in Figure 5. We show the median over all the Auriga L4 haloes and the 25-75 percentile range as shaded regions, which shows the scatter between runs that have different initial conditions, thus, have varying merger histories. We chose to aggregate the data to indicate general trends that we find when the GC candidates are split up into the accreted and in situ subsets, rather than selecting typical examples of individual (simulated) galaxies. Once again we notice that the peak metallicity shifts down from [Fe/H] = to [Fe/H] = for GC candidates compared to all stars, and we find that the mass at the peak lowers by roughly one dex. The mass budget of the GC candidates is dominated by the in situ subpopulation above [Fe/H] = , and by the accreted subset below this value. We show the MW GCS in purple and that of M31 in magenta, and notice that the difference between the MW and M31 distributions is substantially larger than the scatter between different Auriga galaxies, particularly around [Fe/H] . In addition, M31 does host (a handful of) GCs with [Fe/H] as well as GCs with [Fe/H] while the MW does not.
We show the ratio of the simulated to the observed profiles in the middle and bottom panels. This mass excess can be thought of the ‘mass budget’ that the Auriga GC candidates can ‘afford to lose’ (due to a combination of smaller than unity bound cluster formation efficiencies combined with a Hubble time of dynamical evolution), while still producing sufficient mass at the right metallicities. In particular, the combined efficiency would have to increase with decreasing metallicity for Auriga GC candidates to produce a population of GC candidates that is consistent with the MW. For the GC candidates in M31 we find a constant mass ratio up to [Fe/H]=, above which the simulations produce a higher mass ratio with increasing metallicity. If dynamical evolution is not expected to more efficiently disrupt GCs of higher metallicity, then we would find that the efficiency to form bound star clusters would have to decrease with increasing metallicity. This trend could be consistent with the cluster formation efficiency model of Kruijssen (2012) as lower metallicity star particles formed at earlier times when the bound cluster formation efficiencies are higher due to higher pressure birth environments.
4.2 Radial distribution
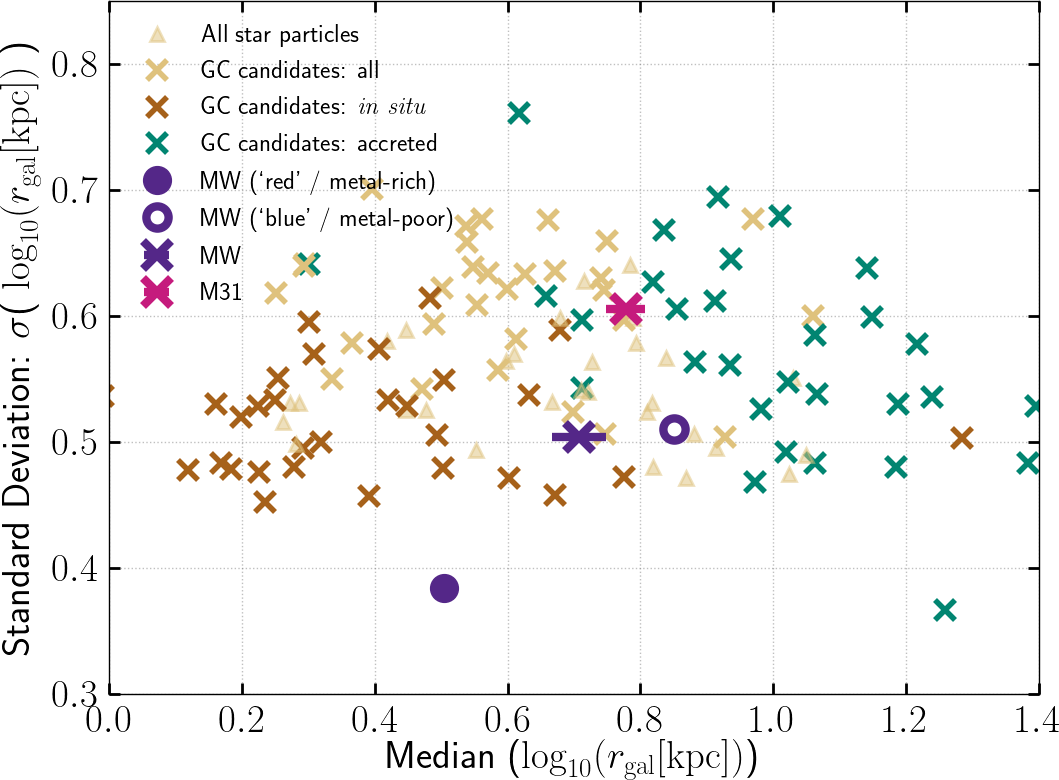
We repeat the analysis of the previous subsection for the distribution of galactocentric radius instead of metallicity. We divide the Auriga radii by and multiply by to compensate for the different intrinsic sizes of the Auriga galaxies. We look for general trends present in all Auriga L4 galaxies. Figure 6 shows the median and standard deviation of of star particles in all Auriga L4 simulations, respectively. The purple and magenta cross show the median of the MW and M31 GCs, which are to be compared to the beige crosses. The solid dot now shows our calculation of the median value of the ‘red’ metal-rich population, and the open dot that of the ‘blue‘ metal-poor population. We split the radii up into the metal-rich/metal-poor groups by taking a metallicity cut at [Fe/H] = -1 as is done in the literature.
We notice that the in situ GC candidates are more centrally distributed, whereas the accreted subsets have a larger radial extent. This is not surprising because the classification of in situ requires star particles to have formed within the virial radius, thus they could naturally be expected to end up at small galactocentric radii. Accreted star particles, on the other hand, have formed in another (sub)halo beyond the virial radius, thus, they would first have to migrate inwards in order to populate the innermost radii. Moreover, we find that the simulations have a wider dispersion in than the MW GCS, while the dispersion of M31 seems to lie within the range of dispersions found in the Auriga galaxies. Furthermore, the median of the MW GCS lies roughly within the range of values produced by the Auriga simulations, whereas the median of M31 is somewhat larger and slightly closer to typical median values of the accreted GC candidates in the Auriga simulations. The larger radial extent of the M31 GCS is generally believed to hint at a more accretion-dominated origin of the GCS, and may reflect a richer accretion history of M31 in comparison to the MW.
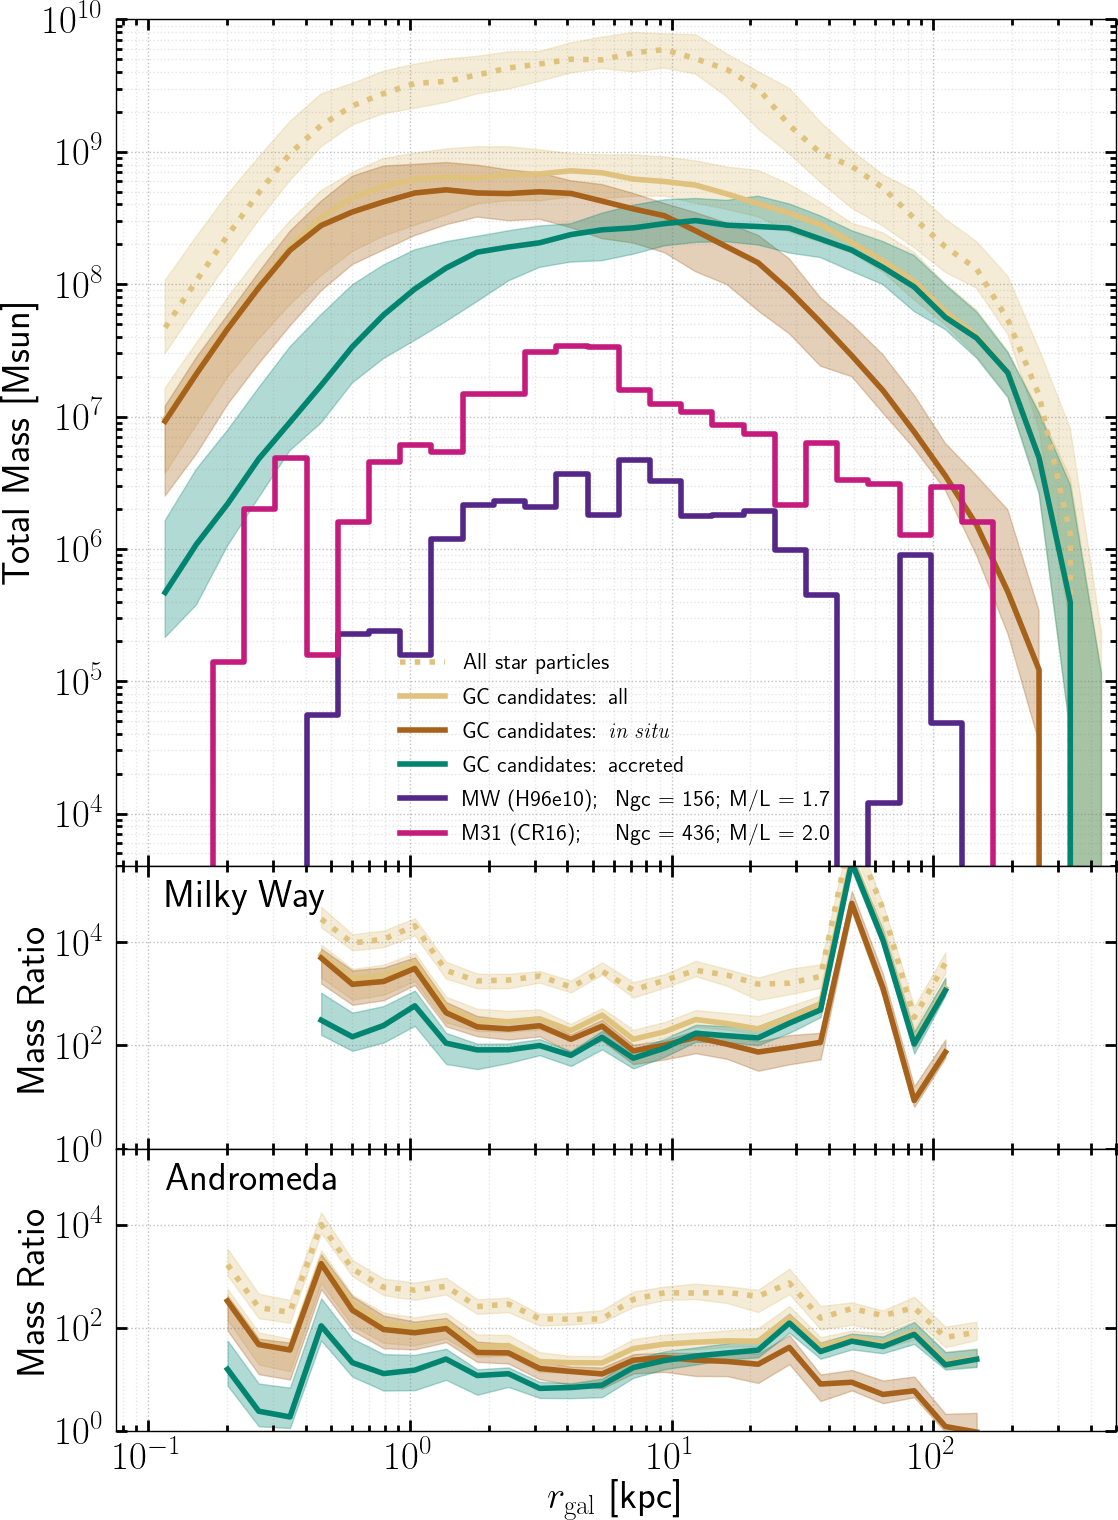
Figure 7 shows the mass-weighted radial distribution of the Auriga L4 haloes. We notice a subtle peak around kpc for all star particles that is not present for the GC candidates, indicating that the stellar disc is no longer present when applying the latter selection criterion. Furthermore, we find that the dominant contribution to the total mass in GC candidates changes from those formed in situ to the accreted population around kpc. Again we show the mass ratio of the simulations compared to the MW and M31 GCS. We find a decreasing mass ratio with increasing radius in the range to kpc, followed by an increase attributed to the accreted subpopulation. For the MW we notice that significantly fewer GCs are found beyond kpc than for M31, and that accreted GC candidates contribute mostly to the Auriga GCS at these radii. We further investigate a breakdown of the total mass in Auriga GC candidates into bins of both metallicity and radius in the following section.
4.3 Total mass in metallicity-radial space
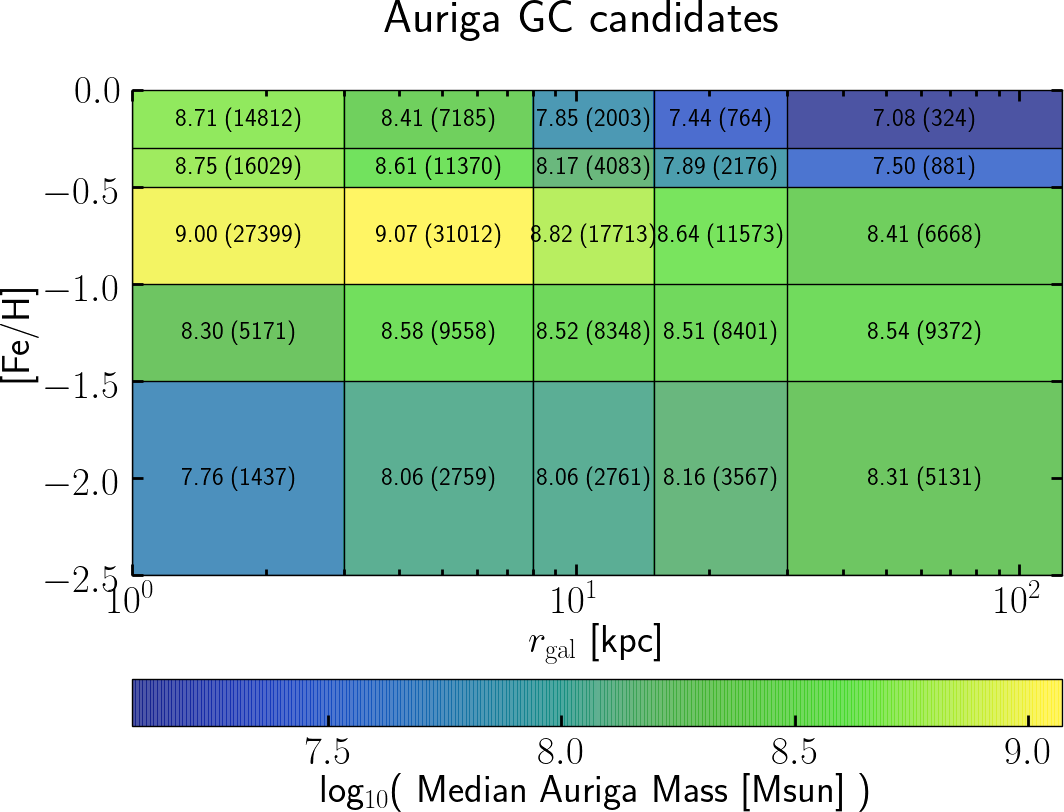
We investigate whether the Auriga simulations still produce sufficient mass when the GC candidates are two-dimensionally binned in [Fe/H] and . First we sum the total mass of GC candidates in each bin (for an individual Auriga simulation), then we calculate the median total mass in each bin over all Auriga L4 haloes. The result is shown in Figure 8, which can be compared to the observed total GC mass shown in Figure 2. We notice that the simulations produce relatively little mass in metal-poor GC candidates at small radii and in metal-rich GC candidates at large radii. However, there is still few times M⊙ produced by the simulations in the uppermost 3 bins where no observed GCs are found.
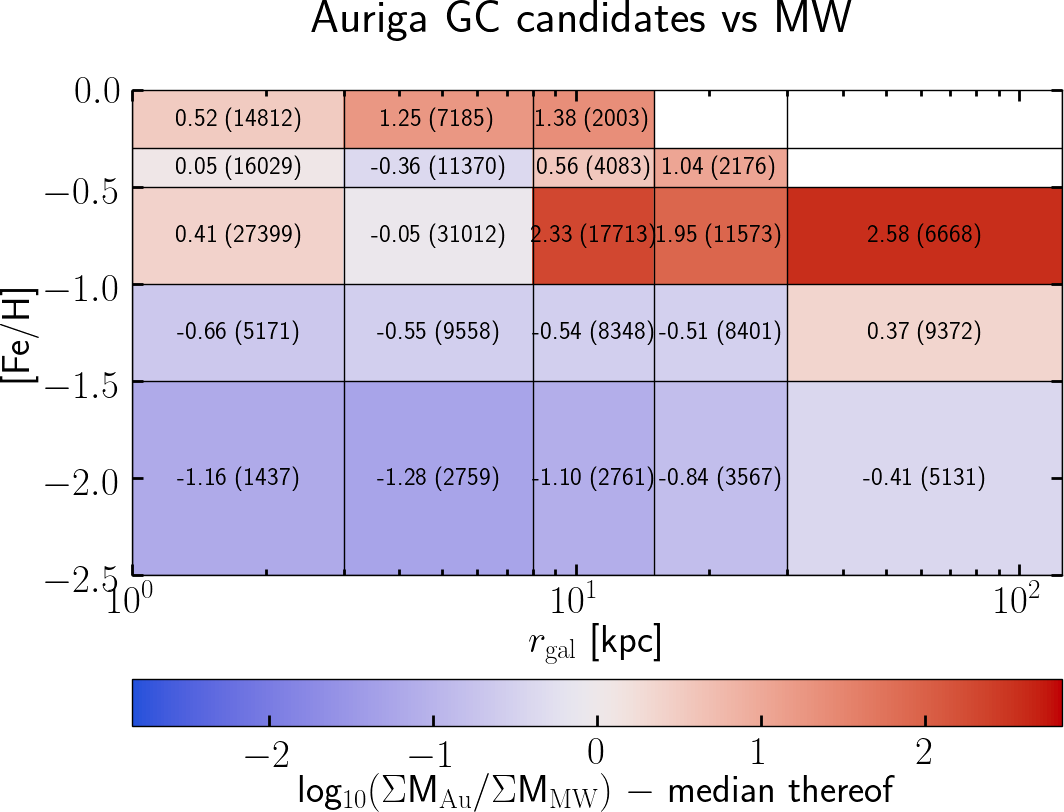
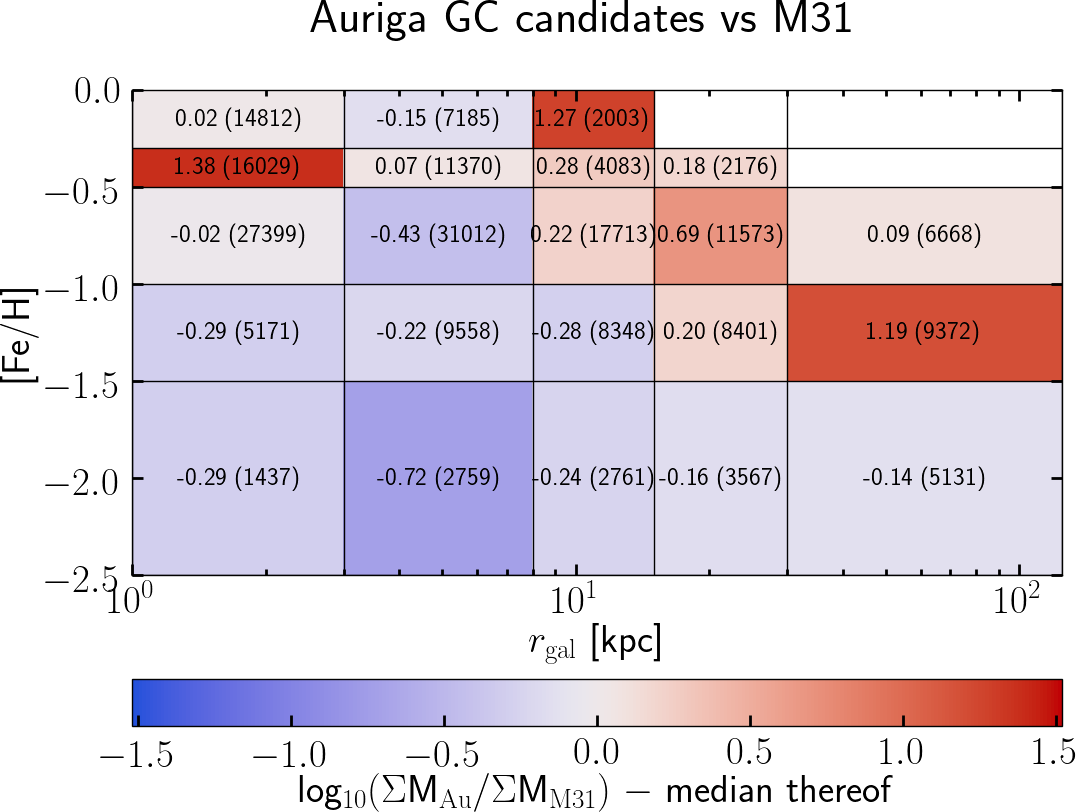
To ease this comparison between the simulations and observations we take the ratio of the total mass of GC candidates in Auriga to the total GC mass in the observations. We use a diverging colour map centered around the overall median of the mass ratio (i.e. we subtract the median of these bins from the value in each bin). We show this in the top and bottom panel of Figure 9 for the MW and M31, respectively. Note that the 3 bins in the top right are empty (white) because the mass ratio cannot be calculated due to zero mass in the observations. If the product of the bound cluster formation efficiency and consecutive GC disruption over a Hubble time would be constant, then the value in each bin would be zero. The red and blue bins indicate deviations from such a scenario and indicate a higher and lower than average mass excess in the simulations. The median value used to shift the mass ratio is and dex for the MW and M31, respectively. This means that the median ‘mass budget’ that the simulations ‘can afford to lose’ is roughly a factor and for the MW and M31, respectively. The lowest mass surplus for both galaxies is the bin with metallicities in the range [Fe/H] and galactocentric radius kpc, for which the simulations produce a factor and more mass in GC candidates than is observed in the MW and M31 respectively. The highest factor for the MW is , and for M31.
We now focus on four quadrants of this diagram, split at [Fe/H] = -1 (metal-poor or metal-rich) and = 8 kpc (inside or outside the Solar radius). The majority of the mass in Auriga GC candidates is produced in metal-rich star particles inside the Solar radius. The total mass is dominated by the in situ component, for [Fe/H] as well as for as can be seen in Figure 5 and Figure 7. The total mass excess in this region increases with decreasing metallicity for the MW and M31, and there is a weak trend of decreasing over-production with increasing radius for the in situ subsets but no trend with radius for the accreted GC candidates. As for the metal-rich GC candidates outside the Solar radius, we find that the mass excess with respect to the median is largest in this corner for the MW and M31. The main reason for this trend are the lower GC counts in the observations, whereas the Auriga simulations efficiently form metal-rich GC candidates and have no problem to produce them at large radii. The opposite is true for the metal-poor GC candidates inside the Solar radius, where the mass surplus with respect to the median is smallest for both galaxies. However, the disruption rates are expected to be particularly high for GCs in the inner regions of galaxies which must have orbits with pericentres close to the galactic bulge or bar. In addition, disk crossings in this region will cause spikes in the tidal tensor due to steep density gradients that could be highly disruptive to the GCs. The bins with the lowest ‘mass budget’ are in this region (a factor 9 for the MW and 22 for M31). The bound cluster formation efficiency has to exceed 10%, and none of the GC candidates in this region can experience significant mass loss in order for Auriga to produce sufficient mass in this quadrant. Finally, the metal-poor GC candidates outside the Solar radius have lower than average mass ratios, which is not surprising given that the Auriga simulations overall underproduce low-metallicity stars particles.
5 Discussion
5.1 Metallicity distribution
GCs are dex more metal-poor than spheroid stars observed at the same radius for almost all galaxies (Harris, 1991). Our selection function (age cut) does lower the mean metallicity of GC candidates by dex with respect to all star particles, but we still find that the GC candidates in the Auriga simulations are more metal-rich than the MW and M31 GCSs. Although the (old) star particles represent single stellar populations with a mass consistent with that of GCs, they are in fact statistical tracers of the stellar population of the galaxy as a whole. Therefore only a (small) fraction of the star particles may represent plausible formation sites of GCs, whereas the majority represents (halo) field stars - the disk component effectively falls outside our selection of star particles due to the age cut. It is implausible that all halo stars come from disrupted GCs because the total mass in GCSs at redshift zero is generally a few orders of magnitude lower than the total mass of stellar haloes of galaxies. If stellar haloes solely consist of disrupted GCs, then the GC disruption rate would have to be considerably higher than expected from theoretical models. Moreover, disrupted dwarf galaxies are more likely to contribute to the build up of the stellar halo than GCs (e.g. Deason et al., 2015; Conroy et al., 2019). Overall, our set of GC candidates most likely contains an overabundance of regular stars. It could be that the resulting metallicity distribution is then biased towards higher values than observed for real GCs. An alternative explanation could overmixing of metals at early times.
In general, the colour (metallicity) distribution of most GCSs appears to be bimodal with typical separating value [Fe/H] (Zinn, 1985; Gebhardt & Kissler-Patig, 1999; Larsen et al., 2001; Peng et al., 2006). Indeed, Ashman & Zepf (1998) and Harris (2001) find that the MW GCS has a bimodal [Fe/H] distribution. Observations of GCs in M31, however, may be best split into three distinct metallicity groups (Caldwell & Romanowsky, 2016). The numerical simulation of Renaud et al. (2017) does yield a bimodal metallicity distribution where the metal-poor population is dominated by accreted star particles and the metal-rich population by in situ stars.
However, we find that none of the Auriga simulations produces a bimodal metallicity distribution for age-selected GC candidates. Interestingly, the cross-over point above (below) which the mass-weighted metallicity distribution of GC candidates is dominated by those that have formed in situ (were accreted) does coincide with the separation between the metal-rich and metal-poor populations of GCSs at [Fe/H] = , as for the MW. Moreover, we do find that the mean metallicity shifts when we split the GC candidates according to birth location (accreted or in situ). In particular, the mean values of the in situ GC candidates are roughly consistent with the metal-rich MW GCs. On the other hand, we also notice that most of the simulations have a similar mean value for all GC candidates, and the simulated in situ GC candidates have larger dispersions than is claimed for metal-rich GCs in the MW. Moreover, the offset between the means of the metal-rich and metal-poor populations in the MW is dex, a factor larger than the offset that we find between the in situ and accreted populations. However, we caution that Kruijssen et al. (2019) suggests to reserve the ‘ex situ’ classification for accretion after , when the central galaxy has formed and accretion unambigously contributes to the radially extended halo GC population. In fact, our classification might not hold for Au4-1.
Finally, we note that Brodie & Strader (2006) compares the number of metal-poor GCs to the stellar halo mass and find888The specific frequency is the number of GCs per M⊙ of galaxy stellar mass. , while the number of metal-rich GCs compared to the bulge mass yields , and therefore conclude that the formation efficiency of metal-poor GCs is 20 times higher than the metal-rich GCs with respect to field stars. We find that a gradual increase in formation efficiency of GCs with respect to field stars would be required with decreasing metallicity for the GC candidates in the Auriga simulations to yield sufficient total mass to be consistent with the MW or M31 GCS. In addition, the metal-poor GC candidates would have to experience low mass loss rates, especially those within the Solar radius.
5.2 Radial distribution
The M31 GCS has a factor 2-3 more GCs at large radii compared to the MW GCS, which may indicate that M31 has a richer merger history than the MW (Caldwell & Romanowsky, 2016). In the Auriga simulations we find that the GC candidates at radii larger than kpc are indeed dominated by accreted star particles. However, we select star particles that are bound to the main halo and main subhalo, which means that we include particles up to the virial radius . The Auriga simulations have no problem populating the stellar halo up to the virial radius, even with our additional age cut. On the other hand, the MW and M31 have fewer GCs at large radii. We expect tidal disruption to be less efficient at larger radii, thus, the formation efficiencies of the accreted GC candidates would have to be lower Alternatively, the fraction of old star particles in our subset of GC candidates may contain considerably more star particles that represent stars in the old stellar halo that have been accreted during hierarchical buildup of the galaxy. Our classification of GC candidates could be improved for the accreted subset in particular. For example, we could select only a subset of the accreted star particles as GC candidates where the number number of GCs would be determined by the satellite halo mass, given the correlation found by Burkert & Forbes (2019). However, we did not include such an analysis in this study.
5.3 Lower age cut in the GC selection function
Our method is sensitive to the definition that we adopt to classify GC candidates (e.g. Forbes et al., 2018). Therefore we explore how our results change if we include all star particles older than 8 Gyr, and if we further lower the age cut to 6 Gyr. The average fraction of GC candidates that we select from the all the star particles increases to 35% and 55% for an age cut of 8 and 6 Gyr, respectively.
We find that including more recently formed star particles in our subset of GC candidates shifts the mean metallicity to higher values. Moreover, the total mass in metal-rich ([Fe/H] > -1) GC candidates increases for a lower age threshold and moves closer to the dotted line that shows the distribution of all star particles in Figure 5. However, we notice that the Auriga simulations, on average, do not form new stars with a metallicity below [Fe/H] = -1 more recent than 6 Gyr ago: the behaviour of Figure 5 does not change for metallicities below [Fe/H] = -1 when we change the age cut to 8 or 6 Gyr, and the slope of the masss ratio for metallicities above [Fe/H] = -1 is slightly steeper. In addition, we still find that the accreted GC candidates are more metal-poor than those that have formed in situ.
The qualitative behaviour of the median distribution of galactocentric radii (Figure 7) is unaffected by lowering the age cut other than including more star particles (more mass) which leads to a higher normalisation and a higher mass ratio with respect to the observed GC systems of the MW and M31. The qualitative behaviour presented in Figure 9 does not change when the age cut is lowered to 8 or 6 Gyr. Overall, reducing the age cut worsens the agreement between the observed GCSs and the candidate GCs in the Auriga galaxies.
6 Summary and conclusions
We investigate statistics of age-selected ( 10 Gyr) GC candidates in the Auriga simulations and compare the simulations to the MW and M31 GCSs to test whether the star formation model implemented for the Auriga simulations could give rise to metallicity and radial distributions that are consistent with these two observed GC systems. Based on our analysis we draw the following conclusions.
-
•
The star formation model implemented in the Auriga simulations produces metallicity distributions that are more metal-rich than the MW and M31 GCSs. For most of the Auriga simulations we find that the subset of accreted GC candidates has a lower mean metallicity than the in situ subpopulation. However, the accreted subsets are still more metal-rich than the MW and M31 GCSs. Moreover, none of the simulated subsets has a mean metallicity as low as the mean of the ‘blue’ metal-poor component of the MW GCS.
-
•
We find that the difference between the metallicity distributions of the MW and M31 GCSs is big compared to the scatter in the Auriga GC candidates of different Auriga runs. The radial distributions of the MW and M31 GCSs are somewhat more similar, but they are not consistent with being drawn from the same distribution. The scatter between the radial distributions of different Auriga simulations is smaller than the difference between the MW and M31 GCSs.
-
•
GC candidates in the Auriga simulations may be found out to , given that our selection function of star particles selects all stars bound to the main subhalo of the halo. The total mass of GC candidates is dominated by accreted star particles at radii beyond kpc. The GCs in the MW and M31, on the other hand, have a much smaller radial extent.
-
•
Tidal forces are larger in the inner regions of galaxies than in the outer halo. Therefore, we expect dynamical evolution to more strongly affect GC candidates at small radii than at large radii. However, we find that the Auriga simulations produce more mass in GC candidates with high metallicities at large radii than with low metallicities at small radii. The cluster formation efficiency would have to increase with decreasing metallicity for GC candidates in the Auriga simulations to be consistent with the MW GCS. This trend of over-production of old star particles that are metal-rich and at large radii compared to observed GCs is less clear for the M31 GCS.
-
•
Overall, we conclude that the metallicity and radial distribution of age-selected star particles in the Auriga simulations are not consistent with globular cluster system of the Milky Way or with that of the Andromeda galaxy.
Acknowledgements
We thank the anonymous referee for a thoughtful and elaborate report. TLRH acknowledges support from the International Max-Planck Research School (IMPRS) on Astrophysics. TLRH thanks the Max Planck Computing and Data Facility for maintaining the Freya compute cluster, where the simulations were post-processed. FM is supported by the program "Rita Levi Montalcini" of the Italian MIUR. FAG acknowledges financial support from CONICYT through the project FONDECYT Regular Nr. 1181264, and funding from the Max Planck Society through a Partner Group grant. This work has been supported by the European Research Council under ERC-StG grant EXAGAL- 308037. Part of the simulations of this paper used the SuperMUC system at the Leibniz Computing Centre, Garching, under the project PR85JE of the Gauss Centre for Supercomputing. This work used the DiRAC Data Centric system at Durham University, operated by the Institute for Computational Cosmology on behalf of the STFC DiRAC HPC Facility ‘www.dirac.ac.uk’. This equipment was funded by BIS National E-infrastructure capital grant ST/K00042X/1, STFC capital grant ST/H008519/1 and STFC DiRAC Operations grant ST/K003267/1 and Durham University. DiRAC is part of the UK National E-Infrastructure.
The analysis in this work was performed using the Python (van Rossum & de Boer, 1991) programming language, the IPython (Perez & Granger, 2007) environment, the NumPy (van der Walt et al., 2011), SciPy (Jones et al., 2001), and Astropy (Astropy Collaboration et al., 2013) packages. Plots were created with Matplotlib (Hunter, 2007), using the perceptually uniform colour maps from Kovesi (2015) for two-dimensional plots. This research has made use of NASA’s Astrophysics Data System Bibliographic Services.
References
- Ashman & Zepf (1992) Ashman K. M., Zepf S. E., 1992, ApJ, 384, 50
- Ashman & Zepf (1998) Ashman K. M., Zepf S. E., 1998, Globular Cluster Systems
- Astropy Collaboration et al. (2013) Astropy Collaboration et al., 2013, A&A, 558, A33
- Beasley et al. (2002) Beasley M. A., Baugh C. M., Forbes D. A., Sharples R. M., Frenk C. S., 2002, MNRAS, 333, 383
- Boley et al. (2009) Boley A. C., Lake G., Read J., Teyssier R., 2009, ApJ, 706, L192
- Bondi (1952) Bondi H., 1952, MNRAS, 112, 195
- Bondi & Hoyle (1944) Bondi H., Hoyle F., 1944, MNRAS, 104, 273
- Boylan-Kolchin (2017) Boylan-Kolchin M., 2017, MNRAS, 472, 3120
- Brodie & Strader (2006) Brodie J. P., Strader J., 2006, ARA&A, 44, 193
- Burkert & Forbes (2019) Burkert A., Forbes D., 2019, arXiv e-prints,
- Caldwell & Romanowsky (2016) Caldwell N., Romanowsky A. J., 2016, ApJ, 824, 42
- Caldwell et al. (2011) Caldwell N., Schiavon R., Morrison H., Rose J. A., Harding P., 2011, AJ, 141, 61
- Cen (2001) Cen R., 2001, ApJ, 560, 592
- Chiou et al. (2019) Chiou Y. S., Naoz S., Burkhart B., Marinacci F., Vogelsberger M., 2019, arXiv e-prints,
- Choksi & Gnedin (2019a) Choksi N., Gnedin O. Y., 2019a, arXiv e-prints,
- Choksi & Gnedin (2019b) Choksi N., Gnedin O. Y., 2019b, MNRAS, 486, 331
- Choksi et al. (2018) Choksi N., Gnedin O. Y., Li H., 2018, MNRAS, 480, 2343
- Conn et al. (2012) Conn A. R., et al., 2012, ApJ, 758, 11
- Conroy et al. (2019) Conroy C., Naidu R. P., Zaritsky D., Bonaca A., Cargile P., Johnson B. D., Caldwell N., 2019, ApJ, 887, 237
- Côté et al. (2000) Côté P., Marzke R. O., West M. J., Minniti D., 2000, ApJ, 533, 869
- Côté et al. (2002) Côté P., West M. J., Marzke R. O., 2002, ApJ, 567, 853
- Deason et al. (2015) Deason A. J., Belokurov V., Weisz D. R., 2015, MNRAS, 448, L77
- Diemand et al. (2005) Diemand J., Madau P., Moore B., 2005, MNRAS, 364, 367
- El-Badry et al. (2019) El-Badry K., Quataert E., Weisz D. R., Choksi N., Boylan-Kolchin M., 2019, MNRAS, 482, 4528
- Fall & Rees (1985) Fall S. M., Rees M. J., 1985, ApJ, 298, 18
- Fattahi et al. (2019) Fattahi A., et al., 2019, MNRAS, 484, 4471
- Faucher-Giguère et al. (2009) Faucher-Giguère C.-A., Lidz A., Zaldarriaga M., Hernquist L., 2009, ApJ, 703, 1416
- Forbes et al. (2018) Forbes D. A., et al., 2018, Proceedings of the Royal Society of London Series A, 474, 20170616
- Gebhardt & Kissler-Patig (1999) Gebhardt K., Kissler-Patig M., 1999, AJ, 118, 1526
- Gnedin (2003) Gnedin O. Y., 2003, in Kissler-Patig M., ed., Extragalactic Globular Cluster Systems. p. 224 (arXiv:astro-ph/0210556), doi:10.1007/10857603_35
- Gnedin et al. (2001) Gnedin O. Y., Lahav O., Rees M. J., 2001, arXiv Astrophysics e-prints,
- Grand et al. (2017) Grand R. J. J., et al., 2017, MNRAS, 467, 179
- Grand et al. (2018) Grand R. J. J., et al., 2018, MNRAS, 474, 3629
- Gratton et al. (2012) Gratton R. G., Carretta E., Bragaglia A., 2012, A&ARv, 20, 50
- Gunn (1980) Gunn J. E., 1980, in Hanes D., Madore B., eds, Globular Clusters. p. 301
- Harris (1991) Harris W. E., 1991, ARA&A, 29, 543
- Harris (1996) Harris W. E., 1996, AJ, 112, 1487
- Harris (2001) Harris W. E., 2001, Globular Cluster Systems. Springer Berlin Heidelberg, p. 223–408, doi:10.1007/3-540-31634-5_2, https://doi.org/10.1007/3-540-31634-5_2
- Harris & Pudritz (1994) Harris W. E., Pudritz R. E., 1994, ApJ, 429, 177
- Holtzman et al. (1992) Holtzman J. A., et al., 1992, AJ, 103, 691
- Holtzman et al. (1996) Holtzman J. A., et al., 1996, AJ, 112, 416
- Hunter (2007) Hunter J. D., 2007, Computing in Science and Engineering, 9, 90
- Huxor et al. (2014) Huxor A. P., et al., 2014, MNRAS, 442, 2165
- Johnson et al. (2017) Johnson T. L., et al., 2017, ApJ, 843, L21
- Jones et al. (2001) Jones E., Oliphant T., Peterson P., et al., 2001, SciPy: Open source scientific tools for Python, http://www.scipy.org/
- Kang et al. (1990) Kang H., Shapiro P. R., Fall S. M., Rees M. J., 1990, ApJ, 363, 488
- Kim et al. (2018) Kim J.-h., et al., 2018, MNRAS, 474, 4232
- Kovesi (2015) Kovesi P., 2015, arXiv e-prints, p. arXiv:1509.03700
- Kruijssen (2012) Kruijssen J. M. D., 2012, MNRAS, 426, 3008
- Kruijssen (2014) Kruijssen J. M. D., 2014, Classical and Quantum Gravity, 31, 244006
- Kruijssen (2015) Kruijssen J. M. D., 2015, MNRAS, 454, 1658
- Kruijssen et al. (2011) Kruijssen J. M. D., Pelupessy F. I., Lamers H. J. G. L. M., Portegies Zwart S. F., Icke V., 2011, MNRAS, 414, 1339
- Kruijssen et al. (2012) Kruijssen J. M. D., Pelupessy F. I., Lamers H. J. G. L. M., Portegies Zwart S. F., Bastian N., Icke V., 2012, MNRAS, 421, 1927
- Kruijssen et al. (2019) Kruijssen J. M. D., Pfeffer J. L., Crain R. A., Bastian N., 2019, MNRAS, 486, 3134
- Lahén et al. (2019) Lahén N., Naab T., Johansson P. H., Elmegreen B., Hu C.-Y., Walch S., 2019, arXiv e-prints,
- Larsen et al. (2001) Larsen S. S., Brodie J. P., Huchra J. P., Forbes D. A., Grillmair C. J., 2001, AJ, 121, 2974
- Larson (1996) Larson R. B., 1996, in Morrison H. L., Sarajedini A., eds, Astronomical Society of the Pacific Conference Series Vol. 92, Formation of the Galactic Halo…Inside and Out. p. 241
- Li & Gnedin (2014) Li H., Gnedin O. Y., 2014, ApJ, 796, 10
- Li et al. (2017) Li H., Gnedin O. Y., Gnedin N. Y., Meng X., Semenov V. A., Kravtsov A. V., 2017, ApJ, 834, 69
- Mackereth et al. (2018) Mackereth J. T., Crain R. A., Schiavon R. P., Schaye J., Theuns T., Schaller M., 2018, MNRAS, 477, 5072
- Mackey et al. (2019) Mackey A. D., et al., 2019, MNRAS, 484, 1756
- Madau et al. (2019) Madau P., Lupi A., Diemand J., Burkert A., Lin D. N. C., 2019, arXiv e-prints,
- Marinacci et al. (2014) Marinacci F., Pakmor R., Springel V., 2014, MNRAS, 437, 1750
- Marinacci et al. (2017) Marinacci F., Grand R. J. J., Pakmor R., Springel V., Gómez F. A., Frenk C. S., White S. D. M., 2017, MNRAS, 466, 3859
- McConnachie et al. (2005) McConnachie A. W., Irwin M. J., Ferguson A. M. N., Ibata R. A., Lewis G. F., Tanvir N., 2005, MNRAS, 356, 979
- McLaughlin & van der Marel (2005) McLaughlin D. E., van der Marel R. P., 2005, ApJS, 161, 304
- Monachesi et al. (2019) Monachesi A., et al., 2019, MNRAS, 485, 2589
- Muratov & Gnedin (2010) Muratov A. L., Gnedin O. Y., 2010, ApJ, 718, 1266
- Murray & Lin (1992) Murray S. D., Lin D. N. C., 1992, ApJ, 400, 265
- Pakmor & Springel (2013) Pakmor R., Springel V., 2013, MNRAS, 432, 176
- Pakmor et al. (2014) Pakmor R., Marinacci F., Springel V., 2014, ApJ, 783, L20
- Pakmor et al. (2016) Pakmor R., Springel V., Bauer A., Mocz P., Munoz D. J., Ohlmann S. T., Schaal K., Zhu C., 2016, MNRAS, 455, 1134
- Patel et al. (2017) Patel E., Besla G., Sohn S. T., 2017, MNRAS, 464, 3825
- Peebles (1984) Peebles P. J. E., 1984, ApJ, 277, 470
- Peebles & Dicke (1968) Peebles P. J. E., Dicke R. H., 1968, ApJ, 154, 891
- Peng et al. (2006) Peng E. W., et al., 2006, ApJ, 639, 95
- Perez & Granger (2007) Perez F., Granger B. E., 2007, Computing in Science and Engineering, 9, 21
- Pfeffer et al. (2018) Pfeffer J., Kruijssen J. M. D., Crain R. A., Bastian N., 2018, MNRAS, 475, 4309
- Portegies Zwart et al. (2010) Portegies Zwart S. F., McMillan S. L. W., Gieles M., 2010, ARA&A, 48, 431
- Recchi et al. (2017) Recchi S., Wünsch R., Palouš J., Dinnbier F., 2017, Ap&SS, 362, 183
- Renaud et al. (2017) Renaud F., Agertz O., Gieles M., 2017, MNRAS, 465, 3622
- Ricotti et al. (2016) Ricotti M., Parry O. H., Gnedin N. Y., 2016, ApJ, 831, 204
- Ryu & Lee (2018) Ryu J., Lee M. G., 2018, ApJ, 863, L38
- Schweizer (1987) Schweizer F., 1987, in Faber S. M., ed., Nearly Normal Galaxies. From the Planck Time to the Present. pp 18–25
- Snaith et al. (2014) Snaith O. N., Haywood M., Di Matteo P., Lehnert M. D., Combes F., Katz D., Gómez A., 2014, ApJ, 781, L31
- Snaith et al. (2015) Snaith O., Haywood M., Di Matteo P., Lehnert M. D., Combes F., Katz D., Gómez A., 2015, A&A, 578, A87
- Spitzer (1987) Spitzer L., 1987, Dynamical evolution of globular clusters
- Springel (2010) Springel V., 2010, MNRAS, 401, 791
- Springel & Hernquist (2003) Springel V., Hernquist L., 2003, MNRAS, 339, 289
- Springel et al. (2005) Springel V., Di Matteo T., Hernquist L., 2005, MNRAS, 361, 776
- VandenBerg et al. (2013) VandenBerg D. A., Brogaard K., Leaman R., Casagrande L., 2013, ApJ, 775, 134
- Vanzella et al. (2017) Vanzella E., et al., 2017, MNRAS, 467, 4304
- Veljanoski et al. (2014) Veljanoski J., et al., 2014, MNRAS, 442, 2929
- Vietri & Pesce (1995) Vietri M., Pesce E., 1995, ApJ, 442, 618
- Vogelsberger et al. (2013) Vogelsberger M., Genel S., Sijacki D., Torrey P., Springel V., Hernquist L., 2013, MNRAS, 436, 3031
- Wang et al. (2019) Wang S., Ma J., Liu J., 2019, arXiv e-prints
- West et al. (2004) West M. J., Côté P., Marzke R. O., Jordán A., 2004, Nature, 427, 31
- Whitmore & Schweizer (1995) Whitmore B. C., Schweizer F., 1995, AJ, 109, 960
- Whitmore et al. (1999) Whitmore B. C., Zhang Q., Leitherer C., Fall S. M., Schweizer F., Miller B. W., 1999, AJ, 118, 1551
- Zepf et al. (1999) Zepf S. E., Ashman K. M., English J., Freeman K. C., Sharples R. M., 1999, AJ, 118, 752
- Zinn (1985) Zinn R., 1985, ApJ, 293, 424
- van Rossum & de Boer (1991) van Rossum G., de Boer J., 1991, CWI Quarterly, 4, 283
- van der Walt et al. (2011) van der Walt S., Colbert S. C., Varoquaux G., 2011, Computing in Science and Engineering, 13, 22