First Hard X-ray Observation of a Compact Symmetric Object: A Broadband X-ray Study of a radio galaxy OQ with NuSTAR and Chandra
Abstract
Compact Symmetric Objects (CSOs) have been observed with Chandra and XMM-Newton to gain insights into the initial stages of a radio source evolution and probe the black hole activity at the time of relativistic outflow formation. However, there have been no CSO observations to date at the hard X-ray energies ( keV), impeding our ability to robustly constrain the properties of the intrinsic X-ray emission and of the medium surrounding the young expanding jets. We present the first hard X-ray observation of a CSO performed with NuSTAR. Our target, OQ , is detected up to 30 keV, and thus we establish CSOs as a new class of NuSTAR sources. We analyze the NuSTAR data jointly with our new Chandra and archival XMM-Newton data and find that a young, years old, radio jet spanning the length of 10 pc coexists with cold obscuring matter, consistent with a dusty torus, with an equivalent hydrogen column density –1024 cm-2. The primary X-ray emission is characterized by a photon index and intrinsic 0.5–30 keV luminosity erg s-1. The results of our spectral modeling and broad-line optical classification of the source suggest a porous structure of the obscuring torus. Alternatively, the source may belong to the class of optically un-obscured/X-ray obscured AGN. The observed X-ray emission is too weak compared to that predicted by the expanding radio lobes model, leaving an accretion disk corona or jets as the possible origins of the X-ray emission from this young radio galaxy.
Subject headings:
galaxies: active — galaxies: jets — galaxies: evolution — X-rays: galaxies1. Introduction
Theories of radio source evolution indicate that the initial expansion results in strong interactions between the radio outflow and the interstellar medium (ISM) within the central regions of the host galaxy. If the central regions are dense, then such interactions will generate strong shocks impacting the ISM, and clearing out the path for a jet (Begelman & Cioffi 1989; Heinz et al. 1998; Wagner & Bicknell 2012). Additionally, models predict that this initial evolutionary phase is characterized by high radio luminosity (Begelman & Cioffi 1989) and that the radio plasma contained in the compact lobes produces high-energy emission via the inverse Compton process (Stawarz et al. 2008; Migliori et al. 2014), or through strong shocks driven into the ISM by the expanding cocoon (Reynolds et al. 2001). However, there is little observational evidence to support these predictions as to date only one young radio source has been detected in the -ray band (Migliori et al. 2016). Furthermore, the quality of the X-ray data currently available for the young radio sources is still rather poor, as these sources are often faint and require long Chandra and XMM-Newton integration times to collect enough photons for a meaningful spectral analysis. Only a small number of CSOs have been studied in X-rays, yielding observed 2–10 keV fluxes of the order of 10-14–10-13 erg cm-2 s-1, and none at energies above 10 keV (Siemiginowska, 2009; Siemiginowska et al., 2016, S16 hereafter).
| Date | Mission | Instrument | Obsid | Exposure | Totala | Neta | ||
|---|---|---|---|---|---|---|---|---|
| [s] | counts | counts | ||||||
| 1 | 2014-09-04 | Chandra | ACIS | 16071 | 34604 | 678 | ||
| 2 | 2016-06-18 | NuSTAR | FPMA | 60201043002 | 50354 | 756 | ||
| 3 | 2016-06-18 | NuSTAR | FPMB | 60201043002 | 50150 | 704 |
Notes:
a Total and background subtracted counts in a circle centered on the source position:
(1) Chandra with 1.5′′ radius and the energies between 0.5 keV and 7 keV, and
(2) NuSTAR with 49.2′′radius and the energies between 3 keV and 30 keV.
Nevertheless, several CSOs have recent, good signal-to-noise X-ray spectra, allowing for detailed studies of their high-energy properties. Analysis revealed that these sources produce complex X-ray emission in which the primary power-law continuum, from either an accretion disk corona, jets or expanding radio lobes, is modified by absorption and reflection processes (e.g. Guainazzi et al. 2004; Siemiginowska et al. 2008; Tengstrand et al. 2009; S16; Sobolewska et al. 2019).
In this paper, we present an X-ray study of OQ (1404+286), a nearby (=0.0766, Stanghellini et al. 1993) radio source classified as a Compact Symmetric Object (CSO) based on the properties of its radio morphology. The double radio structure, with two components separated by 10 pc, the symmetry of the radio source, and multi-epoch radio monitoring allowed kinematic age measurements that showed that the radio source is 255 yrs old (Wu et al. 2013). The source is located in a nearby disturbed galaxy, Mkn 668, that shows signs of a past merger (Stanghellini et al. 1993). Based on its optical spectrum, it is classified as a broad-line radio galaxy (Marziani et al. 1993). The archival XMM-Newton spectrum showed a steep soft X-ray component of an unknown origin and a hard highly absorbed X-ray continuum with a strong Fe-K emission line (Guainazzi et al. 2004). Thus, we observed the source with Chandra and with NuSTAR, in order to construct and model its broad-band X-ray spectrum, search for any extended X-ray emission, and detect for the first time a young radio source above 10 keV.
Our data allow us to disentangle the individual X-ray emission components and obtain the energetics of the primary emission associated with this young radio source, as well as study the properties of the environment in which the source is expanding. Our relatively deep Chandra observation shows no significant X-ray diffuse emission on the scales exceeding 3 arcsec, indicating that the complex emission arises from the central regions. The NuSTAR observation provides crucial constraints on the high-energy spectral properties by extending the available energy coverage over which the source is detected to keV. In Section 2 we present our new Chandra and NuSTAR data and provide the details of the spectral model adopted in our analysis. In Section 3 we present our results, and we discuss them in Section 4. We summarize our findings in Section 5.
We use the most recent cosmological parameters (Hinshaw et al. 2013; km s-1 Mpc-1, ) implemented as WMAP9 in the astropy.cosmology package (Astropy Collaboration et al. 2013).
| # | Description | Symbol | Valuea | Unit | |
|---|---|---|---|---|---|
| linked | unlinked | ||||
| (1) | (2) | (3) | (4) | (5) | |
| 1 | Redshift | 0.0766 | 0.0766 | ||
| 2 | Inclination angle | 85 | 85 | deg | |
| 3 | Galactic equivalent hydrogen column density | 1.4 | 1.4 | 1020 cm-2 | |
| 4 | Equivalent hydrogen column density of the host galaxy | 1020 cm-2 | |||
| 5 | Intrinsic line-of-sight equivalent hydrogen column density | 1024 cm-2 | |||
| 6 | Photon index of the direct emission | ||||
| 7 | Cut-off energy of the direct emission | 300 | 300 | keV | |
| 8 | Equivalent hydrogen column density of the torus | 1024 cm-2 | |||
| 9 | Covering factor of the torus | ||||
| 10 | Constant normalizing the line emission component | ||||
| 11 | Iron abundance of the torus | 1 | 1 | Solar | |
| 12 | Scattering fraction of the direct power law | ||||
| 13 | Cross-normalization constant | 1 | 1 | ||
| 14 | Cross-normalization constant | ||||
| 15 | Cross-normalization constant | ||||
| 16 | Cross-normalization constant | ||||
| 17 | Soft 0.5–2 keV observed frame fluxb | erg cm-2 s-1 | |||
| 18 | Intermediate 2–10 keV observed frame fluxb | erg cm-2 s-1 | |||
| 19 | Hard 10–30 keV observed frame fluxb | erg cm-2 s-1 | |||
| 20 | Soft 0.5–2 keV rest-frame intrinsic luminosityb | erg s-1 | |||
| 21 | Intermediate 2–10 keV rest-frame intrinsic luminosityb | erg s-1 | |||
| 22 | Hard 10–30 keV rest-frame intrinsic luminosityb | erg s-1 | |||
| C-statistic | 2308 | 2301 | |||
| Degrees of freedom | 2336 | 2335 | |||
NOTES: a Columns (1) and (2) provide the description of the model parameters. Columns (3) and (4) give model parameter values for the two scenarios, with and linked to each other and unlinked, respectively. Column (5) gives the units of the model parameters. b Mean and standard deviation of the 68% confidence level measurements from the four individual data sets.
2. Data and Spectral Modeling
2.1. Chandra
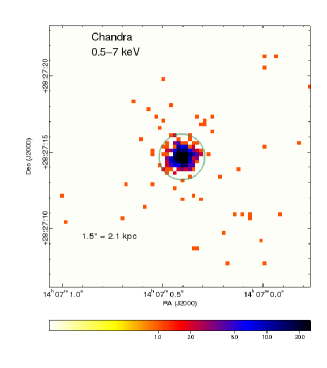
OQ was observed with Chandra ACIS-S for ksec (ObsID=16071, see Table 1 for details). The target was placed at the aim point on the back-illuminated ACIS CCD (ACIS-S3). The observations were made in VFAINT mode with 1/8 CCD readout (Chandra Proposers Observatory Guide111http://cxc.harvard.edu/proposer/POG/). The target was clearly detected with Chandra (see Fig. 1).
We used the Chandra CIAO software, version 4.9 (Fruscione et al. 2006) and CALDB version 4.7.6 to process the data. We used CIAO tool acis-process-events and applied the newest calibration files, filtered VFAINT background events, and ran a sub-pixel event-repositioning algorithm (and set pix_adj=EDSER). This final step provides the highest angular resolution X-ray image data for the most up-to- date ACIS-S calibration. Figure 1 displays the Chandra ACIS-S counts image in the 0.5–7 keV energy range, with the central 1.5′′ (2.1 kpc at the redshift of the source) radius circle centered on the coordinates of OQ (14:07:00.41, +28:27:14.65) marking the extraction region of the point source emission. The entire X-ray emission is contained in this region with low background counts scattered over the entire image. For the background, we used an annular region centered on the same position, with inner and outer radii of 2′′ and 5′′.
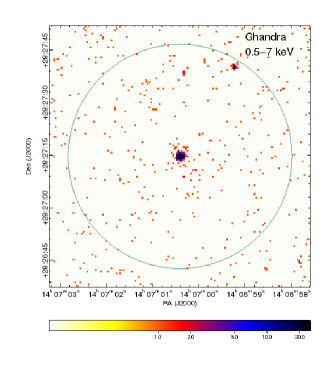
On a larger scale we detected a point X-ray source located (44 kpc at ) in the NE direction from the OQ center. Since the two radio lobes in OQ extend along the NW-SW axis, it is not likely that this source could be associated with a hot spot or past radio activity of the source. There is no obvious optical counterpart to the secondary source in the Sloan Digital Sky Survey. We note that the secondary, if persistent, would be included within the PN source extraction region in Guainazzi et al. (2004). However, in our Chandra data we detect only 27 counts from this source, as opposed to 650 counts from the OQ extraction region. Thus, we assess that the secondary source does not contribute significantly to the XMM-Newton spectrum of OQ .
2.2. NuSTAR
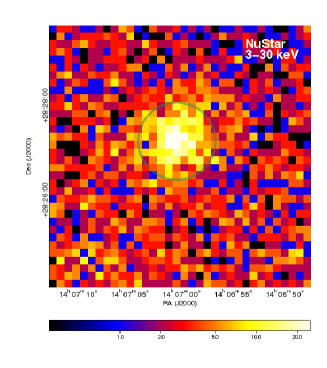
The NuSTAR (Harrison et al., 2013) observation of OQ was performed on 2016-06-18 for about 51 ksec (ID 60201043002) using two telescopes, FPMA and FPMB. We used HEAsoft 6.22.1 and nustardas_06Jul17_v1.8.0 software with the CALDB version 20171002 for data processing. We run nupipeline and nuproduct to apply dead time correction, account for SAA passages with SAAMODE = optimize, apply new calibration, and to extract spectra and generate appropriate response files. The source was clearly detected with NuSTAR (Fig. 1). We assumed a circle with the default 49.2′′ radius centered on OQ coordinates (14:07:00.4, +28:27:14.6) for extracting the source spectra. For the background we used annular regions centered on the same position with inner and outer radii of 123′′ and 196′′, respectively. Table 1 shows the resulting exposure and number of counts for each telescope.
2.3. Spectral modeling
Guainazzi et al. (2004) observed OQ with XMM-Newton and inferred that it could be a Compton thick AGN based on its apparently hard photon index and a strong neutral iron line emission. However, XMM-Newton data alone were not sufficient to constrain the photon index of the source and the amount of the intrinsic absorption. Here, we model simultaneously the new Chandra and NuSTAR data, as well as the archival XMM-Newton PN data of OQ using the XSPEC 12.9.1 software package with C-stat statistic (Arnaud et al. 1996). We allow for cross-normalization constants between the four data sets.
We construct a model in which the intrinsic X-ray emission of the source is described with a power-law function with photon index, , and an exponential cutoff fixed at keV, absorbed by the Galactic and host galaxy hydrogen column densities ( and , respectively). The X-ray emission above keV contains a strong contribution from the reflection of the primary X-ray continuum from a cold matter, presumably a toroidal structure around the central black hole, which we describe with the torus model of Baloković et al. (2018). The level of the soft X-ray emission below 4 keV requires that we include the scattered intrinsic continuum in the model. The complete model can be written as: , where stands for a constant introduced in order to account for the uncertainties in the cross-normalization of the data sets from the different telescopes; and is the photo-electric cross-section (in practice equals phabs * zphabs in the XSPEC nomenclature); is the zeroth-order multiplicative table given by Yaqoob (2012) and it accounts for the angle dependent absorption of the primary continuum by the obscuring torus; is the normalization constant corresponding to the scattered power-law emission. The torus component is described using the table models provided by Baloković et al. (2018). They self-consistently compute the reflection continuum and fluorescent K, K and K emission lines for atomic species up to zinc. Here, , where we introduce a normalization constant to account for the deviations from the perfect torroidal geometry. We investigate two scenarios: one where the line-of-sight column density, , and the average torus column density, , are linked to each other, and one where they are allowed to vary independently (corresponding to a porous torus case).
Stanghellini et al. (1997a) reported that the milliarcsecond morphology of the radio emission in OQ shows a flux density ratio between the two components of about 10:1. Based on the optical image of the galaxy, they indicate that the jet inclination of 45 deg is possible if the radio axis is aligned with the optical axis. They argue that the bulk velocity of 0.5 for this inclination angle could explain this flux density ratio via Doppler boosting. However, they also point out that the the difference in flux density may simply reflect random differences between the paths of the jets. Here, we assume that the radio jet is oriented in the plane of the sky (perpendicular to our line-of-sight), and the torus is perpendicular to the jet axis. Thus, we fix the inclination angle at a value corresponding to the deg in the torus model of Baloković et al. (2018).
3. Results
3.1. The first detection of hard X-ray emission from a Compact Symmetric Object
Our NuSTAR observation of OQ provides the first hard X-ray ( keV) detection of a CSO, and establishes these young radio sources as a new class of hard X-ray emitters. The source is detected up to 30 keV, at the confidence level within the 10–30 keV energy band.
3.2. Broad-band X-ray spectrum of OQ
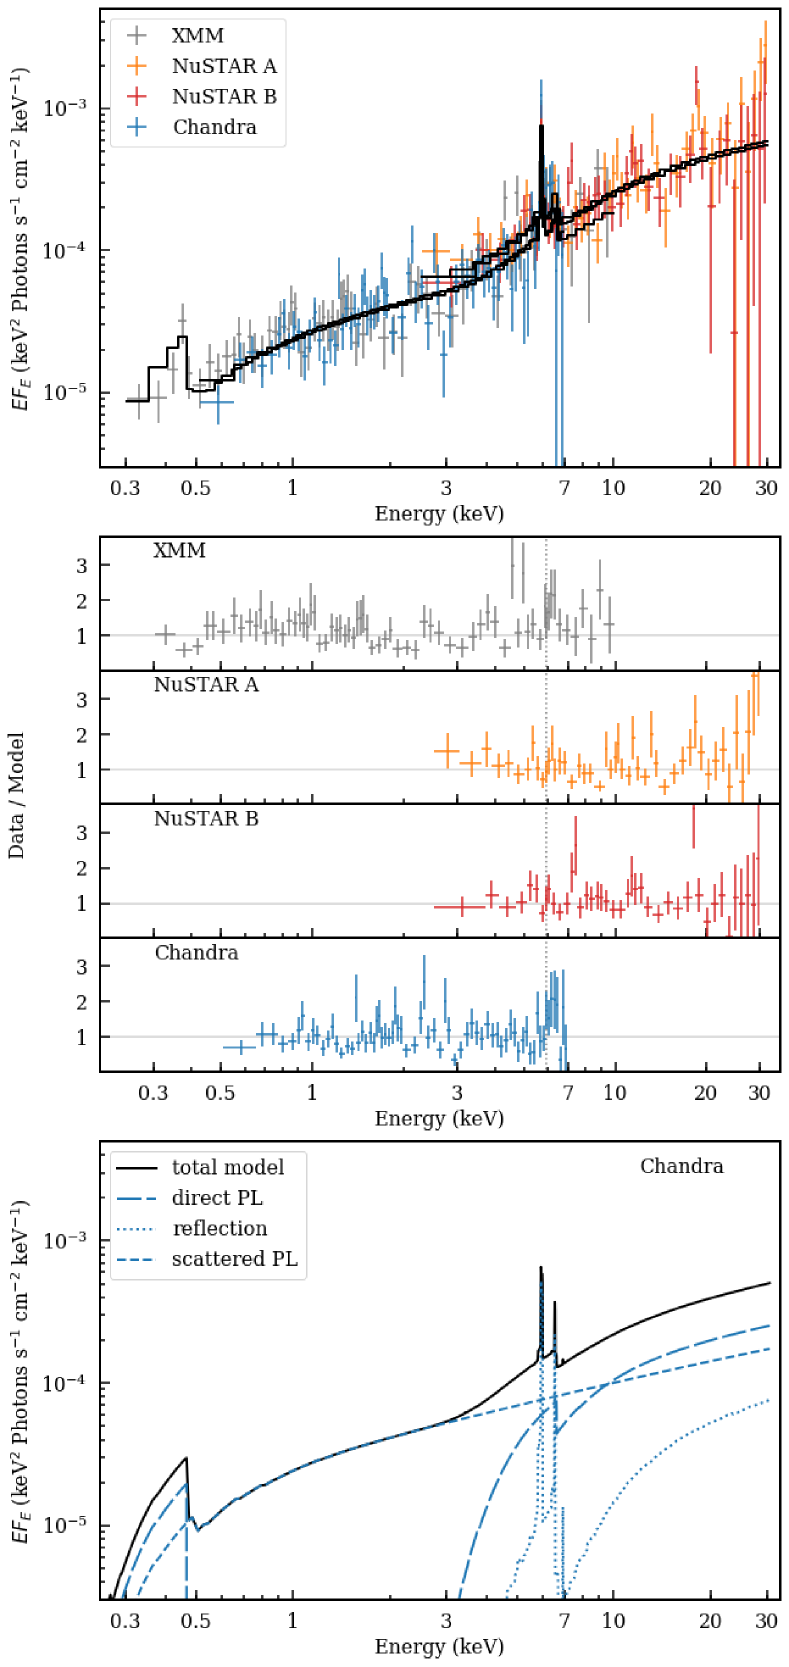
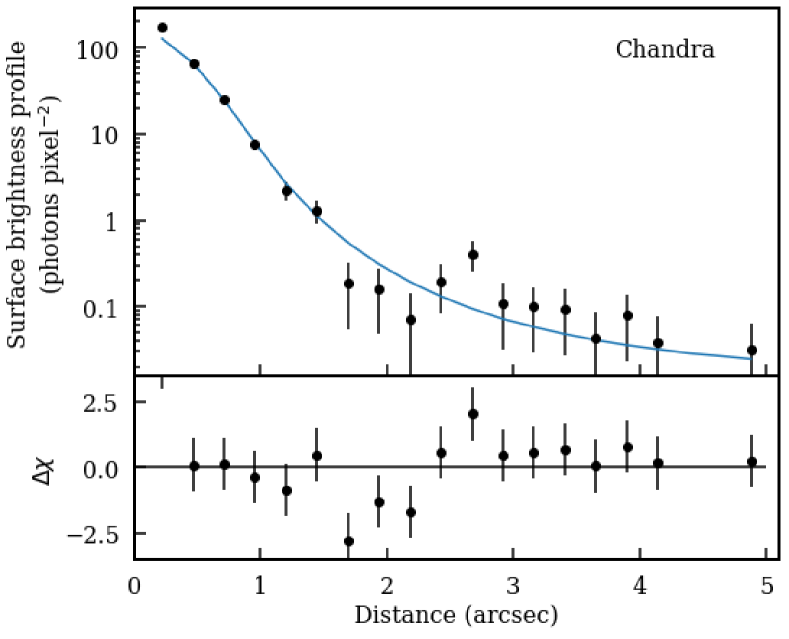
We found that the spectral model described in Sec. 2.3 fits well our broad-band multi-instrument X-ray data. Both scenarios, with linked and unlinked intrinsic equivalent hydrogen column densities corresponding to the line-of-sight direction, , and the torus, , resulted in acceptable fits with C-statistic/degrees of freedom of 2308/2336 and 2301/2335, respectively. Neither the Chandra image nor the broad-band X-ray spectrum provided evidence for the presence of an extended X-ray emission (Fig. 2). We show the data, unfolded models, model components, and data to model ratios for the case of linked column densities in Fig. 3. They are representative also of the unlinked column densities scenario.
We constrained the intrinsic photon index of the source, and for the linked and unlinked case, respectively (Tab. 2). We derived the absorbing column density of the torus and the line-of-sight column density: and cm-2 (linked scenario), and cm-2 and cm-2 (unlinked scenario). This confirms the presence of a significant amount of cold matter surrounding OQ with a large covering factor, –0.6, strongly attenuating the primary X-ray continuum. The torus column density of the unlinked scenario (porous torus) is times higher than in the linked scenario and high enough to classify this source as a Compton thick AGN. Additionally, the data require an intrinsic absorbing column of the order of cm-2 attributable to the host galaxy.
We find evidence for a strong fluorescent Fe emission around 6 keV (observer’s frame). With the iron abundance of the torus fixed at the solar value and , our spectral model appeared to underestimate the strength of the Fe K line emission. Thus, we allowed to vary, and derived and for the linked and unlinked scenarios, respectively. Alternatively, we were able to obtain fits of comparable quality by keeping , and varying the iron abundance of the torus, which resulted in abundance of and times the Solar value for our two cases, accordingly. Allowing the normalization of the line component to vary does not affect the derived values for the column densities.
The soft part of the observed spectrum, between 0.5 and 4 keV, is dominated by scattered power law emission with a relatively high scattering fraction of –0.7.
Our modeling gives rest-frame 0.5–30 keV de-absorbed luminosity of OQ of the order of 1043 erg s-1. Table 2 shows the contributions to this luminosity from the soft (0.5–2 keV), intermediate (2–10 keV) and hard (10–30 keV) X-ray bands. We also list the observed fluxes (not corrected for absorption) in these three energy bands (in the observed frame).
3.3. X-ray variability
We found that the Chandra and XMM-Newton PN cross-normalization constants are consistent with each other, indicating no flux variability between the 2003 and 2014 observations. However, the FPMA/B cross-normalization constants indicate that the normalization of the NuSTAR spectra is higher than that of the Chandra spectrum by up to –40% over the 0.5–30 keV energy range used in spectral fitting. According to Madsen et al. (2017), the Chandra calibration flux rises by up to 10%–15% above 4 keV compared to the NuSTAR flux. Thus, it is likely that the X-ray flux of OQ varied between 2014 and 2016 by up to %.
4. Discussion
Young radio sources have been proposed to be X-ray and -ray emitters based on theoretical considerations in which their high energy emission originates due to the inverse Compton scattering of ambient soft photon fields off energetic electrons injected into expanding lobes from the hot spots (e.g. Stawarz et al. 2008; Ostorero et al. 2010). A small sample of 16 CSOs has been observed and detected in the soft X-rays with Chandra and/or XMM-Newton (S16 and references therein), and Migliori et al. (2016) reported the detection of PKS 1718+654 in the -ray band with Fermi/LAT. Here, we presented new Chandra and NuSTAR observations of the young radio source OQ . The source was clearly detected with both instruments. The NuSTAR detection constitutes the first hard X-ray ( keV) detection of a CSO, and establishes CSOs as a new class of NuSTAR sources. We modeled the NuSTAR and Chandra data simultaneously, including also the archival XMM-Newton PN data set, assuming a model in which the direct power law X-ray emission interacts with the obscuring cold matter surrounding the central black hole through absorption, reflection, and scattering processes (Baloković et al. 2018).
4.1. Origin of the X-ray emission
The broad-band X-ray coverage of our observations enabled us to constrain the photon index of the primary X-ray emission from the source, and measure 0.5–30 keV (rest-frame) intrinsic luminosity of erg s-1. The photon index of is relatively hard compared to the photon indexes derived for XMM-Newton and NuSTAR detected AGN (e.g. Del Moro et al. 2017; Corral et al. 2011). It is, however, rather typical of the X-ray spectra from accreting black hole binaries in a hard jet-producing spectral state (e.g. Done, Gierliński & Kubota 2007; Remillard & McClintock 2006). Power-law X-ray emission with such a photon index could be produced e.g. in an accretion disk corona, expanding radio lobes, or relativistic jets. However, the observed level of X-ray emission is lower than the level of X-ray emission due to the inverse Compton scattering of the infra-red and ultra-violet photons off ultra-relativistic electrons in the radio lobes expected for this source (Ostorero et al. 2010, their Fig. 1, Appendix A.9). This could indicate that in the young radio lobes of OQ , the magnetic pressure dominates over the electron pressure, rather than remaining in rough equipartition with them as assumed in Stawarz et al. (2008). Detailed modeling of the broadband radio-to-hard-X-ray SED is beyond the scope of this work and will be addressed in the forthcoming publication.
Nonetheless, the bolometric luminosity of the source derived in Wójtowicz et al. (2019, in preparation) using the Richards et al. (2006) bolometric correction applied to the observed 12 m luminosity (Kosmaczewski et al. 2019) yields erg s-1. For the black hole mass of M⊙ (Wu 2009), and , this bolometric luminosity corresponds to the Eddington luminosity ratio of . However, the 2–10 keV X-ray luminosity expected from a radio loud AGN with a similar bolometric luminosity is of the order of erg s-1, based on the bolometric corrections obtained by Runnoe et al. (2012), i.e. an order of magnitude higher than the 2-10 keV luminosity resulting from our modeling of the X-ray spectrum of OQ (see Table 2). It is thus possible that the X-ray radiation mechanism of OQ+208 is less efficient than that of the quasars used by Runnoe et al. to derive the bolometric corrections, or the bolometric luminosity based on the 12 m luminosity is overestimated.
4.2. Properties of the X-ray absorber
Our observations allowed us to gain important insights into the nature of the intrinsic obscuration in OQ . We adopted the torus model of Baloković et al. (2018) and detected intrinsic absorption with the equivalent hydrogen column density of the order of 1023–1024 cm-2 due to cold matter surrounding the central black hole with a large covering factor. It seems plausible that the torus has a porous structure, given the good fit to the data of the model with the line-of-sight absorbing column and torus absorbing column varying freely and resulting in values that are statistically different from each other. This conclusion is further supported by the detection of a significant amount of the scattered primary emission dominating the soft X-ray spectrum below 4 keV. With a porous structure, the primary emission would undergo less attenuation as it could arrive to the observer through the holes in the torus. The optical classification as a broad-line QSO is also consistent with the porous structure of the torus obscuring an X-ray source seen from a direction typical to Type 2 QSO. Additionally, variable degree of the porosity of the obscurer could explain the % X-ray flux variability that the source appeared to undergo between our Chandra and NuSTAR observations.
Alternatively, OQ could belong to the so-called type-12 AGN class, optically un-obscured but X-ray obscured, in which the X-ray obscuration was argued to be produced by dust-free gas within (or inside) the broad line region (e.g. Merloni et al. 2014, and references therein). However, it was shown that majority of such AGN tend to have rather high X-ray luminosities compared to OQ (e.g. Merloni et al. 2014; Marchesi et al. 2016).
When modeling only the XMM-Newton data, Guainazzi et al. (2004) found that the emission feature around 6 keV (observer’s frame) can be modeled either as a single broad line with energy corresponding to the neutral Fe, or by a combination of three narrow lines, whose energies are consistent with neutral, He-like, and H-like Fe. Our modeling corresponds to the latter scenario (Baloković et al. 2018).
Moreover, we observed that the fluorescent iron line emission was enhanced relative to the strength of the associated Compton reflection continuum. This may indicate a significant departure of the Fe-K reflection region from the structure of our model, or alternatively suggest elevated iron abundance in the matter forming the torus. Importantly, 6.4 keV line emission from an extended hundred pc-scale region has been resolved in a few nearby galaxies (e.g. Fabbiano et al. 2018, 2019). Additionally, an enhanced line emission with spatially variable EW has been reported by Marrinucci et al. (2017). The spatial scales studied by these authors cannot be resolved in X-rays in our source, nor is the possible extended 6.4 keV emission accounted for by the existing torus models.
We did not find evidence for a diffuse X-ray component in OQ , contrary to the work of Lanz et al. (2016) based on the Chandra data alone. In fact, the combined Chandra, XMM-Newton, and NuSTAR observations show that their model (two thermal components and an absorbed power law) cannot account for the 6-7 keV Fe emission signature and the overall shape of the hard X-ray spectrum.
5. Conclusions
Our results indicate that in OQ the young year old radio lobes spanning the length of 10 pc coexist with a cold obscuring matter, possibly a dusty torus. The structure of the torus is likely porous, with high equivalent column density comparable to that detected in Compton thick AGN. The X-ray source is powered by accretion with a relatively high Eddington ratio of , and emits a rather hard power-law spectrum which might have increased in flux by % between our 2014 and 2016 observations. The X-ray emission is consistent with a point source based on the Chandra image, and it is not likely to originate from the young radio lobes, unless the lobes in OQ are dominated by the magnetic pressure.
References
- Arnaud et al. (1996) Arnaud, K.A., 1996, Astronomical Data Analysis Software and Systems V, eds. Jacoby G. and Barnes J., p17, ASP Conf. Series volume 101
- Baloković et al. (2018) Baloković, M., Brightman, M., Harrison, F. A., et al. 2018, ApJ, 854, 42
- Begelman & Cioffi (1989) Begelman, M. C., & Cioffi, D. F. 1989, ApJ, 345, L21
- Corral et al. (2011) Corral, A., Della Ceca, R., Caccianiga, A., et al. 2011, A&A, 530, A42
- Del Moro et al. (2017) Del Moro, A., Alexander, D. M., Aird, J. A., et al. 2017, ApJ, 849, 57
- Done et al. (2007) Done, C., Gierliński, M., & Kubota, A. 2007, A&A Rev., 15, 1
- Fabbiano et al. (2018) Fabbiano, G., Paggi, A., Siemiginowska, A., et al. 2018, ApJ, 869, L36
- Fabbiano et al. (2019) Fabbiano, G., Siemiginowska, A., Paggi, A., et al. 2019, ApJ, 870, 69
- Fruscione et al. (2006) Fruscione, A., et al. 2006, Proc. SPIE, 6270, 60
- Guainazzi et al. (2004) Guainazzi, M., Siemiginowska, A., Rodriguez-Pascual, P., & Stanghellini, C. 2004, A&A, 421, 461
- Harrison et al. (2013) Harrison, F. A., Craig, W. W., Christensen, F. E., et al. 2013, ApJ, 770, 103
- Heinz et al. (1998) Heinz, S., Reynolds, C. S., & Begelman, M. C. 1998, ApJ, 501, 126
- Hinshaw et al. (2013) Hinshaw, G., Larson, D., Komatsu, E., et al. 2013, ApJS, 208, 19
- Kosmaczewski et al. (2019) Kosmaczewski, E., Stawarz, L., Wójtowicz, A., et al. 2019, ApJ, submitted
- Lanz et al. (2016) Lanz, L., Ogle, P. M., Alatalo, K., & Appleton, P. N. 2016, ApJ, 826, 29
- Madsen et al. (2017) Madsen, K. K., Beardmore, A. P., Forster, K., et al. 2017, AJ, 153, 2
- Marchesi et al. (2016) Marchesi, S., Lanzuisi, G., Civano, F., et al. 2016, ApJ, 830, 100
- Marinucci et al. (2017) Marinucci, A., Bianchi, S., Fabbiano, G., et al. 2017, MNRAS, 470, 4039
- Merloni et al. (2014) Merloni, A., Bongiorno, A., Brusa, M., et al. 2014, MNRAS, 437, 3550
- Migliori et al. (2014) Migliori, G., Siemiginowska, A., Kelly, B. C., et al. 2014, ApJ, 780, 165
- Migliori et al. (2016) Migliori, G., Siemiginowska, A., Sobolewska, M., et al. 2016, ApJ, 821, L31
- Netzer (2009) Netzer, H. 2009, ApJ, 695, 793
- Ostorero et al. (2010) Ostorero, L., Moderski, R., Stawarz, Ł., et al. 2010, ApJ, 715, 1071
- Remillard & McClintock (2006) Remillard, R. A., & McClintock, J. E. 2006, ARA&A, 44, 49
- Reynolds et al. (2001) Reynolds, C. S., Heinz, S., & Begelman, M. C. 2001, ApJ, 549, L179
- Runnoe et al. (2012) Runnoe, J. C., Brotherton, M. S., & Shang, Z. 2012, MNRAS, 426, 2677
- Siemiginowska et al. (2008) Siemiginowska, A., LaMassa, S., Aldcroft, T. L., Bechtold, J., & Elvis, M. 2008, ApJ, 684, 811
- Siemiginowska (2009) Siemiginowska, A. 2009, Astronomische Nachrichten, 330, 264
- Siemiginowska et al. (2016) Siemiginowska, A., Sobolewska, M., Migliori, G., et al. 2016, ApJ, 823, 57 (S16)
- Sobolewska et al. (2019) Sobolewska, M., Siemiginowska, A., Guainazzi, M., et al. 2019, ApJ, 871, 71
- Stanghellini et al. (1993) Stanghellini, C., O’Dea, C. P., Baum, S. A., & Laurikainen, E. 1993, ApJS, 88, 1
- Stanghellini et al. (1997) Stanghellini, C., O’Dea, C. P., Baum, S. A., Dallacasa, D., Fanti, R., & Fanti, C. 1997, A&A, 325, 943
- Stanghellini et al. (1997a) Stanghellini, C., Bondi, M., Dallacasa, D., et al. 1997, A&A, 318, 376
- Stawarz et al. (2008) Stawarz, Ł., Ostorero, L., Begelman, M. C., et al. 2008, ApJ, 680, 911
- Tengstrand et al. (2009) Tengstrand, O., Guainazzi, M., Siemiginowska, A., et al. 2009, A&A, 501, 89
- Wagner et al. (2012) Wagner, A. Y., Bicknell, G. V., & Umemura, M. 2012, ApJ, 757, 136
- Wu (2009) Wu, Q. W. 2009, ApJ, 701, L95
- Wu et al. (2013) Wu, F., An, T., Baan, W. A., et al. 2013, A&A, 550, A113